Project
Illumina Body Map 2: averaged replicates
Navigation
Downloads
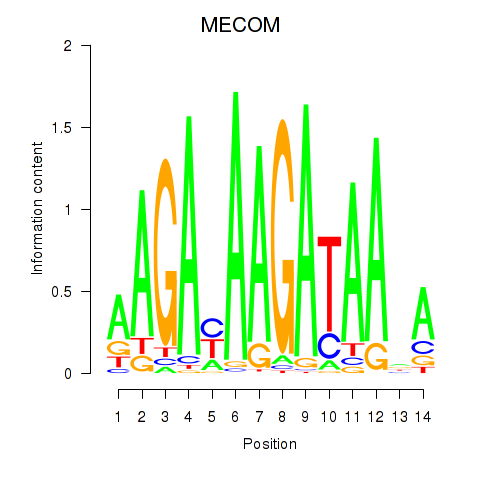
Results for MECOM
Z-value: 1.35
Motif logo
Transcription factors associated with MECOM
| Gene Symbol | Gene ID | Gene Info |
|---|---|---|
|
MECOM
|
ENSG00000085276.13 | MDS1 and EVI1 complex locus |
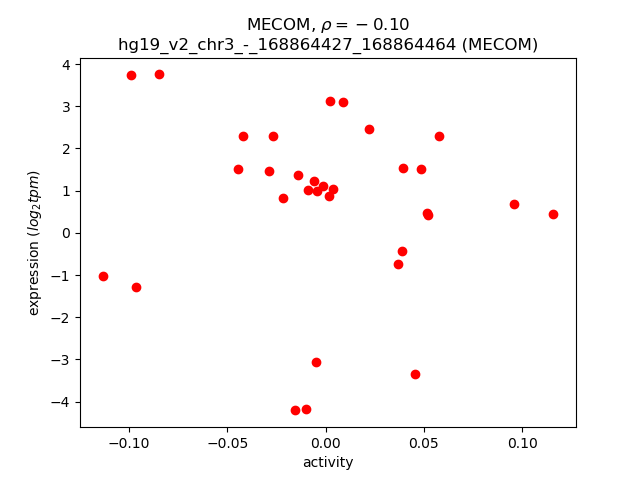
Activity-expression correlation:
| Gene | Promoter | Pearson corr. coef. | P-value | Plot |
|---|---|---|---|---|
| MECOM | hg19_v2_chr3_-_168864427_168864464 | -0.10 | 6.0e-01 | Click! |
Activity profile of MECOM motif
Sorted Z-values of MECOM motif
| Promoter | Log-likelihood | Transcript | Gene | Gene Info |
|---|---|---|---|---|
| chr18_-_24722995 | 1.80 |
ENST00000581714.1
|
CHST9
|
carbohydrate (N-acetylgalactosamine 4-0) sulfotransferase 9 |
| chr12_-_86650154 | 1.68 |
ENST00000552435.2
|
MGAT4C
|
mannosyl (alpha-1,3-)-glycoprotein beta-1,4-N-acetylglucosaminyltransferase, isozyme C (putative) |
| chr12_-_86650045 | 1.68 |
ENST00000604798.1
|
MGAT4C
|
mannosyl (alpha-1,3-)-glycoprotein beta-1,4-N-acetylglucosaminyltransferase, isozyme C (putative) |
| chr10_-_21186144 | 1.56 |
ENST00000377119.1
|
NEBL
|
nebulette |
| chr7_+_35756092 | 1.45 |
ENST00000458087.3
|
AC018647.3
|
AC018647.3 |
| chr7_+_35756186 | 1.43 |
ENST00000430518.1
|
AC018647.3
|
AC018647.3 |
| chr3_-_178103144 | 1.39 |
ENST00000417383.1
ENST00000418585.1 ENST00000411727.1 ENST00000439810.1 |
RP11-33A14.1
|
RP11-33A14.1 |
| chr1_+_74701062 | 1.37 |
ENST00000326637.3
|
TNNI3K
|
TNNI3 interacting kinase |
| chr12_-_86650077 | 1.32 |
ENST00000552808.2
ENST00000547225.1 |
MGAT4C
|
mannosyl (alpha-1,3-)-glycoprotein beta-1,4-N-acetylglucosaminyltransferase, isozyme C (putative) |
| chr1_+_172422026 | 1.26 |
ENST00000367725.4
|
C1orf105
|
chromosome 1 open reading frame 105 |
| chr1_+_109102652 | 1.19 |
ENST00000370035.3
ENST00000405454.1 |
FAM102B
|
family with sequence similarity 102, member B |
| chr5_-_96209315 | 1.11 |
ENST00000504056.1
|
CTD-2260A17.2
|
Uncharacterized protein |
| chr13_-_103053946 | 1.10 |
ENST00000376131.4
|
FGF14
|
fibroblast growth factor 14 |
| chr15_-_64673630 | 1.10 |
ENST00000558008.1
ENST00000559519.1 ENST00000380258.2 |
KIAA0101
|
KIAA0101 |
| chr16_-_27899478 | 1.07 |
ENST00000380897.3
|
GSG1L
|
GSG1-like |
| chr12_+_20848377 | 1.07 |
ENST00000540354.1
ENST00000266509.2 ENST00000381552.1 |
SLCO1C1
|
solute carrier organic anion transporter family, member 1C1 |
| chr4_-_88449771 | 1.04 |
ENST00000535835.1
|
SPARCL1
|
SPARC-like 1 (hevin) |
| chr1_+_86934526 | 1.01 |
ENST00000394711.1
|
CLCA1
|
chloride channel accessory 1 |
| chr8_-_27115903 | 0.98 |
ENST00000350889.4
ENST00000519997.1 ENST00000519614.1 ENST00000522908.1 ENST00000265770.7 |
STMN4
|
stathmin-like 4 |
| chr7_+_97361388 | 0.95 |
ENST00000350485.4
ENST00000346867.4 |
TAC1
|
tachykinin, precursor 1 |
| chr9_+_109213096 | 0.94 |
ENST00000425709.1
|
RP11-308N19.1
|
RP11-308N19.1 |
| chr1_-_157811588 | 0.94 |
ENST00000368174.4
|
CD5L
|
CD5 molecule-like |
| chr15_-_37392086 | 0.93 |
ENST00000561208.1
|
MEIS2
|
Meis homeobox 2 |
| chr5_-_11903337 | 0.93 |
ENST00000502551.1
|
CTNND2
|
catenin (cadherin-associated protein), delta 2 |
| chr10_-_69455873 | 0.92 |
ENST00000433211.2
|
CTNNA3
|
catenin (cadherin-associated protein), alpha 3 |
| chr6_+_29624898 | 0.90 |
ENST00000396704.3
ENST00000483013.1 ENST00000490427.1 ENST00000416766.2 ENST00000376891.4 ENST00000376898.3 ENST00000396701.2 ENST00000494692.1 ENST00000431798.2 |
MOG
|
myelin oligodendrocyte glycoprotein |
| chr6_+_69942298 | 0.89 |
ENST00000238918.8
|
BAI3
|
brain-specific angiogenesis inhibitor 3 |
| chr8_-_38008783 | 0.88 |
ENST00000276449.4
|
STAR
|
steroidogenic acute regulatory protein |
| chr3_-_167371740 | 0.87 |
ENST00000466760.1
ENST00000479765.1 |
WDR49
|
WD repeat domain 49 |
| chr10_-_50122277 | 0.84 |
ENST00000374160.3
|
LRRC18
|
leucine rich repeat containing 18 |
| chr15_-_79103757 | 0.83 |
ENST00000388820.4
|
ADAMTS7
|
ADAM metallopeptidase with thrombospondin type 1 motif, 7 |
| chr1_+_50569575 | 0.79 |
ENST00000371827.1
|
ELAVL4
|
ELAV like neuron-specific RNA binding protein 4 |
| chr6_+_44310376 | 0.78 |
ENST00000515220.1
ENST00000323108.8 |
SPATS1
|
spermatogenesis associated, serine-rich 1 |
| chr2_-_145275211 | 0.77 |
ENST00000462355.1
|
ZEB2
|
zinc finger E-box binding homeobox 2 |
| chr11_+_44748361 | 0.77 |
ENST00000533202.1
ENST00000533080.1 ENST00000520358.2 ENST00000520999.2 |
TSPAN18
|
tetraspanin 18 |
| chr12_+_106976678 | 0.76 |
ENST00000392842.1
|
RFX4
|
regulatory factor X, 4 (influences HLA class II expression) |
| chr8_-_27115931 | 0.76 |
ENST00000523048.1
|
STMN4
|
stathmin-like 4 |
| chr20_+_32782375 | 0.74 |
ENST00000568305.1
|
ASIP
|
agouti signaling protein |
| chr3_+_152552685 | 0.72 |
ENST00000305097.3
|
P2RY1
|
purinergic receptor P2Y, G-protein coupled, 1 |
| chr1_-_161193349 | 0.72 |
ENST00000469730.2
ENST00000463273.1 ENST00000464492.1 ENST00000367990.3 ENST00000470459.2 ENST00000468465.1 ENST00000463812.1 |
APOA2
|
apolipoprotein A-II |
| chr12_-_21556577 | 0.71 |
ENST00000450590.1
ENST00000453443.1 |
SLCO1A2
|
solute carrier organic anion transporter family, member 1A2 |
| chr5_+_118965244 | 0.71 |
ENST00000515256.1
ENST00000509264.1 |
FAM170A
|
family with sequence similarity 170, member A |
| chr12_+_12202785 | 0.71 |
ENST00000586576.1
ENST00000464885.2 |
BCL2L14
|
BCL2-like 14 (apoptosis facilitator) |
| chr15_-_37391507 | 0.71 |
ENST00000557796.2
ENST00000397620.2 |
MEIS2
|
Meis homeobox 2 |
| chr18_-_22931103 | 0.70 |
ENST00000577461.1
|
ZNF521
|
zinc finger protein 521 |
| chr12_+_20848282 | 0.69 |
ENST00000545604.1
|
SLCO1C1
|
solute carrier organic anion transporter family, member 1C1 |
| chr1_+_214163033 | 0.68 |
ENST00000607425.1
|
PROX1
|
prospero homeobox 1 |
| chr17_+_53344945 | 0.66 |
ENST00000575345.1
|
HLF
|
hepatic leukemia factor |
| chr2_-_145275109 | 0.66 |
ENST00000431672.2
|
ZEB2
|
zinc finger E-box binding homeobox 2 |
| chr6_+_44310421 | 0.65 |
ENST00000288390.2
|
SPATS1
|
spermatogenesis associated, serine-rich 1 |
| chr1_-_68962782 | 0.63 |
ENST00000456315.2
|
DEPDC1
|
DEP domain containing 1 |
| chr19_-_14316980 | 0.63 |
ENST00000361434.3
ENST00000340736.6 |
LPHN1
|
latrophilin 1 |
| chr8_-_122653630 | 0.63 |
ENST00000303924.4
|
HAS2
|
hyaluronan synthase 2 |
| chr7_-_8302164 | 0.62 |
ENST00000447326.1
ENST00000406470.2 |
ICA1
|
islet cell autoantigen 1, 69kDa |
| chr17_-_37308824 | 0.61 |
ENST00000415163.1
ENST00000441877.1 ENST00000444911.2 |
PLXDC1
|
plexin domain containing 1 |
| chr1_-_68962805 | 0.61 |
ENST00000370966.5
|
DEPDC1
|
DEP domain containing 1 |
| chr7_+_73275483 | 0.61 |
ENST00000320531.2
|
WBSCR28
|
Williams-Beuren syndrome chromosome region 28 |
| chr2_-_39456673 | 0.60 |
ENST00000378803.1
ENST00000395035.3 |
CDKL4
|
cyclin-dependent kinase-like 4 |
| chr4_-_88450372 | 0.60 |
ENST00000543631.1
|
SPARCL1
|
SPARC-like 1 (hevin) |
| chr9_+_127023704 | 0.60 |
ENST00000373596.1
ENST00000425237.1 |
NEK6
|
NIMA-related kinase 6 |
| chr17_-_29648761 | 0.60 |
ENST00000247270.3
ENST00000462804.2 |
EVI2A
|
ecotropic viral integration site 2A |
| chr15_-_83837983 | 0.59 |
ENST00000562702.1
|
HDGFRP3
|
Hepatoma-derived growth factor-related protein 3 |
| chr12_+_20848486 | 0.59 |
ENST00000545102.1
|
SLCO1C1
|
solute carrier organic anion transporter family, member 1C1 |
| chr17_-_66951474 | 0.59 |
ENST00000269080.2
|
ABCA8
|
ATP-binding cassette, sub-family A (ABC1), member 8 |
| chr1_-_110155671 | 0.59 |
ENST00000351050.3
|
GNAT2
|
guanine nucleotide binding protein (G protein), alpha transducing activity polypeptide 2 |
| chr6_-_31514516 | 0.58 |
ENST00000303892.5
ENST00000483251.1 |
ATP6V1G2
|
ATPase, H+ transporting, lysosomal 13kDa, V1 subunit G2 |
| chr5_-_83016632 | 0.58 |
ENST00000515590.1
|
HAPLN1
|
hyaluronan and proteoglycan link protein 1 |
| chr1_-_232651312 | 0.57 |
ENST00000262861.4
|
SIPA1L2
|
signal-induced proliferation-associated 1 like 2 |
| chr5_-_127674883 | 0.57 |
ENST00000507835.1
|
FBN2
|
fibrillin 2 |
| chr15_+_71185148 | 0.57 |
ENST00000443425.2
ENST00000560755.1 |
LRRC49
|
leucine rich repeat containing 49 |
| chr11_+_5775923 | 0.57 |
ENST00000317254.3
|
OR52N4
|
olfactory receptor, family 52, subfamily N, member 4 (gene/pseudogene) |
| chrX_-_49965663 | 0.57 |
ENST00000376056.2
ENST00000376058.2 ENST00000358526.2 |
AKAP4
|
A kinase (PRKA) anchor protein 4 |
| chr7_-_6006768 | 0.56 |
ENST00000441023.2
|
RSPH10B
|
radial spoke head 10 homolog B (Chlamydomonas) |
| chr4_-_88450244 | 0.55 |
ENST00000503414.1
|
SPARCL1
|
SPARC-like 1 (hevin) |
| chr3_-_145968900 | 0.54 |
ENST00000460350.1
|
PLSCR4
|
phospholipid scramblase 4 |
| chr4_-_74847800 | 0.53 |
ENST00000296029.3
|
PF4
|
platelet factor 4 |
| chr11_-_126810521 | 0.53 |
ENST00000530572.1
|
RP11-688I9.4
|
RP11-688I9.4 |
| chr1_-_146696901 | 0.52 |
ENST00000369272.3
ENST00000441068.2 |
FMO5
|
flavin containing monooxygenase 5 |
| chrX_-_101694853 | 0.52 |
ENST00000372749.1
|
NXF2B
|
nuclear RNA export factor 2B |
| chr17_-_66951382 | 0.52 |
ENST00000586539.1
|
ABCA8
|
ATP-binding cassette, sub-family A (ABC1), member 8 |
| chr13_+_49280951 | 0.52 |
ENST00000282018.3
|
CYSLTR2
|
cysteinyl leukotriene receptor 2 |
| chr16_+_2867228 | 0.52 |
ENST00000005995.3
ENST00000574813.1 |
PRSS21
|
protease, serine, 21 (testisin) |
| chr4_-_185303418 | 0.52 |
ENST00000610223.1
ENST00000608785.1 |
RP11-290F5.1
|
RP11-290F5.1 |
| chr7_-_6007070 | 0.52 |
ENST00000337579.3
|
RSPH10B
|
radial spoke head 10 homolog B (Chlamydomonas) |
| chr15_+_71839566 | 0.51 |
ENST00000357769.4
|
THSD4
|
thrombospondin, type I, domain containing 4 |
| chr14_-_25479811 | 0.51 |
ENST00000550887.1
|
STXBP6
|
syntaxin binding protein 6 (amisyn) |
| chr11_+_60145997 | 0.51 |
ENST00000530614.1
ENST00000530027.1 ENST00000530234.2 ENST00000528215.1 ENST00000531787.1 |
MS4A7
MS4A14
|
membrane-spanning 4-domains, subfamily A, member 7 membrane-spanning 4-domains, subfamily A, member 14 |
| chr12_+_57522439 | 0.51 |
ENST00000338962.4
|
LRP1
|
low density lipoprotein receptor-related protein 1 |
| chr13_+_102142296 | 0.51 |
ENST00000376162.3
|
ITGBL1
|
integrin, beta-like 1 (with EGF-like repeat domains) |
| chr1_+_82266053 | 0.51 |
ENST00000370715.1
ENST00000370713.1 ENST00000319517.6 ENST00000370717.2 ENST00000394879.1 ENST00000271029.4 ENST00000335786.5 |
LPHN2
|
latrophilin 2 |
| chr7_+_35756066 | 0.50 |
ENST00000449644.1
|
AC018647.3
|
AC018647.3 |
| chr12_+_12202774 | 0.50 |
ENST00000589718.1
|
BCL2L14
|
BCL2-like 14 (apoptosis facilitator) |
| chr3_+_119013185 | 0.49 |
ENST00000264245.4
|
ARHGAP31
|
Rho GTPase activating protein 31 |
| chr15_-_30686052 | 0.49 |
ENST00000562729.1
|
CHRFAM7A
|
CHRNA7 (cholinergic receptor, nicotinic, alpha 7, exons 5-10) and FAM7A (family with sequence similarity 7A, exons A-E) fusion |
| chr7_+_17338239 | 0.49 |
ENST00000242057.4
|
AHR
|
aryl hydrocarbon receptor |
| chr19_+_48497901 | 0.49 |
ENST00000339841.2
|
ELSPBP1
|
epididymal sperm binding protein 1 |
| chr19_+_48497962 | 0.49 |
ENST00000596043.1
ENST00000597519.1 |
ELSPBP1
|
epididymal sperm binding protein 1 |
| chr9_-_112970436 | 0.48 |
ENST00000400613.4
|
C9orf152
|
chromosome 9 open reading frame 152 |
| chr3_-_145968857 | 0.48 |
ENST00000433593.2
ENST00000476202.1 ENST00000460885.1 |
PLSCR4
|
phospholipid scramblase 4 |
| chr8_-_133637624 | 0.48 |
ENST00000522789.1
|
LRRC6
|
leucine rich repeat containing 6 |
| chr3_-_145968923 | 0.48 |
ENST00000493382.1
ENST00000354952.2 ENST00000383083.2 |
PLSCR4
|
phospholipid scramblase 4 |
| chrX_+_101502170 | 0.48 |
ENST00000372757.1
|
NXF2
|
nuclear RNA export factor 2 |
| chr15_-_30261066 | 0.47 |
ENST00000558447.1
|
TJP1
|
tight junction protein 1 |
| chr8_+_110374683 | 0.46 |
ENST00000378402.5
|
PKHD1L1
|
polycystic kidney and hepatic disease 1 (autosomal recessive)-like 1 |
| chr3_-_193272874 | 0.46 |
ENST00000342695.4
|
ATP13A4
|
ATPase type 13A4 |
| chr7_+_6797288 | 0.46 |
ENST00000433859.2
ENST00000359718.3 |
RSPH10B2
|
radial spoke head 10 homolog B2 (Chlamydomonas) |
| chr7_-_8302298 | 0.45 |
ENST00000446305.1
|
ICA1
|
islet cell autoantigen 1, 69kDa |
| chrY_+_15418467 | 0.45 |
ENST00000595988.1
|
AC010877.1
|
Uncharacterized protein |
| chr15_-_48470558 | 0.45 |
ENST00000324324.7
|
MYEF2
|
myelin expression factor 2 |
| chr1_-_91182794 | 0.44 |
ENST00000370445.4
|
BARHL2
|
BarH-like homeobox 2 |
| chrX_+_86772787 | 0.44 |
ENST00000373114.4
|
KLHL4
|
kelch-like family member 4 |
| chr12_+_7169887 | 0.43 |
ENST00000542978.1
|
C1S
|
complement component 1, s subcomponent |
| chrX_+_30261847 | 0.43 |
ENST00000378981.3
ENST00000397550.1 |
MAGEB1
|
melanoma antigen family B, 1 |
| chr9_-_13175823 | 0.43 |
ENST00000545857.1
|
MPDZ
|
multiple PDZ domain protein |
| chr16_+_33204156 | 0.43 |
ENST00000398667.4
|
TP53TG3C
|
TP53 target 3C |
| chrX_-_43741594 | 0.42 |
ENST00000536181.1
ENST00000378069.4 |
MAOB
|
monoamine oxidase B |
| chr5_+_171621176 | 0.42 |
ENST00000398186.4
|
EFCAB9
|
EF-hand calcium binding domain 9 |
| chr7_-_8302207 | 0.42 |
ENST00000407906.1
|
ICA1
|
islet cell autoantigen 1, 69kDa |
| chr2_+_97779233 | 0.42 |
ENST00000461153.2
ENST00000420699.2 |
ANKRD36
|
ankyrin repeat domain 36 |
| chr1_+_3668962 | 0.42 |
ENST00000294600.2
|
CCDC27
|
coiled-coil domain containing 27 |
| chr5_+_167956121 | 0.42 |
ENST00000338333.4
|
FBLL1
|
fibrillarin-like 1 |
| chr10_+_29577974 | 0.42 |
ENST00000375500.3
|
LYZL1
|
lysozyme-like 1 |
| chr8_-_114449112 | 0.41 |
ENST00000455883.2
ENST00000352409.3 ENST00000297405.5 |
CSMD3
|
CUB and Sushi multiple domains 3 |
| chr15_-_48470544 | 0.40 |
ENST00000267836.6
|
MYEF2
|
myelin expression factor 2 |
| chr2_-_145275828 | 0.40 |
ENST00000392861.2
ENST00000409211.1 |
ZEB2
|
zinc finger E-box binding homeobox 2 |
| chr17_-_37309480 | 0.40 |
ENST00000539608.1
|
PLXDC1
|
plexin domain containing 1 |
| chr1_-_85156417 | 0.40 |
ENST00000422026.1
|
SSX2IP
|
synovial sarcoma, X breakpoint 2 interacting protein |
| chr17_+_53345080 | 0.39 |
ENST00000572002.1
|
HLF
|
hepatic leukemia factor |
| chr4_+_189060573 | 0.39 |
ENST00000332517.3
|
TRIML1
|
tripartite motif family-like 1 |
| chr4_+_71200681 | 0.38 |
ENST00000273936.5
|
CABS1
|
calcium-binding protein, spermatid-specific 1 |
| chr3_+_57875711 | 0.38 |
ENST00000442599.2
|
SLMAP
|
sarcolemma associated protein |
| chr7_+_6796986 | 0.38 |
ENST00000297186.3
|
RSPH10B2
|
radial spoke head 10 homolog B2 (Chlamydomonas) |
| chr2_-_224467093 | 0.38 |
ENST00000305409.2
|
SCG2
|
secretogranin II |
| chr1_-_157069590 | 0.38 |
ENST00000454449.2
|
ETV3L
|
ets variant 3-like |
| chr12_-_85430024 | 0.37 |
ENST00000547836.1
ENST00000532498.2 |
TSPAN19
|
tetraspanin 19 |
| chr5_+_140739537 | 0.37 |
ENST00000522605.1
|
PCDHGB2
|
protocadherin gamma subfamily B, 2 |
| chr16_+_14280564 | 0.37 |
ENST00000572567.1
|
MKL2
|
MKL/myocardin-like 2 |
| chr16_+_9449445 | 0.37 |
ENST00000564305.1
|
RP11-243A14.1
|
RP11-243A14.1 |
| chr3_-_119379427 | 0.36 |
ENST00000264231.3
ENST00000468801.1 ENST00000538678.1 |
POPDC2
|
popeye domain containing 2 |
| chr2_+_44066101 | 0.36 |
ENST00000272286.2
|
ABCG8
|
ATP-binding cassette, sub-family G (WHITE), member 8 |
| chr11_+_17316870 | 0.36 |
ENST00000458064.2
|
NUCB2
|
nucleobindin 2 |
| chr16_-_80673633 | 0.36 |
ENST00000561616.1
|
CDYL2
|
chromodomain protein, Y-like 2 |
| chr17_-_56494882 | 0.36 |
ENST00000584437.1
|
RNF43
|
ring finger protein 43 |
| chr7_-_121944491 | 0.35 |
ENST00000331178.4
ENST00000427185.2 ENST00000442488.2 |
FEZF1
|
FEZ family zinc finger 1 |
| chrX_-_62974941 | 0.35 |
ENST00000374872.1
ENST00000253401.6 ENST00000374870.4 |
ARHGEF9
|
Cdc42 guanine nucleotide exchange factor (GEF) 9 |
| chr6_-_56492816 | 0.35 |
ENST00000522360.1
|
DST
|
dystonin |
| chr14_+_29236269 | 0.35 |
ENST00000313071.4
|
FOXG1
|
forkhead box G1 |
| chr18_-_67624160 | 0.34 |
ENST00000581982.1
ENST00000280200.4 |
CD226
|
CD226 molecule |
| chr5_+_121465234 | 0.34 |
ENST00000504912.1
ENST00000505843.1 |
ZNF474
|
zinc finger protein 474 |
| chr7_-_112726393 | 0.33 |
ENST00000449591.1
ENST00000449735.1 ENST00000438062.1 ENST00000424100.1 |
GPR85
|
G protein-coupled receptor 85 |
| chr6_+_89674246 | 0.33 |
ENST00000369474.1
|
AL079342.1
|
Uncharacterized protein; cDNA FLJ27030 fis, clone SLV07741 |
| chr19_+_15121532 | 0.33 |
ENST00000292574.3
|
CCDC105
|
coiled-coil domain containing 105 |
| chr12_-_81763184 | 0.33 |
ENST00000548670.1
ENST00000541570.2 ENST00000553058.1 |
PPFIA2
|
protein tyrosine phosphatase, receptor type, f polypeptide (PTPRF), interacting protein (liprin), alpha 2 |
| chr19_-_53632912 | 0.32 |
ENST00000601215.1
|
ZNF415
|
zinc finger protein 415 |
| chr5_-_115910091 | 0.32 |
ENST00000257414.8
|
SEMA6A
|
sema domain, transmembrane domain (TM), and cytoplasmic domain, (semaphorin) 6A |
| chr5_+_20616500 | 0.32 |
ENST00000512688.1
|
RP11-774D14.1
|
RP11-774D14.1 |
| chr12_-_81763127 | 0.32 |
ENST00000541017.1
|
PPFIA2
|
protein tyrosine phosphatase, receptor type, f polypeptide (PTPRF), interacting protein (liprin), alpha 2 |
| chr6_+_46714654 | 0.31 |
ENST00000565422.1
|
ANKRD66
|
ankyrin repeat domain 66 |
| chr2_-_56150910 | 0.31 |
ENST00000424836.2
ENST00000438672.1 ENST00000440439.1 ENST00000429909.1 ENST00000424207.1 ENST00000452337.1 ENST00000355426.3 ENST00000439193.1 ENST00000421664.1 |
EFEMP1
|
EGF containing fibulin-like extracellular matrix protein 1 |
| chr10_+_78078088 | 0.30 |
ENST00000496424.2
|
C10orf11
|
chromosome 10 open reading frame 11 |
| chr6_+_46714680 | 0.30 |
ENST00000536046.1
|
ANKRD66
|
ankyrin repeat domain 66 |
| chr17_-_56494908 | 0.30 |
ENST00000577716.1
|
RNF43
|
ring finger protein 43 |
| chr15_+_100348193 | 0.30 |
ENST00000558188.1
|
CTD-2054N24.2
|
Uncharacterized protein |
| chr3_-_193272741 | 0.30 |
ENST00000392443.3
|
ATP13A4
|
ATPase type 13A4 |
| chr9_+_82186682 | 0.30 |
ENST00000376552.2
|
TLE4
|
transducin-like enhancer of split 4 (E(sp1) homolog, Drosophila) |
| chr7_-_15601595 | 0.30 |
ENST00000342526.3
|
AGMO
|
alkylglycerol monooxygenase |
| chr8_-_6420565 | 0.30 |
ENST00000338312.6
|
ANGPT2
|
angiopoietin 2 |
| chr1_+_209859510 | 0.30 |
ENST00000367028.2
ENST00000261465.1 |
HSD11B1
|
hydroxysteroid (11-beta) dehydrogenase 1 |
| chr1_-_104238574 | 0.30 |
ENST00000425410.1
|
AMY1B
|
amylase, alpha 1B (salivary) |
| chr1_-_68962744 | 0.29 |
ENST00000525124.1
|
DEPDC1
|
DEP domain containing 1 |
| chr12_-_95945246 | 0.29 |
ENST00000258499.3
|
USP44
|
ubiquitin specific peptidase 44 |
| chr12_+_85430110 | 0.29 |
ENST00000393212.3
ENST00000393217.2 |
LRRIQ1
|
leucine-rich repeats and IQ motif containing 1 |
| chr11_+_61008514 | 0.29 |
ENST00000312403.5
|
PGA5
|
pepsinogen 5, group I (pepsinogen A) |
| chr6_-_49917157 | 0.29 |
ENST00000398721.2
|
DEFB133
|
defensin, beta 133 |
| chr2_+_172543919 | 0.29 |
ENST00000452242.1
ENST00000340296.4 |
DYNC1I2
|
dynein, cytoplasmic 1, intermediate chain 2 |
| chr12_-_129570545 | 0.29 |
ENST00000389441.4
|
TMEM132D
|
transmembrane protein 132D |
| chr6_+_49431073 | 0.29 |
ENST00000335783.3
|
CENPQ
|
centromere protein Q |
| chr2_+_172543967 | 0.28 |
ENST00000534253.2
ENST00000263811.4 ENST00000397119.3 ENST00000410079.3 ENST00000438879.1 |
DYNC1I2
|
dynein, cytoplasmic 1, intermediate chain 2 |
| chr20_-_52645231 | 0.28 |
ENST00000448484.1
|
BCAS1
|
breast carcinoma amplified sequence 1 |
| chr12_+_96588368 | 0.28 |
ENST00000547860.1
|
ELK3
|
ELK3, ETS-domain protein (SRF accessory protein 2) |
| chr2_-_1629176 | 0.28 |
ENST00000366424.2
|
AC144450.2
|
AC144450.2 |
| chr2_-_145275228 | 0.27 |
ENST00000427902.1
ENST00000409487.3 ENST00000470879.1 ENST00000435831.1 |
ZEB2
|
zinc finger E-box binding homeobox 2 |
| chr12_+_57522258 | 0.27 |
ENST00000553277.1
ENST00000243077.3 |
LRP1
|
low density lipoprotein receptor-related protein 1 |
| chr8_+_72740402 | 0.27 |
ENST00000521467.1
|
RP11-383H13.1
|
Protein LOC100132891; cDNA FLJ53548 |
| chr11_-_94965667 | 0.27 |
ENST00000542176.1
ENST00000278499.2 |
SESN3
|
sestrin 3 |
| chr12_-_24097236 | 0.27 |
ENST00000538083.1
|
SOX5
|
SRY (sex determining region Y)-box 5 |
| chr5_-_171404730 | 0.27 |
ENST00000518752.1
|
FBXW11
|
F-box and WD repeat domain containing 11 |
| chr11_-_104769141 | 0.26 |
ENST00000508062.1
ENST00000422698.2 |
CASP12
|
caspase 12 (gene/pseudogene) |
| chr2_+_172544294 | 0.26 |
ENST00000358002.6
ENST00000435234.1 ENST00000443458.1 ENST00000412370.1 |
DYNC1I2
|
dynein, cytoplasmic 1, intermediate chain 2 |
| chr4_-_76944621 | 0.26 |
ENST00000306602.1
|
CXCL10
|
chemokine (C-X-C motif) ligand 10 |
| chr7_-_30008849 | 0.26 |
ENST00000409497.1
|
SCRN1
|
secernin 1 |
| chr12_+_57522692 | 0.26 |
ENST00000554174.1
|
LRP1
|
low density lipoprotein receptor-related protein 1 |
| chr12_+_41831485 | 0.25 |
ENST00000539469.2
ENST00000298919.7 |
PDZRN4
|
PDZ domain containing ring finger 4 |
| chr3_-_119379719 | 0.25 |
ENST00000493094.1
|
POPDC2
|
popeye domain containing 2 |
| chr14_-_102701740 | 0.25 |
ENST00000561150.1
ENST00000522867.1 |
MOK
|
MOK protein kinase |
| chr8_-_39695719 | 0.25 |
ENST00000347580.4
ENST00000379853.2 ENST00000521880.1 |
ADAM2
|
ADAM metallopeptidase domain 2 |
| chr19_-_35981358 | 0.25 |
ENST00000484218.2
ENST00000338897.3 |
KRTDAP
|
keratinocyte differentiation-associated protein |
| chr3_-_149093499 | 0.25 |
ENST00000472441.1
|
TM4SF1
|
transmembrane 4 L six family member 1 |
| chr8_+_58658679 | 0.24 |
ENST00000518934.1
|
CTD-2339F6.1
|
CTD-2339F6.1 |
| chr9_+_82186872 | 0.24 |
ENST00000376544.3
ENST00000376520.4 |
TLE4
|
transducin-like enhancer of split 4 (E(sp1) homolog, Drosophila) |
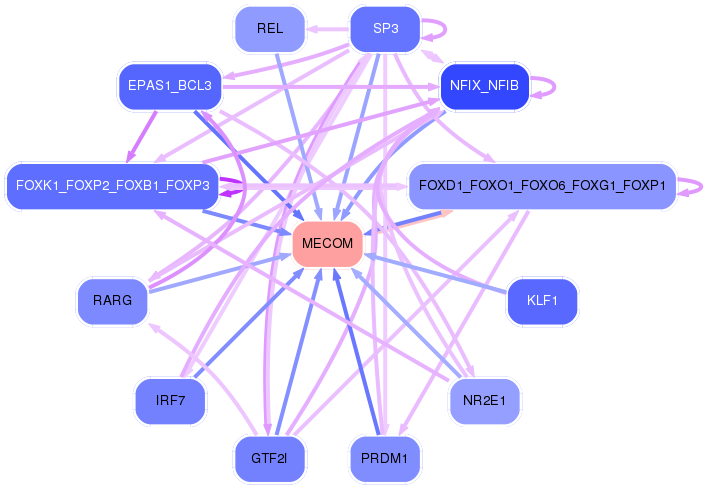
Network of associatons between targets according to the STRING database.

First level regulatory network of MECOM
Gene Ontology Analysis
Gene overrepresentation in biological_process category:
| Log-likelihood per target | Total log-likelihood | Term | Description |
|---|---|---|---|
| 0.3 | 0.9 | GO:2000854 | positive regulation of corticosterone secretion(GO:2000854) |
| 0.2 | 0.7 | GO:0060621 | negative regulation of cholesterol import(GO:0060621) negative regulation of sterol import(GO:2000910) |
| 0.2 | 2.1 | GO:1902748 | positive regulation of lens fiber cell differentiation(GO:1902748) |
| 0.2 | 0.7 | GO:2000979 | hepatocyte cell migration(GO:0002194) otic placode formation(GO:0043049) branching involved in pancreas morphogenesis(GO:0061114) acinar cell differentiation(GO:0090425) positive regulation of forebrain neuron differentiation(GO:2000979) |
| 0.2 | 0.9 | GO:0018963 | insecticide metabolic process(GO:0017143) phthalate metabolic process(GO:0018963) |
| 0.2 | 1.0 | GO:1905167 | positive regulation of lysosomal protein catabolic process(GO:1905167) |
| 0.2 | 2.4 | GO:0070327 | thyroid hormone transport(GO:0070327) |
| 0.2 | 0.6 | GO:0045226 | extracellular polysaccharide biosynthetic process(GO:0045226) extracellular polysaccharide metabolic process(GO:0046379) |
| 0.1 | 0.7 | GO:0060406 | positive regulation of penile erection(GO:0060406) |
| 0.1 | 0.4 | GO:1990258 | box C/D snoRNA 3'-end processing(GO:0000494) box C/D snoRNA metabolic process(GO:0033967) box C/D snoRNA processing(GO:0034963) histone glutamine methylation(GO:1990258) |
| 0.1 | 1.1 | GO:1901843 | positive regulation of high voltage-gated calcium channel activity(GO:1901843) |
| 0.1 | 0.4 | GO:1904730 | negative regulation of intestinal phytosterol absorption(GO:0010949) negative regulation of intestinal cholesterol absorption(GO:0045796) intestinal phytosterol absorption(GO:0060752) negative regulation of intestinal lipid absorption(GO:1904730) |
| 0.1 | 0.6 | GO:0038018 | Wnt receptor catabolic process(GO:0038018) |
| 0.1 | 0.5 | GO:1901350 | cell-cell signaling involved in cell-cell junction organization(GO:1901350) |
| 0.1 | 1.4 | GO:2000576 | positive regulation of microtubule motor activity(GO:2000576) regulation of ATP-dependent microtubule motor activity, plus-end-directed(GO:2000580) positive regulation of ATP-dependent microtubule motor activity, plus-end-directed(GO:2000582) |
| 0.1 | 0.4 | GO:0050928 | negative regulation of positive chemotaxis(GO:0050928) |
| 0.1 | 0.8 | GO:0048023 | positive regulation of melanin biosynthetic process(GO:0048023) positive regulation of secondary metabolite biosynthetic process(GO:1900378) |
| 0.1 | 2.3 | GO:0086069 | bundle of His cell to Purkinje myocyte communication(GO:0086069) |
| 0.1 | 0.5 | GO:0045918 | negative regulation of cytolysis(GO:0045918) |
| 0.1 | 0.5 | GO:0061737 | leukotriene signaling pathway(GO:0061737) |
| 0.1 | 1.1 | GO:0042908 | xenobiotic transport(GO:0042908) |
| 0.1 | 0.8 | GO:0021914 | negative regulation of smoothened signaling pathway involved in ventral spinal cord patterning(GO:0021914) |
| 0.1 | 0.2 | GO:1903567 | negative regulation of protein localization to cilium(GO:1903565) regulation of protein localization to ciliary membrane(GO:1903567) negative regulation of protein localization to ciliary membrane(GO:1903568) |
| 0.1 | 0.2 | GO:0070105 | positive regulation of interleukin-6-mediated signaling pathway(GO:0070105) |
| 0.1 | 0.4 | GO:0018032 | protein amidation(GO:0018032) |
| 0.1 | 0.4 | GO:0021797 | forebrain anterior/posterior pattern specification(GO:0021797) |
| 0.1 | 1.5 | GO:0017121 | phospholipid scrambling(GO:0017121) |
| 0.1 | 0.6 | GO:0035583 | sequestering of TGFbeta in extracellular matrix(GO:0035583) |
| 0.0 | 0.1 | GO:0002644 | negative regulation of tolerance induction(GO:0002644) positive regulation of interleukin-4 biosynthetic process(GO:0045404) |
| 0.0 | 0.6 | GO:0042670 | retinal cone cell differentiation(GO:0042670) retinal cone cell development(GO:0046549) |
| 0.0 | 0.4 | GO:1905150 | regulation of voltage-gated sodium channel activity(GO:1905150) |
| 0.0 | 0.4 | GO:0010269 | response to selenium ion(GO:0010269) |
| 0.0 | 0.1 | GO:1903925 | signal transduction involved in intra-S DNA damage checkpoint(GO:0072428) response to bisphenol A(GO:1903925) cellular response to bisphenol A(GO:1903926) |
| 0.0 | 0.2 | GO:1901842 | negative regulation of high voltage-gated calcium channel activity(GO:1901842) |
| 0.0 | 0.2 | GO:0070171 | negative regulation of tooth mineralization(GO:0070171) |
| 0.0 | 1.6 | GO:0055003 | cardiac myofibril assembly(GO:0055003) |
| 0.0 | 0.3 | GO:0048050 | post-embryonic eye morphogenesis(GO:0048050) |
| 0.0 | 0.5 | GO:0048251 | elastic fiber assembly(GO:0048251) |
| 0.0 | 0.3 | GO:0055059 | asymmetric neuroblast division(GO:0055059) |
| 0.0 | 0.2 | GO:0002729 | positive regulation of natural killer cell cytokine production(GO:0002729) |
| 0.0 | 1.8 | GO:0030206 | chondroitin sulfate biosynthetic process(GO:0030206) |
| 0.0 | 2.5 | GO:0007019 | microtubule depolymerization(GO:0007019) |
| 0.0 | 0.5 | GO:0036066 | protein O-linked fucosylation(GO:0036066) |
| 0.0 | 0.5 | GO:0035542 | regulation of SNARE complex assembly(GO:0035542) |
| 0.0 | 0.2 | GO:0060474 | positive regulation of sperm motility involved in capacitation(GO:0060474) |
| 0.0 | 1.0 | GO:0044458 | motile cilium assembly(GO:0044458) |
| 0.0 | 0.1 | GO:0018277 | protein deamination(GO:0018277) |
| 0.0 | 0.3 | GO:0046485 | ether lipid metabolic process(GO:0046485) |
| 0.0 | 1.0 | GO:0048240 | sperm capacitation(GO:0048240) |
| 0.0 | 0.4 | GO:0001867 | complement activation, lectin pathway(GO:0001867) |
| 0.0 | 0.4 | GO:0016998 | cell wall macromolecule catabolic process(GO:0016998) |
| 0.0 | 0.3 | GO:0043950 | positive regulation of cAMP-mediated signaling(GO:0043950) |
| 0.0 | 0.5 | GO:0007342 | fusion of sperm to egg plasma membrane(GO:0007342) |
| 0.0 | 0.1 | GO:0044028 | DNA hypomethylation(GO:0044028) hypomethylation of CpG island(GO:0044029) |
| 0.0 | 0.1 | GO:0098884 | postsynaptic neurotransmitter receptor internalization(GO:0098884) |
| 0.0 | 0.4 | GO:0008090 | retrograde axonal transport(GO:0008090) |
| 0.0 | 0.3 | GO:0048245 | eosinophil chemotaxis(GO:0048245) |
| 0.0 | 0.5 | GO:0016973 | poly(A)+ mRNA export from nucleus(GO:0016973) |
| 0.0 | 0.1 | GO:0019417 | sulfur oxidation(GO:0019417) |
| 0.0 | 0.4 | GO:0035020 | regulation of Rac protein signal transduction(GO:0035020) |
| 0.0 | 1.6 | GO:0008542 | visual learning(GO:0008542) |
| 0.0 | 0.3 | GO:1904262 | negative regulation of TORC1 signaling(GO:1904262) |
| 0.0 | 0.3 | GO:2001224 | positive regulation of neuron migration(GO:2001224) |
| 0.0 | 0.1 | GO:0060414 | aorta smooth muscle tissue morphogenesis(GO:0060414) |
| 0.0 | 0.2 | GO:0021759 | globus pallidus development(GO:0021759) |
| 0.0 | 0.2 | GO:0051599 | response to hydrostatic pressure(GO:0051599) |
| 0.0 | 0.2 | GO:0035331 | negative regulation of hippo signaling(GO:0035331) |
| 0.0 | 0.1 | GO:1901189 | positive regulation of ephrin receptor signaling pathway(GO:1901189) positive regulation of canonical Wnt signaling pathway involved in cardiac muscle cell fate commitment(GO:1901297) positive regulation of canonical Wnt signaling pathway involved in heart development(GO:1905068) |
| 0.0 | 0.1 | GO:1903435 | positive regulation of constitutive secretory pathway(GO:1903435) |
| 0.0 | 0.3 | GO:0090266 | regulation of mitotic cell cycle spindle assembly checkpoint(GO:0090266) regulation of mitotic spindle checkpoint(GO:1903504) |
| 0.0 | 0.5 | GO:0090383 | phagosome acidification(GO:0090383) |
| 0.0 | 0.1 | GO:0001550 | ovarian cumulus expansion(GO:0001550) fused antrum stage(GO:0048165) |
| 0.0 | 0.3 | GO:0097264 | self proteolysis(GO:0097264) |
| 0.0 | 0.1 | GO:0001834 | trophectodermal cell proliferation(GO:0001834) regulation of trophectodermal cell proliferation(GO:1904073) positive regulation of trophectodermal cell proliferation(GO:1904075) |
| 0.0 | 0.3 | GO:0006704 | glucocorticoid biosynthetic process(GO:0006704) |
| 0.0 | 0.2 | GO:2000353 | positive regulation of endothelial cell apoptotic process(GO:2000353) |
Gene overrepresentation in cellular_component category:
| Log-likelihood per target | Total log-likelihood | Term | Description |
|---|---|---|---|
| 0.2 | 0.5 | GO:0097679 | symbiont-containing vacuole(GO:0020003) symbiont-containing vacuole membrane(GO:0020005) other organism cytoplasm(GO:0097679) |
| 0.1 | 0.5 | GO:0034753 | nuclear aryl hydrocarbon receptor complex(GO:0034753) |
| 0.1 | 0.3 | GO:0044299 | C-fiber(GO:0044299) |
| 0.1 | 0.4 | GO:0031428 | box C/D snoRNP complex(GO:0031428) |
| 0.1 | 0.5 | GO:0042272 | nuclear RNA export factor complex(GO:0042272) |
| 0.1 | 0.4 | GO:0031673 | H zone(GO:0031673) |
| 0.1 | 0.9 | GO:0030061 | mitochondrial crista(GO:0030061) |
| 0.1 | 1.0 | GO:0042589 | zymogen granule membrane(GO:0042589) |
| 0.0 | 0.6 | GO:0035686 | sperm fibrous sheath(GO:0035686) |
| 0.0 | 1.1 | GO:0043205 | microfibril(GO:0001527) fibril(GO:0043205) |
| 0.0 | 0.9 | GO:0005916 | fascia adherens(GO:0005916) |
| 0.0 | 0.7 | GO:0034366 | spherical high-density lipoprotein particle(GO:0034366) |
| 0.0 | 1.4 | GO:0005868 | cytoplasmic dynein complex(GO:0005868) |
| 0.0 | 0.3 | GO:0097169 | AIM2 inflammasome complex(GO:0097169) |
| 0.0 | 0.6 | GO:0042622 | photoreceptor outer segment membrane(GO:0042622) |
| 0.0 | 0.4 | GO:0043190 | ATP-binding cassette (ABC) transporter complex(GO:0043190) |
| 0.0 | 0.1 | GO:0098844 | postsynaptic endocytic zone membrane(GO:0098844) |
| 0.0 | 0.2 | GO:0097486 | multivesicular body lumen(GO:0097486) |
| 0.0 | 0.7 | GO:0016327 | apicolateral plasma membrane(GO:0016327) |
| 0.0 | 0.5 | GO:0016471 | vacuolar proton-transporting V-type ATPase complex(GO:0016471) |
| 0.0 | 0.3 | GO:0061700 | GATOR2 complex(GO:0061700) |
| 0.0 | 0.5 | GO:0005921 | gap junction(GO:0005921) |
| 0.0 | 0.3 | GO:0031045 | dense core granule(GO:0031045) |
| 0.0 | 1.8 | GO:0017053 | transcriptional repressor complex(GO:0017053) |
| 0.0 | 0.6 | GO:0048786 | presynaptic active zone(GO:0048786) |
| 0.0 | 1.4 | GO:0099501 | synaptic vesicle membrane(GO:0030672) exocytic vesicle membrane(GO:0099501) |
| 0.0 | 0.3 | GO:0042599 | lamellar body(GO:0042599) |
Gene overrepresentation in molecular_function category:
| Log-likelihood per target | Total log-likelihood | Term | Description |
|---|---|---|---|
| 0.5 | 4.7 | GO:0008454 | alpha-1,3-mannosylglycoprotein 4-beta-N-acetylglucosaminyltransferase activity(GO:0008454) |
| 0.3 | 1.0 | GO:0016964 | alpha-2 macroglobulin receptor activity(GO:0016964) |
| 0.3 | 2.4 | GO:0015349 | thyroid hormone transmembrane transporter activity(GO:0015349) |
| 0.3 | 1.8 | GO:0047756 | chondroitin 4-sulfotransferase activity(GO:0047756) |
| 0.2 | 0.7 | GO:0031685 | adenosine receptor binding(GO:0031685) |
| 0.2 | 0.7 | GO:0070653 | high-density lipoprotein particle receptor binding(GO:0070653) |
| 0.2 | 0.8 | GO:0048248 | CXCR3 chemokine receptor binding(GO:0048248) |
| 0.1 | 0.4 | GO:1990259 | protein-glutamine N-methyltransferase activity(GO:0036009) histone-glutamine methyltransferase activity(GO:1990259) |
| 0.1 | 0.6 | GO:0050501 | hyaluronan synthase activity(GO:0050501) |
| 0.1 | 1.4 | GO:0031013 | troponin I binding(GO:0031013) |
| 0.1 | 0.5 | GO:0004874 | aryl hydrocarbon receptor activity(GO:0004874) |
| 0.1 | 0.3 | GO:0003845 | 11-beta-hydroxysteroid dehydrogenase [NAD(P)] activity(GO:0003845) |
| 0.1 | 0.7 | GO:0031781 | melanocortin receptor binding(GO:0031779) type 3 melanocortin receptor binding(GO:0031781) type 4 melanocortin receptor binding(GO:0031782) |
| 0.1 | 0.4 | GO:0032422 | purine-rich negative regulatory element binding(GO:0032422) |
| 0.1 | 0.5 | GO:0004974 | leukotriene receptor activity(GO:0004974) |
| 0.1 | 1.1 | GO:0008559 | xenobiotic-transporting ATPase activity(GO:0008559) |
| 0.1 | 0.7 | GO:0050692 | DBD domain binding(GO:0050692) |
| 0.1 | 0.9 | GO:0086083 | cell adhesive protein binding involved in bundle of His cell-Purkinje myocyte communication(GO:0086083) |
| 0.1 | 0.2 | GO:0005174 | CD40 receptor binding(GO:0005174) |
| 0.1 | 0.6 | GO:0030023 | extracellular matrix constituent conferring elasticity(GO:0030023) |
| 0.1 | 1.5 | GO:0017128 | phospholipid scramblase activity(GO:0017128) |
| 0.1 | 0.3 | GO:0005006 | epidermal growth factor-activated receptor activity(GO:0005006) |
| 0.1 | 0.4 | GO:0004504 | peptidylglycine monooxygenase activity(GO:0004504) peptidylamidoglycolate lyase activity(GO:0004598) |
| 0.1 | 1.3 | GO:0045504 | dynein heavy chain binding(GO:0045504) |
| 0.1 | 0.5 | GO:0004499 | N,N-dimethylaniline monooxygenase activity(GO:0004499) |
| 0.1 | 1.6 | GO:0031005 | filamin binding(GO:0031005) |
| 0.0 | 0.4 | GO:0008131 | primary amine oxidase activity(GO:0008131) |
| 0.0 | 0.6 | GO:0008020 | G-protein coupled photoreceptor activity(GO:0008020) |
| 0.0 | 1.0 | GO:0005229 | intracellular calcium activated chloride channel activity(GO:0005229) |
| 0.0 | 1.0 | GO:0017127 | cholesterol transporter activity(GO:0017127) |
| 0.0 | 2.1 | GO:0070412 | R-SMAD binding(GO:0070412) |
| 0.0 | 0.3 | GO:0016714 | oxidoreductase activity, acting on paired donors, with incorporation or reduction of molecular oxygen, reduced pteridine as one donor, and incorporation of one atom of oxygen(GO:0016714) |
| 0.0 | 0.9 | GO:0005388 | calcium-transporting ATPase activity(GO:0005388) |
| 0.0 | 0.6 | GO:0001222 | transcription corepressor binding(GO:0001222) |
| 0.0 | 0.4 | GO:0003796 | lysozyme activity(GO:0003796) |
| 0.0 | 0.2 | GO:0008035 | high-density lipoprotein particle binding(GO:0008035) |
| 0.0 | 0.9 | GO:0071855 | neuropeptide receptor binding(GO:0071855) |
| 0.0 | 0.1 | GO:0008574 | ATP-dependent microtubule motor activity, plus-end-directed(GO:0008574) |
| 0.0 | 0.1 | GO:0031798 | type 1 metabotropic glutamate receptor binding(GO:0031798) |
| 0.0 | 0.5 | GO:0017049 | GTP-Rho binding(GO:0017049) |
| 0.0 | 1.8 | GO:0050840 | extracellular matrix binding(GO:0050840) |
| 0.0 | 0.0 | GO:0090541 | MIT domain binding(GO:0090541) |
| 0.0 | 0.1 | GO:0004449 | isocitrate dehydrogenase (NAD+) activity(GO:0004449) |
| 0.0 | 0.1 | GO:0016428 | tRNA (cytosine-5-)-methyltransferase activity(GO:0016428) |
| 0.0 | 0.1 | GO:0004720 | protein-lysine 6-oxidase activity(GO:0004720) |
| 0.0 | 0.6 | GO:0005540 | hyaluronic acid binding(GO:0005540) |
| 0.0 | 0.1 | GO:0005237 | inhibitory extracellular ligand-gated ion channel activity(GO:0005237) |
| 0.0 | 0.1 | GO:0034584 | piRNA binding(GO:0034584) |
| 0.0 | 0.9 | GO:0004693 | cyclin-dependent protein serine/threonine kinase activity(GO:0004693) |
| 0.0 | 0.6 | GO:0005109 | frizzled binding(GO:0005109) |
| 0.0 | 0.9 | GO:0005044 | scavenger receptor activity(GO:0005044) |
| 0.0 | 0.2 | GO:0015125 | bile acid transmembrane transporter activity(GO:0015125) |
Gene overrepresentation in curated gene sets: canonical pathways category:
| Log-likelihood per target | Total log-likelihood | Term | Description |
|---|---|---|---|
| 0.0 | 0.6 | PID CONE PATHWAY | Visual signal transduction: Cones |
| 0.0 | 0.7 | PID INSULIN GLUCOSE PATHWAY | Insulin-mediated glucose transport |
| 0.0 | 0.8 | ST GA12 PATHWAY | G alpha 12 Pathway |
| 0.0 | 1.0 | ST WNT BETA CATENIN PATHWAY | Wnt/beta-catenin Pathway |
| 0.0 | 0.4 | PID ALPHA SYNUCLEIN PATHWAY | Alpha-synuclein signaling |
| 0.0 | 0.8 | NABA PROTEOGLYCANS | Genes encoding proteoglycans |
Gene overrepresentation in curated gene sets: REACTOME pathways category:
| Log-likelihood per target | Total log-likelihood | Term | Description |
|---|---|---|---|
| 0.1 | 4.7 | REACTOME N GLYCAN ANTENNAE ELONGATION | Genes involved in N-Glycan antennae elongation |
| 0.1 | 2.7 | REACTOME TRANSPORT OF ORGANIC ANIONS | Genes involved in Transport of organic anions |
| 0.0 | 1.8 | REACTOME CHONDROITIN SULFATE BIOSYNTHESIS | Genes involved in Chondroitin sulfate biosynthesis |
| 0.0 | 0.4 | REACTOME CREATION OF C4 AND C2 ACTIVATORS | Genes involved in Creation of C4 and C2 activators |
| 0.0 | 0.7 | REACTOME P2Y RECEPTORS | Genes involved in P2Y receptors |
| 0.0 | 0.6 | REACTOME HIGHLY CALCIUM PERMEABLE POSTSYNAPTIC NICOTINIC ACETYLCHOLINE RECEPTORS | Genes involved in Highly calcium permeable postsynaptic nicotinic acetylcholine receptors |
| 0.0 | 0.5 | REACTOME EICOSANOID LIGAND BINDING RECEPTORS | Genes involved in Eicosanoid ligand-binding receptors |
| 0.0 | 1.5 | REACTOME ABC FAMILY PROTEINS MEDIATED TRANSPORT | Genes involved in ABC-family proteins mediated transport |
| 0.0 | 0.7 | REACTOME CHYLOMICRON MEDIATED LIPID TRANSPORT | Genes involved in Chylomicron-mediated lipid transport |
| 0.0 | 0.6 | REACTOME HYALURONAN METABOLISM | Genes involved in Hyaluronan metabolism |
| 0.0 | 0.5 | REACTOME APOPTOTIC CLEAVAGE OF CELL ADHESION PROTEINS | Genes involved in Apoptotic cleavage of cell adhesion proteins |
| 0.0 | 0.3 | REACTOME DIGESTION OF DIETARY CARBOHYDRATE | Genes involved in Digestion of dietary carbohydrate |
| 0.0 | 0.5 | REACTOME INSULIN RECEPTOR RECYCLING | Genes involved in Insulin receptor recycling |
| 0.0 | 0.5 | REACTOME GABA A RECEPTOR ACTIVATION | Genes involved in GABA A receptor activation |
| 0.0 | 1.3 | REACTOME LOSS OF NLP FROM MITOTIC CENTROSOMES | Genes involved in Loss of Nlp from mitotic centrosomes |
| 0.0 | 0.6 | REACTOME G PROTEIN ACTIVATION | Genes involved in G-protein activation |
| 0.0 | 0.8 | REACTOME CHEMOKINE RECEPTORS BIND CHEMOKINES | Genes involved in Chemokine receptors bind chemokines |