Project
Illumina Body Map 2: averaged replicates
Navigation
Downloads
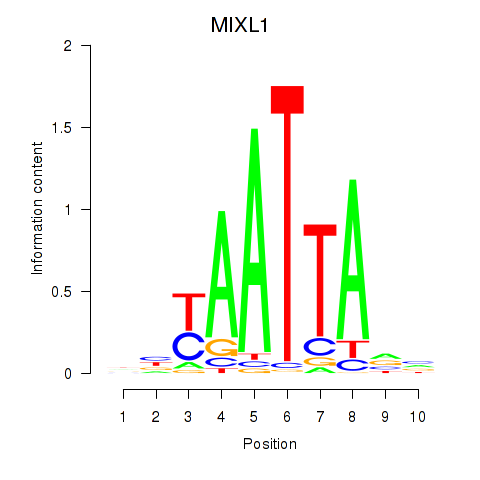
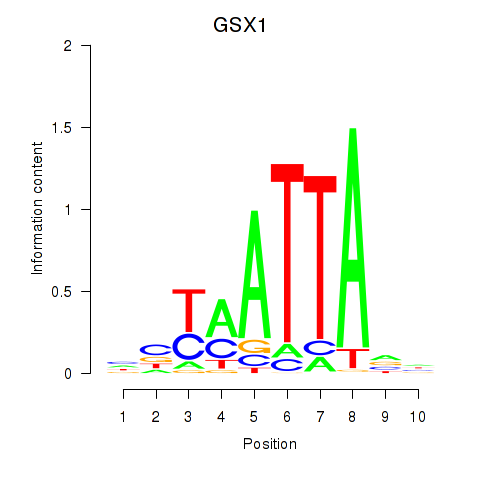
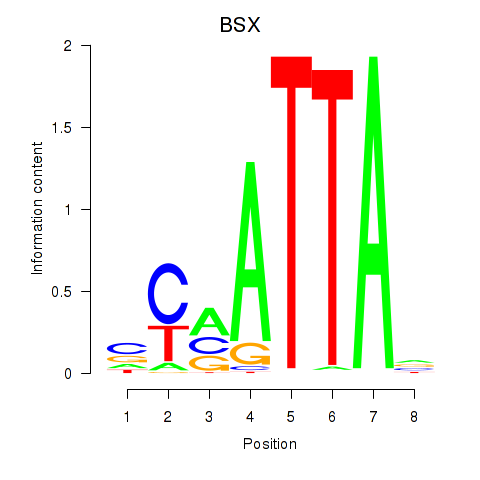
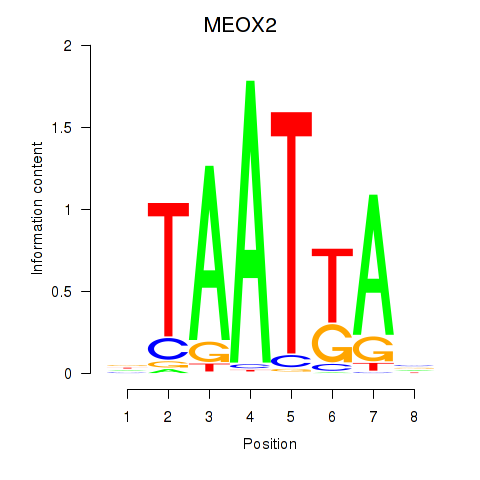
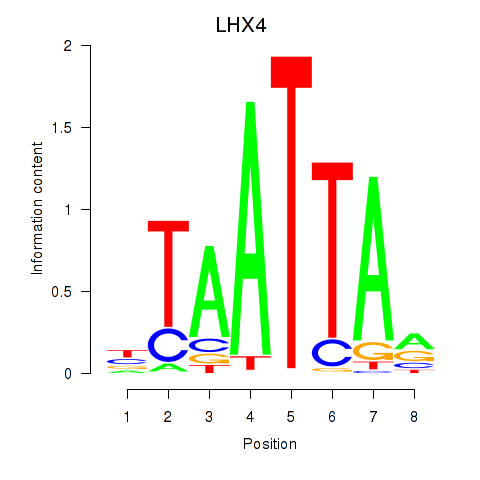
Results for MIXL1_GSX1_BSX_MEOX2_LHX4
Z-value: 1.70
Motif logo
Transcription factors associated with MIXL1_GSX1_BSX_MEOX2_LHX4
| Gene Symbol | Gene ID | Gene Info |
|---|---|---|
|
MIXL1
|
ENSG00000185155.7 | Mix paired-like homeobox |
|
GSX1
|
ENSG00000169840.4 | GS homeobox 1 |
|
BSX
|
ENSG00000188909.4 | brain specific homeobox |
|
MEOX2
|
ENSG00000106511.5 | mesenchyme homeobox 2 |
|
LHX4
|
ENSG00000121454.4 | LIM homeobox 4 |
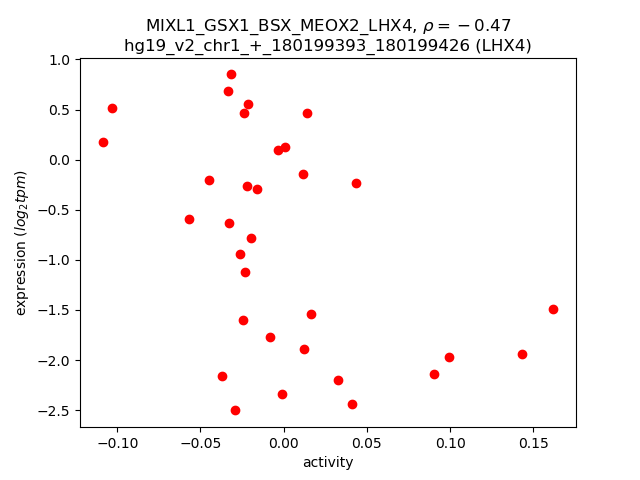
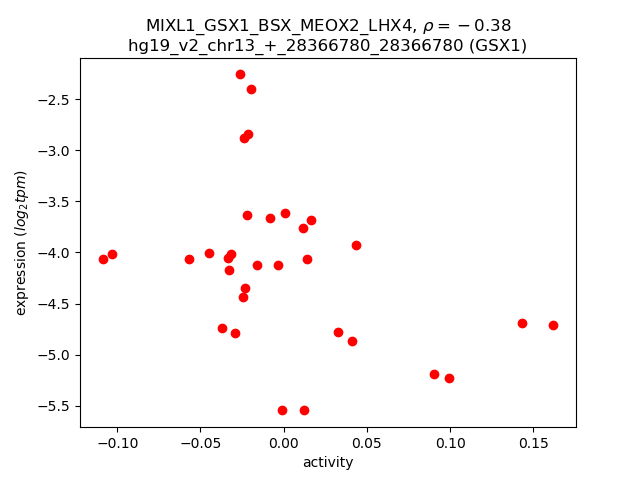
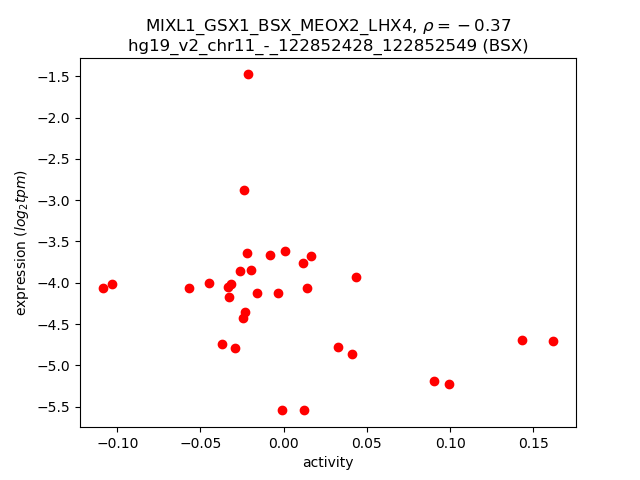
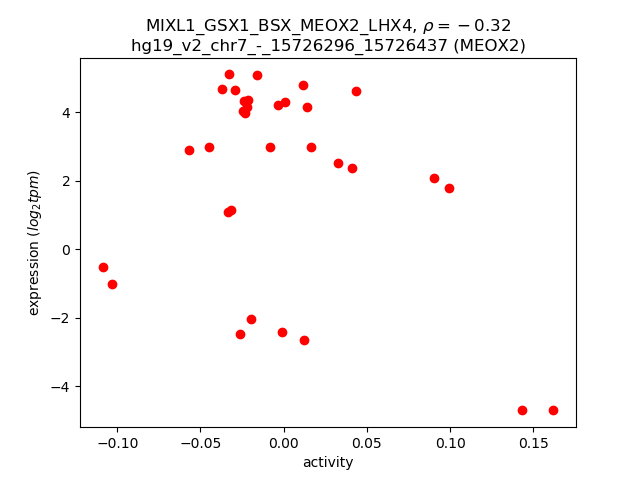
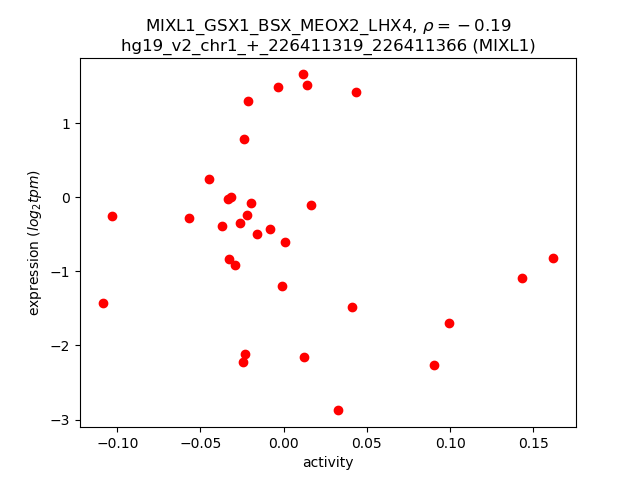
Activity-expression correlation:
| Gene | Promoter | Pearson corr. coef. | P-value | Plot |
|---|---|---|---|---|
| LHX4 | hg19_v2_chr1_+_180199393_180199426 | -0.47 | 6.2e-03 | Click! |
| GSX1 | hg19_v2_chr13_+_28366780_28366780 | -0.38 | 3.0e-02 | Click! |
| BSX | hg19_v2_chr11_-_122852428_122852549 | -0.37 | 4.0e-02 | Click! |
| MEOX2 | hg19_v2_chr7_-_15726296_15726437 | -0.32 | 7.5e-02 | Click! |
| MIXL1 | hg19_v2_chr1_+_226411319_226411366 | -0.19 | 3.1e-01 | Click! |
Activity profile of MIXL1_GSX1_BSX_MEOX2_LHX4 motif
Sorted Z-values of MIXL1_GSX1_BSX_MEOX2_LHX4 motif
| Promoter | Log-likelihood | Transcript | Gene | Gene Info |
|---|---|---|---|---|
| chr4_-_36245561 | 8.36 |
ENST00000506189.1
|
ARAP2
|
ArfGAP with RhoGAP domain, ankyrin repeat and PH domain 2 |
| chr6_-_32157947 | 7.76 |
ENST00000375050.4
|
PBX2
|
pre-B-cell leukemia homeobox 2 |
| chr13_-_46716969 | 7.33 |
ENST00000435666.2
|
LCP1
|
lymphocyte cytosolic protein 1 (L-plastin) |
| chr3_+_108541545 | 6.59 |
ENST00000295756.6
|
TRAT1
|
T cell receptor associated transmembrane adaptor 1 |
| chr14_+_22337014 | 6.55 |
ENST00000390436.2
|
TRAV13-1
|
T cell receptor alpha variable 13-1 |
| chrX_+_135730297 | 6.46 |
ENST00000370629.2
|
CD40LG
|
CD40 ligand |
| chr12_+_8666126 | 6.00 |
ENST00000299665.2
|
CLEC4D
|
C-type lectin domain family 4, member D |
| chr3_+_108541608 | 5.50 |
ENST00000426646.1
|
TRAT1
|
T cell receptor associated transmembrane adaptor 1 |
| chr15_+_58430368 | 5.13 |
ENST00000558772.1
ENST00000219919.4 |
AQP9
|
aquaporin 9 |
| chr2_-_158300556 | 5.05 |
ENST00000264192.3
|
CYTIP
|
cytohesin 1 interacting protein |
| chr14_+_22739823 | 4.90 |
ENST00000390464.2
|
TRAV38-1
|
T cell receptor alpha variable 38-1 |
| chr15_+_58430567 | 4.84 |
ENST00000536493.1
|
AQP9
|
aquaporin 9 |
| chr4_+_40198527 | 4.74 |
ENST00000381799.5
|
RHOH
|
ras homolog family member H |
| chr7_+_142378566 | 4.71 |
ENST00000390398.3
|
TRBV25-1
|
T cell receptor beta variable 25-1 |
| chr2_+_169926047 | 4.68 |
ENST00000428522.1
ENST00000450153.1 ENST00000421653.1 |
DHRS9
|
dehydrogenase/reductase (SDR family) member 9 |
| chr11_-_2323089 | 4.65 |
ENST00000456145.2
|
C11orf21
|
chromosome 11 open reading frame 21 |
| chr5_+_66300464 | 4.62 |
ENST00000436277.1
|
MAST4
|
microtubule associated serine/threonine kinase family member 4 |
| chr2_-_89161432 | 4.59 |
ENST00000390242.2
|
IGKJ1
|
immunoglobulin kappa joining 1 |
| chr7_+_80255472 | 4.47 |
ENST00000428497.1
|
CD36
|
CD36 molecule (thrombospondin receptor) |
| chr2_+_90248739 | 4.33 |
ENST00000468879.1
|
IGKV1D-43
|
immunoglobulin kappa variable 1D-43 |
| chr2_+_7865923 | 4.27 |
ENST00000417930.1
|
AC092580.4
|
AC092580.4 |
| chr12_+_10124110 | 4.25 |
ENST00000350667.4
|
CLEC12A
|
C-type lectin domain family 12, member A |
| chr13_-_41593425 | 4.24 |
ENST00000239882.3
|
ELF1
|
E74-like factor 1 (ets domain transcription factor) |
| chr1_-_183538319 | 4.12 |
ENST00000420553.1
ENST00000419402.1 |
NCF2
|
neutrophil cytosolic factor 2 |
| chrX_-_21676442 | 4.07 |
ENST00000379499.2
|
KLHL34
|
kelch-like family member 34 |
| chr1_+_101003687 | 3.99 |
ENST00000315033.4
|
GPR88
|
G protein-coupled receptor 88 |
| chr7_+_50348268 | 3.87 |
ENST00000438033.1
ENST00000439701.1 |
IKZF1
|
IKAROS family zinc finger 1 (Ikaros) |
| chr7_-_92777606 | 3.87 |
ENST00000437805.1
ENST00000446959.1 ENST00000439952.1 ENST00000414791.1 ENST00000446033.1 ENST00000411955.1 ENST00000318238.4 |
SAMD9L
|
sterile alpha motif domain containing 9-like |
| chr14_+_22564294 | 3.84 |
ENST00000390452.2
|
TRDV1
|
T cell receptor delta variable 1 |
| chr14_+_22992573 | 3.67 |
ENST00000390516.1
|
TRAJ21
|
T cell receptor alpha joining 21 |
| chr6_-_32908792 | 3.63 |
ENST00000418107.2
|
HLA-DMB
|
major histocompatibility complex, class II, DM beta |
| chr6_-_116866773 | 3.63 |
ENST00000368602.3
|
TRAPPC3L
|
trafficking protein particle complex 3-like |
| chr13_-_99910673 | 3.58 |
ENST00000397473.2
ENST00000397470.2 |
GPR18
|
G protein-coupled receptor 18 |
| chrX_+_135730373 | 3.46 |
ENST00000370628.2
|
CD40LG
|
CD40 ligand |
| chr7_+_77428066 | 3.39 |
ENST00000422959.2
ENST00000307305.8 ENST00000424760.1 |
PHTF2
|
putative homeodomain transcription factor 2 |
| chr12_-_10151773 | 3.32 |
ENST00000298527.6
ENST00000348658.4 |
CLEC1B
|
C-type lectin domain family 1, member B |
| chr1_+_174844645 | 3.31 |
ENST00000486220.1
|
RABGAP1L
|
RAB GTPase activating protein 1-like |
| chr6_-_139613269 | 3.31 |
ENST00000358430.3
|
TXLNB
|
taxilin beta |
| chr17_-_57229155 | 3.30 |
ENST00000584089.1
|
SKA2
|
spindle and kinetochore associated complex subunit 2 |
| chr14_+_22631122 | 3.23 |
ENST00000390458.3
|
TRAV29DV5
|
T cell receptor alpha variable 29/delta variable 5 (gene/pseudogene) |
| chr7_+_37723336 | 3.22 |
ENST00000450180.1
|
GPR141
|
G protein-coupled receptor 141 |
| chr1_-_92952433 | 3.22 |
ENST00000294702.5
|
GFI1
|
growth factor independent 1 transcription repressor |
| chr4_+_40201954 | 3.09 |
ENST00000511121.1
|
RHOH
|
ras homolog family member H |
| chr1_-_150738261 | 3.03 |
ENST00000448301.2
ENST00000368985.3 |
CTSS
|
cathepsin S |
| chr16_-_4852915 | 2.97 |
ENST00000322048.7
|
ROGDI
|
rogdi homolog (Drosophila) |
| chr15_+_75080883 | 2.96 |
ENST00000567571.1
|
CSK
|
c-src tyrosine kinase |
| chr12_+_28410128 | 2.88 |
ENST00000381259.1
ENST00000381256.1 |
CCDC91
|
coiled-coil domain containing 91 |
| chr3_-_39321512 | 2.82 |
ENST00000399220.2
|
CX3CR1
|
chemokine (C-X3-C motif) receptor 1 |
| chr18_-_3220106 | 2.80 |
ENST00000356443.4
ENST00000400569.3 |
MYOM1
|
myomesin 1 |
| chr5_+_137722255 | 2.78 |
ENST00000542866.1
|
KDM3B
|
lysine (K)-specific demethylase 3B |
| chr3_-_27764190 | 2.77 |
ENST00000537516.1
|
EOMES
|
eomesodermin |
| chr2_+_204571375 | 2.77 |
ENST00000374478.4
|
CD28
|
CD28 molecule |
| chrX_-_19817869 | 2.74 |
ENST00000379698.4
|
SH3KBP1
|
SH3-domain kinase binding protein 1 |
| chr18_+_32556892 | 2.74 |
ENST00000591734.1
ENST00000413393.1 ENST00000589180.1 ENST00000587359.1 |
MAPRE2
|
microtubule-associated protein, RP/EB family, member 2 |
| chr6_-_66417107 | 2.70 |
ENST00000370621.3
ENST00000370618.3 ENST00000503581.1 ENST00000393380.2 |
EYS
|
eyes shut homolog (Drosophila) |
| chr7_+_77428149 | 2.69 |
ENST00000415251.2
ENST00000275575.7 |
PHTF2
|
putative homeodomain transcription factor 2 |
| chr17_-_9694614 | 2.67 |
ENST00000330255.5
ENST00000571134.1 |
DHRS7C
|
dehydrogenase/reductase (SDR family) member 7C |
| chr4_+_36283213 | 2.66 |
ENST00000357504.3
|
DTHD1
|
death domain containing 1 |
| chr17_-_38956205 | 2.61 |
ENST00000306658.7
|
KRT28
|
keratin 28 |
| chr14_+_92789498 | 2.61 |
ENST00000531433.1
|
SLC24A4
|
solute carrier family 24 (sodium/potassium/calcium exchanger), member 4 |
| chr2_-_145277569 | 2.58 |
ENST00000303660.4
|
ZEB2
|
zinc finger E-box binding homeobox 2 |
| chr18_-_3219847 | 2.58 |
ENST00000261606.7
|
MYOM1
|
myomesin 1 |
| chr1_+_154401791 | 2.57 |
ENST00000476006.1
|
IL6R
|
interleukin 6 receptor |
| chr7_+_18329712 | 2.56 |
ENST00000433709.2
|
HDAC9
|
histone deacetylase 9 |
| chr2_-_61697862 | 2.55 |
ENST00000398571.2
|
USP34
|
ubiquitin specific peptidase 34 |
| chr1_+_62439037 | 2.48 |
ENST00000545929.1
|
INADL
|
InaD-like (Drosophila) |
| chr2_-_145188137 | 2.47 |
ENST00000440875.1
|
ZEB2
|
zinc finger E-box binding homeobox 2 |
| chr14_+_22947861 | 2.47 |
ENST00000390482.1
|
TRAJ57
|
T cell receptor alpha joining 57 |
| chr6_-_32908765 | 2.46 |
ENST00000416244.2
|
HLA-DMB
|
major histocompatibility complex, class II, DM beta |
| chrX_+_123097014 | 2.41 |
ENST00000394478.1
|
STAG2
|
stromal antigen 2 |
| chr5_+_66300446 | 2.41 |
ENST00000261569.7
|
MAST4
|
microtubule associated serine/threonine kinase family member 4 |
| chr19_+_50016610 | 2.41 |
ENST00000596975.1
|
FCGRT
|
Fc fragment of IgG, receptor, transporter, alpha |
| chr1_+_117544366 | 2.39 |
ENST00000256652.4
ENST00000369470.1 |
CD101
|
CD101 molecule |
| chr2_+_68962014 | 2.38 |
ENST00000467265.1
|
ARHGAP25
|
Rho GTPase activating protein 25 |
| chr15_+_86087267 | 2.36 |
ENST00000558166.1
|
AKAP13
|
A kinase (PRKA) anchor protein 13 |
| chr2_-_214016314 | 2.36 |
ENST00000434687.1
ENST00000374319.4 |
IKZF2
|
IKAROS family zinc finger 2 (Helios) |
| chr18_-_44181442 | 2.32 |
ENST00000398722.4
|
LOXHD1
|
lipoxygenase homology domains 1 |
| chr6_+_53964336 | 2.32 |
ENST00000447836.2
ENST00000511678.1 |
MLIP
|
muscular LMNA-interacting protein |
| chr11_-_111649015 | 2.30 |
ENST00000529841.1
|
RP11-108O10.2
|
RP11-108O10.2 |
| chr13_+_78315466 | 2.30 |
ENST00000314070.5
ENST00000462234.1 |
SLAIN1
|
SLAIN motif family, member 1 |
| chr2_+_90273679 | 2.29 |
ENST00000423080.2
|
IGKV3D-7
|
immunoglobulin kappa variable 3D-7 |
| chr2_+_68961934 | 2.29 |
ENST00000409202.3
|
ARHGAP25
|
Rho GTPase activating protein 25 |
| chrX_-_15332665 | 2.28 |
ENST00000537676.1
ENST00000344384.4 |
ASB11
|
ankyrin repeat and SOCS box containing 11 |
| chr11_-_33913708 | 2.27 |
ENST00000257818.2
|
LMO2
|
LIM domain only 2 (rhombotin-like 1) |
| chr11_-_104972158 | 2.27 |
ENST00000598974.1
ENST00000593315.1 ENST00000594519.1 ENST00000415981.2 ENST00000525374.1 ENST00000375707.1 |
CASP1
CARD16
CARD17
|
caspase 1, apoptosis-related cysteine peptidase caspase recruitment domain family, member 16 caspase recruitment domain family, member 17 |
| chr16_+_53133070 | 2.26 |
ENST00000565832.1
|
CHD9
|
chromodomain helicase DNA binding protein 9 |
| chr7_-_77427676 | 2.24 |
ENST00000257663.3
|
TMEM60
|
transmembrane protein 60 |
| chr7_-_28220354 | 2.24 |
ENST00000283928.5
|
JAZF1
|
JAZF zinc finger 1 |
| chr6_+_26365443 | 2.24 |
ENST00000527422.1
ENST00000356386.2 ENST00000396934.3 ENST00000377708.2 ENST00000396948.1 ENST00000508906.2 |
BTN3A2
|
butyrophilin, subfamily 3, member A2 |
| chr14_+_22931924 | 2.23 |
ENST00000390477.2
|
TRDC
|
T cell receptor delta constant |
| chr3_+_121774202 | 2.23 |
ENST00000469710.1
ENST00000493101.1 ENST00000330540.2 ENST00000264468.5 |
CD86
|
CD86 molecule |
| chr5_-_142780280 | 2.22 |
ENST00000424646.2
|
NR3C1
|
nuclear receptor subfamily 3, group C, member 1 (glucocorticoid receptor) |
| chr3_-_33686925 | 2.22 |
ENST00000485378.2
ENST00000313350.6 ENST00000487200.1 |
CLASP2
|
cytoplasmic linker associated protein 2 |
| chr2_+_68961905 | 2.18 |
ENST00000295381.3
|
ARHGAP25
|
Rho GTPase activating protein 25 |
| chr2_-_179659669 | 2.15 |
ENST00000436599.1
|
TTN
|
titin |
| chr2_+_17997763 | 2.15 |
ENST00000281047.3
|
MSGN1
|
mesogenin 1 |
| chr4_+_169013666 | 2.14 |
ENST00000359299.3
|
ANXA10
|
annexin A10 |
| chr7_+_115862858 | 2.14 |
ENST00000393481.2
|
TES
|
testis derived transcript (3 LIM domains) |
| chr21_-_32253874 | 2.14 |
ENST00000332378.4
|
KRTAP11-1
|
keratin associated protein 11-1 |
| chr1_+_111415757 | 2.13 |
ENST00000429072.2
ENST00000271324.5 |
CD53
|
CD53 molecule |
| chr13_-_99910620 | 2.10 |
ENST00000416594.1
|
GPR18
|
G protein-coupled receptor 18 |
| chr2_-_89160770 | 2.09 |
ENST00000390240.2
|
IGKJ3
|
immunoglobulin kappa joining 3 |
| chr1_-_232651312 | 2.07 |
ENST00000262861.4
|
SIPA1L2
|
signal-induced proliferation-associated 1 like 2 |
| chr4_-_70653673 | 2.06 |
ENST00000512870.1
|
SULT1B1
|
sulfotransferase family, cytosolic, 1B, member 1 |
| chr14_+_22465771 | 2.05 |
ENST00000390445.2
|
TRAV17
|
T cell receptor alpha variable 17 |
| chr1_+_198607801 | 2.03 |
ENST00000367379.1
|
PTPRC
|
protein tyrosine phosphatase, receptor type, C |
| chr17_-_39191107 | 2.03 |
ENST00000344363.5
|
KRTAP1-3
|
keratin associated protein 1-3 |
| chr3_-_69129501 | 2.01 |
ENST00000540295.1
ENST00000415609.2 ENST00000361055.4 ENST00000349511.4 |
UBA3
|
ubiquitin-like modifier activating enzyme 3 |
| chr10_-_104866395 | 2.01 |
ENST00000458345.1
|
NT5C2
|
5'-nucleotidase, cytosolic II |
| chr4_-_48116540 | 2.01 |
ENST00000506073.1
|
TXK
|
TXK tyrosine kinase |
| chr13_+_78315348 | 2.00 |
ENST00000441784.1
|
SLAIN1
|
SLAIN motif family, member 1 |
| chr17_-_72527605 | 1.98 |
ENST00000392621.1
ENST00000314401.3 |
CD300LB
|
CD300 molecule-like family member b |
| chr11_+_35222629 | 1.97 |
ENST00000526553.1
|
CD44
|
CD44 molecule (Indian blood group) |
| chr6_-_130182410 | 1.95 |
ENST00000368143.1
|
TMEM244
|
transmembrane protein 244 |
| chr2_+_90211643 | 1.95 |
ENST00000390277.2
|
IGKV3D-11
|
immunoglobulin kappa variable 3D-11 |
| chr11_-_104905840 | 1.93 |
ENST00000526568.1
ENST00000393136.4 ENST00000531166.1 ENST00000534497.1 ENST00000527979.1 ENST00000446369.1 ENST00000353247.5 ENST00000528974.1 ENST00000533400.1 ENST00000525825.1 ENST00000436863.3 |
CASP1
|
caspase 1, apoptosis-related cysteine peptidase |
| chr6_+_130339710 | 1.92 |
ENST00000526087.1
ENST00000533560.1 ENST00000361794.2 |
L3MBTL3
|
l(3)mbt-like 3 (Drosophila) |
| chr2_-_89161064 | 1.91 |
ENST00000390241.2
|
IGKJ2
|
immunoglobulin kappa joining 2 |
| chr12_-_114841703 | 1.91 |
ENST00000526441.1
|
TBX5
|
T-box 5 |
| chr14_+_23001452 | 1.90 |
ENST00000390526.1
|
TRAJ11
|
T cell receptor alpha joining 11 |
| chr10_+_126630692 | 1.89 |
ENST00000359653.4
|
ZRANB1
|
zinc finger, RAN-binding domain containing 1 |
| chr3_-_33686743 | 1.88 |
ENST00000333778.6
ENST00000539981.1 |
CLASP2
|
cytoplasmic linker associated protein 2 |
| chr5_+_54398463 | 1.88 |
ENST00000274306.6
|
GZMA
|
granzyme A (granzyme 1, cytotoxic T-lymphocyte-associated serine esterase 3) |
| chr5_+_53751445 | 1.87 |
ENST00000302005.1
|
HSPB3
|
heat shock 27kDa protein 3 |
| chr2_+_190541153 | 1.84 |
ENST00000313581.4
ENST00000438402.2 ENST00000431575.2 ENST00000281412.6 |
ANKAR
|
ankyrin and armadillo repeat containing |
| chr14_+_22670455 | 1.83 |
ENST00000390460.1
|
TRAV26-2
|
T cell receptor alpha variable 26-2 |
| chr10_-_92681033 | 1.83 |
ENST00000371697.3
|
ANKRD1
|
ankyrin repeat domain 1 (cardiac muscle) |
| chr2_-_109605663 | 1.82 |
ENST00000409271.1
ENST00000258443.2 ENST00000376651.1 |
EDAR
|
ectodysplasin A receptor |
| chr10_+_69865866 | 1.81 |
ENST00000354393.2
|
MYPN
|
myopalladin |
| chr10_-_21186144 | 1.81 |
ENST00000377119.1
|
NEBL
|
nebulette |
| chrY_+_14958970 | 1.80 |
ENST00000453031.1
|
USP9Y
|
ubiquitin specific peptidase 9, Y-linked |
| chr6_-_116833500 | 1.79 |
ENST00000356128.4
|
TRAPPC3L
|
trafficking protein particle complex 3-like |
| chr10_+_94451574 | 1.78 |
ENST00000492654.2
|
HHEX
|
hematopoietically expressed homeobox |
| chr3_-_191000172 | 1.78 |
ENST00000427544.2
|
UTS2B
|
urotensin 2B |
| chr1_-_157746909 | 1.77 |
ENST00000392274.3
ENST00000361516.3 ENST00000368181.4 |
FCRL2
|
Fc receptor-like 2 |
| chr13_+_78315528 | 1.74 |
ENST00000496045.1
|
SLAIN1
|
SLAIN motif family, member 1 |
| chr4_-_182186182 | 1.73 |
ENST00000512547.1
|
RP11-665C14.2
|
RP11-665C14.2 |
| chr5_+_137673200 | 1.71 |
ENST00000434981.2
|
FAM53C
|
family with sequence similarity 53, member C |
| chr2_-_40680578 | 1.70 |
ENST00000455476.1
|
SLC8A1
|
solute carrier family 8 (sodium/calcium exchanger), member 1 |
| chr14_+_22748980 | 1.70 |
ENST00000390465.2
|
TRAV38-2DV8
|
T cell receptor alpha variable 38-2/delta variable 8 |
| chr12_-_56694083 | 1.68 |
ENST00000552688.1
ENST00000548041.1 ENST00000551137.1 ENST00000551968.1 ENST00000542324.2 ENST00000546930.1 ENST00000549221.1 ENST00000550159.1 ENST00000550734.1 |
CS
|
citrate synthase |
| chr10_-_36812323 | 1.68 |
ENST00000543053.1
|
NAMPTL
|
nicotinamide phosphoribosyltransferase-like |
| chr18_+_32173276 | 1.67 |
ENST00000591816.1
ENST00000588125.1 ENST00000598334.1 ENST00000588684.1 ENST00000554864.3 ENST00000399121.5 ENST00000595022.1 ENST00000269190.7 ENST00000399097.3 |
DTNA
|
dystrobrevin, alpha |
| chr17_-_39203519 | 1.65 |
ENST00000542137.1
ENST00000391419.3 |
KRTAP2-1
|
keratin associated protein 2-1 |
| chr1_-_25291475 | 1.65 |
ENST00000338888.3
ENST00000399916.1 |
RUNX3
|
runt-related transcription factor 3 |
| chr10_-_33405600 | 1.62 |
ENST00000414308.1
|
RP11-342D11.3
|
RP11-342D11.3 |
| chr11_+_59824060 | 1.62 |
ENST00000395032.2
ENST00000358152.2 |
MS4A3
|
membrane-spanning 4-domains, subfamily A, member 3 (hematopoietic cell-specific) |
| chr2_+_149402989 | 1.61 |
ENST00000397424.2
|
EPC2
|
enhancer of polycomb homolog 2 (Drosophila) |
| chr6_-_25042231 | 1.61 |
ENST00000510784.2
|
FAM65B
|
family with sequence similarity 65, member B |
| chr7_+_80253387 | 1.60 |
ENST00000438020.1
|
CD36
|
CD36 molecule (thrombospondin receptor) |
| chrX_+_37639302 | 1.59 |
ENST00000545017.1
ENST00000536160.1 |
CYBB
|
cytochrome b-245, beta polypeptide |
| chrX_+_107288280 | 1.59 |
ENST00000458383.1
|
VSIG1
|
V-set and immunoglobulin domain containing 1 |
| chr20_+_42523336 | 1.59 |
ENST00000428529.1
|
RP5-1030M6.3
|
RP5-1030M6.3 |
| chr5_-_39219641 | 1.59 |
ENST00000509072.1
ENST00000504542.1 ENST00000505428.1 ENST00000506557.1 |
FYB
|
FYN binding protein |
| chr15_+_80351910 | 1.59 |
ENST00000261749.6
ENST00000561060.1 |
ZFAND6
|
zinc finger, AN1-type domain 6 |
| chr2_-_89327228 | 1.59 |
ENST00000483158.1
|
IGKV3-11
|
immunoglobulin kappa variable 3-11 |
| chr4_-_120243545 | 1.59 |
ENST00000274024.3
|
FABP2
|
fatty acid binding protein 2, intestinal |
| chr12_+_64798826 | 1.58 |
ENST00000540203.1
|
XPOT
|
exportin, tRNA |
| chr1_+_74701062 | 1.58 |
ENST00000326637.3
|
TNNI3K
|
TNNI3 interacting kinase |
| chr13_+_78315295 | 1.57 |
ENST00000351546.3
|
SLAIN1
|
SLAIN motif family, member 1 |
| chr14_+_22615942 | 1.57 |
ENST00000390457.2
|
TRAV27
|
T cell receptor alpha variable 27 |
| chr4_+_26324474 | 1.56 |
ENST00000514675.1
|
RBPJ
|
recombination signal binding protein for immunoglobulin kappa J region |
| chr14_+_39944025 | 1.55 |
ENST00000554328.1
ENST00000556620.1 ENST00000557197.1 |
RP11-111A21.1
|
RP11-111A21.1 |
| chr14_+_22180536 | 1.54 |
ENST00000390424.2
|
TRAV2
|
T cell receptor alpha variable 2 |
| chr1_+_81106951 | 1.54 |
ENST00000443565.1
|
RP5-887A10.1
|
RP5-887A10.1 |
| chr14_+_22987424 | 1.53 |
ENST00000390511.1
|
TRAJ26
|
T cell receptor alpha joining 26 |
| chr6_+_26199737 | 1.51 |
ENST00000359985.1
|
HIST1H2BF
|
histone cluster 1, H2bf |
| chr8_+_28748765 | 1.51 |
ENST00000355231.5
|
HMBOX1
|
homeobox containing 1 |
| chr3_-_18480173 | 1.50 |
ENST00000414509.1
|
SATB1
|
SATB homeobox 1 |
| chr3_-_18480260 | 1.49 |
ENST00000454909.2
|
SATB1
|
SATB homeobox 1 |
| chr4_-_89442940 | 1.49 |
ENST00000527353.1
|
PIGY
|
phosphatidylinositol glycan anchor biosynthesis, class Y |
| chr5_-_150473127 | 1.49 |
ENST00000521001.1
|
TNIP1
|
TNFAIP3 interacting protein 1 |
| chr8_+_42873548 | 1.47 |
ENST00000533338.1
ENST00000534420.1 |
HOOK3
RP11-598P20.5
|
hook microtubule-tethering protein 3 Uncharacterized protein |
| chr18_+_61554932 | 1.46 |
ENST00000299502.4
ENST00000457692.1 ENST00000413956.1 |
SERPINB2
|
serpin peptidase inhibitor, clade B (ovalbumin), member 2 |
| chr20_-_7238861 | 1.46 |
ENST00000428954.1
|
RP11-19D2.1
|
RP11-19D2.1 |
| chr3_-_178103144 | 1.46 |
ENST00000417383.1
ENST00000418585.1 ENST00000411727.1 ENST00000439810.1 |
RP11-33A14.1
|
RP11-33A14.1 |
| chr12_-_10605929 | 1.45 |
ENST00000347831.5
ENST00000359151.3 |
KLRC1
|
killer cell lectin-like receptor subfamily C, member 1 |
| chr3_-_141747950 | 1.45 |
ENST00000497579.1
|
TFDP2
|
transcription factor Dp-2 (E2F dimerization partner 2) |
| chr4_+_71384257 | 1.44 |
ENST00000339336.4
|
AMTN
|
amelotin |
| chr11_+_59824127 | 1.42 |
ENST00000278865.3
|
MS4A3
|
membrane-spanning 4-domains, subfamily A, member 3 (hematopoietic cell-specific) |
| chr3_+_186692745 | 1.42 |
ENST00000438590.1
|
ST6GAL1
|
ST6 beta-galactosamide alpha-2,6-sialyltranferase 1 |
| chr6_-_9933500 | 1.42 |
ENST00000492169.1
|
OFCC1
|
orofacial cleft 1 candidate 1 |
| chr6_-_32784687 | 1.40 |
ENST00000447394.1
ENST00000438763.2 |
HLA-DOB
|
major histocompatibility complex, class II, DO beta |
| chr2_+_204571198 | 1.40 |
ENST00000374481.3
ENST00000458610.2 ENST00000324106.8 |
CD28
|
CD28 molecule |
| chr12_-_56693758 | 1.39 |
ENST00000547298.1
ENST00000551936.1 ENST00000551253.1 ENST00000551473.1 |
CS
|
citrate synthase |
| chr14_+_22433675 | 1.39 |
ENST00000390442.3
|
TRAV12-3
|
T cell receptor alpha variable 12-3 |
| chr15_-_98836406 | 1.39 |
ENST00000560360.1
|
CTD-2544M6.1
|
CTD-2544M6.1 |
| chr12_+_56325231 | 1.38 |
ENST00000549368.1
|
DGKA
|
diacylglycerol kinase, alpha 80kDa |
| chr14_+_61654271 | 1.38 |
ENST00000555185.1
ENST00000557294.1 ENST00000556778.1 |
PRKCH
|
protein kinase C, eta |
| chr9_+_12693336 | 1.37 |
ENST00000381137.2
ENST00000388918.5 |
TYRP1
|
tyrosinase-related protein 1 |
| chr19_-_46088068 | 1.37 |
ENST00000263275.4
ENST00000323060.3 |
OPA3
|
optic atrophy 3 (autosomal recessive, with chorea and spastic paraplegia) |
| chr5_-_147286065 | 1.37 |
ENST00000318315.4
ENST00000515291.1 |
C5orf46
|
chromosome 5 open reading frame 46 |
| chr4_-_89205705 | 1.36 |
ENST00000295908.7
ENST00000510548.2 ENST00000508256.1 |
PPM1K
|
protein phosphatase, Mg2+/Mn2+ dependent, 1K |
| chr14_+_32798547 | 1.36 |
ENST00000557354.1
ENST00000557102.1 ENST00000557272.1 |
AKAP6
|
A kinase (PRKA) anchor protein 6 |
| chr2_+_152214098 | 1.36 |
ENST00000243347.3
|
TNFAIP6
|
tumor necrosis factor, alpha-induced protein 6 |
| chr17_-_38911580 | 1.35 |
ENST00000312150.4
|
KRT25
|
keratin 25 |
| chr12_+_93096619 | 1.35 |
ENST00000397833.3
|
C12orf74
|
chromosome 12 open reading frame 74 |
| chr11_+_59856130 | 1.34 |
ENST00000278888.3
|
MS4A2
|
membrane-spanning 4-domains, subfamily A, member 2 |
| chr7_+_107110488 | 1.34 |
ENST00000304402.4
|
GPR22
|
G protein-coupled receptor 22 |
| chr4_-_76928641 | 1.34 |
ENST00000264888.5
|
CXCL9
|
chemokine (C-X-C motif) ligand 9 |
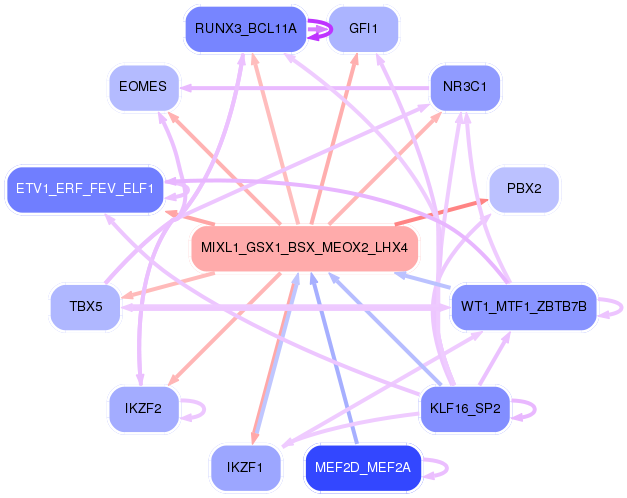
Network of associatons between targets according to the STRING database.

First level regulatory network of MIXL1_GSX1_BSX_MEOX2_LHX4
Gene Ontology Analysis
Gene overrepresentation in biological_process category:
| Log-likelihood per target | Total log-likelihood | Term | Description |
|---|---|---|---|
| 2.0 | 6.1 | GO:2001190 | positive regulation of T cell activation via T cell receptor contact with antigen bound to MHC molecule on antigen presenting cell(GO:2001190) |
| 1.7 | 10.0 | GO:1904823 | pyrimidine nucleobase transport(GO:0015855) purine nucleobase transmembrane transport(GO:1904823) |
| 1.4 | 12.9 | GO:0001920 | negative regulation of receptor recycling(GO:0001920) |
| 1.4 | 5.7 | GO:0002304 | gamma-delta intraepithelial T cell differentiation(GO:0002304) CD8-positive, gamma-delta intraepithelial T cell differentiation(GO:0002305) |
| 1.3 | 3.9 | GO:0002302 | CD8-positive, alpha-beta T cell differentiation involved in immune response(GO:0002302) |
| 1.1 | 3.2 | GO:0070105 | positive regulation of interleukin-6-mediated signaling pathway(GO:0070105) |
| 1.0 | 4.2 | GO:0050717 | positive regulation of interleukin-1 alpha secretion(GO:0050717) |
| 1.0 | 3.1 | GO:0002416 | IgG immunoglobulin transcytosis in epithelial cells mediated by FcRn immunoglobulin receptor(GO:0002416) |
| 1.0 | 4.0 | GO:0061743 | motor learning(GO:0061743) |
| 0.9 | 2.8 | GO:0002881 | negative regulation of chronic inflammatory response to non-antigenic stimulus(GO:0002881) |
| 0.9 | 2.7 | GO:0070175 | positive regulation of enamel mineralization(GO:0070175) |
| 0.8 | 4.2 | GO:2000473 | regulation of hematopoietic stem cell migration(GO:2000471) positive regulation of hematopoietic stem cell migration(GO:2000473) |
| 0.8 | 7.3 | GO:1902748 | positive regulation of lens fiber cell differentiation(GO:1902748) |
| 0.7 | 2.2 | GO:0002644 | negative regulation of tolerance induction(GO:0002644) positive regulation of interleukin-4 biosynthetic process(GO:0045404) |
| 0.7 | 2.2 | GO:0043438 | acetoacetic acid metabolic process(GO:0043438) |
| 0.7 | 2.0 | GO:0007113 | endomitotic cell cycle(GO:0007113) |
| 0.6 | 2.6 | GO:0002384 | hepatic immune response(GO:0002384) |
| 0.6 | 1.3 | GO:0038095 | Fc-epsilon receptor signaling pathway(GO:0038095) |
| 0.6 | 6.4 | GO:0002074 | extraocular skeletal muscle development(GO:0002074) |
| 0.6 | 1.9 | GO:0003218 | cardiac left ventricle formation(GO:0003218) |
| 0.6 | 2.4 | GO:0042663 | regulation of endodermal cell fate specification(GO:0042663) |
| 0.6 | 1.8 | GO:0061010 | negative regulation of transcription by transcription factor localization(GO:0010621) gall bladder development(GO:0061010) |
| 0.5 | 6.6 | GO:2000332 | blood microparticle formation(GO:0072564) regulation of blood microparticle formation(GO:2000332) positive regulation of blood microparticle formation(GO:2000334) |
| 0.5 | 3.8 | GO:1903435 | positive regulation of constitutive secretory pathway(GO:1903435) |
| 0.5 | 2.7 | GO:1904845 | response to L-glutamine(GO:1904844) cellular response to L-glutamine(GO:1904845) |
| 0.5 | 1.9 | GO:1990168 | protein K33-linked deubiquitination(GO:1990168) |
| 0.5 | 1.4 | GO:0002581 | negative regulation of antigen processing and presentation of peptide or polysaccharide antigen via MHC class II(GO:0002581) |
| 0.4 | 2.6 | GO:0002729 | positive regulation of natural killer cell cytokine production(GO:0002729) |
| 0.4 | 4.7 | GO:0042905 | 9-cis-retinoic acid biosynthetic process(GO:0042904) 9-cis-retinoic acid metabolic process(GO:0042905) |
| 0.4 | 1.3 | GO:0002528 | regulation of vascular permeability involved in acute inflammatory response(GO:0002528) |
| 0.4 | 2.4 | GO:1900169 | regulation of glucocorticoid mediated signaling pathway(GO:1900169) |
| 0.4 | 9.9 | GO:2000353 | positive regulation of endothelial cell apoptotic process(GO:2000353) |
| 0.4 | 1.5 | GO:0050883 | negative regulation of sodium:proton antiporter activity(GO:0032416) musculoskeletal movement, spinal reflex action(GO:0050883) |
| 0.4 | 3.0 | GO:0010989 | negative regulation of low-density lipoprotein particle clearance(GO:0010989) |
| 0.4 | 1.1 | GO:0006667 | sphinganine metabolic process(GO:0006667) |
| 0.4 | 5.5 | GO:0034058 | endosomal vesicle fusion(GO:0034058) |
| 0.4 | 2.9 | GO:0048769 | sarcomerogenesis(GO:0048769) |
| 0.3 | 1.0 | GO:1904897 | regulation of hepatic stellate cell proliferation(GO:1904897) positive regulation of hepatic stellate cell proliferation(GO:1904899) hepatic stellate cell proliferation(GO:1990922) |
| 0.3 | 4.3 | GO:0048304 | positive regulation of isotype switching to IgG isotypes(GO:0048304) |
| 0.3 | 2.6 | GO:1902261 | positive regulation of delayed rectifier potassium channel activity(GO:1902261) |
| 0.3 | 8.0 | GO:0071803 | positive regulation of podosome assembly(GO:0071803) |
| 0.3 | 1.2 | GO:0061357 | positive regulation of Wnt protein secretion(GO:0061357) |
| 0.3 | 1.5 | GO:0044501 | modulation of signal transduction in other organism(GO:0044501) modulation by symbiont of host signal transduction pathway(GO:0052027) modulation of signal transduction in other organism involved in symbiotic interaction(GO:0052250) modulation by symbiont of host I-kappaB kinase/NF-kappaB cascade(GO:0085032) |
| 0.3 | 2.0 | GO:0060332 | positive regulation of response to interferon-gamma(GO:0060332) positive regulation of interferon-gamma-mediated signaling pathway(GO:0060335) |
| 0.3 | 0.6 | GO:0070054 | mRNA splicing via endonucleolytic cleavage and ligation involved in unfolded protein response(GO:0030969) mRNA splicing, via endonucleolytic cleavage and ligation(GO:0070054) mRNA endonucleolytic cleavage involved in unfolded protein response(GO:0070055) |
| 0.3 | 1.1 | GO:0090219 | negative regulation of lipid kinase activity(GO:0090219) |
| 0.3 | 4.1 | GO:0090091 | positive regulation of extracellular matrix disassembly(GO:0090091) |
| 0.3 | 1.1 | GO:0010909 | regulation of heparan sulfate proteoglycan biosynthetic process(GO:0010908) positive regulation of heparan sulfate proteoglycan biosynthetic process(GO:0010909) canonical Wnt signaling pathway involved in positive regulation of epithelial to mesenchymal transition(GO:0044334) positive regulation of proteoglycan biosynthetic process(GO:1902730) |
| 0.3 | 1.0 | GO:0021847 | ventricular zone neuroblast division(GO:0021847) |
| 0.2 | 4.5 | GO:0046085 | adenosine metabolic process(GO:0046085) |
| 0.2 | 2.2 | GO:0043402 | glucocorticoid mediated signaling pathway(GO:0043402) |
| 0.2 | 1.0 | GO:0006422 | aspartyl-tRNA aminoacylation(GO:0006422) |
| 0.2 | 1.9 | GO:1905066 | positive regulation of ephrin receptor signaling pathway(GO:1901189) regulation of canonical Wnt signaling pathway involved in cardiac muscle cell fate commitment(GO:1901295) positive regulation of canonical Wnt signaling pathway involved in cardiac muscle cell fate commitment(GO:1901297) regulation of canonical Wnt signaling pathway involved in heart development(GO:1905066) positive regulation of canonical Wnt signaling pathway involved in heart development(GO:1905068) |
| 0.2 | 1.0 | GO:1990737 | response to manganese-induced endoplasmic reticulum stress(GO:1990737) |
| 0.2 | 1.2 | GO:0035513 | oxidative RNA demethylation(GO:0035513) oxidative single-stranded RNA demethylation(GO:0035553) |
| 0.2 | 0.9 | GO:1903566 | positive regulation of protein localization to cilium(GO:1903566) |
| 0.2 | 0.7 | GO:1902997 | regulation of choline O-acetyltransferase activity(GO:1902769) positive regulation of choline O-acetyltransferase activity(GO:1902771) negative regulation of tau-protein kinase activity(GO:1902948) positive regulation of early endosome to recycling endosome transport(GO:1902955) negative regulation of aspartic-type endopeptidase activity involved in amyloid precursor protein catabolic process(GO:1902960) negative regulation of neurofibrillary tangle assembly(GO:1902997) negative regulation of aspartic-type peptidase activity(GO:1905246) |
| 0.2 | 0.7 | GO:1990637 | response to prolactin(GO:1990637) |
| 0.2 | 1.1 | GO:0090402 | oncogene-induced cell senescence(GO:0090402) |
| 0.2 | 2.0 | GO:0090063 | positive regulation of microtubule nucleation(GO:0090063) |
| 0.2 | 2.0 | GO:1900623 | regulation of monocyte aggregation(GO:1900623) positive regulation of monocyte aggregation(GO:1900625) |
| 0.2 | 0.9 | GO:0043456 | regulation of pentose-phosphate shunt(GO:0043456) |
| 0.2 | 0.6 | GO:1904211 | membrane protein proteolysis involved in retrograde protein transport, ER to cytosol(GO:1904211) |
| 0.2 | 2.7 | GO:0043950 | positive regulation of cAMP-mediated signaling(GO:0043950) |
| 0.2 | 1.5 | GO:0022027 | interkinetic nuclear migration(GO:0022027) |
| 0.2 | 0.8 | GO:0097068 | response to thyroxine(GO:0097068) response to L-phenylalanine derivative(GO:1904386) |
| 0.2 | 2.1 | GO:0097338 | response to clozapine(GO:0097338) |
| 0.2 | 1.6 | GO:2000158 | positive regulation of ubiquitin-specific protease activity(GO:2000158) |
| 0.2 | 1.2 | GO:0018032 | protein amidation(GO:0018032) |
| 0.2 | 2.8 | GO:0072718 | response to cisplatin(GO:0072718) |
| 0.2 | 0.6 | GO:0001694 | histamine biosynthetic process(GO:0001694) |
| 0.2 | 2.9 | GO:0090160 | Golgi to lysosome transport(GO:0090160) |
| 0.2 | 0.8 | GO:2001023 | regulation of response to drug(GO:2001023) |
| 0.2 | 4.0 | GO:0090050 | positive regulation of cell migration involved in sprouting angiogenesis(GO:0090050) |
| 0.2 | 1.1 | GO:0050916 | sensory perception of sweet taste(GO:0050916) |
| 0.2 | 0.2 | GO:2000253 | positive regulation of feeding behavior(GO:2000253) |
| 0.2 | 1.3 | GO:0071672 | regulation of muscle hyperplasia(GO:0014738) muscle hyperplasia(GO:0014900) negative regulation of smooth muscle cell chemotaxis(GO:0071672) |
| 0.2 | 1.3 | GO:0071461 | cellular response to redox state(GO:0071461) |
| 0.2 | 0.6 | GO:0006478 | peptidyl-tyrosine sulfation(GO:0006478) |
| 0.2 | 0.9 | GO:0033615 | mitochondrial proton-transporting ATP synthase complex assembly(GO:0033615) |
| 0.2 | 5.3 | GO:0097067 | cellular response to thyroid hormone stimulus(GO:0097067) |
| 0.2 | 1.5 | GO:1905150 | regulation of voltage-gated sodium channel activity(GO:1905150) |
| 0.2 | 0.5 | GO:0006258 | UDP-glucose catabolic process(GO:0006258) |
| 0.2 | 0.2 | GO:0003352 | regulation of cilium movement(GO:0003352) regulation of cilium beat frequency(GO:0003356) regulation of microtubule-based movement(GO:0060632) |
| 0.2 | 0.5 | GO:0060345 | regulation of transcription from RNA polymerase II promoter in response to iron(GO:0034395) spleen trabecula formation(GO:0060345) iron cation export(GO:1903414) ferrous iron export(GO:1903988) |
| 0.2 | 1.1 | GO:0035063 | nuclear speck organization(GO:0035063) |
| 0.2 | 1.9 | GO:0007168 | receptor guanylyl cyclase signaling pathway(GO:0007168) |
| 0.2 | 0.7 | GO:0006480 | N-terminal protein amino acid methylation(GO:0006480) |
| 0.2 | 0.7 | GO:0045209 | MAPK phosphatase export from nucleus(GO:0045208) MAPK phosphatase export from nucleus, leptomycin B sensitive(GO:0045209) |
| 0.2 | 0.5 | GO:0090467 | L-arginine import(GO:0043091) arginine import(GO:0090467) |
| 0.2 | 0.2 | GO:0014835 | myoblast differentiation involved in skeletal muscle regeneration(GO:0014835) |
| 0.2 | 0.7 | GO:0019417 | sulfur oxidation(GO:0019417) |
| 0.2 | 2.4 | GO:0032876 | negative regulation of DNA endoreduplication(GO:0032876) |
| 0.2 | 1.4 | GO:0034350 | regulation of glial cell apoptotic process(GO:0034350) negative regulation of glial cell apoptotic process(GO:0034351) |
| 0.2 | 0.5 | GO:0010735 | positive regulation of transcription via serum response element binding(GO:0010735) |
| 0.2 | 0.5 | GO:1905133 | metaphase/anaphase transition of meiotic cell cycle(GO:0044785) regulation of metaphase/anaphase transition of meiotic cell cycle(GO:1902102) negative regulation of metaphase/anaphase transition of meiotic cell cycle(GO:1902103) regulation of meiotic chromosome separation(GO:1905132) negative regulation of meiotic chromosome separation(GO:1905133) |
| 0.2 | 5.4 | GO:0072643 | interferon-gamma secretion(GO:0072643) |
| 0.2 | 3.0 | GO:0043374 | CD8-positive, alpha-beta T cell differentiation(GO:0043374) |
| 0.2 | 2.0 | GO:0032071 | regulation of endodeoxyribonuclease activity(GO:0032071) |
| 0.2 | 0.5 | GO:1901876 | regulation of calcium ion binding(GO:1901876) negative regulation of calcium ion binding(GO:1901877) |
| 0.2 | 5.5 | GO:0050860 | negative regulation of T cell receptor signaling pathway(GO:0050860) |
| 0.2 | 0.6 | GO:0001831 | trophectodermal cellular morphogenesis(GO:0001831) |
| 0.2 | 0.9 | GO:2001106 | regulation of Rho guanyl-nucleotide exchange factor activity(GO:2001106) |
| 0.2 | 0.3 | GO:0090149 | mitochondrial membrane fission(GO:0090149) |
| 0.2 | 0.8 | GO:1901545 | cellular response to raffinose(GO:0097403) response to raffinose(GO:1901545) |
| 0.2 | 0.8 | GO:0061502 | uropod organization(GO:0032796) early endosome to recycling endosome transport(GO:0061502) |
| 0.2 | 5.0 | GO:0007095 | mitotic G2 DNA damage checkpoint(GO:0007095) |
| 0.2 | 2.0 | GO:0060665 | regulation of branching involved in salivary gland morphogenesis by mesenchymal-epithelial signaling(GO:0060665) |
| 0.2 | 1.7 | GO:0098735 | positive regulation of the force of heart contraction(GO:0098735) |
| 0.2 | 0.6 | GO:0046338 | phosphatidylethanolamine catabolic process(GO:0046338) |
| 0.2 | 0.8 | GO:0048496 | maintenance of organ identity(GO:0048496) |
| 0.2 | 0.5 | GO:0033364 | mast cell secretory granule organization(GO:0033364) |
| 0.2 | 1.2 | GO:0010746 | regulation of plasma membrane long-chain fatty acid transport(GO:0010746) negative regulation of plasma membrane long-chain fatty acid transport(GO:0010748) |
| 0.2 | 6.8 | GO:0009954 | proximal/distal pattern formation(GO:0009954) |
| 0.1 | 1.0 | GO:0003138 | primary heart field specification(GO:0003138) sinoatrial valve development(GO:0003172) sinoatrial valve morphogenesis(GO:0003185) |
| 0.1 | 0.6 | GO:0003292 | cardiac septum cell differentiation(GO:0003292) atrioventricular node cell differentiation(GO:0060922) atrioventricular node cell development(GO:0060928) |
| 0.1 | 0.3 | GO:0048633 | positive regulation of skeletal muscle tissue growth(GO:0048633) |
| 0.1 | 0.8 | GO:0010813 | neuropeptide catabolic process(GO:0010813) substance P catabolic process(GO:0010814) calcitonin catabolic process(GO:0010816) endothelin maturation(GO:0034959) |
| 0.1 | 0.3 | GO:0090427 | activation of meiosis(GO:0090427) |
| 0.1 | 0.4 | GO:1905000 | regulation of membrane repolarization during atrial cardiac muscle cell action potential(GO:1905000) |
| 0.1 | 1.1 | GO:0032483 | regulation of Rab protein signal transduction(GO:0032483) |
| 0.1 | 0.8 | GO:0051541 | elastin metabolic process(GO:0051541) |
| 0.1 | 1.6 | GO:0006537 | glutamate biosynthetic process(GO:0006537) |
| 0.1 | 0.5 | GO:0030821 | negative regulation of cyclic nucleotide catabolic process(GO:0030806) negative regulation of cAMP catabolic process(GO:0030821) negative regulation of purine nucleotide catabolic process(GO:0033122) |
| 0.1 | 0.4 | GO:0019230 | proprioception(GO:0019230) |
| 0.1 | 2.4 | GO:0043517 | positive regulation of DNA damage response, signal transduction by p53 class mediator(GO:0043517) |
| 0.1 | 1.7 | GO:0030091 | protein repair(GO:0030091) |
| 0.1 | 0.8 | GO:0010752 | regulation of cGMP-mediated signaling(GO:0010752) |
| 0.1 | 1.3 | GO:0048743 | positive regulation of skeletal muscle fiber development(GO:0048743) |
| 0.1 | 0.6 | GO:0042421 | norepinephrine biosynthetic process(GO:0042421) |
| 0.1 | 1.1 | GO:0070269 | pyroptosis(GO:0070269) |
| 0.1 | 0.4 | GO:1904428 | negative regulation of tubulin deacetylation(GO:1904428) |
| 0.1 | 0.9 | GO:0030200 | heparan sulfate proteoglycan catabolic process(GO:0030200) |
| 0.1 | 2.0 | GO:0043249 | erythrocyte maturation(GO:0043249) |
| 0.1 | 0.4 | GO:0002194 | hepatocyte cell migration(GO:0002194) otic placode formation(GO:0043049) branching involved in pancreas morphogenesis(GO:0061114) acinar cell differentiation(GO:0090425) positive regulation of forebrain neuron differentiation(GO:2000979) |
| 0.1 | 3.0 | GO:0042832 | defense response to protozoan(GO:0042832) |
| 0.1 | 3.3 | GO:0030220 | platelet formation(GO:0030220) |
| 0.1 | 0.6 | GO:0002322 | B cell proliferation involved in immune response(GO:0002322) |
| 0.1 | 0.5 | GO:0009236 | cobalamin biosynthetic process(GO:0009236) |
| 0.1 | 0.9 | GO:0070424 | regulation of nucleotide-binding oligomerization domain containing signaling pathway(GO:0070424) |
| 0.1 | 0.5 | GO:0036292 | DNA rewinding(GO:0036292) |
| 0.1 | 1.0 | GO:0046952 | ketone body catabolic process(GO:0046952) |
| 0.1 | 0.2 | GO:1900365 | positive regulation of mRNA polyadenylation(GO:1900365) |
| 0.1 | 2.2 | GO:0007379 | segment specification(GO:0007379) |
| 0.1 | 0.4 | GO:1903674 | regulation of cap-dependent translational initiation(GO:1903674) positive regulation of cap-dependent translational initiation(GO:1903676) |
| 0.1 | 3.1 | GO:0030277 | maintenance of gastrointestinal epithelium(GO:0030277) |
| 0.1 | 0.3 | GO:0006173 | dADP biosynthetic process(GO:0006173) |
| 0.1 | 1.8 | GO:0060605 | tube lumen cavitation(GO:0060605) salivary gland cavitation(GO:0060662) |
| 0.1 | 1.8 | GO:1902894 | negative regulation of pri-miRNA transcription from RNA polymerase II promoter(GO:1902894) |
| 0.1 | 0.5 | GO:0006556 | S-adenosylmethionine biosynthetic process(GO:0006556) |
| 0.1 | 0.7 | GO:0051970 | negative regulation of transmission of nerve impulse(GO:0051970) |
| 0.1 | 0.9 | GO:0050653 | chondroitin sulfate proteoglycan biosynthetic process, polysaccharide chain biosynthetic process(GO:0050653) |
| 0.1 | 1.2 | GO:0061087 | positive regulation of histone H3-K27 methylation(GO:0061087) |
| 0.1 | 2.7 | GO:1902083 | negative regulation of peptidyl-cysteine S-nitrosylation(GO:1902083) |
| 0.1 | 21.2 | GO:0002377 | immunoglobulin production(GO:0002377) |
| 0.1 | 0.3 | GO:0010700 | negative regulation of norepinephrine secretion(GO:0010700) |
| 0.1 | 0.7 | GO:0061484 | hematopoietic stem cell homeostasis(GO:0061484) |
| 0.1 | 0.5 | GO:0006668 | sphinganine-1-phosphate metabolic process(GO:0006668) |
| 0.1 | 1.0 | GO:0061734 | parkin-mediated mitophagy in response to mitochondrial depolarization(GO:0061734) |
| 0.1 | 0.6 | GO:0008343 | adult feeding behavior(GO:0008343) |
| 0.1 | 0.3 | GO:0060304 | regulation of phosphatidylinositol dephosphorylation(GO:0060304) |
| 0.1 | 0.5 | GO:0042539 | hypotonic salinity response(GO:0042539) cellular hypotonic salinity response(GO:0071477) |
| 0.1 | 0.7 | GO:0051697 | protein delipidation(GO:0051697) |
| 0.1 | 0.3 | GO:0030327 | prenylated protein catabolic process(GO:0030327) |
| 0.1 | 0.9 | GO:1902952 | positive regulation of dendritic spine maintenance(GO:1902952) regulation of transcription from RNA polymerase II promoter by histone modification(GO:1903756) negative regulation of transcription from RNA polymerase II promoter by histone modification(GO:1903758) |
| 0.1 | 0.4 | GO:1901846 | positive regulation of cell communication by electrical coupling involved in cardiac conduction(GO:1901846) |
| 0.1 | 0.9 | GO:1904885 | beta-catenin destruction complex assembly(GO:1904885) |
| 0.1 | 0.8 | GO:0070973 | protein localization to endoplasmic reticulum exit site(GO:0070973) |
| 0.1 | 0.6 | GO:0034146 | toll-like receptor 5 signaling pathway(GO:0034146) |
| 0.1 | 2.1 | GO:1901741 | positive regulation of myoblast fusion(GO:1901741) |
| 0.1 | 0.3 | GO:1902544 | regulation of DNA N-glycosylase activity(GO:1902544) |
| 0.1 | 7.7 | GO:0034260 | negative regulation of GTPase activity(GO:0034260) |
| 0.1 | 0.2 | GO:0051387 | negative regulation of icosanoid secretion(GO:0032304) negative regulation of neurotrophin TRK receptor signaling pathway(GO:0051387) |
| 0.1 | 1.8 | GO:0019371 | cyclooxygenase pathway(GO:0019371) |
| 0.1 | 1.1 | GO:0090204 | protein localization to nuclear pore(GO:0090204) |
| 0.1 | 0.5 | GO:0001555 | oocyte growth(GO:0001555) |
| 0.1 | 2.8 | GO:0050908 | detection of light stimulus involved in visual perception(GO:0050908) detection of light stimulus involved in sensory perception(GO:0050962) |
| 0.1 | 0.7 | GO:0035413 | positive regulation of catenin import into nucleus(GO:0035413) |
| 0.1 | 2.7 | GO:0034310 | primary alcohol catabolic process(GO:0034310) |
| 0.1 | 0.4 | GO:0000354 | cis assembly of pre-catalytic spliceosome(GO:0000354) |
| 0.1 | 0.3 | GO:0018076 | N-terminal peptidyl-lysine acetylation(GO:0018076) |
| 0.1 | 0.6 | GO:0030950 | establishment or maintenance of actin cytoskeleton polarity(GO:0030950) |
| 0.1 | 1.9 | GO:0055003 | cardiac myofibril assembly(GO:0055003) |
| 0.1 | 1.5 | GO:0070863 | positive regulation of protein exit from endoplasmic reticulum(GO:0070863) |
| 0.1 | 0.5 | GO:0030038 | contractile actin filament bundle assembly(GO:0030038) stress fiber assembly(GO:0043149) |
| 0.1 | 3.0 | GO:0045730 | respiratory burst(GO:0045730) |
| 0.1 | 0.9 | GO:0071963 | establishment or maintenance of cell polarity regulating cell shape(GO:0071963) |
| 0.1 | 1.6 | GO:0030207 | chondroitin sulfate catabolic process(GO:0030207) dermatan sulfate biosynthetic process(GO:0030208) |
| 0.1 | 1.4 | GO:0060155 | platelet dense granule organization(GO:0060155) |
| 0.1 | 0.8 | GO:0071233 | cellular response to leucine(GO:0071233) |
| 0.1 | 8.0 | GO:0002292 | T cell differentiation involved in immune response(GO:0002292) |
| 0.1 | 2.7 | GO:0071108 | protein K48-linked deubiquitination(GO:0071108) |
| 0.1 | 0.2 | GO:0090271 | positive regulation of fibroblast growth factor production(GO:0090271) |
| 0.1 | 1.0 | GO:0044539 | long-chain fatty acid import(GO:0044539) |
| 0.1 | 0.2 | GO:0032903 | viral protein processing(GO:0019082) regulation of nerve growth factor production(GO:0032903) negative regulation of nerve growth factor production(GO:0032904) dibasic protein processing(GO:0090472) |
| 0.1 | 0.3 | GO:0007079 | mitotic chromosome movement towards spindle pole(GO:0007079) |
| 0.1 | 0.5 | GO:0010650 | positive regulation of cell communication by electrical coupling(GO:0010650) maintenance of protein location in membrane(GO:0072658) maintenance of protein location in plasma membrane(GO:0072660) positive regulation of membrane depolarization during cardiac muscle cell action potential(GO:1900827) |
| 0.1 | 0.6 | GO:0071896 | protein localization to adherens junction(GO:0071896) |
| 0.1 | 2.1 | GO:0045109 | intermediate filament organization(GO:0045109) |
| 0.1 | 0.6 | GO:0036438 | maintenance of lens transparency(GO:0036438) |
| 0.1 | 1.0 | GO:0045741 | positive regulation of epidermal growth factor-activated receptor activity(GO:0045741) |
| 0.1 | 1.1 | GO:0035331 | negative regulation of hippo signaling(GO:0035331) |
| 0.1 | 0.3 | GO:0030573 | bile acid catabolic process(GO:0030573) |
| 0.1 | 1.8 | GO:0007064 | mitotic sister chromatid cohesion(GO:0007064) |
| 0.1 | 0.5 | GO:0032740 | positive regulation of interleukin-17 production(GO:0032740) |
| 0.1 | 0.2 | GO:1904798 | positive regulation of core promoter binding(GO:1904798) |
| 0.1 | 0.6 | GO:0039663 | fusion of virus membrane with host plasma membrane(GO:0019064) membrane fusion involved in viral entry into host cell(GO:0039663) multi-organism membrane fusion(GO:0044800) |
| 0.1 | 0.2 | GO:0061582 | colon epithelial cell migration(GO:0061580) intestinal epithelial cell migration(GO:0061582) |
| 0.1 | 0.4 | GO:0030643 | cellular phosphate ion homeostasis(GO:0030643) cellular trivalent inorganic anion homeostasis(GO:0072502) |
| 0.1 | 2.3 | GO:0046339 | diacylglycerol metabolic process(GO:0046339) |
| 0.1 | 0.2 | GO:2000296 | negative regulation of hydrogen peroxide catabolic process(GO:2000296) |
| 0.1 | 0.1 | GO:0061009 | common bile duct development(GO:0061009) |
| 0.1 | 0.1 | GO:0061732 | mitochondrial acetyl-CoA biosynthetic process from pyruvate(GO:0061732) |
| 0.1 | 0.6 | GO:0007296 | vitellogenesis(GO:0007296) |
| 0.1 | 0.2 | GO:1904562 | phosphatidylinositol 5-phosphate metabolic process(GO:1904562) |
| 0.1 | 0.6 | GO:0033353 | S-adenosylmethionine cycle(GO:0033353) |
| 0.1 | 0.2 | GO:0044828 | negative regulation by host of viral genome replication(GO:0044828) |
| 0.1 | 0.1 | GO:0022615 | protein to membrane docking(GO:0022615) |
| 0.1 | 0.6 | GO:1904970 | brush border assembly(GO:1904970) |
| 0.1 | 1.2 | GO:0000338 | protein deneddylation(GO:0000338) |
| 0.1 | 0.4 | GO:1903265 | positive regulation of tumor necrosis factor-mediated signaling pathway(GO:1903265) |
| 0.1 | 1.1 | GO:0002430 | complement receptor mediated signaling pathway(GO:0002430) |
| 0.1 | 0.3 | GO:0019442 | tryptophan catabolic process to acetyl-CoA(GO:0019442) |
| 0.1 | 0.6 | GO:1903551 | regulation of extracellular exosome assembly(GO:1903551) |
| 0.1 | 0.7 | GO:2001300 | lipoxin metabolic process(GO:2001300) |
| 0.1 | 0.3 | GO:0000117 | regulation of transcription involved in G2/M transition of mitotic cell cycle(GO:0000117) |
| 0.1 | 1.1 | GO:0090026 | positive regulation of monocyte chemotaxis(GO:0090026) |
| 0.1 | 0.3 | GO:0042357 | thiamine diphosphate metabolic process(GO:0042357) |
| 0.1 | 0.5 | GO:1903826 | arginine transmembrane transport(GO:1903826) |
| 0.1 | 0.2 | GO:0071418 | cellular response to amine stimulus(GO:0071418) |
| 0.1 | 0.5 | GO:0070475 | rRNA base methylation(GO:0070475) |
| 0.1 | 2.2 | GO:0009083 | branched-chain amino acid catabolic process(GO:0009083) |
| 0.1 | 0.4 | GO:0048733 | sebaceous gland development(GO:0048733) |
| 0.1 | 0.3 | GO:0072709 | cellular response to sorbitol(GO:0072709) |
| 0.1 | 1.8 | GO:0032098 | regulation of appetite(GO:0032098) |
| 0.1 | 1.0 | GO:0048739 | cardiac muscle fiber development(GO:0048739) |
| 0.1 | 4.7 | GO:0006120 | mitochondrial electron transport, NADH to ubiquinone(GO:0006120) |
| 0.1 | 0.5 | GO:0035690 | cellular response to drug(GO:0035690) |
| 0.1 | 1.6 | GO:0086069 | bundle of His cell to Purkinje myocyte communication(GO:0086069) |
| 0.1 | 0.2 | GO:1904116 | response to vasopressin(GO:1904116) cellular response to vasopressin(GO:1904117) |
| 0.1 | 0.4 | GO:1904381 | Golgi apparatus mannose trimming(GO:1904381) |
| 0.1 | 0.8 | GO:0046007 | negative regulation of activated T cell proliferation(GO:0046007) |
| 0.1 | 0.8 | GO:0001867 | complement activation, lectin pathway(GO:0001867) |
| 0.1 | 0.8 | GO:0070257 | positive regulation of mucus secretion(GO:0070257) |
| 0.1 | 0.4 | GO:0016098 | monoterpenoid metabolic process(GO:0016098) |
| 0.1 | 0.4 | GO:0090234 | regulation of kinetochore assembly(GO:0090234) |
| 0.1 | 0.4 | GO:0001676 | long-chain fatty acid metabolic process(GO:0001676) |
| 0.1 | 0.2 | GO:0032803 | regulation of low-density lipoprotein particle receptor catabolic process(GO:0032803) negative regulation of low-density lipoprotein particle receptor catabolic process(GO:0032804) |
| 0.1 | 0.3 | GO:0010157 | response to chlorate(GO:0010157) |
| 0.1 | 0.2 | GO:0002399 | MHC class II protein complex assembly(GO:0002399) |
| 0.1 | 0.3 | GO:0002767 | immune response-inhibiting cell surface receptor signaling pathway(GO:0002767) |
| 0.1 | 0.2 | GO:0051598 | meiotic recombination checkpoint(GO:0051598) |
| 0.1 | 0.7 | GO:0071600 | otic vesicle morphogenesis(GO:0071600) |
| 0.1 | 0.2 | GO:0051902 | negative regulation of mitochondrial depolarization(GO:0051902) |
| 0.1 | 0.5 | GO:0035898 | parathyroid hormone secretion(GO:0035898) post-embryonic body morphogenesis(GO:0040032) regulation of parathyroid hormone secretion(GO:2000828) |
| 0.1 | 0.4 | GO:0019236 | response to pheromone(GO:0019236) |
| 0.1 | 0.8 | GO:0048280 | vesicle fusion with Golgi apparatus(GO:0048280) |
| 0.1 | 0.2 | GO:1904647 | response to rotenone(GO:1904647) |
| 0.1 | 0.4 | GO:0010025 | wax biosynthetic process(GO:0010025) wax metabolic process(GO:0010166) |
| 0.1 | 0.8 | GO:0048227 | plasma membrane to endosome transport(GO:0048227) |
| 0.1 | 0.4 | GO:0051012 | microtubule sliding(GO:0051012) |
| 0.1 | 1.4 | GO:0006054 | N-acetylneuraminate metabolic process(GO:0006054) |
| 0.1 | 0.6 | GO:0098779 | mitophagy in response to mitochondrial depolarization(GO:0098779) |
| 0.1 | 3.4 | GO:0006910 | phagocytosis, recognition(GO:0006910) |
| 0.1 | 2.3 | GO:0000083 | regulation of transcription involved in G1/S transition of mitotic cell cycle(GO:0000083) |
| 0.1 | 0.1 | GO:0003331 | regulation of extracellular matrix constituent secretion(GO:0003330) positive regulation of extracellular matrix constituent secretion(GO:0003331) |
| 0.1 | 1.9 | GO:0006625 | protein targeting to peroxisome(GO:0006625) protein localization to peroxisome(GO:0072662) establishment of protein localization to peroxisome(GO:0072663) |
| 0.1 | 4.3 | GO:0042059 | negative regulation of epidermal growth factor receptor signaling pathway(GO:0042059) |
| 0.1 | 1.0 | GO:0060397 | JAK-STAT cascade involved in growth hormone signaling pathway(GO:0060397) |
| 0.1 | 1.3 | GO:0048934 | peripheral nervous system neuron differentiation(GO:0048934) peripheral nervous system neuron development(GO:0048935) |
| 0.1 | 0.5 | GO:2000774 | positive regulation of cellular senescence(GO:2000774) |
| 0.1 | 2.1 | GO:0046856 | phosphatidylinositol dephosphorylation(GO:0046856) |
| 0.1 | 0.6 | GO:0048003 | antigen processing and presentation of lipid antigen via MHC class Ib(GO:0048003) antigen processing and presentation, exogenous lipid antigen via MHC class Ib(GO:0048007) |
| 0.0 | 0.2 | GO:1900148 | Schwann cell proliferation involved in axon regeneration(GO:0014011) negative regulation of Schwann cell migration(GO:1900148) regulation of Schwann cell proliferation involved in axon regeneration(GO:1905044) negative regulation of Schwann cell proliferation involved in axon regeneration(GO:1905045) |
| 0.0 | 0.3 | GO:0006627 | protein processing involved in protein targeting to mitochondrion(GO:0006627) |
| 0.0 | 0.2 | GO:0051892 | negative regulation of cardioblast differentiation(GO:0051892) regulation of cardiac muscle cell myoblast differentiation(GO:2000690) negative regulation of cardiac muscle cell myoblast differentiation(GO:2000691) |
| 0.0 | 0.6 | GO:0010668 | ectodermal cell differentiation(GO:0010668) |
| 0.0 | 0.5 | GO:0086024 | adrenergic receptor signaling pathway involved in positive regulation of heart rate(GO:0086024) |
| 0.0 | 0.2 | GO:0021779 | oligodendrocyte cell fate specification(GO:0021778) oligodendrocyte cell fate commitment(GO:0021779) glial cell fate specification(GO:0021780) |
| 0.0 | 0.3 | GO:0032233 | positive regulation of actin filament bundle assembly(GO:0032233) |
| 0.0 | 2.2 | GO:0006607 | NLS-bearing protein import into nucleus(GO:0006607) |
| 0.0 | 1.9 | GO:0010880 | regulation of release of sequestered calcium ion into cytosol by sarcoplasmic reticulum(GO:0010880) |
| 0.0 | 1.1 | GO:0045603 | positive regulation of endothelial cell differentiation(GO:0045603) |
| 0.0 | 0.5 | GO:0035965 | cardiolipin acyl-chain remodeling(GO:0035965) |
| 0.0 | 1.0 | GO:0035563 | positive regulation of chromatin binding(GO:0035563) |
| 0.0 | 2.5 | GO:0007274 | neuromuscular synaptic transmission(GO:0007274) |
| 0.0 | 0.5 | GO:0038129 | directional guidance of interneurons involved in migration from the subpallium to the cortex(GO:0021840) chemorepulsion involved in interneuron migration from the subpallium to the cortex(GO:0021842) ERBB3 signaling pathway(GO:0038129) |
| 0.0 | 0.0 | GO:0006286 | base-excision repair, base-free sugar-phosphate removal(GO:0006286) |
| 0.0 | 0.9 | GO:1903071 | positive regulation of ER-associated ubiquitin-dependent protein catabolic process(GO:1903071) |
| 0.0 | 0.1 | GO:0006288 | base-excision repair, DNA ligation(GO:0006288) |
| 0.0 | 0.1 | GO:0046013 | regulation of T cell homeostatic proliferation(GO:0046013) |
| 0.0 | 0.3 | GO:0021993 | fourth ventricle development(GO:0021592) initiation of neural tube closure(GO:0021993) |
| 0.0 | 0.3 | GO:0008063 | Toll signaling pathway(GO:0008063) |
| 0.0 | 0.8 | GO:0006295 | nucleotide-excision repair, DNA incision, 3'-to lesion(GO:0006295) |
| 0.0 | 8.1 | GO:0038094 | Fc-gamma receptor signaling pathway(GO:0038094) |
| 0.0 | 0.9 | GO:0030728 | ovulation(GO:0030728) |
| 0.0 | 0.4 | GO:0031507 | heterochromatin assembly(GO:0031507) |
| 0.0 | 0.3 | GO:0010587 | miRNA catabolic process(GO:0010587) |
| 0.0 | 1.1 | GO:0006123 | mitochondrial electron transport, cytochrome c to oxygen(GO:0006123) |
| 0.0 | 0.3 | GO:0043418 | homocysteine catabolic process(GO:0043418) |
| 0.0 | 1.5 | GO:1900087 | positive regulation of G1/S transition of mitotic cell cycle(GO:1900087) |
| 0.0 | 0.6 | GO:0035886 | vascular smooth muscle cell differentiation(GO:0035886) |
| 0.0 | 8.9 | GO:0031424 | keratinization(GO:0031424) |
| 0.0 | 0.4 | GO:0006968 | cellular defense response(GO:0006968) |
| 0.0 | 0.7 | GO:0043578 | nuclear matrix organization(GO:0043578) nuclear matrix anchoring at nuclear membrane(GO:0090292) |
| 0.0 | 0.2 | GO:0010902 | positive regulation of very-low-density lipoprotein particle remodeling(GO:0010902) |
| 0.0 | 2.1 | GO:1904837 | beta-catenin-TCF complex assembly(GO:1904837) |
| 0.0 | 0.1 | GO:0034144 | negative regulation of toll-like receptor 4 signaling pathway(GO:0034144) |
| 0.0 | 0.0 | GO:0035378 | carbon dioxide transmembrane transport(GO:0035378) |
| 0.0 | 0.3 | GO:0019722 | calcium-mediated signaling(GO:0019722) |
| 0.0 | 1.1 | GO:0001556 | oocyte maturation(GO:0001556) |
| 0.0 | 0.1 | GO:0043369 | CD4-positive or CD8-positive, alpha-beta T cell lineage commitment(GO:0043369) |
| 0.0 | 0.7 | GO:0051256 | mitotic spindle midzone assembly(GO:0051256) |
| 0.0 | 1.2 | GO:0006337 | nucleosome disassembly(GO:0006337) |
| 0.0 | 0.2 | GO:0016078 | tRNA catabolic process(GO:0016078) |
| 0.0 | 0.9 | GO:0042276 | error-prone translesion synthesis(GO:0042276) |
| 0.0 | 0.1 | GO:0060022 | hard palate development(GO:0060022) |
| 0.0 | 3.5 | GO:0042475 | odontogenesis of dentin-containing tooth(GO:0042475) |
| 0.0 | 0.7 | GO:0060009 | Sertoli cell development(GO:0060009) |
| 0.0 | 0.1 | GO:0021650 | vestibulocochlear nerve formation(GO:0021650) |
| 0.0 | 0.3 | GO:0007252 | I-kappaB phosphorylation(GO:0007252) |
| 0.0 | 0.3 | GO:0044245 | polysaccharide digestion(GO:0044245) |
| 0.0 | 1.3 | GO:0070584 | mitochondrion morphogenesis(GO:0070584) |
| 0.0 | 1.9 | GO:0002763 | positive regulation of myeloid leukocyte differentiation(GO:0002763) |
| 0.0 | 0.1 | GO:0097647 | calcitonin family receptor signaling pathway(GO:0097646) amylin receptor signaling pathway(GO:0097647) |
| 0.0 | 0.4 | GO:1900028 | negative regulation of ruffle assembly(GO:1900028) |
| 0.0 | 1.8 | GO:0071431 | tRNA export from nucleus(GO:0006409) tRNA-containing ribonucleoprotein complex export from nucleus(GO:0071431) |
| 0.0 | 0.3 | GO:0042866 | pyruvate biosynthetic process(GO:0042866) |
| 0.0 | 1.2 | GO:0042776 | mitochondrial ATP synthesis coupled proton transport(GO:0042776) |
| 0.0 | 0.5 | GO:0045947 | negative regulation of translational initiation(GO:0045947) |
| 0.0 | 0.2 | GO:0071442 | regulation of histone H3-K14 acetylation(GO:0071440) positive regulation of histone H3-K14 acetylation(GO:0071442) |
| 0.0 | 1.9 | GO:0050982 | detection of mechanical stimulus(GO:0050982) |
| 0.0 | 0.2 | GO:0061034 | olfactory bulb mitral cell layer development(GO:0061034) |
| 0.0 | 0.3 | GO:0006848 | pyruvate transport(GO:0006848) pyruvate transmembrane transport(GO:1901475) |
| 0.0 | 1.7 | GO:0038128 | ERBB2 signaling pathway(GO:0038128) |
| 0.0 | 0.3 | GO:0050869 | negative regulation of B cell activation(GO:0050869) |
| 0.0 | 0.6 | GO:0090168 | Golgi reassembly(GO:0090168) |
| 0.0 | 0.3 | GO:1900246 | positive regulation of RIG-I signaling pathway(GO:1900246) |
| 0.0 | 1.0 | GO:0043555 | regulation of translation in response to stress(GO:0043555) |
| 0.0 | 0.2 | GO:0048840 | otolith development(GO:0048840) |
| 0.0 | 0.2 | GO:0032000 | positive regulation of fatty acid beta-oxidation(GO:0032000) |
| 0.0 | 1.5 | GO:0006099 | tricarboxylic acid cycle(GO:0006099) |
| 0.0 | 0.2 | GO:0000738 | DNA catabolic process, exonucleolytic(GO:0000738) |
| 0.0 | 0.4 | GO:0016576 | histone dephosphorylation(GO:0016576) |
| 0.0 | 0.9 | GO:0035025 | positive regulation of Rho protein signal transduction(GO:0035025) |
| 0.0 | 0.3 | GO:1902455 | negative regulation of stem cell population maintenance(GO:1902455) |
| 0.0 | 0.2 | GO:0030070 | insulin processing(GO:0030070) |
| 0.0 | 0.2 | GO:0015842 | aminergic neurotransmitter loading into synaptic vesicle(GO:0015842) |
| 0.0 | 0.2 | GO:0019348 | dolichol metabolic process(GO:0019348) |
| 0.0 | 0.1 | GO:0010801 | negative regulation of peptidyl-threonine phosphorylation(GO:0010801) |
| 0.0 | 0.1 | GO:0008380 | RNA splicing(GO:0008380) |
| 0.0 | 0.4 | GO:0090084 | negative regulation of inclusion body assembly(GO:0090084) |
| 0.0 | 0.1 | GO:1901675 | negative regulation of histone H3-K27 acetylation(GO:1901675) |
| 0.0 | 3.6 | GO:0007498 | mesoderm development(GO:0007498) |
| 0.0 | 0.2 | GO:0051725 | protein de-ADP-ribosylation(GO:0051725) |
| 0.0 | 3.3 | GO:0002250 | adaptive immune response(GO:0002250) |
| 0.0 | 0.3 | GO:0010457 | centriole-centriole cohesion(GO:0010457) |
| 0.0 | 0.1 | GO:0051096 | positive regulation of helicase activity(GO:0051096) |
| 0.0 | 0.3 | GO:0033089 | positive regulation of T cell differentiation in thymus(GO:0033089) positive regulation of thymocyte aggregation(GO:2000400) |
| 0.0 | 0.4 | GO:0006611 | protein export from nucleus(GO:0006611) |
| 0.0 | 0.5 | GO:0007253 | cytoplasmic sequestering of NF-kappaB(GO:0007253) |
| 0.0 | 0.3 | GO:0017182 | peptidyl-diphthamide metabolic process(GO:0017182) peptidyl-diphthamide biosynthetic process from peptidyl-histidine(GO:0017183) |
| 0.0 | 0.1 | GO:0000727 | double-strand break repair via break-induced replication(GO:0000727) |
| 0.0 | 0.1 | GO:0003363 | lamellipodium assembly involved in ameboidal cell migration(GO:0003363) extension of a leading process involved in cell motility in cerebral cortex radial glia guided migration(GO:0021816) |
| 0.0 | 0.1 | GO:0002949 | tRNA threonylcarbamoyladenosine modification(GO:0002949) |
| 0.0 | 0.2 | GO:0006642 | triglyceride mobilization(GO:0006642) |
| 0.0 | 0.1 | GO:0035947 | regulation of gluconeogenesis by regulation of transcription from RNA polymerase II promoter(GO:0035947) positive regulation of gluconeogenesis by positive regulation of transcription from RNA polymerase II promoter(GO:0035948) regulation of cellular ketone metabolic process by positive regulation of transcription from RNA polymerase II promoter(GO:0072366) |
| 0.0 | 0.1 | GO:0035720 | intraciliary anterograde transport(GO:0035720) |
| 0.0 | 0.1 | GO:0042441 | eye pigment biosynthetic process(GO:0006726) eye pigment metabolic process(GO:0042441) pigment metabolic process involved in developmental pigmentation(GO:0043324) pigment metabolic process involved in pigmentation(GO:0043474) |
| 0.0 | 0.5 | GO:0007084 | mitotic nuclear envelope reassembly(GO:0007084) |
| 0.0 | 0.6 | GO:0070935 | 3'-UTR-mediated mRNA stabilization(GO:0070935) |
| 0.0 | 0.2 | GO:0036444 | calcium ion transmembrane import into mitochondrion(GO:0036444) |
| 0.0 | 0.2 | GO:0006122 | mitochondrial electron transport, ubiquinol to cytochrome c(GO:0006122) |
| 0.0 | 0.1 | GO:0070375 | ERK5 cascade(GO:0070375) negative regulation of chemokine (C-X-C motif) ligand 2 production(GO:2000342) |
| 0.0 | 0.3 | GO:0045898 | regulation of RNA polymerase II transcriptional preinitiation complex assembly(GO:0045898) |
| 0.0 | 0.1 | GO:0034421 | post-translational protein acetylation(GO:0034421) |
| 0.0 | 0.6 | GO:0090527 | actin filament reorganization(GO:0090527) |
| 0.0 | 0.8 | GO:1903963 | arachidonic acid secretion(GO:0050482) arachidonate transport(GO:1903963) |
| 0.0 | 0.4 | GO:0001765 | membrane raft assembly(GO:0001765) |
| 0.0 | 1.3 | GO:0006506 | GPI anchor metabolic process(GO:0006505) GPI anchor biosynthetic process(GO:0006506) |
| 0.0 | 0.4 | GO:0040033 | miRNA mediated inhibition of translation(GO:0035278) negative regulation of translation, ncRNA-mediated(GO:0040033) regulation of translation, ncRNA-mediated(GO:0045974) |
| 0.0 | 0.4 | GO:0021819 | layer formation in cerebral cortex(GO:0021819) |
| 0.0 | 0.2 | GO:0035973 | aggrephagy(GO:0035973) |
| 0.0 | 0.1 | GO:0038188 | cholecystokinin signaling pathway(GO:0038188) |
| 0.0 | 0.5 | GO:1903393 | positive regulation of focal adhesion assembly(GO:0051894) positive regulation of adherens junction organization(GO:1903393) |
| 0.0 | 0.2 | GO:0019530 | taurine metabolic process(GO:0019530) |
| 0.0 | 0.1 | GO:0098507 | polynucleotide 5' dephosphorylation(GO:0098507) |
| 0.0 | 0.3 | GO:1904262 | negative regulation of TORC1 signaling(GO:1904262) |
| 0.0 | 0.1 | GO:1904468 | negative regulation of tumor necrosis factor secretion(GO:1904468) |
| 0.0 | 3.2 | GO:0007062 | sister chromatid cohesion(GO:0007062) |
| 0.0 | 0.9 | GO:0006379 | mRNA cleavage(GO:0006379) |
| 0.0 | 0.8 | GO:0042100 | B cell proliferation(GO:0042100) |
| 0.0 | 0.1 | GO:0030311 | poly-N-acetyllactosamine biosynthetic process(GO:0030311) |
| 0.0 | 0.2 | GO:0046549 | retinal cone cell differentiation(GO:0042670) retinal cone cell development(GO:0046549) |
| 0.0 | 1.4 | GO:0038083 | peptidyl-tyrosine autophosphorylation(GO:0038083) |
| 0.0 | 0.1 | GO:0044026 | DNA hypermethylation(GO:0044026) |
| 0.0 | 0.1 | GO:1904585 | response to putrescine(GO:1904585) cellular response to putrescine(GO:1904586) hepatocyte dedifferentiation(GO:1990828) |
| 0.0 | 0.5 | GO:0071985 | multivesicular body sorting pathway(GO:0071985) |
| 0.0 | 0.2 | GO:0051013 | microtubule severing(GO:0051013) |
| 0.0 | 0.1 | GO:1902109 | negative regulation of mitochondrial membrane permeability(GO:0035795) negative regulation of mitochondrial membrane permeability involved in apoptotic process(GO:1902109) |
| 0.0 | 0.2 | GO:0045919 | positive regulation of cytolysis(GO:0045919) |
| 0.0 | 0.2 | GO:0035494 | SNARE complex disassembly(GO:0035494) |
| 0.0 | 1.2 | GO:0007030 | Golgi organization(GO:0007030) |
| 0.0 | 0.2 | GO:0070933 | histone H4 deacetylation(GO:0070933) |
| 0.0 | 0.1 | GO:2001270 | regulation of cysteine-type endopeptidase activity involved in execution phase of apoptosis(GO:2001270) negative regulation of cysteine-type endopeptidase activity involved in execution phase of apoptosis(GO:2001271) |
| 0.0 | 0.3 | GO:0042407 | cristae formation(GO:0042407) |
| 0.0 | 0.5 | GO:1990126 | retrograde transport, endosome to plasma membrane(GO:1990126) |
| 0.0 | 0.4 | GO:0033234 | negative regulation of protein sumoylation(GO:0033234) |
| 0.0 | 0.1 | GO:1900113 | negative regulation of histone H3-K9 trimethylation(GO:1900113) |
| 0.0 | 0.6 | GO:0021983 | pituitary gland development(GO:0021983) |
| 0.0 | 0.3 | GO:0045023 | G0 to G1 transition(GO:0045023) |
| 0.0 | 0.2 | GO:0018103 | protein C-linked glycosylation(GO:0018103) peptidyl-tryptophan modification(GO:0018211) protein C-linked glycosylation via tryptophan(GO:0018317) protein C-linked glycosylation via 2'-alpha-mannosyl-L-tryptophan(GO:0018406) |
| 0.0 | 0.4 | GO:0032515 | negative regulation of phosphoprotein phosphatase activity(GO:0032515) |
| 0.0 | 0.3 | GO:1904714 | regulation of chaperone-mediated autophagy(GO:1904714) |
| 0.0 | 0.3 | GO:0030210 | heparin metabolic process(GO:0030202) heparin biosynthetic process(GO:0030210) |
| 0.0 | 0.2 | GO:0046638 | positive regulation of alpha-beta T cell differentiation(GO:0046638) |
| 0.0 | 0.2 | GO:0034447 | very-low-density lipoprotein particle clearance(GO:0034447) |
| 0.0 | 0.9 | GO:0030239 | myofibril assembly(GO:0030239) |
| 0.0 | 0.5 | GO:0043407 | negative regulation of MAP kinase activity(GO:0043407) |
| 0.0 | 0.3 | GO:0000188 | inactivation of MAPK activity(GO:0000188) |
| 0.0 | 1.0 | GO:0018105 | peptidyl-serine phosphorylation(GO:0018105) |
| 0.0 | 0.2 | GO:0060012 | synaptic transmission, glycinergic(GO:0060012) |
| 0.0 | 0.1 | GO:0060023 | soft palate development(GO:0060023) |
| 0.0 | 0.3 | GO:0018026 | peptidyl-lysine monomethylation(GO:0018026) |
| 0.0 | 0.2 | GO:0035745 | CD4-positive, alpha-beta T cell cytokine production(GO:0035743) T-helper 2 cell cytokine production(GO:0035745) |
| 0.0 | 9.6 | GO:0051056 | regulation of small GTPase mediated signal transduction(GO:0051056) |
| 0.0 | 0.3 | GO:0051984 | positive regulation of chromosome segregation(GO:0051984) |
| 0.0 | 0.1 | GO:1903288 | positive regulation of potassium ion import(GO:1903288) |
| 0.0 | 0.1 | GO:0032196 | transposition(GO:0032196) |
| 0.0 | 0.7 | GO:0000301 | retrograde transport, vesicle recycling within Golgi(GO:0000301) |
| 0.0 | 0.2 | GO:0015871 | choline transport(GO:0015871) negative regulation of RIG-I signaling pathway(GO:0039536) |
| 0.0 | 0.2 | GO:0061314 | Notch signaling involved in heart development(GO:0061314) |
| 0.0 | 0.5 | GO:0010830 | regulation of myotube differentiation(GO:0010830) |
| 0.0 | 0.1 | GO:0046092 | deoxycytidine metabolic process(GO:0046092) |
| 0.0 | 0.1 | GO:0018969 | thiocyanate metabolic process(GO:0018969) |
| 0.0 | 0.5 | GO:0048026 | positive regulation of mRNA splicing, via spliceosome(GO:0048026) |
| 0.0 | 0.2 | GO:0015074 | DNA integration(GO:0015074) |
| 0.0 | 0.1 | GO:0000055 | ribosomal large subunit export from nucleus(GO:0000055) |
| 0.0 | 0.2 | GO:0019255 | glucose 1-phosphate metabolic process(GO:0019255) |
| 0.0 | 0.4 | GO:0006396 | RNA processing(GO:0006396) |
| 0.0 | 0.5 | GO:0007520 | myoblast fusion(GO:0007520) |
| 0.0 | 0.2 | GO:0045104 | intermediate filament cytoskeleton organization(GO:0045104) |
| 0.0 | 0.2 | GO:0035067 | negative regulation of histone acetylation(GO:0035067) |
| 0.0 | 0.1 | GO:0023019 | signal transduction involved in regulation of gene expression(GO:0023019) |
| 0.0 | 0.8 | GO:0043268 | positive regulation of potassium ion transport(GO:0043268) |
| 0.0 | 0.4 | GO:0032728 | positive regulation of interferon-beta production(GO:0032728) |
| 0.0 | 0.1 | GO:0019542 | acetate biosynthetic process(GO:0019413) acetyl-CoA biosynthetic process from acetate(GO:0019427) propionate metabolic process(GO:0019541) propionate biosynthetic process(GO:0019542) |
| 0.0 | 0.4 | GO:0070536 | protein K63-linked deubiquitination(GO:0070536) |
| 0.0 | 0.1 | GO:0033387 | putrescine biosynthetic process from ornithine(GO:0033387) |
| 0.0 | 0.1 | GO:0007000 | nucleolus organization(GO:0007000) |
| 0.0 | 0.3 | GO:0046784 | viral mRNA export from host cell nucleus(GO:0046784) |
| 0.0 | 0.2 | GO:0032717 | negative regulation of interleukin-8 production(GO:0032717) |
| 0.0 | 0.7 | GO:0050832 | defense response to fungus(GO:0050832) |
| 0.0 | 0.5 | GO:0019433 | triglyceride catabolic process(GO:0019433) |
| 0.0 | 0.8 | GO:0032755 | positive regulation of interleukin-6 production(GO:0032755) |
| 0.0 | 2.3 | GO:0008277 | regulation of G-protein coupled receptor protein signaling pathway(GO:0008277) |
| 0.0 | 0.1 | GO:0021521 | ventral spinal cord interneuron specification(GO:0021521) cell fate specification involved in pattern specification(GO:0060573) |
| 0.0 | 0.2 | GO:0009086 | methionine biosynthetic process(GO:0009086) |
| 0.0 | 0.1 | GO:0044376 | RNA polymerase II complex import to nucleus(GO:0044376) RNA polymerase III complex localization to nucleus(GO:1990022) |
| 0.0 | 0.2 | GO:0061099 | negative regulation of protein tyrosine kinase activity(GO:0061099) |
| 0.0 | 0.5 | GO:0030032 | lamellipodium assembly(GO:0030032) |
| 0.0 | 0.4 | GO:0055008 | cardiac muscle tissue morphogenesis(GO:0055008) |
| 0.0 | 0.2 | GO:0006995 | cellular response to nitrogen starvation(GO:0006995) cellular response to nitrogen levels(GO:0043562) |
| 0.0 | 0.2 | GO:0050850 | positive regulation of calcium-mediated signaling(GO:0050850) |
| 0.0 | 0.2 | GO:0006030 | chitin metabolic process(GO:0006030) chitin catabolic process(GO:0006032) |
| 0.0 | 0.1 | GO:0070527 | platelet aggregation(GO:0070527) |
| 0.0 | 0.2 | GO:2000675 | negative regulation of type B pancreatic cell apoptotic process(GO:2000675) |
| 0.0 | 0.4 | GO:0007595 | lactation(GO:0007595) |
| 0.0 | 0.7 | GO:0070301 | cellular response to hydrogen peroxide(GO:0070301) |
| 0.0 | 7.9 | GO:0002283 | neutrophil activation involved in immune response(GO:0002283) neutrophil degranulation(GO:0043312) |
| 0.0 | 1.7 | GO:1903509 | glycolipid metabolic process(GO:0006664) liposaccharide metabolic process(GO:1903509) |
| 0.0 | 4.9 | GO:0048193 | Golgi vesicle transport(GO:0048193) |
| 0.0 | 0.4 | GO:0030318 | melanocyte differentiation(GO:0030318) |
| 0.0 | 0.1 | GO:0032968 | positive regulation of transcription elongation from RNA polymerase II promoter(GO:0032968) |
| 0.0 | 0.1 | GO:0051958 | methotrexate transport(GO:0051958) |
| 0.0 | 0.7 | GO:0043252 | sodium-independent organic anion transport(GO:0043252) |
| 0.0 | 0.4 | GO:0046513 | ceramide biosynthetic process(GO:0046513) |
| 0.0 | 0.4 | GO:0046427 | positive regulation of JAK-STAT cascade(GO:0046427) positive regulation of STAT cascade(GO:1904894) |
| 0.0 | 0.2 | GO:0071539 | protein localization to centrosome(GO:0071539) |
| 0.0 | 0.3 | GO:0007205 | protein kinase C-activating G-protein coupled receptor signaling pathway(GO:0007205) |
| 0.0 | 0.1 | GO:0032875 | regulation of DNA endoreduplication(GO:0032875) DNA endoreduplication(GO:0042023) |
| 0.0 | 0.2 | GO:0001829 | trophectodermal cell differentiation(GO:0001829) |
| 0.0 | 0.4 | GO:0000462 | maturation of SSU-rRNA from tricistronic rRNA transcript (SSU-rRNA, 5.8S rRNA, LSU-rRNA)(GO:0000462) |
| 0.0 | 0.5 | GO:0050830 | defense response to Gram-positive bacterium(GO:0050830) |
| 0.0 | 0.0 | GO:0052651 | monoacylglycerol metabolic process(GO:0046462) monoacylglycerol catabolic process(GO:0052651) |
| 0.0 | 0.3 | GO:0090200 | positive regulation of release of cytochrome c from mitochondria(GO:0090200) |
| 0.0 | 0.1 | GO:0014870 | response to inactivity(GO:0014854) response to muscle inactivity(GO:0014870) |
| 0.0 | 0.1 | GO:0006265 | DNA topological change(GO:0006265) |
| 0.0 | 0.7 | GO:0045071 | negative regulation of viral genome replication(GO:0045071) |
| 0.0 | 0.8 | GO:0030901 | midbrain development(GO:0030901) |
| 0.0 | 0.2 | GO:0006488 | dolichol-linked oligosaccharide biosynthetic process(GO:0006488) |
| 0.0 | 0.1 | GO:2000773 | negative regulation of cellular senescence(GO:2000773) |
Gene overrepresentation in cellular_component category:
| Log-likelihood per target | Total log-likelihood | Term | Description |
|---|---|---|---|
| 1.3 | 5.4 | GO:0005863 | striated muscle myosin thick filament(GO:0005863) |
| 0.6 | 4.2 | GO:0072558 | NLRP1 inflammasome complex(GO:0072558) |
| 0.5 | 2.6 | GO:0005896 | interleukin-6 receptor complex(GO:0005896) |
| 0.4 | 3.0 | GO:0036021 | endolysosome lumen(GO:0036021) |
| 0.4 | 1.3 | GO:0032997 | Fc receptor complex(GO:0032997) Fc-epsilon receptor I complex(GO:0032998) |
| 0.4 | 4.1 | GO:0032010 | phagolysosome(GO:0032010) |
| 0.3 | 7.7 | GO:0042613 | MHC class II protein complex(GO:0042613) |
| 0.3 | 13.5 | GO:0042101 | T cell receptor complex(GO:0042101) |
| 0.3 | 8.6 | GO:0045009 | melanosome membrane(GO:0033162) chitosome(GO:0045009) |
| 0.3 | 1.0 | GO:0043614 | multi-eIF complex(GO:0043614) translation preinitiation complex(GO:0070993) glial limiting end-foot(GO:0097451) |
| 0.3 | 0.9 | GO:0071745 | IgA immunoglobulin complex(GO:0071745) IgA immunoglobulin complex, circulating(GO:0071746) monomeric IgA immunoglobulin complex(GO:0071748) polymeric IgA immunoglobulin complex(GO:0071749) secretory IgA immunoglobulin complex(GO:0071751) |
| 0.3 | 5.3 | GO:0030008 | TRAPP complex(GO:0030008) |
| 0.3 | 2.0 | GO:0035692 | macrophage migration inhibitory factor receptor complex(GO:0035692) |
| 0.3 | 17.6 | GO:0001772 | immunological synapse(GO:0001772) |
| 0.3 | 3.0 | GO:0032777 | Piccolo NuA4 histone acetyltransferase complex(GO:0032777) |
| 0.3 | 8.7 | GO:0001891 | phagocytic cup(GO:0001891) |
| 0.3 | 0.8 | GO:0002139 | stereocilia coupling link(GO:0002139) |
| 0.3 | 4.1 | GO:0005828 | kinetochore microtubule(GO:0005828) |
| 0.3 | 2.5 | GO:0002193 | MAML1-RBP-Jkappa- ICN1 complex(GO:0002193) |
| 0.2 | 0.2 | GO:0005902 | microvillus(GO:0005902) |
| 0.2 | 1.6 | GO:0072557 | IPAF inflammasome complex(GO:0072557) |
| 0.2 | 4.0 | GO:0031618 | nuclear pericentric heterochromatin(GO:0031618) |
| 0.2 | 3.3 | GO:0000940 | condensed chromosome outer kinetochore(GO:0000940) |
| 0.2 | 3.0 | GO:0014701 | junctional sarcoplasmic reticulum membrane(GO:0014701) |
| 0.2 | 0.8 | GO:0030906 | retromer, cargo-selective complex(GO:0030906) |
| 0.2 | 1.0 | GO:0016035 | zeta DNA polymerase complex(GO:0016035) |
| 0.2 | 6.9 | GO:0031092 | platelet alpha granule membrane(GO:0031092) |
| 0.2 | 1.5 | GO:0016012 | sarcoglycan complex(GO:0016012) |
| 0.2 | 0.5 | GO:0048269 | methionine adenosyltransferase complex(GO:0048269) |
| 0.1 | 0.6 | GO:0035841 | new growing cell tip(GO:0035841) |
| 0.1 | 0.9 | GO:1990037 | Lewy body core(GO:1990037) |
| 0.1 | 0.8 | GO:0031302 | intrinsic component of endosome membrane(GO:0031302) |
| 0.1 | 1.1 | GO:0070369 | beta-catenin-TCF7L2 complex(GO:0070369) |
| 0.1 | 0.1 | GO:0005683 | U7 snRNP(GO:0005683) |
| 0.1 | 6.9 | GO:0035371 | microtubule plus-end(GO:0035371) |
| 0.1 | 1.4 | GO:0097504 | Gemini of coiled bodies(GO:0097504) |
| 0.1 | 0.3 | GO:0042720 | mitochondrial inner membrane peptidase complex(GO:0042720) |
| 0.1 | 0.6 | GO:1990604 | IRE1-TRAF2-ASK1 complex(GO:1990604) |
| 0.1 | 0.9 | GO:0097129 | cyclin D2-CDK4 complex(GO:0097129) |
| 0.1 | 1.7 | GO:0043020 | NADPH oxidase complex(GO:0043020) |
| 0.1 | 0.4 | GO:0031523 | Myb complex(GO:0031523) |
| 0.1 | 1.5 | GO:0000506 | glycosylphosphatidylinositol-N-acetylglucosaminyltransferase (GPI-GnT) complex(GO:0000506) |
| 0.1 | 2.1 | GO:0005952 | cAMP-dependent protein kinase complex(GO:0005952) |
| 0.1 | 2.0 | GO:0030877 | beta-catenin destruction complex(GO:0030877) |
| 0.1 | 0.8 | GO:0070695 | FHF complex(GO:0070695) |
| 0.1 | 1.1 | GO:0035985 | senescence-associated heterochromatin focus(GO:0035985) |
| 0.1 | 0.3 | GO:1902912 | pyruvate kinase complex(GO:1902912) |
| 0.1 | 0.9 | GO:0036128 | CatSper complex(GO:0036128) |
| 0.1 | 12.0 | GO:0070821 | tertiary granule membrane(GO:0070821) |
| 0.1 | 0.6 | GO:0033565 | ESCRT-0 complex(GO:0033565) |
| 0.1 | 0.5 | GO:0045272 | plasma membrane respiratory chain complex I(GO:0045272) |
| 0.1 | 2.9 | GO:0030018 | Z disc(GO:0030018) |
| 0.1 | 3.8 | GO:0042571 | immunoglobulin complex, circulating(GO:0042571) |
| 0.1 | 1.2 | GO:0035102 | PRC1 complex(GO:0035102) |
| 0.1 | 0.6 | GO:0097025 | MPP7-DLG1-LIN7 complex(GO:0097025) |
| 0.1 | 0.2 | GO:0002944 | cyclin K-CDK12 complex(GO:0002944) cyclin K-CDK13 complex(GO:0002945) |
| 0.1 | 3.0 | GO:0005859 | muscle myosin complex(GO:0005859) |
| 0.1 | 0.7 | GO:0098554 | cytoplasmic side of endoplasmic reticulum membrane(GO:0098554) |
| 0.1 | 1.0 | GO:0030427 | site of polarized growth(GO:0030427) |
| 0.1 | 1.0 | GO:0005664 | origin recognition complex(GO:0000808) nuclear origin of replication recognition complex(GO:0005664) |
| 0.1 | 0.6 | GO:0005827 | polar microtubule(GO:0005827) |
| 0.1 | 0.9 | GO:0030027 | lamellipodium(GO:0030027) |
| 0.1 | 21.5 | GO:0009897 | external side of plasma membrane(GO:0009897) |
| 0.1 | 2.8 | GO:0005720 | nuclear heterochromatin(GO:0005720) |
| 0.1 | 0.2 | GO:1990723 | cytoplasmic periphery of the nuclear pore complex(GO:1990723) |
| 0.1 | 0.2 | GO:0005715 | late recombination nodule(GO:0005715) |
| 0.1 | 5.5 | GO:0045095 | keratin filament(GO:0045095) |
| 0.1 | 0.2 | GO:1990667 | PCSK9-AnxA2 complex(GO:1990667) |
| 0.1 | 0.3 | GO:0000308 | cytoplasmic cyclin-dependent protein kinase holoenzyme complex(GO:0000308) |
| 0.1 | 0.2 | GO:0031838 | haptoglobin-hemoglobin complex(GO:0031838) |
| 0.1 | 3.6 | GO:0005747 | mitochondrial respiratory chain complex I(GO:0005747) NADH dehydrogenase complex(GO:0030964) respiratory chain complex I(GO:0045271) |
| 0.1 | 1.2 | GO:0045263 | proton-transporting ATP synthase complex, coupling factor F(o)(GO:0045263) |
| 0.1 | 0.9 | GO:0000815 | ESCRT III complex(GO:0000815) |
| 0.1 | 3.0 | GO:0033017 | sarcoplasmic reticulum membrane(GO:0033017) |
| 0.1 | 0.7 | GO:0042584 | chromaffin granule membrane(GO:0042584) |
| 0.1 | 1.8 | GO:0031306 | intrinsic component of mitochondrial outer membrane(GO:0031306) |
| 0.1 | 2.4 | GO:0044298 | neuronal cell body membrane(GO:0032809) cell body membrane(GO:0044298) |
| 0.0 | 3.6 | GO:0005834 | heterotrimeric G-protein complex(GO:0005834) |
| 0.0 | 0.3 | GO:0035061 | interchromatin granule(GO:0035061) |
| 0.0 | 0.6 | GO:0009898 | cytoplasmic side of plasma membrane(GO:0009898) |
| 0.0 | 1.8 | GO:0097228 | sperm principal piece(GO:0097228) |
| 0.0 | 0.1 | GO:0097422 | tubular endosome(GO:0097422) |
| 0.0 | 0.2 | GO:0000444 | MIS12/MIND type complex(GO:0000444) |
| 0.0 | 0.7 | GO:0060091 | kinocilium(GO:0060091) |
| 0.0 | 1.8 | GO:0005697 | telomerase holoenzyme complex(GO:0005697) |
| 0.0 | 0.1 | GO:0002947 | tumor necrosis factor receptor superfamily complex(GO:0002947) |
| 0.0 | 0.3 | GO:0031466 | Cul5-RING ubiquitin ligase complex(GO:0031466) |
| 0.0 | 1.2 | GO:0032590 | dendrite membrane(GO:0032590) |
| 0.0 | 1.0 | GO:0017101 | aminoacyl-tRNA synthetase multienzyme complex(GO:0017101) |
| 0.0 | 1.2 | GO:0032045 | guanyl-nucleotide exchange factor complex(GO:0032045) |
| 0.0 | 0.1 | GO:0005674 | transcription factor TFIIF complex(GO:0005674) |
| 0.0 | 0.2 | GO:0008024 | cyclin/CDK positive transcription elongation factor complex(GO:0008024) |
| 0.0 | 6.7 | GO:0031234 | extrinsic component of cytoplasmic side of plasma membrane(GO:0031234) |
| 0.0 | 1.4 | GO:0008074 | guanylate cyclase complex, soluble(GO:0008074) |
| 0.0 | 0.5 | GO:0016600 | flotillin complex(GO:0016600) |
| 0.0 | 1.4 | GO:0038201 | TOR complex(GO:0038201) |
| 0.0 | 0.9 | GO:0005736 | DNA-directed RNA polymerase I complex(GO:0005736) |
| 0.0 | 3.2 | GO:0035579 | specific granule membrane(GO:0035579) |
| 0.0 | 0.5 | GO:0005853 | eukaryotic translation elongation factor 1 complex(GO:0005853) |
| 0.0 | 0.4 | GO:0005677 | chromatin silencing complex(GO:0005677) |
| 0.0 | 1.0 | GO:0035098 | ESC/E(Z) complex(GO:0035098) |
| 0.0 | 0.5 | GO:0030870 | Mre11 complex(GO:0030870) |
| 0.0 | 5.8 | GO:0017053 | transcriptional repressor complex(GO:0017053) |
| 0.0 | 0.2 | GO:1990246 | uniplex complex(GO:1990246) |
| 0.0 | 0.5 | GO:0031088 | platelet dense granule membrane(GO:0031088) |
| 0.0 | 1.0 | GO:0005689 | U12-type spliceosomal complex(GO:0005689) |
| 0.0 | 0.5 | GO:0044666 | MLL3/4 complex(GO:0044666) |
| 0.0 | 0.3 | GO:0061617 | MICOS complex(GO:0061617) |
| 0.0 | 0.1 | GO:0000811 | GINS complex(GO:0000811) |
| 0.0 | 3.8 | GO:0031463 | Cul3-RING ubiquitin ligase complex(GO:0031463) |
| 0.0 | 0.2 | GO:0055037 | recycling endosome(GO:0055037) |
| 0.0 | 0.2 | GO:0036449 | microtubule minus-end(GO:0036449) |
| 0.0 | 0.8 | GO:0005671 | Ada2/Gcn5/Ada3 transcription activator complex(GO:0005671) |
| 0.0 | 0.6 | GO:0043596 | nuclear replication fork(GO:0043596) |
| 0.0 | 5.1 | GO:0016605 | PML body(GO:0016605) |
| 0.0 | 0.4 | GO:0005666 | DNA-directed RNA polymerase III complex(GO:0005666) |
| 0.0 | 0.3 | GO:0044294 | dendritic growth cone(GO:0044294) |
| 0.0 | 0.1 | GO:0033186 | CAF-1 complex(GO:0033186) |
| 0.0 | 5.9 | GO:0030176 | integral component of endoplasmic reticulum membrane(GO:0030176) |
| 0.0 | 0.4 | GO:0031254 | uropod(GO:0001931) cell trailing edge(GO:0031254) |
| 0.0 | 1.5 | GO:0000159 | protein phosphatase type 2A complex(GO:0000159) |
| 0.0 | 1.7 | GO:0005790 | smooth endoplasmic reticulum(GO:0005790) |
| 0.0 | 0.6 | GO:0000177 | cytoplasmic exosome (RNase complex)(GO:0000177) |
| 0.0 | 0.1 | GO:0071006 | U2-type catalytic step 1 spliceosome(GO:0071006) |
| 0.0 | 0.1 | GO:0034657 | GID complex(GO:0034657) |
| 0.0 | 0.4 | GO:0034362 | low-density lipoprotein particle(GO:0034362) |
| 0.0 | 0.3 | GO:1990578 | perinuclear endoplasmic reticulum membrane(GO:1990578) |
| 0.0 | 0.4 | GO:0031010 | ISWI-type complex(GO:0031010) |
| 0.0 | 0.4 | GO:0005750 | mitochondrial respiratory chain complex III(GO:0005750) respiratory chain complex III(GO:0045275) |
| 0.0 | 0.1 | GO:0044611 | nuclear pore inner ring(GO:0044611) |
| 0.0 | 2.6 | GO:0000118 | histone deacetylase complex(GO:0000118) |
| 0.0 | 0.7 | GO:0034993 | microtubule organizing center attachment site(GO:0034992) LINC complex(GO:0034993) |
| 0.0 | 0.1 | GO:0005753 | mitochondrial proton-transporting ATP synthase complex(GO:0005753) proton-transporting ATP synthase complex(GO:0045259) |
| 0.0 | 1.2 | GO:0090544 | BAF-type complex(GO:0090544) |
| 0.0 | 1.3 | GO:0101003 | ficolin-1-rich granule membrane(GO:0101003) |
| 0.0 | 0.3 | GO:0098576 | lumenal side of membrane(GO:0098576) |
| 0.0 | 2.7 | GO:0005882 | intermediate filament(GO:0005882) |
| 0.0 | 0.1 | GO:0072357 | PTW/PP1 phosphatase complex(GO:0072357) |
| 0.0 | 1.0 | GO:0031904 | endosome lumen(GO:0031904) |
| 0.0 | 0.2 | GO:0030896 | checkpoint clamp complex(GO:0030896) |
| 0.0 | 0.3 | GO:0005916 | fascia adherens(GO:0005916) |
| 0.0 | 0.1 | GO:0005785 | signal recognition particle receptor complex(GO:0005785) |
| 0.0 | 0.3 | GO:0031616 | spindle pole centrosome(GO:0031616) |
| 0.0 | 11.0 | GO:0005769 | early endosome(GO:0005769) |
| 0.0 | 0.3 | GO:0044665 | MLL1/2 complex(GO:0044665) MLL1 complex(GO:0071339) |
| 0.0 | 0.1 | GO:0030915 | Smc5-Smc6 complex(GO:0030915) |
| 0.0 | 1.2 | GO:0008180 | COP9 signalosome(GO:0008180) |
| 0.0 | 0.9 | GO:0070469 | respiratory chain(GO:0070469) |
| 0.0 | 2.0 | GO:0070820 | tertiary granule(GO:0070820) |
| 0.0 | 1.0 | GO:0012507 | ER to Golgi transport vesicle membrane(GO:0012507) |
| 0.0 | 0.2 | GO:0070083 | clathrin-sculpted monoamine transport vesicle(GO:0070081) clathrin-sculpted monoamine transport vesicle membrane(GO:0070083) |
| 0.0 | 0.3 | GO:0000347 | THO complex(GO:0000347) THO complex part of transcription export complex(GO:0000445) |
| 0.0 | 0.1 | GO:0005726 | perichromatin fibrils(GO:0005726) |
| 0.0 | 4.3 | GO:0032993 | protein-DNA complex(GO:0032993) |
| 0.0 | 0.1 | GO:0097196 | Shu complex(GO:0097196) |
| 0.0 | 0.1 | GO:0000172 | ribonuclease MRP complex(GO:0000172) |
| 0.0 | 0.5 | GO:0005682 | U5 snRNP(GO:0005682) |
| 0.0 | 0.1 | GO:0005873 | plus-end kinesin complex(GO:0005873) |
| 0.0 | 0.2 | GO:0005732 | small nucleolar ribonucleoprotein complex(GO:0005732) |
| 0.0 | 2.4 | GO:0032580 | Golgi cisterna membrane(GO:0032580) |
| 0.0 | 0.7 | GO:0035580 | specific granule lumen(GO:0035580) |
| 0.0 | 0.5 | GO:0000145 | exocyst(GO:0000145) |
| 0.0 | 0.8 | GO:0005605 | basal lamina(GO:0005605) |
| 0.0 | 0.2 | GO:0071141 | SMAD protein complex(GO:0071141) |
| 0.0 | 0.4 | GO:0000164 | protein phosphatase type 1 complex(GO:0000164) |
| 0.0 | 3.1 | GO:0000775 | chromosome, centromeric region(GO:0000775) |
| 0.0 | 0.2 | GO:0031941 | filamentous actin(GO:0031941) |
| 0.0 | 0.1 | GO:0042788 | polysomal ribosome(GO:0042788) |
| 0.0 | 0.4 | GO:0031265 | CD95 death-inducing signaling complex(GO:0031265) |
| 0.0 | 0.6 | GO:0030140 | trans-Golgi network transport vesicle(GO:0030140) |
| 0.0 | 0.1 | GO:0031074 | nucleocytoplasmic shuttling complex(GO:0031074) |
| 0.0 | 0.3 | GO:0008385 | IkappaB kinase complex(GO:0008385) |
| 0.0 | 0.1 | GO:0070852 | cell body fiber(GO:0070852) |
| 0.0 | 0.6 | GO:0080008 | Cul4-RING E3 ubiquitin ligase complex(GO:0080008) |
| 0.0 | 0.1 | GO:0044327 | dendritic spine head(GO:0044327) |
| 0.0 | 0.4 | GO:0031231 | integral component of peroxisomal membrane(GO:0005779) intrinsic component of peroxisomal membrane(GO:0031231) |
| 0.0 | 0.1 | GO:0000408 | EKC/KEOPS complex(GO:0000408) |
| 0.0 | 0.2 | GO:0016013 | syntrophin complex(GO:0016013) |
| 0.0 | 0.1 | GO:0045254 | pyruvate dehydrogenase complex(GO:0045254) |
| 0.0 | 0.4 | GO:0014731 | spectrin-associated cytoskeleton(GO:0014731) |
| 0.0 | 0.1 | GO:0035068 | micro-ribonucleoprotein complex(GO:0035068) |
| 0.0 | 0.9 | GO:0034774 | secretory granule lumen(GO:0034774) |
| 0.0 | 0.8 | GO:0016459 | myosin complex(GO:0016459) |
| 0.0 | 0.9 | GO:0031093 | platelet alpha granule lumen(GO:0031093) |
| 0.0 | 0.1 | GO:0097452 | GAIT complex(GO:0097452) |
| 0.0 | 0.1 | GO:0005577 | fibrinogen complex(GO:0005577) |
| 0.0 | 1.0 | GO:0072562 | blood microparticle(GO:0072562) |
| 0.0 | 0.1 | GO:0071547 | piP-body(GO:0071547) |
| 0.0 | 0.1 | GO:0070552 | BRISC complex(GO:0070552) |
| 0.0 | 1.6 | GO:0101002 | ficolin-1-rich granule(GO:0101002) ficolin-1-rich granule lumen(GO:1904813) |
| 0.0 | 7.4 | GO:0005759 | mitochondrial matrix(GO:0005759) |
| 0.0 | 0.9 | GO:0034399 | nuclear periphery(GO:0034399) |
| 0.0 | 0.6 | GO:0036064 | ciliary basal body(GO:0036064) |
| 0.0 | 0.1 | GO:0005968 | Rab-protein geranylgeranyltransferase complex(GO:0005968) |
| 0.0 | 0.6 | GO:0045111 | intermediate filament cytoskeleton(GO:0045111) |
| 0.0 | 0.7 | GO:0043198 | dendritic shaft(GO:0043198) |
| 0.0 | 0.1 | GO:0035145 | exon-exon junction complex(GO:0035145) |
Gene overrepresentation in molecular_function category:
| Log-likelihood per target | Total log-likelihood | Term | Description |
|---|---|---|---|
| 3.3 | 9.9 | GO:0005174 | CD40 receptor binding(GO:0005174) |
| 2.0 | 10.0 | GO:0015254 | glycerol channel activity(GO:0015254) |
| 1.4 | 4.3 | GO:0004108 | citrate (Si)-synthase activity(GO:0004108) citrate synthase activity(GO:0036440) |
| 1.2 | 1.2 | GO:0005499 | vitamin D binding(GO:0005499) |
| 0.9 | 2.8 | GO:0016495 | C-X3-C chemokine receptor activity(GO:0016495) |
| 0.9 | 2.6 | GO:0070119 | ciliary neurotrophic factor binding(GO:0070119) |
| 0.7 | 2.2 | GO:0050146 | nucleoside phosphotransferase activity(GO:0050146) |
| 0.6 | 3.1 | GO:0019770 | IgG receptor activity(GO:0019770) |
| 0.6 | 1.8 | GO:0061629 | RNA polymerase II sequence-specific DNA binding transcription factor binding(GO:0061629) |
| 0.6 | 1.8 | GO:0019781 | NEDD8 activating enzyme activity(GO:0019781) |
| 0.6 | 6.6 | GO:0070892 | lipoteichoic acid receptor activity(GO:0070892) |
| 0.6 | 2.3 | GO:0016716 | oxidoreductase activity, acting on paired donors, with incorporation or reduction of molecular oxygen, another compound as one donor, and incorporation of one atom of oxygen(GO:0016716) |
| 0.5 | 1.5 | GO:0047696 | beta-adrenergic receptor kinase activity(GO:0047696) |
| 0.4 | 2.2 | GO:0008665 | 2'-phosphotransferase activity(GO:0008665) |
| 0.4 | 2.1 | GO:0048248 | CXCR3 chemokine receptor binding(GO:0048248) |
| 0.4 | 1.6 | GO:0050528 | acyloxyacyl hydrolase activity(GO:0050528) |
| 0.4 | 12.1 | GO:0005068 | transmembrane receptor protein tyrosine kinase adaptor activity(GO:0005068) |
| 0.4 | 1.8 | GO:0004666 | prostaglandin-endoperoxide synthase activity(GO:0004666) |
| 0.3 | 2.1 | GO:0016316 | phosphatidylinositol-3,4-bisphosphate 4-phosphatase activity(GO:0016316) inositol-1,3,4-trisphosphate 4-phosphatase activity(GO:0017161) inositol-3,4-bisphosphate 4-phosphatase activity(GO:0052828) |
| 0.3 | 1.0 | GO:0005148 | prolactin receptor binding(GO:0005148) |
| 0.3 | 4.3 | GO:0004022 | alcohol dehydrogenase (NAD) activity(GO:0004022) |
| 0.3 | 1.9 | GO:0023024 | MHC class I protein complex binding(GO:0023024) |
| 0.3 | 2.4 | GO:0008273 | calcium, potassium:sodium antiporter activity(GO:0008273) |
| 0.3 | 0.9 | GO:0016826 | N-sulfoglucosamine sulfohydrolase activity(GO:0016250) hydrolase activity, acting on acid sulfur-nitrogen bonds(GO:0016826) |
| 0.3 | 1.7 | GO:0008113 | peptide-methionine (S)-S-oxide reductase activity(GO:0008113) |
| 0.3 | 9.1 | GO:0097493 | structural molecule activity conferring elasticity(GO:0097493) |
| 0.3 | 0.8 | GO:0030572 | cardiolipin synthase activity(GO:0008808) phosphatidyltransferase activity(GO:0030572) CDP-diacylglycerol-phosphatidylglycerol phosphatidyltransferase activity(GO:0043337) |
| 0.3 | 10.2 | GO:0023026 | MHC class II protein complex binding(GO:0023026) |
| 0.3 | 2.4 | GO:0016812 | hydrolase activity, acting on carbon-nitrogen (but not peptide) bonds, in cyclic amides(GO:0016812) |
| 0.2 | 2.2 | GO:0038051 | glucocorticoid receptor activity(GO:0004883) glucocorticoid-activated RNA polymerase II transcription factor binding transcription factor activity(GO:0038051) |
| 0.2 | 1.7 | GO:0099580 | ion antiporter activity involved in regulation of postsynaptic membrane potential(GO:0099580) |
| 0.2 | 5.8 | GO:0016175 | superoxide-generating NADPH oxidase activity(GO:0016175) |
| 0.2 | 7.9 | GO:0005095 | GTPase inhibitor activity(GO:0005095) |
| 0.2 | 1.2 | GO:0035515 | oxidative RNA demethylase activity(GO:0035515) |
| 0.2 | 0.7 | GO:0004464 | leukotriene-C4 synthase activity(GO:0004464) |
| 0.2 | 0.9 | GO:0004619 | bisphosphoglycerate mutase activity(GO:0004082) phosphoglycerate mutase activity(GO:0004619) 2,3-bisphosphoglycerate-dependent phosphoglycerate mutase activity(GO:0046538) |
| 0.2 | 1.9 | GO:0016715 | oxidoreductase activity, acting on paired donors, with incorporation or reduction of molecular oxygen, reduced ascorbate as one donor, and incorporation of one atom of oxygen(GO:0016715) |
| 0.2 | 1.6 | GO:0035800 | deubiquitinase activator activity(GO:0035800) |
| 0.2 | 1.2 | GO:0051373 | FATZ binding(GO:0051373) |
| 0.2 | 1.4 | GO:0004699 | calcium-independent protein kinase C activity(GO:0004699) |
| 0.2 | 1.1 | GO:0004167 | dopachrome isomerase activity(GO:0004167) |
| 0.2 | 0.6 | GO:0008476 | protein-tyrosine sulfotransferase activity(GO:0008476) |
| 0.2 | 4.4 | GO:0004691 | cAMP-dependent protein kinase activity(GO:0004691) |
| 0.2 | 4.6 | GO:0050700 | CARD domain binding(GO:0050700) |
| 0.2 | 0.5 | GO:0097689 | iron channel activity(GO:0097689) |
| 0.2 | 5.1 | GO:0034237 | protein kinase A regulatory subunit binding(GO:0034237) |
| 0.2 | 0.7 | GO:0071885 | N-terminal protein N-methyltransferase activity(GO:0071885) |
| 0.2 | 3.4 | GO:0017017 | MAP kinase tyrosine/serine/threonine phosphatase activity(GO:0017017) |
| 0.2 | 0.7 | GO:0008260 | 3-oxoacid CoA-transferase activity(GO:0008260) |
| 0.2 | 2.5 | GO:0030280 | structural constituent of epidermis(GO:0030280) |
| 0.2 | 10.9 | GO:0034987 | immunoglobulin receptor binding(GO:0034987) |
| 0.2 | 3.7 | GO:0034236 | protein kinase A catalytic subunit binding(GO:0034236) |
| 0.2 | 1.0 | GO:0004815 | aspartate-tRNA ligase activity(GO:0004815) |
| 0.1 | 6.5 | GO:0005540 | hyaluronic acid binding(GO:0005540) |
| 0.1 | 1.6 | GO:0031013 | troponin I binding(GO:0031013) |
| 0.1 | 1.4 | GO:0003835 | beta-galactoside alpha-2,6-sialyltransferase activity(GO:0003835) |
| 0.1 | 1.1 | GO:0005124 | N-formyl peptide receptor activity(GO:0004982) scavenger receptor binding(GO:0005124) |
| 0.1 | 0.4 | GO:0001156 | TFIIIC-class transcription factor binding(GO:0001156) |
| 0.1 | 10.0 | GO:0001205 | transcriptional activator activity, RNA polymerase II distal enhancer sequence-specific binding(GO:0001205) |
| 0.1 | 0.8 | GO:0043423 | 3-phosphoinositide-dependent protein kinase binding(GO:0043423) |
| 0.1 | 0.9 | GO:0008955 | peptidoglycan glycosyltransferase activity(GO:0008955) |
| 0.1 | 1.3 | GO:0019863 | IgE binding(GO:0019863) |
| 0.1 | 0.6 | GO:0031208 | POZ domain binding(GO:0031208) |
| 0.1 | 4.3 | GO:0031489 | myosin V binding(GO:0031489) |
| 0.1 | 1.2 | GO:0015501 | glutamate:sodium symporter activity(GO:0015501) |
| 0.1 | 0.9 | GO:0047961 | glycine N-acyltransferase activity(GO:0047961) |
| 0.1 | 0.8 | GO:0016530 | metallochaperone activity(GO:0016530) |
| 0.1 | 20.3 | GO:0003823 | antigen binding(GO:0003823) |
| 0.1 | 1.7 | GO:0031852 | mu-type opioid receptor binding(GO:0031852) |
| 0.1 | 0.2 | GO:0016623 | oxidoreductase activity, acting on the aldehyde or oxo group of donors, oxygen as acceptor(GO:0016623) |
| 0.1 | 4.0 | GO:0032041 | histone deacetylase activity (H3-K14 specific)(GO:0031078) NAD-dependent histone deacetylase activity (H3-K14 specific)(GO:0032041) |
| 0.1 | 1.9 | GO:0052629 | phosphatidylinositol-3,5-bisphosphate 3-phosphatase activity(GO:0052629) |
| 0.1 | 0.4 | GO:0004346 | glucose-6-phosphatase activity(GO:0004346) sugar-terminal-phosphatase activity(GO:0050309) |
| 0.1 | 1.3 | GO:0032393 | MHC class I receptor activity(GO:0032393) |
| 0.1 | 1.3 | GO:0005094 | Rho GDP-dissociation inhibitor activity(GO:0005094) |
| 0.1 | 0.9 | GO:0030021 | extracellular matrix structural constituent conferring compression resistance(GO:0030021) structural constituent of tooth enamel(GO:0030345) |
| 0.1 | 1.5 | GO:0003964 | telomerase activity(GO:0003720) RNA-directed DNA polymerase activity(GO:0003964) |
| 0.1 | 3.5 | GO:0002162 | dystroglycan binding(GO:0002162) |
| 0.1 | 2.7 | GO:0004143 | diacylglycerol kinase activity(GO:0004143) |
| 0.1 | 1.2 | GO:0001591 | dopamine neurotransmitter receptor activity, coupled via Gi/Go(GO:0001591) |
| 0.1 | 4.1 | GO:0005001 | transmembrane receptor protein tyrosine phosphatase activity(GO:0005001) transmembrane receptor protein phosphatase activity(GO:0019198) |
| 0.1 | 1.7 | GO:0019957 | C-C chemokine binding(GO:0019957) |
| 0.1 | 4.5 | GO:0004709 | MAP kinase kinase kinase activity(GO:0004709) |
| 0.1 | 0.5 | GO:0047256 | beta-galactosyl-N-acetylglucosaminylgalactosylglucosyl-ceramide beta-1,3-acetylglucosaminyltransferase activity(GO:0008457) lactosylceramide 1,3-N-acetyl-beta-D-glucosaminyltransferase activity(GO:0047256) |
| 0.1 | 0.3 | GO:0043739 | G/U mismatch-specific uracil-DNA glycosylase activity(GO:0043739) |
| 0.1 | 0.4 | GO:0000822 | inositol hexakisphosphate binding(GO:0000822) |
| 0.1 | 1.9 | GO:0001011 | transcription factor activity, sequence-specific DNA binding, RNA polymerase recruiting(GO:0001011) transcription factor activity, TFIIB-class binding(GO:0001087) |
| 0.1 | 0.6 | GO:0070996 | type 1 melanocortin receptor binding(GO:0070996) |
| 0.1 | 0.5 | GO:0005134 | interleukin-2 receptor binding(GO:0005134) |
| 0.1 | 2.4 | GO:0070016 | armadillo repeat domain binding(GO:0070016) |
| 0.1 | 2.4 | GO:0032454 | histone demethylase activity (H3-K9 specific)(GO:0032454) |
| 0.1 | 2.3 | GO:0038187 | signaling pattern recognition receptor activity(GO:0008329) pattern recognition receptor activity(GO:0038187) |
| 0.1 | 0.5 | GO:0016434 | rRNA (cytosine) methyltransferase activity(GO:0016434) |
| 0.1 | 5.4 | GO:0015026 | coreceptor activity(GO:0015026) |
| 0.1 | 6.9 | GO:0031593 | polyubiquitin binding(GO:0031593) |
| 0.1 | 0.6 | GO:0004013 | adenosylhomocysteinase activity(GO:0004013) trialkylsulfonium hydrolase activity(GO:0016802) |
| 0.1 | 0.3 | GO:0031685 | adenosine receptor binding(GO:0031685) |
| 0.1 | 0.6 | GO:0001515 | opioid peptide activity(GO:0001515) |
| 0.1 | 6.3 | GO:0001102 | RNA polymerase II activating transcription factor binding(GO:0001102) |
| 0.1 | 1.8 | GO:0071837 | HMG box domain binding(GO:0071837) |
| 0.1 | 1.5 | GO:0000150 | recombinase activity(GO:0000150) |
| 0.1 | 0.5 | GO:0070728 | leucine binding(GO:0070728) |
| 0.1 | 0.2 | GO:1990698 | palmitoleoyltransferase activity(GO:1990698) |
| 0.1 | 0.1 | GO:0034185 | apolipoprotein binding(GO:0034185) |
| 0.1 | 2.9 | GO:0043236 | laminin binding(GO:0043236) |
| 0.1 | 0.3 | GO:0004711 | ribosomal protein S6 kinase activity(GO:0004711) |
| 0.1 | 0.4 | GO:0080019 | fatty-acyl-CoA reductase (alcohol-forming) activity(GO:0080019) |
| 0.1 | 0.3 | GO:0003858 | 3-hydroxybutyrate dehydrogenase activity(GO:0003858) |
| 0.1 | 0.4 | GO:0071074 | eukaryotic initiation factor eIF2 binding(GO:0071074) |
| 0.1 | 0.3 | GO:0005477 | pyruvate secondary active transmembrane transporter activity(GO:0005477) |
| 0.1 | 1.0 | GO:0001135 | transcription factor activity, RNA polymerase II transcription factor recruiting(GO:0001135) |
| 0.1 | 4.4 | GO:0050136 | NADH dehydrogenase (ubiquinone) activity(GO:0008137) NADH dehydrogenase (quinone) activity(GO:0050136) |
| 0.1 | 0.8 | GO:0008142 | oxysterol binding(GO:0008142) |
| 0.1 | 0.5 | GO:1990254 | keratin filament binding(GO:1990254) |
| 0.1 | 0.2 | GO:0004852 | uroporphyrinogen-III synthase activity(GO:0004852) |
| 0.1 | 1.8 | GO:0005523 | tropomyosin binding(GO:0005523) |
| 0.1 | 0.3 | GO:0052798 | beta-galactoside alpha-2,3-sialyltransferase activity(GO:0052798) |
| 0.1 | 0.3 | GO:0004574 | oligo-1,6-glucosidase activity(GO:0004574) |
| 0.1 | 0.3 | GO:0047787 | delta4-3-oxosteroid 5beta-reductase activity(GO:0047787) |
| 0.1 | 0.2 | GO:0004583 | dolichyl-phosphate-glucose-glycolipid alpha-glucosyltransferase activity(GO:0004583) |
| 0.1 | 2.6 | GO:0008327 | methyl-CpG binding(GO:0008327) |
| 0.1 | 0.5 | GO:0005223 | intracellular cGMP activated cation channel activity(GO:0005223) |
| 0.1 | 1.3 | GO:0003688 | DNA replication origin binding(GO:0003688) |
| 0.1 | 0.2 | GO:0003943 | N-acetylgalactosamine-4-sulfatase activity(GO:0003943) |
| 0.1 | 3.9 | GO:0005547 | phosphatidylinositol-3,4,5-trisphosphate binding(GO:0005547) |
| 0.1 | 0.2 | GO:0030626 | U12 snRNA binding(GO:0030626) |
| 0.1 | 0.4 | GO:0042609 | CD4 receptor binding(GO:0042609) |
| 0.1 | 0.3 | GO:0060961 | phospholipase D inhibitor activity(GO:0060961) |
| 0.1 | 0.2 | GO:0043813 | phosphatidylinositol-3,5-bisphosphate 5-phosphatase activity(GO:0043813) |
| 0.1 | 1.2 | GO:0016500 | protein-hormone receptor activity(GO:0016500) |
| 0.1 | 1.0 | GO:0031435 | mitogen-activated protein kinase kinase kinase binding(GO:0031435) |
| 0.1 | 0.4 | GO:0004468 | lysine N-acetyltransferase activity, acting on acetyl phosphate as donor(GO:0004468) |
| 0.1 | 0.2 | GO:0001147 | transcription termination site sequence-specific DNA binding(GO:0001147) transcription termination site DNA binding(GO:0001160) |
| 0.1 | 0.2 | GO:0003976 | UDP-N-acetylglucosamine-lysosomal-enzyme N-acetylglucosaminephosphotransferase activity(GO:0003976) |
| 0.1 | 0.2 | GO:0034602 | oxoglutarate dehydrogenase (NAD+) activity(GO:0034602) |
| 0.1 | 0.8 | GO:0008503 | benzodiazepine receptor activity(GO:0008503) |
| 0.1 | 0.4 | GO:0097199 | cysteine-type endopeptidase activity involved in apoptotic signaling pathway(GO:0097199) |
| 0.0 | 0.9 | GO:0004745 | retinol dehydrogenase activity(GO:0004745) |
| 0.0 | 0.1 | GO:0030292 | protein tyrosine kinase inhibitor activity(GO:0030292) |
| 0.0 | 0.4 | GO:0015319 | sodium:inorganic phosphate symporter activity(GO:0015319) |
| 0.0 | 1.0 | GO:0050786 | RAGE receptor binding(GO:0050786) |
| 0.0 | 1.4 | GO:0004062 | aryl sulfotransferase activity(GO:0004062) |
| 0.0 | 0.3 | GO:0042030 | ATPase inhibitor activity(GO:0042030) |
| 0.0 | 0.2 | GO:0008466 | glycogenin glucosyltransferase activity(GO:0008466) |
| 0.0 | 0.5 | GO:0015181 | arginine transmembrane transporter activity(GO:0015181) |
| 0.0 | 0.6 | GO:0001851 | complement component C3b binding(GO:0001851) |
| 0.0 | 0.2 | GO:0032137 | guanine/thymine mispair binding(GO:0032137) |
| 0.0 | 2.0 | GO:0070840 | dynein complex binding(GO:0070840) |
| 0.0 | 0.2 | GO:0015375 | glycine:sodium symporter activity(GO:0015375) |
| 0.0 | 0.3 | GO:0017159 | pantetheine hydrolase activity(GO:0017159) |
| 0.0 | 0.6 | GO:1990247 | N6-methyladenosine-containing RNA binding(GO:1990247) |
| 0.0 | 0.5 | GO:0001730 | 2'-5'-oligoadenylate synthetase activity(GO:0001730) |
| 0.0 | 2.0 | GO:0070888 | E-box binding(GO:0070888) |
| 0.0 | 1.1 | GO:0035925 | mRNA 3'-UTR AU-rich region binding(GO:0035925) |
| 0.0 | 0.1 | GO:0008502 | melatonin receptor activity(GO:0008502) |
| 0.0 | 0.8 | GO:0032036 | myosin heavy chain binding(GO:0032036) |
| 0.0 | 0.3 | GO:0005119 | smoothened binding(GO:0005119) |
| 0.0 | 0.2 | GO:0061628 | H3K27me3 modified histone binding(GO:0061628) |
| 0.0 | 0.7 | GO:0070569 | uridylyltransferase activity(GO:0070569) |
| 0.0 | 1.0 | GO:0016922 | ligand-dependent nuclear receptor binding(GO:0016922) |
| 0.0 | 0.6 | GO:0004726 | non-membrane spanning protein tyrosine phosphatase activity(GO:0004726) |
| 0.0 | 0.4 | GO:0045029 | UDP-activated nucleotide receptor activity(GO:0045029) |
| 0.0 | 0.9 | GO:0001054 | RNA polymerase I activity(GO:0001054) |
| 0.0 | 1.4 | GO:0004383 | guanylate cyclase activity(GO:0004383) |
| 0.0 | 0.2 | GO:0039552 | RIG-I binding(GO:0039552) |
| 0.0 | 0.5 | GO:0015379 | potassium:chloride symporter activity(GO:0015379) potassium ion symporter activity(GO:0022820) |
| 0.0 | 0.5 | GO:0004969 | histamine receptor activity(GO:0004969) |
| 0.0 | 0.0 | GO:0035379 | carbon dioxide transmembrane transporter activity(GO:0035379) |
| 0.0 | 0.9 | GO:0043422 | protein kinase B binding(GO:0043422) |
| 0.0 | 0.3 | GO:0016907 | G-protein coupled acetylcholine receptor activity(GO:0016907) |
| 0.0 | 1.2 | GO:0031683 | G-protein beta/gamma-subunit complex binding(GO:0031683) |
| 0.0 | 1.4 | GO:0008536 | Ran GTPase binding(GO:0008536) |
| 0.0 | 1.9 | GO:0043027 | cysteine-type endopeptidase inhibitor activity involved in apoptotic process(GO:0043027) |
| 0.0 | 0.5 | GO:0005176 | ErbB-2 class receptor binding(GO:0005176) |
| 0.0 | 0.4 | GO:0070915 | lysophosphatidic acid receptor activity(GO:0070915) |
| 0.0 | 0.2 | GO:0032184 | SUMO polymer binding(GO:0032184) |
| 0.0 | 0.2 | GO:1904455 | ubiquitin-specific protease activity involved in negative regulation of ERAD pathway(GO:1904455) |
| 0.0 | 0.2 | GO:0015222 | serotonin transmembrane transporter activity(GO:0015222) |
| 0.0 | 0.6 | GO:0004571 | mannosyl-oligosaccharide 1,2-alpha-mannosidase activity(GO:0004571) |
| 0.0 | 0.2 | GO:0008853 | exodeoxyribonuclease III activity(GO:0008853) |
| 0.0 | 0.5 | GO:0031698 | beta-2 adrenergic receptor binding(GO:0031698) |
| 0.0 | 2.9 | GO:0004402 | histone acetyltransferase activity(GO:0004402) |
| 0.0 | 0.2 | GO:0030492 | hemoglobin binding(GO:0030492) |
| 0.0 | 0.2 | GO:0016823 | hydrolase activity, acting on acid carbon-carbon bonds(GO:0016822) hydrolase activity, acting on acid carbon-carbon bonds, in ketonic substances(GO:0016823) |
| 0.0 | 0.1 | GO:0061711 | N(6)-L-threonylcarbamoyladenine synthase(GO:0061711) |
| 0.0 | 0.7 | GO:0005522 | profilin binding(GO:0005522) |
| 0.0 | 0.6 | GO:0047499 | calcium-independent phospholipase A2 activity(GO:0047499) |
| 0.0 | 1.7 | GO:0070577 | lysine-acetylated histone binding(GO:0070577) |
| 0.0 | 0.1 | GO:0008200 | ion channel inhibitor activity(GO:0008200) channel inhibitor activity(GO:0016248) |
| 0.0 | 0.5 | GO:0015266 | protein channel activity(GO:0015266) |
| 0.0 | 0.3 | GO:0001594 | trace-amine receptor activity(GO:0001594) |
| 0.0 | 1.0 | GO:0102391 | decanoate--CoA ligase activity(GO:0102391) |
| 0.0 | 1.2 | GO:0043548 | phosphatidylinositol 3-kinase binding(GO:0043548) |
| 0.0 | 0.8 | GO:0043522 | leucine zipper domain binding(GO:0043522) |
| 0.0 | 0.1 | GO:0098640 | integrin binding involved in cell-matrix adhesion(GO:0098640) |
| 0.0 | 0.7 | GO:0001222 | transcription corepressor binding(GO:0001222) |
| 0.0 | 1.1 | GO:0070410 | co-SMAD binding(GO:0070410) |
| 0.0 | 0.4 | GO:0048156 | tau protein binding(GO:0048156) |
| 0.0 | 0.1 | GO:0071209 | U7 snRNA binding(GO:0071209) |
| 0.0 | 0.6 | GO:0005149 | interleukin-1 receptor binding(GO:0005149) |
| 0.0 | 0.3 | GO:0016670 | oxidoreductase activity, acting on a sulfur group of donors, oxygen as acceptor(GO:0016670) |
| 0.0 | 1.1 | GO:0005123 | death receptor binding(GO:0005123) |
| 0.0 | 0.5 | GO:0008140 | cAMP response element binding protein binding(GO:0008140) |
| 0.0 | 1.3 | GO:0034061 | DNA polymerase activity(GO:0034061) |
| 0.0 | 0.5 | GO:0016813 | hydrolase activity, acting on carbon-nitrogen (but not peptide) bonds, in linear amidines(GO:0016813) |
| 0.0 | 0.2 | GO:0008195 | phosphatidate phosphatase activity(GO:0008195) |
| 0.0 | 3.1 | GO:0004715 | non-membrane spanning protein tyrosine kinase activity(GO:0004715) |
| 0.0 | 0.1 | GO:0004803 | transposase activity(GO:0004803) |
| 0.0 | 0.4 | GO:0004467 | long-chain fatty acid-CoA ligase activity(GO:0004467) |
| 0.0 | 0.9 | GO:0030228 | lipoprotein particle receptor activity(GO:0030228) |
| 0.0 | 0.3 | GO:0004359 | glutaminase activity(GO:0004359) |
| 0.0 | 0.6 | GO:0030547 | receptor inhibitor activity(GO:0030547) |
| 0.0 | 0.5 | GO:0004865 | protein serine/threonine phosphatase inhibitor activity(GO:0004865) |
| 0.0 | 0.2 | GO:0008121 | ubiquinol-cytochrome-c reductase activity(GO:0008121) oxidoreductase activity, acting on diphenols and related substances as donors, cytochrome as acceptor(GO:0016681) |
| 0.0 | 0.1 | GO:0016435 | rRNA (guanine) methyltransferase activity(GO:0016435) |
| 0.0 | 0.5 | GO:0050291 | sphingosine N-acyltransferase activity(GO:0050291) |
| 0.0 | 0.5 | GO:0016929 | SUMO-specific protease activity(GO:0016929) |
| 0.0 | 0.7 | GO:0005249 | voltage-gated potassium channel activity(GO:0005249) |
| 0.0 | 0.2 | GO:0035473 | lipase binding(GO:0035473) |
| 0.0 | 0.1 | GO:0050333 | thiamin-triphosphatase activity(GO:0050333) |
| 0.0 | 0.2 | GO:0035500 | MH2 domain binding(GO:0035500) |
| 0.0 | 2.1 | GO:0070491 | repressing transcription factor binding(GO:0070491) |
| 0.0 | 0.3 | GO:0015016 | [heparan sulfate]-glucosamine N-sulfotransferase activity(GO:0015016) |
| 0.0 | 0.2 | GO:0008597 | calcium-dependent protein serine/threonine phosphatase regulator activity(GO:0008597) |
| 0.0 | 0.3 | GO:0051864 | histone demethylase activity (H3-K36 specific)(GO:0051864) |
| 0.0 | 0.5 | GO:0031545 | peptidyl-proline 4-dioxygenase activity(GO:0031545) |
| 0.0 | 0.1 | GO:0052642 | lysophosphatidic acid phosphatase activity(GO:0052642) |
| 0.0 | 0.9 | GO:0046875 | ephrin receptor binding(GO:0046875) |
| 0.0 | 0.1 | GO:0004951 | cholecystokinin receptor activity(GO:0004951) |
| 0.0 | 0.1 | GO:0004651 | polynucleotide 5'-phosphatase activity(GO:0004651) |
| 0.0 | 1.6 | GO:0043022 | ribosome binding(GO:0043022) |
| 0.0 | 0.3 | GO:0008420 | CTD phosphatase activity(GO:0008420) |
| 0.0 | 0.1 | GO:0004550 | nucleoside diphosphate kinase activity(GO:0004550) |
| 0.0 | 0.1 | GO:0008532 | N-acetyllactosaminide beta-1,3-N-acetylglucosaminyltransferase activity(GO:0008532) |
| 0.0 | 0.2 | GO:0001056 | RNA polymerase III activity(GO:0001056) |
| 0.0 | 0.1 | GO:0010521 | telomerase inhibitor activity(GO:0010521) |
| 0.0 | 0.3 | GO:0086083 | cell adhesive protein binding involved in bundle of His cell-Purkinje myocyte communication(GO:0086083) |
| 0.0 | 0.9 | GO:0019707 | protein-cysteine S-palmitoyltransferase activity(GO:0019706) protein-cysteine S-acyltransferase activity(GO:0019707) |
| 0.0 | 0.4 | GO:0034485 | phosphatidylinositol-3,4,5-trisphosphate 5-phosphatase activity(GO:0034485) |
| 0.0 | 0.2 | GO:0008568 | microtubule-severing ATPase activity(GO:0008568) |
| 0.0 | 0.1 | GO:0000386 | second spliceosomal transesterification activity(GO:0000386) |
| 0.0 | 0.2 | GO:0016778 | diphosphotransferase activity(GO:0016778) |
| 0.0 | 1.1 | GO:0005154 | epidermal growth factor receptor binding(GO:0005154) |
| 0.0 | 0.9 | GO:0005504 | fatty acid binding(GO:0005504) |
| 0.0 | 0.9 | GO:0004181 | metallocarboxypeptidase activity(GO:0004181) |
| 0.0 | 0.2 | GO:0019834 | phospholipase A2 inhibitor activity(GO:0019834) |
| 0.0 | 1.0 | GO:0003950 | NAD+ ADP-ribosyltransferase activity(GO:0003950) |
| 0.0 | 0.1 | GO:0004105 | choline-phosphate cytidylyltransferase activity(GO:0004105) |
| 0.0 | 0.4 | GO:0070628 | proteasome binding(GO:0070628) |
| 0.0 | 0.2 | GO:0004652 | polynucleotide adenylyltransferase activity(GO:0004652) |
| 0.0 | 0.2 | GO:0048406 | nerve growth factor binding(GO:0048406) |
| 0.0 | 0.3 | GO:0042809 | vitamin D receptor binding(GO:0042809) |
| 0.0 | 0.2 | GO:0061578 | Lys63-specific deubiquitinase activity(GO:0061578) |
| 0.0 | 0.6 | GO:0003841 | 1-acylglycerol-3-phosphate O-acyltransferase activity(GO:0003841) lysophosphatidic acid acyltransferase activity(GO:0042171) lysophospholipid acyltransferase activity(GO:0071617) |
| 0.0 | 5.9 | GO:0000287 | magnesium ion binding(GO:0000287) |
| 0.0 | 0.1 | GO:0015173 | aromatic amino acid transmembrane transporter activity(GO:0015173) |
| 0.0 | 0.5 | GO:0003746 | translation elongation factor activity(GO:0003746) |
| 0.0 | 0.2 | GO:0045295 | gamma-catenin binding(GO:0045295) |
| 0.0 | 0.1 | GO:0003910 | DNA ligase (ATP) activity(GO:0003910) |
| 0.0 | 0.1 | GO:0005137 | interleukin-5 receptor binding(GO:0005137) |
| 0.0 | 1.8 | GO:0004843 | thiol-dependent ubiquitin-specific protease activity(GO:0004843) |
| 0.0 | 0.1 | GO:0016838 | carbon-oxygen lyase activity, acting on phosphates(GO:0016838) |
| 0.0 | 1.7 | GO:0004725 | protein tyrosine phosphatase activity(GO:0004725) |
| 0.0 | 0.7 | GO:0005521 | lamin binding(GO:0005521) |
| 0.0 | 0.9 | GO:0015347 | sodium-independent organic anion transmembrane transporter activity(GO:0015347) |
| 0.0 | 0.5 | GO:0042800 | histone methyltransferase activity (H3-K4 specific)(GO:0042800) |
| 0.0 | 0.6 | GO:0071949 | FAD binding(GO:0071949) |
| 0.0 | 0.5 | GO:0008157 | protein phosphatase 1 binding(GO:0008157) |
| 0.0 | 0.1 | GO:0036393 | thiocyanate peroxidase activity(GO:0036393) |
| 0.0 | 1.1 | GO:0003678 | DNA helicase activity(GO:0003678) |
| 0.0 | 0.3 | GO:0004017 | adenylate kinase activity(GO:0004017) |
| 0.0 | 2.9 | GO:0004386 | helicase activity(GO:0004386) |
| 0.0 | 0.6 | GO:0004198 | calcium-dependent cysteine-type endopeptidase activity(GO:0004198) |
| 0.0 | 1.0 | GO:0001786 | phosphatidylserine binding(GO:0001786) |
| 0.0 | 0.1 | GO:0004738 | pyruvate dehydrogenase activity(GO:0004738) pyruvate dehydrogenase [NAD(P)+] activity(GO:0034603) pyruvate dehydrogenase (NAD+) activity(GO:0034604) |
| 0.0 | 1.6 | GO:0019905 | syntaxin binding(GO:0019905) |
| 0.0 | 0.2 | GO:0010859 | calcium-dependent cysteine-type endopeptidase inhibitor activity(GO:0010859) |
| 0.0 | 0.1 | GO:0070087 | chromo shadow domain binding(GO:0070087) |
| 0.0 | 0.9 | GO:0004520 | endodeoxyribonuclease activity(GO:0004520) |
| 0.0 | 0.1 | GO:0034452 | dynactin binding(GO:0034452) |
| 0.0 | 0.6 | GO:0051019 | mitogen-activated protein kinase binding(GO:0051019) |
| 0.0 | 0.4 | GO:0001530 | lipopolysaccharide binding(GO:0001530) |
| 0.0 | 0.8 | GO:0035064 | methylated histone binding(GO:0035064) |
| 0.0 | 0.8 | GO:0017046 | peptide hormone binding(GO:0017046) |
| 0.0 | 0.1 | GO:0004797 | deoxycytidine kinase activity(GO:0004137) thymidine kinase activity(GO:0004797) |
| 0.0 | 2.7 | GO:0017124 | SH3 domain binding(GO:0017124) |
| 0.0 | 0.9 | GO:0048306 | calcium-dependent protein binding(GO:0048306) |
| 0.0 | 1.2 | GO:0004722 | protein serine/threonine phosphatase activity(GO:0004722) |
| 0.0 | 9.2 | GO:0001228 | transcriptional activator activity, RNA polymerase II transcription regulatory region sequence-specific binding(GO:0001228) |
| 0.0 | 0.1 | GO:0035312 | 5'-3' exodeoxyribonuclease activity(GO:0035312) |
| 0.0 | 0.3 | GO:0004721 | phosphoprotein phosphatase activity(GO:0004721) |
| 0.0 | 0.1 | GO:0008172 | S-methyltransferase activity(GO:0008172) |
| 0.0 | 5.5 | GO:0030246 | carbohydrate binding(GO:0030246) |
| 0.0 | 1.5 | GO:0032947 | protein complex scaffold(GO:0032947) |
| 0.0 | 0.2 | GO:0070300 | phosphatidic acid binding(GO:0070300) |
| 0.0 | 0.4 | GO:1990841 | promoter-specific chromatin binding(GO:1990841) |
| 0.0 | 0.3 | GO:0034450 | ubiquitin-ubiquitin ligase activity(GO:0034450) |
| 0.0 | 0.1 | GO:0003917 | DNA topoisomerase type I activity(GO:0003917) |
| 0.0 | 0.2 | GO:0070513 | death domain binding(GO:0070513) |
| 0.0 | 1.0 | GO:0004693 | cyclin-dependent protein serine/threonine kinase activity(GO:0004693) |
| 0.0 | 0.3 | GO:0051010 | microtubule plus-end binding(GO:0051010) |
| 0.0 | 0.1 | GO:0005000 | vasopressin receptor activity(GO:0005000) |
| 0.0 | 0.5 | GO:0008139 | nuclear localization sequence binding(GO:0008139) |
| 0.0 | 0.8 | GO:0019003 | GDP binding(GO:0019003) |
| 0.0 | 1.0 | GO:0005544 | calcium-dependent phospholipid binding(GO:0005544) |
| 0.0 | 0.1 | GO:0015350 | methotrexate transporter activity(GO:0015350) |
| 0.0 | 0.1 | GO:0043023 | ribosomal large subunit binding(GO:0043023) |
| 0.0 | 0.1 | GO:0003987 | acetate-CoA ligase activity(GO:0003987) |
| 0.0 | 0.1 | GO:0070181 | small ribosomal subunit rRNA binding(GO:0070181) |
| 0.0 | 0.1 | GO:0003938 | IMP dehydrogenase activity(GO:0003938) |
| 0.0 | 0.6 | GO:0003743 | translation initiation factor activity(GO:0003743) |
| 0.0 | 6.1 | GO:0030695 | GTPase regulator activity(GO:0030695) |
| 0.0 | 0.1 | GO:0047493 | sphingomyelin synthase activity(GO:0033188) ceramide cholinephosphotransferase activity(GO:0047493) |
| 0.0 | 3.4 | GO:0051020 | GTPase binding(GO:0051020) |
| 0.0 | 0.2 | GO:0046966 | thyroid hormone receptor binding(GO:0046966) |
| 0.0 | 0.4 | GO:0004623 | phospholipase A2 activity(GO:0004623) |
| 0.0 | 0.1 | GO:0052654 | branched-chain-amino-acid transaminase activity(GO:0004084) L-leucine transaminase activity(GO:0052654) L-valine transaminase activity(GO:0052655) L-isoleucine transaminase activity(GO:0052656) |
| 0.0 | 0.5 | GO:0030507 | spectrin binding(GO:0030507) |
| 0.0 | 0.9 | GO:0008565 | protein transporter activity(GO:0008565) |
| 0.0 | 0.2 | GO:0051059 | NF-kappaB binding(GO:0051059) |
| 0.0 | 0.2 | GO:0042166 | acetylcholine binding(GO:0042166) |
Gene overrepresentation in curated gene sets: canonical pathways category:
| Log-likelihood per target | Total log-likelihood | Term | Description |
|---|---|---|---|
| 0.2 | 20.3 | PID NFAT TFPATHWAY | Calcineurin-regulated NFAT-dependent transcription in lymphocytes |
| 0.2 | 8.7 | PID IL12 STAT4 PATHWAY | IL12 signaling mediated by STAT4 |
| 0.1 | 2.6 | ST STAT3 PATHWAY | STAT3 Pathway |
| 0.1 | 0.7 | PID AR NONGENOMIC PATHWAY | Nongenotropic Androgen signaling |
| 0.1 | 4.3 | PID ANTHRAX PATHWAY | Cellular roles of Anthrax toxin |
| 0.1 | 10.4 | ST T CELL SIGNAL TRANSDUCTION | T Cell Signal Transduction |
| 0.1 | 6.4 | PID IL12 2PATHWAY | IL12-mediated signaling events |
| 0.1 | 5.4 | PID IL2 STAT5 PATHWAY | IL2 signaling events mediated by STAT5 |
| 0.1 | 7.8 | PID ARF6 PATHWAY | Arf6 signaling events |
| 0.1 | 1.9 | PID ERB GENOMIC PATHWAY | Validated nuclear estrogen receptor beta network |
| 0.1 | 2.9 | PID EPO PATHWAY | EPO signaling pathway |
| 0.1 | 3.0 | PID P38 MKK3 6PATHWAY | p38 MAPK signaling pathway |
| 0.1 | 1.2 | PID IL23 PATHWAY | IL23-mediated signaling events |
| 0.1 | 4.0 | ST ERK1 ERK2 MAPK PATHWAY | ERK1/ERK2 MAPK Pathway |
| 0.1 | 7.1 | PID HDAC CLASSII PATHWAY | Signaling events mediated by HDAC Class II |
| 0.1 | 1.2 | SA PTEN PATHWAY | PTEN is a tumor suppressor that dephosphorylates the lipid messenger phosphatidylinositol triphosphate. |
| 0.1 | 2.6 | PID IL3 PATHWAY | IL3-mediated signaling events |
| 0.1 | 0.5 | PID S1P META PATHWAY | Sphingosine 1-phosphate (S1P) pathway |
| 0.1 | 6.3 | PID RAC1 PATHWAY | RAC1 signaling pathway |
| 0.1 | 2.0 | SA MMP CYTOKINE CONNECTION | Cytokines can induce activation of matrix metalloproteinases, which degrade extracellular matrix. |
| 0.1 | 4.0 | PID HES HEY PATHWAY | Notch-mediated HES/HEY network |
| 0.1 | 1.7 | PID WNT CANONICAL PATHWAY | Canonical Wnt signaling pathway |
| 0.1 | 1.6 | PID FCER1 PATHWAY | Fc-epsilon receptor I signaling in mast cells |
| 0.0 | 0.7 | PID P38 ALPHA BETA PATHWAY | Regulation of p38-alpha and p38-beta |
| 0.0 | 0.9 | PID INTEGRIN CS PATHWAY | Integrin family cell surface interactions |
| 0.0 | 1.4 | PID ARF 3PATHWAY | Arf1 pathway |
| 0.0 | 4.0 | PID MET PATHWAY | Signaling events mediated by Hepatocyte Growth Factor Receptor (c-Met) |
| 0.0 | 1.2 | PID IL2 1PATHWAY | IL2-mediated signaling events |
| 0.0 | 0.5 | PID EPHRINB REV PATHWAY | Ephrin B reverse signaling |
| 0.0 | 0.9 | PID BETA CATENIN DEG PATHWAY | Degradation of beta catenin |
| 0.0 | 5.7 | PID CASPASE PATHWAY | Caspase cascade in apoptosis |
| 0.0 | 1.6 | PID CONE PATHWAY | Visual signal transduction: Cones |
| 0.0 | 2.4 | PID THROMBIN PAR1 PATHWAY | PAR1-mediated thrombin signaling events |
| 0.0 | 1.8 | PID NCADHERIN PATHWAY | N-cadherin signaling events |
| 0.0 | 2.7 | PID TCR PATHWAY | TCR signaling in naïve CD4+ T cells |
| 0.0 | 0.8 | PID IL8 CXCR2 PATHWAY | IL8- and CXCR2-mediated signaling events |
| 0.0 | 0.7 | ST P38 MAPK PATHWAY | p38 MAPK Pathway |
| 0.0 | 1.4 | PID TOLL ENDOGENOUS PATHWAY | Endogenous TLR signaling |
| 0.0 | 1.3 | PID ERBB NETWORK PATHWAY | ErbB receptor signaling network |
| 0.0 | 0.7 | PID PI3KCI AKT PATHWAY | Class I PI3K signaling events mediated by Akt |
| 0.0 | 1.4 | PID TXA2PATHWAY | Thromboxane A2 receptor signaling |
| 0.0 | 2.9 | PID ILK PATHWAY | Integrin-linked kinase signaling |
| 0.0 | 0.6 | PID CXCR3 PATHWAY | CXCR3-mediated signaling events |
| 0.0 | 2.6 | PID PLK1 PATHWAY | PLK1 signaling events |
| 0.0 | 0.3 | PID IL2 PI3K PATHWAY | IL2 signaling events mediated by PI3K |
| 0.0 | 0.6 | PID PI3K PLC TRK PATHWAY | Trk receptor signaling mediated by PI3K and PLC-gamma |
| 0.0 | 0.5 | PID P38 MK2 PATHWAY | p38 signaling mediated by MAPKAP kinases |
| 0.0 | 0.7 | PID FAK PATHWAY | Signaling events mediated by focal adhesion kinase |
| 0.0 | 1.0 | PID PTP1B PATHWAY | Signaling events mediated by PTP1B |
| 0.0 | 0.5 | PID MAPK TRK PATHWAY | Trk receptor signaling mediated by the MAPK pathway |
| 0.0 | 1.1 | PID LIS1 PATHWAY | Lissencephaly gene (LIS1) in neuronal migration and development |
| 0.0 | 1.4 | PID CXCR4 PATHWAY | CXCR4-mediated signaling events |
| 0.0 | 0.8 | PID ATF2 PATHWAY | ATF-2 transcription factor network |
| 0.0 | 2.6 | PID AR PATHWAY | Coregulation of Androgen receptor activity |
| 0.0 | 3.0 | PID MYC ACTIV PATHWAY | Validated targets of C-MYC transcriptional activation |
| 0.0 | 0.8 | PID ALK1 PATHWAY | ALK1 signaling events |
| 0.0 | 0.4 | PID RAC1 REG PATHWAY | Regulation of RAC1 activity |
| 0.0 | 1.2 | PID RB 1PATHWAY | Regulation of retinoblastoma protein |
| 0.0 | 1.7 | PID SMAD2 3NUCLEAR PATHWAY | Regulation of nuclear SMAD2/3 signaling |
| 0.0 | 0.5 | PID HIF1A PATHWAY | Hypoxic and oxygen homeostasis regulation of HIF-1-alpha |
| 0.0 | 0.4 | PID LPA4 PATHWAY | LPA4-mediated signaling events |
| 0.0 | 0.2 | PID ERBB2 ERBB3 PATHWAY | ErbB2/ErbB3 signaling events |
| 0.0 | 0.6 | PID AP1 PATHWAY | AP-1 transcription factor network |
| 0.0 | 1.3 | PID E2F PATHWAY | E2F transcription factor network |
| 0.0 | 0.5 | PID AURORA A PATHWAY | Aurora A signaling |
| 0.0 | 0.5 | PID ARF6 TRAFFICKING PATHWAY | Arf6 trafficking events |
| 0.0 | 0.3 | PID BCR 5PATHWAY | BCR signaling pathway |
| 0.0 | 0.3 | PID CDC42 PATHWAY | CDC42 signaling events |
| 0.0 | 0.2 | PID DNA PK PATHWAY | DNA-PK pathway in nonhomologous end joining |
| 0.0 | 0.3 | PID IL1 PATHWAY | IL1-mediated signaling events |
| 0.0 | 0.3 | PID ALPHA SYNUCLEIN PATHWAY | Alpha-synuclein signaling |
Gene overrepresentation in curated gene sets: REACTOME pathways category:
| Log-likelihood per target | Total log-likelihood | Term | Description |
|---|---|---|---|
| 0.7 | 9.9 | REACTOME PASSIVE TRANSPORT BY AQUAPORINS | Genes involved in Passive Transport by Aquaporins |
| 0.3 | 3.0 | REACTOME ENDOSOMAL VACUOLAR PATHWAY | Genes involved in Endosomal/Vacuolar pathway |
| 0.3 | 8.8 | REACTOME PHOSPHORYLATION OF CD3 AND TCR ZETA CHAINS | Genes involved in Phosphorylation of CD3 and TCR zeta chains |
| 0.3 | 6.4 | REACTOME CD28 DEPENDENT VAV1 PATHWAY | Genes involved in CD28 dependent Vav1 pathway |
| 0.2 | 12.1 | REACTOME DOWNSTREAM TCR SIGNALING | Genes involved in Downstream TCR signaling |
| 0.2 | 4.6 | REACTOME THE NLRP3 INFLAMMASOME | Genes involved in The NLRP3 inflammasome |
| 0.2 | 0.6 | REACTOME BINDING AND ENTRY OF HIV VIRION | Genes involved in Binding and entry of HIV virion |
| 0.1 | 3.0 | REACTOME IL 6 SIGNALING | Genes involved in Interleukin-6 signaling |
| 0.1 | 1.2 | REACTOME APOBEC3G MEDIATED RESISTANCE TO HIV1 INFECTION | Genes involved in APOBEC3G mediated resistance to HIV-1 infection |
| 0.1 | 4.5 | REACTOME CITRIC ACID CYCLE TCA CYCLE | Genes involved in Citric acid cycle (TCA cycle) |
| 0.1 | 15.9 | REACTOME IMMUNOREGULATORY INTERACTIONS BETWEEN A LYMPHOID AND A NON LYMPHOID CELL | Genes involved in Immunoregulatory interactions between a Lymphoid and a non-Lymphoid cell |
| 0.1 | 4.6 | REACTOME TCR SIGNALING | Genes involved in TCR signaling |
| 0.1 | 2.8 | REACTOME NOTCH HLH TRANSCRIPTION PATHWAY | Genes involved in Notch-HLH transcription pathway |
| 0.1 | 6.9 | REACTOME LATENT INFECTION OF HOMO SAPIENS WITH MYCOBACTERIUM TUBERCULOSIS | Genes involved in Latent infection of Homo sapiens with Mycobacterium tuberculosis |
| 0.1 | 2.7 | REACTOME ERKS ARE INACTIVATED | Genes involved in ERKs are inactivated |
| 0.1 | 2.1 | REACTOME ABACAVIR TRANSPORT AND METABOLISM | Genes involved in Abacavir transport and metabolism |
| 0.1 | 4.3 | REACTOME INSULIN SYNTHESIS AND PROCESSING | Genes involved in Insulin Synthesis and Processing |
| 0.1 | 1.7 | REACTOME SIGNALING BY CONSTITUTIVELY ACTIVE EGFR | Genes involved in Signaling by constitutively active EGFR |
| 0.1 | 1.2 | REACTOME SOS MEDIATED SIGNALLING | Genes involved in SOS-mediated signalling |
| 0.1 | 2.1 | REACTOME SYNTHESIS OF PIPS AT THE EARLY ENDOSOME MEMBRANE | Genes involved in Synthesis of PIPs at the early endosome membrane |
| 0.1 | 4.6 | REACTOME EGFR DOWNREGULATION | Genes involved in EGFR downregulation |
| 0.1 | 25.8 | REACTOME SIGNALING BY RHO GTPASES | Genes involved in Signaling by Rho GTPases |
| 0.1 | 2.0 | REACTOME HYALURONAN UPTAKE AND DEGRADATION | Genes involved in Hyaluronan uptake and degradation |
| 0.1 | 2.0 | REACTOME CTNNB1 PHOSPHORYLATION CASCADE | Genes involved in Beta-catenin phosphorylation cascade |
| 0.1 | 5.9 | REACTOME CHEMOKINE RECEPTORS BIND CHEMOKINES | Genes involved in Chemokine receptors bind chemokines |
| 0.1 | 4.1 | REACTOME EFFECTS OF PIP2 HYDROLYSIS | Genes involved in Effects of PIP2 hydrolysis |
| 0.1 | 6.9 | REACTOME NOTCH1 INTRACELLULAR DOMAIN REGULATES TRANSCRIPTION | Genes involved in NOTCH1 Intracellular Domain Regulates Transcription |
| 0.1 | 1.6 | REACTOME IL 7 SIGNALING | Genes involved in Interleukin-7 signaling |
| 0.1 | 1.3 | REACTOME RECYCLING OF BILE ACIDS AND SALTS | Genes involved in Recycling of bile acids and salts |
| 0.1 | 2.3 | REACTOME CYTOSOLIC SULFONATION OF SMALL MOLECULES | Genes involved in Cytosolic sulfonation of small molecules |
| 0.1 | 1.1 | REACTOME INFLAMMASOMES | Genes involved in Inflammasomes |
| 0.1 | 2.0 | REACTOME ERK MAPK TARGETS | Genes involved in ERK/MAPK targets |
| 0.1 | 2.1 | REACTOME HORMONE SENSITIVE LIPASE HSL MEDIATED TRIACYLGLYCEROL HYDROLYSIS | Genes involved in Hormone-sensitive lipase (HSL)-mediated triacylglycerol hydrolysis |
| 0.1 | 0.8 | REACTOME DESTABILIZATION OF MRNA BY BRF1 | Genes involved in Destabilization of mRNA by Butyrate Response Factor 1 (BRF1) |
| 0.1 | 8.9 | REACTOME MHC CLASS II ANTIGEN PRESENTATION | Genes involved in MHC class II antigen presentation |
| 0.1 | 0.9 | REACTOME GLUCAGON SIGNALING IN METABOLIC REGULATION | Genes involved in Glucagon signaling in metabolic regulation |
| 0.1 | 1.7 | REACTOME PLATELET CALCIUM HOMEOSTASIS | Genes involved in Platelet calcium homeostasis |
| 0.1 | 0.3 | REACTOME IRAK2 MEDIATED ACTIVATION OF TAK1 COMPLEX UPON TLR7 8 OR 9 STIMULATION | Genes involved in IRAK2 mediated activation of TAK1 complex upon TLR7/8 or 9 stimulation |
| 0.1 | 6.0 | REACTOME ANTIGEN PROCESSING CROSS PRESENTATION | Genes involved in Antigen processing-Cross presentation |
| 0.1 | 0.6 | REACTOME DESTABILIZATION OF MRNA BY KSRP | Genes involved in Destabilization of mRNA by KSRP |
| 0.1 | 1.5 | REACTOME ENDOGENOUS STEROLS | Genes involved in Endogenous sterols |
| 0.1 | 0.8 | REACTOME THE ROLE OF NEF IN HIV1 REPLICATION AND DISEASE PATHOGENESIS | Genes involved in The role of Nef in HIV-1 replication and disease pathogenesis |
| 0.1 | 3.3 | REACTOME MYOGENESIS | Genes involved in Myogenesis |
| 0.1 | 6.5 | REACTOME MITOTIC PROMETAPHASE | Genes involved in Mitotic Prometaphase |
| 0.0 | 1.0 | REACTOME PROLACTIN RECEPTOR SIGNALING | Genes involved in Prolactin receptor signaling |
| 0.0 | 1.1 | REACTOME P2Y RECEPTORS | Genes involved in P2Y receptors |
| 0.0 | 10.3 | REACTOME G ALPHA I SIGNALLING EVENTS | Genes involved in G alpha (i) signalling events |
| 0.0 | 0.3 | REACTOME IRAK1 RECRUITS IKK COMPLEX | Genes involved in IRAK1 recruits IKK complex |
| 0.0 | 1.9 | REACTOME PERK REGULATED GENE EXPRESSION | Genes involved in PERK regulated gene expression |
| 0.0 | 1.3 | REACTOME NUCLEOTIDE BINDING DOMAIN LEUCINE RICH REPEAT CONTAINING RECEPTOR NLR SIGNALING PATHWAYS | Genes involved in Nucleotide-binding domain, leucine rich repeat containing receptor (NLR) signaling pathways |
| 0.0 | 0.5 | REACTOME OXYGEN DEPENDENT PROLINE HYDROXYLATION OF HYPOXIA INDUCIBLE FACTOR ALPHA | Genes involved in Oxygen-dependent Proline Hydroxylation of Hypoxia-inducible Factor Alpha |
| 0.0 | 0.8 | REACTOME ACYL CHAIN REMODELLING OF PG | Genes involved in Acyl chain remodelling of PG |
| 0.0 | 2.1 | REACTOME SPHINGOLIPID DE NOVO BIOSYNTHESIS | Genes involved in Sphingolipid de novo biosynthesis |
| 0.0 | 0.2 | REACTOME RORA ACTIVATES CIRCADIAN EXPRESSION | Genes involved in RORA Activates Circadian Expression |
| 0.0 | 0.1 | REACTOME UNWINDING OF DNA | Genes involved in Unwinding of DNA |
| 0.0 | 0.2 | REACTOME RETROGRADE NEUROTROPHIN SIGNALLING | Genes involved in Retrograde neurotrophin signalling |
| 0.0 | 0.3 | REACTOME SYNTHESIS OF BILE ACIDS AND BILE SALTS VIA 24 HYDROXYCHOLESTEROL | Genes involved in Synthesis of bile acids and bile salts via 24-hydroxycholesterol |
| 0.0 | 1.9 | REACTOME BMAL1 CLOCK NPAS2 ACTIVATES CIRCADIAN EXPRESSION | Genes involved in BMAL1:CLOCK/NPAS2 Activates Circadian Expression |
| 0.0 | 0.4 | REACTOME PRE NOTCH TRANSCRIPTION AND TRANSLATION | Genes involved in Pre-NOTCH Transcription and Translation |
| 0.0 | 1.1 | REACTOME CELL EXTRACELLULAR MATRIX INTERACTIONS | Genes involved in Cell-extracellular matrix interactions |
| 0.0 | 1.0 | REACTOME ENDOSOMAL SORTING COMPLEX REQUIRED FOR TRANSPORT ESCRT | Genes involved in Endosomal Sorting Complex Required For Transport (ESCRT) |
| 0.0 | 0.5 | REACTOME DCC MEDIATED ATTRACTIVE SIGNALING | Genes involved in DCC mediated attractive signaling |
| 0.0 | 1.2 | REACTOME IL 2 SIGNALING | Genes involved in Interleukin-2 signaling |
| 0.0 | 1.0 | REACTOME ALPHA LINOLENIC ACID ALA METABOLISM | Genes involved in alpha-linolenic acid (ALA) metabolism |
| 0.0 | 0.3 | REACTOME NFKB ACTIVATION THROUGH FADD RIP1 PATHWAY MEDIATED BY CASPASE 8 AND10 | Genes involved in NF-kB activation through FADD/RIP-1 pathway mediated by caspase-8 and -10 |
| 0.0 | 0.6 | REACTOME PEPTIDE LIGAND BINDING RECEPTORS | Genes involved in Peptide ligand-binding receptors |
| 0.0 | 0.6 | REACTOME PRE NOTCH PROCESSING IN GOLGI | Genes involved in Pre-NOTCH Processing in Golgi |
| 0.0 | 1.7 | REACTOME G1 PHASE | Genes involved in G1 Phase |
| 0.0 | 1.3 | REACTOME ASSOCIATION OF TRIC CCT WITH TARGET PROTEINS DURING BIOSYNTHESIS | Genes involved in Association of TriC/CCT with target proteins during biosynthesis |
| 0.0 | 0.5 | REACTOME SHC1 EVENTS IN ERBB4 SIGNALING | Genes involved in SHC1 events in ERBB4 signaling |
| 0.0 | 0.9 | REACTOME CONVERSION FROM APC C CDC20 TO APC C CDH1 IN LATE ANAPHASE | Genes involved in Conversion from APC/C:Cdc20 to APC/C:Cdh1 in late anaphase |
| 0.0 | 0.3 | REACTOME ACTIVATION OF BH3 ONLY PROTEINS | Genes involved in Activation of BH3-only proteins |
| 0.0 | 1.5 | REACTOME PACKAGING OF TELOMERE ENDS | Genes involved in Packaging Of Telomere Ends |
| 0.0 | 0.6 | REACTOME CD28 DEPENDENT PI3K AKT SIGNALING | Genes involved in CD28 dependent PI3K/Akt signaling |
| 0.0 | 6.1 | REACTOME ANTIGEN PROCESSING UBIQUITINATION PROTEASOME DEGRADATION | Genes involved in Antigen processing: Ubiquitination & Proteasome degradation |
| 0.0 | 0.0 | REACTOME INTERACTIONS OF VPR WITH HOST CELLULAR PROTEINS | Genes involved in Interactions of Vpr with host cellular proteins |
| 0.0 | 1.0 | REACTOME CYTOSOLIC TRNA AMINOACYLATION | Genes involved in Cytosolic tRNA aminoacylation |
| 0.0 | 0.5 | REACTOME RESOLUTION OF AP SITES VIA THE SINGLE NUCLEOTIDE REPLACEMENT PATHWAY | Genes involved in Resolution of AP sites via the single-nucleotide replacement pathway |
| 0.0 | 1.7 | REACTOME APOPTOTIC CLEAVAGE OF CELLULAR PROTEINS | Genes involved in Apoptotic cleavage of cellular proteins |
| 0.0 | 0.6 | REACTOME SYNTHESIS OF PA | Genes involved in Synthesis of PA |
| 0.0 | 0.5 | REACTOME SIGNALING BY FGFR1 FUSION MUTANTS | Genes involved in Signaling by FGFR1 fusion mutants |
| 0.0 | 0.1 | REACTOME SLBP DEPENDENT PROCESSING OF REPLICATION DEPENDENT HISTONE PRE MRNAS | Genes involved in SLBP Dependent Processing of Replication-Dependent Histone Pre-mRNAs |
| 0.0 | 0.6 | REACTOME N GLYCAN ANTENNAE ELONGATION | Genes involved in N-Glycan antennae elongation |
| 0.0 | 1.3 | REACTOME ACTIVATION OF CHAPERONE GENES BY XBP1S | Genes involved in Activation of Chaperone Genes by XBP1(S) |
| 0.0 | 0.4 | REACTOME METABOLISM OF NON CODING RNA | Genes involved in Metabolism of non-coding RNA |
| 0.0 | 0.4 | REACTOME PEROXISOMAL LIPID METABOLISM | Genes involved in Peroxisomal lipid metabolism |
| 0.0 | 0.6 | REACTOME TRAF6 MEDIATED IRF7 ACTIVATION | Genes involved in TRAF6 mediated IRF7 activation |
| 0.0 | 0.5 | REACTOME AMINO ACID TRANSPORT ACROSS THE PLASMA MEMBRANE | Genes involved in Amino acid transport across the plasma membrane |
| 0.0 | 0.3 | REACTOME THE ACTIVATION OF ARYLSULFATASES | Genes involved in The activation of arylsulfatases |
| 0.0 | 0.5 | REACTOME IRON UPTAKE AND TRANSPORT | Genes involved in Iron uptake and transport |
| 0.0 | 0.2 | REACTOME RNA POL III CHAIN ELONGATION | Genes involved in RNA Polymerase III Chain Elongation |
| 0.0 | 1.4 | REACTOME RESPIRATORY ELECTRON TRANSPORT | Genes involved in Respiratory electron transport |
| 0.0 | 0.3 | REACTOME DIGESTION OF DIETARY CARBOHYDRATE | Genes involved in Digestion of dietary carbohydrate |
| 0.0 | 1.0 | REACTOME MRNA SPLICING MINOR PATHWAY | Genes involved in mRNA Splicing - Minor Pathway |
| 0.0 | 0.1 | REACTOME UNFOLDED PROTEIN RESPONSE | Genes involved in Unfolded Protein Response |
| 0.0 | 0.1 | REACTOME SIGNALLING TO P38 VIA RIT AND RIN | Genes involved in Signalling to p38 via RIT and RIN |
| 0.0 | 0.3 | REACTOME MTORC1 MEDIATED SIGNALLING | Genes involved in mTORC1-mediated signalling |
| 0.0 | 0.4 | REACTOME TRANSPORT TO THE GOLGI AND SUBSEQUENT MODIFICATION | Genes involved in Transport to the Golgi and subsequent modification |
| 0.0 | 0.2 | REACTOME MRNA DECAY BY 5 TO 3 EXORIBONUCLEASE | Genes involved in mRNA Decay by 5' to 3' Exoribonuclease |
| 0.0 | 0.4 | REACTOME BIOSYNTHESIS OF THE N GLYCAN PRECURSOR DOLICHOL LIPID LINKED OLIGOSACCHARIDE LLO AND TRANSFER TO A NASCENT PROTEIN | Genes involved in Biosynthesis of the N-glycan precursor (dolichol lipid-linked oligosaccharide, LLO) and transfer to a nascent protein |
| 0.0 | 0.2 | REACTOME PRESYNAPTIC NICOTINIC ACETYLCHOLINE RECEPTORS | Genes involved in Presynaptic nicotinic acetylcholine receptors |
| 0.0 | 0.9 | REACTOME MITOCHONDRIAL PROTEIN IMPORT | Genes involved in Mitochondrial Protein Import |
| 0.0 | 0.5 | REACTOME MEIOTIC SYNAPSIS | Genes involved in Meiotic Synapsis |
| 0.0 | 0.4 | REACTOME DARPP 32 EVENTS | Genes involved in DARPP-32 events |
| 0.0 | 1.2 | REACTOME FATTY ACID TRIACYLGLYCEROL AND KETONE BODY METABOLISM | Genes involved in Fatty acid, triacylglycerol, and ketone body metabolism |
| 0.0 | 0.6 | REACTOME SULFUR AMINO ACID METABOLISM | Genes involved in Sulfur amino acid metabolism |
| 0.0 | 0.3 | REACTOME GAP JUNCTION ASSEMBLY | Genes involved in Gap junction assembly |
| 0.0 | 0.4 | REACTOME SEMA4D IN SEMAPHORIN SIGNALING | Genes involved in Sema4D in semaphorin signaling |
| 0.0 | 0.2 | REACTOME CYCLIN A B1 ASSOCIATED EVENTS DURING G2 M TRANSITION | Genes involved in Cyclin A/B1 associated events during G2/M transition |
| 0.0 | 0.2 | REACTOME FORMATION OF THE TERNARY COMPLEX AND SUBSEQUENTLY THE 43S COMPLEX | Genes involved in Formation of the ternary complex, and subsequently, the 43S complex |
| 0.0 | 0.1 | REACTOME CALNEXIN CALRETICULIN CYCLE | Genes involved in Calnexin/calreticulin cycle |
| 0.0 | 0.3 | REACTOME FORMATION OF TUBULIN FOLDING INTERMEDIATES BY CCT TRIC | Genes involved in Formation of tubulin folding intermediates by CCT/TriC |
| 0.0 | 0.4 | REACTOME DOWNSTREAM SIGNALING EVENTS OF B CELL RECEPTOR BCR | Genes involved in Downstream Signaling Events Of B Cell Receptor (BCR) |