Project
Illumina Body Map 2: averaged replicates
Navigation
Downloads
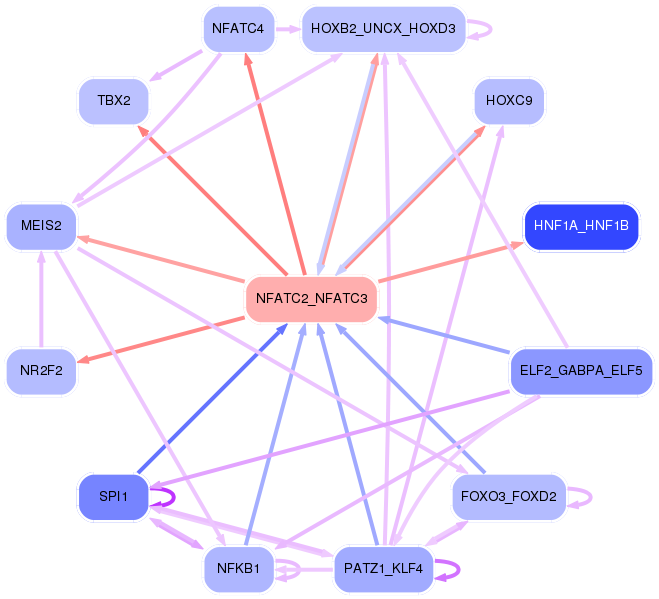
Results for NFATC2_NFATC3
Z-value: 2.54
Motif logo
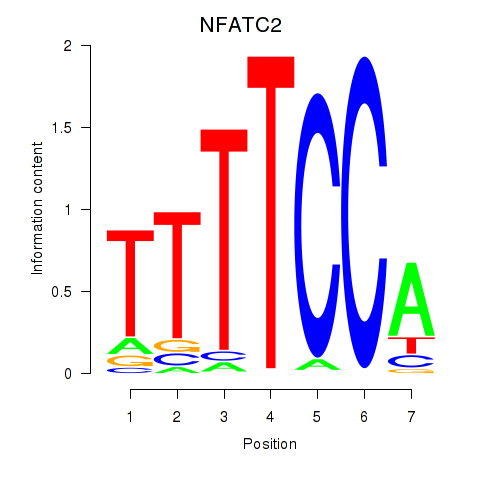
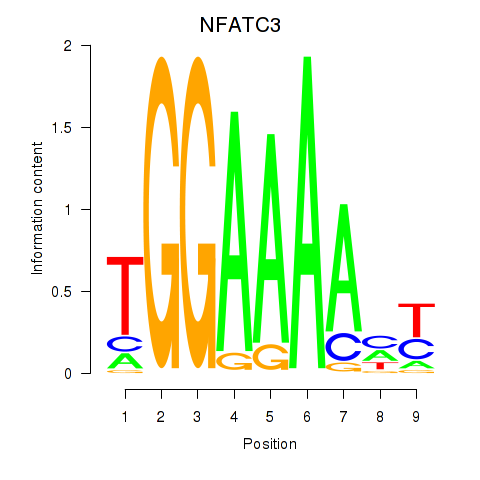
Transcription factors associated with NFATC2_NFATC3
| Gene Symbol | Gene ID | Gene Info |
|---|---|---|
|
NFATC2
|
ENSG00000101096.15 | nuclear factor of activated T cells 2 |
|
NFATC3
|
ENSG00000072736.14 | nuclear factor of activated T cells 3 |
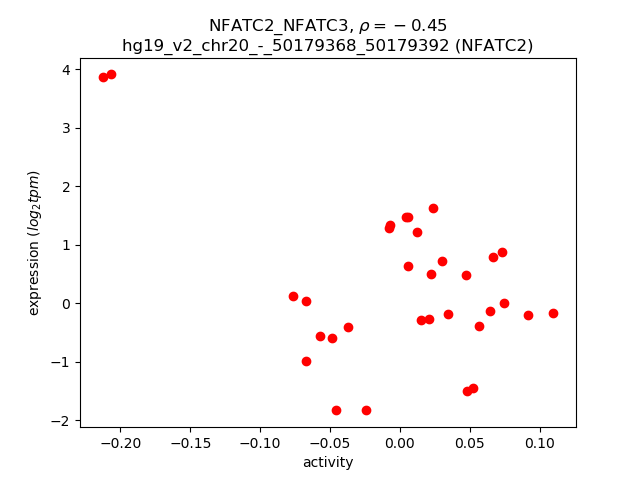
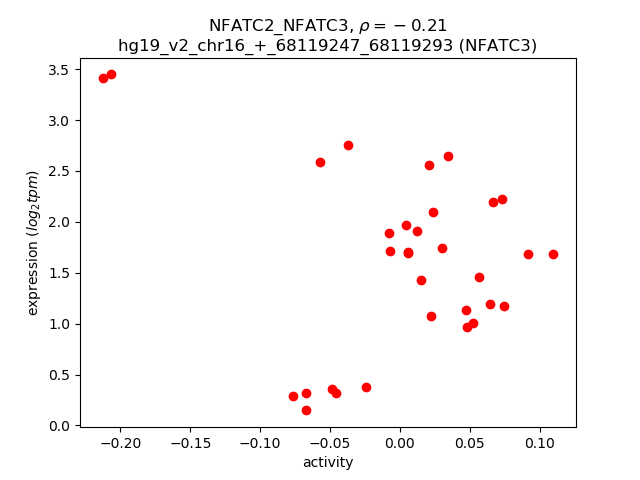
Activity-expression correlation:
| Gene | Promoter | Pearson corr. coef. | P-value | Plot |
|---|---|---|---|---|
| NFATC2 | hg19_v2_chr20_-_50179368_50179392 | -0.45 | 9.1e-03 | Click! |
| NFATC3 | hg19_v2_chr16_+_68119247_68119293 | -0.21 | 2.5e-01 | Click! |
Activity profile of NFATC2_NFATC3 motif
Sorted Z-values of NFATC2_NFATC3 motif
| Promoter | Log-likelihood | Transcript | Gene | Gene Info |
|---|---|---|---|---|
| chr3_-_100565249 | 10.63 |
ENST00000495591.1
ENST00000383691.4 ENST00000466947.1 |
ABI3BP
|
ABI family, member 3 (NESH) binding protein |
| chr12_-_91573249 | 7.52 |
ENST00000550099.1
ENST00000546391.1 ENST00000551354.1 |
DCN
|
decorin |
| chr14_-_92413353 | 6.47 |
ENST00000556154.1
|
FBLN5
|
fibulin 5 |
| chr14_+_24837226 | 6.38 |
ENST00000554050.1
ENST00000554903.1 ENST00000554779.1 ENST00000250373.4 ENST00000553708.1 |
NFATC4
|
nuclear factor of activated T-cells, cytoplasmic, calcineurin-dependent 4 |
| chr17_+_59477233 | 6.33 |
ENST00000240328.3
|
TBX2
|
T-box 2 |
| chr12_-_91573132 | 6.29 |
ENST00000550563.1
ENST00000546370.1 |
DCN
|
decorin |
| chr12_-_91573316 | 5.81 |
ENST00000393155.1
|
DCN
|
decorin |
| chr1_+_86046433 | 5.67 |
ENST00000451137.2
|
CYR61
|
cysteine-rich, angiogenic inducer, 61 |
| chr15_+_45722727 | 5.62 |
ENST00000396650.2
ENST00000558435.1 ENST00000344300.3 |
C15orf48
|
chromosome 15 open reading frame 48 |
| chr15_+_96869165 | 5.52 |
ENST00000421109.2
|
NR2F2
|
nuclear receptor subfamily 2, group F, member 2 |
| chr15_-_65503801 | 5.51 |
ENST00000261883.4
|
CILP
|
cartilage intermediate layer protein, nucleotide pyrophosphohydrolase |
| chr11_+_101983176 | 5.47 |
ENST00000524575.1
|
YAP1
|
Yes-associated protein 1 |
| chr1_+_46640750 | 5.42 |
ENST00000372003.1
|
TSPAN1
|
tetraspanin 1 |
| chr9_-_35691017 | 5.41 |
ENST00000378292.3
|
TPM2
|
tropomyosin 2 (beta) |
| chr11_-_10590238 | 5.26 |
ENST00000256178.3
|
LYVE1
|
lymphatic vessel endothelial hyaluronan receptor 1 |
| chr3_-_112360116 | 5.12 |
ENST00000206423.3
ENST00000439685.2 |
CCDC80
|
coiled-coil domain containing 80 |
| chr12_+_54393880 | 5.00 |
ENST00000303450.4
|
HOXC9
|
homeobox C9 |
| chr11_-_10590118 | 4.63 |
ENST00000529598.1
|
LYVE1
|
lymphatic vessel endothelial hyaluronan receptor 1 |
| chr11_-_68780824 | 4.59 |
ENST00000441623.1
ENST00000309099.6 |
MRGPRF
|
MAS-related GPR, member F |
| chr8_-_23712312 | 4.43 |
ENST00000290271.2
|
STC1
|
stanniocalcin 1 |
| chr12_-_7244469 | 4.22 |
ENST00000538050.1
ENST00000536053.2 |
C1R
|
complement component 1, r subcomponent |
| chr14_-_92413727 | 4.19 |
ENST00000267620.10
|
FBLN5
|
fibulin 5 |
| chr2_-_163099885 | 4.16 |
ENST00000443424.1
|
FAP
|
fibroblast activation protein, alpha |
| chr17_-_74528128 | 4.13 |
ENST00000590175.1
|
CYGB
|
cytoglobin |
| chr11_-_123065989 | 4.06 |
ENST00000448775.2
|
CLMP
|
CXADR-like membrane protein |
| chr2_-_190044480 | 4.05 |
ENST00000374866.3
|
COL5A2
|
collagen, type V, alpha 2 |
| chr2_-_163100045 | 4.05 |
ENST00000188790.4
|
FAP
|
fibroblast activation protein, alpha |
| chr16_-_66952779 | 4.03 |
ENST00000570262.1
ENST00000394055.3 ENST00000299752.4 |
CDH16
|
cadherin 16, KSP-cadherin |
| chr17_-_36105009 | 3.91 |
ENST00000560016.1
ENST00000427275.2 ENST00000561193.1 |
HNF1B
|
HNF1 homeobox B |
| chr8_+_70404996 | 3.86 |
ENST00000402687.4
ENST00000419716.3 |
SULF1
|
sulfatase 1 |
| chr2_+_177028805 | 3.67 |
ENST00000249440.3
|
HOXD3
|
homeobox D3 |
| chr8_+_98900132 | 3.64 |
ENST00000520016.1
|
MATN2
|
matrilin 2 |
| chr8_-_95274536 | 3.63 |
ENST00000297596.2
ENST00000396194.2 |
GEM
|
GTP binding protein overexpressed in skeletal muscle |
| chr8_+_102504979 | 3.57 |
ENST00000395927.1
|
GRHL2
|
grainyhead-like 2 (Drosophila) |
| chr15_-_37391614 | 3.40 |
ENST00000219869.9
|
MEIS2
|
Meis homeobox 2 |
| chr15_-_37391507 | 3.39 |
ENST00000557796.2
ENST00000397620.2 |
MEIS2
|
Meis homeobox 2 |
| chr2_-_238322770 | 3.34 |
ENST00000472056.1
|
COL6A3
|
collagen, type VI, alpha 3 |
| chr16_+_66400533 | 3.31 |
ENST00000341529.3
|
CDH5
|
cadherin 5, type 2 (vascular endothelium) |
| chr16_-_66952742 | 3.26 |
ENST00000565235.2
ENST00000568632.1 ENST00000565796.1 |
CDH16
|
cadherin 16, KSP-cadherin |
| chr12_-_9268707 | 3.25 |
ENST00000318602.7
|
A2M
|
alpha-2-macroglobulin |
| chr12_+_50344516 | 3.25 |
ENST00000199280.3
ENST00000550862.1 |
AQP2
|
aquaporin 2 (collecting duct) |
| chr15_-_37392086 | 3.21 |
ENST00000561208.1
|
MEIS2
|
Meis homeobox 2 |
| chr8_-_13134045 | 3.20 |
ENST00000512044.2
|
DLC1
|
deleted in liver cancer 1 |
| chr1_+_170632250 | 3.17 |
ENST00000367760.3
|
PRRX1
|
paired related homeobox 1 |
| chr3_+_99357319 | 3.16 |
ENST00000452013.1
ENST00000261037.3 ENST00000273342.4 |
COL8A1
|
collagen, type VIII, alpha 1 |
| chr2_-_238322800 | 3.15 |
ENST00000392004.3
ENST00000433762.1 ENST00000347401.3 ENST00000353578.4 ENST00000346358.4 ENST00000392003.2 |
COL6A3
|
collagen, type VI, alpha 3 |
| chr11_-_119293872 | 3.15 |
ENST00000524970.1
|
THY1
|
Thy-1 cell surface antigen |
| chr9_+_35806082 | 3.09 |
ENST00000447210.1
|
NPR2
|
natriuretic peptide receptor B/guanylate cyclase B (atrionatriuretic peptide receptor B) |
| chr6_+_152011628 | 3.08 |
ENST00000404742.1
ENST00000440973.1 |
ESR1
|
estrogen receptor 1 |
| chr21_+_27011584 | 3.07 |
ENST00000400532.1
ENST00000480456.1 ENST00000312957.5 |
JAM2
|
junctional adhesion molecule 2 |
| chr1_-_178838404 | 3.05 |
ENST00000444255.1
|
ANGPTL1
|
angiopoietin-like 1 |
| chr17_-_1389228 | 3.02 |
ENST00000438665.2
|
MYO1C
|
myosin IC |
| chr1_+_209602771 | 2.93 |
ENST00000440276.1
|
MIR205HG
|
MIR205 host gene (non-protein coding) |
| chr17_-_1389419 | 2.93 |
ENST00000575158.1
|
MYO1C
|
myosin IC |
| chr5_+_140514782 | 2.92 |
ENST00000231134.5
|
PCDHB5
|
protocadherin beta 5 |
| chr2_-_238323007 | 2.90 |
ENST00000295550.4
|
COL6A3
|
collagen, type VI, alpha 3 |
| chr5_+_140480083 | 2.90 |
ENST00000231130.2
|
PCDHB3
|
protocadherin beta 3 |
| chr1_+_38022513 | 2.90 |
ENST00000296218.7
|
DNALI1
|
dynein, axonemal, light intermediate chain 1 |
| chr3_+_148447887 | 2.84 |
ENST00000475347.1
ENST00000474935.1 ENST00000461609.1 |
AGTR1
|
angiotensin II receptor, type 1 |
| chr17_-_46688334 | 2.79 |
ENST00000239165.7
|
HOXB7
|
homeobox B7 |
| chr4_-_87770416 | 2.77 |
ENST00000273905.6
|
SLC10A6
|
solute carrier family 10 (sodium/bile acid cotransporter), member 6 |
| chr1_+_153651078 | 2.76 |
ENST00000368680.3
|
NPR1
|
natriuretic peptide receptor A/guanylate cyclase A (atrionatriuretic peptide receptor A) |
| chr9_-_13165457 | 2.72 |
ENST00000542239.1
ENST00000538841.1 ENST00000433359.2 |
MPDZ
|
multiple PDZ domain protein |
| chr2_-_163099546 | 2.70 |
ENST00000447386.1
|
FAP
|
fibroblast activation protein, alpha |
| chr3_+_25469724 | 2.69 |
ENST00000437042.2
|
RARB
|
retinoic acid receptor, beta |
| chr1_+_38022572 | 2.69 |
ENST00000541606.1
|
DNALI1
|
dynein, axonemal, light intermediate chain 1 |
| chr2_+_48796120 | 2.67 |
ENST00000394754.1
|
STON1-GTF2A1L
|
STON1-GTF2A1L readthrough |
| chrX_+_105192423 | 2.65 |
ENST00000540278.1
|
NRK
|
Nik related kinase |
| chr11_+_34654011 | 2.64 |
ENST00000531794.1
|
EHF
|
ets homologous factor |
| chr1_+_162602244 | 2.64 |
ENST00000367922.3
ENST00000367921.3 |
DDR2
|
discoidin domain receptor tyrosine kinase 2 |
| chr2_-_42160486 | 2.63 |
ENST00000427054.1
|
AC104654.2
|
AC104654.2 |
| chr7_+_134551583 | 2.57 |
ENST00000435928.1
|
CALD1
|
caldesmon 1 |
| chrX_-_154255143 | 2.56 |
ENST00000453950.1
ENST00000423959.1 |
F8
|
coagulation factor VIII, procoagulant component |
| chr2_+_176994408 | 2.56 |
ENST00000429017.1
ENST00000313173.4 ENST00000544999.1 |
HOXD8
|
homeobox D8 |
| chr8_-_81787006 | 2.54 |
ENST00000327835.3
|
ZNF704
|
zinc finger protein 704 |
| chr19_+_11658655 | 2.50 |
ENST00000588935.1
|
CNN1
|
calponin 1, basic, smooth muscle |
| chr11_-_119187826 | 2.49 |
ENST00000264036.4
|
MCAM
|
melanoma cell adhesion molecule |
| chr13_+_37247934 | 2.49 |
ENST00000315190.3
|
SERTM1
|
serine-rich and transmembrane domain containing 1 |
| chr12_-_9268819 | 2.48 |
ENST00000404455.2
|
A2M
|
alpha-2-macroglobulin |
| chr1_-_153538011 | 2.47 |
ENST00000368707.4
|
S100A2
|
S100 calcium binding protein A2 |
| chr11_-_102401469 | 2.45 |
ENST00000260227.4
|
MMP7
|
matrix metallopeptidase 7 (matrilysin, uterine) |
| chr2_+_234580525 | 2.45 |
ENST00000609637.1
|
UGT1A1
|
UDP glucuronosyltransferase 1 family, polypeptide A8 |
| chr17_-_46657473 | 2.44 |
ENST00000332503.5
|
HOXB4
|
homeobox B4 |
| chr11_-_85397167 | 2.44 |
ENST00000316398.3
|
CCDC89
|
coiled-coil domain containing 89 |
| chr5_+_140186647 | 2.43 |
ENST00000512229.2
ENST00000356878.4 ENST00000530339.1 |
PCDHA4
|
protocadherin alpha 4 |
| chr10_+_128593978 | 2.43 |
ENST00000280333.6
|
DOCK1
|
dedicator of cytokinesis 1 |
| chr3_-_195310802 | 2.42 |
ENST00000421243.1
ENST00000453131.1 |
APOD
|
apolipoprotein D |
| chr1_+_82266053 | 2.41 |
ENST00000370715.1
ENST00000370713.1 ENST00000319517.6 ENST00000370717.2 ENST00000394879.1 ENST00000271029.4 ENST00000335786.5 |
LPHN2
|
latrophilin 2 |
| chr6_-_41715128 | 2.41 |
ENST00000356667.4
ENST00000373025.3 ENST00000425343.2 |
PGC
|
progastricsin (pepsinogen C) |
| chr15_+_43885252 | 2.40 |
ENST00000453782.1
ENST00000300283.6 ENST00000437924.1 ENST00000450086.2 |
CKMT1B
|
creatine kinase, mitochondrial 1B |
| chr15_-_68724490 | 2.40 |
ENST00000315757.7
ENST00000423218.2 |
ITGA11
|
integrin, alpha 11 |
| chr6_+_127439749 | 2.39 |
ENST00000356698.4
|
RSPO3
|
R-spondin 3 |
| chr4_+_41258786 | 2.36 |
ENST00000503431.1
ENST00000284440.4 ENST00000508768.1 ENST00000512788.1 |
UCHL1
|
ubiquitin carboxyl-terminal esterase L1 (ubiquitin thiolesterase) |
| chrX_+_102585124 | 2.33 |
ENST00000332431.4
ENST00000372666.1 |
TCEAL7
|
transcription elongation factor A (SII)-like 7 |
| chr11_+_65190245 | 2.31 |
ENST00000499732.1
ENST00000501122.2 ENST00000601801.1 |
NEAT1
|
nuclear paraspeckle assembly transcript 1 (non-protein coding) |
| chr14_+_63671105 | 2.31 |
ENST00000316754.3
|
RHOJ
|
ras homolog family member J |
| chr17_-_53800217 | 2.29 |
ENST00000424486.2
|
TMEM100
|
transmembrane protein 100 |
| chr1_-_150780757 | 2.29 |
ENST00000271651.3
|
CTSK
|
cathepsin K |
| chr18_-_47376197 | 2.29 |
ENST00000592688.1
|
MYO5B
|
myosin VB |
| chr5_+_140174429 | 2.28 |
ENST00000520672.2
ENST00000378132.1 ENST00000526136.1 |
PCDHA2
|
protocadherin alpha 2 |
| chr9_-_13175823 | 2.24 |
ENST00000545857.1
|
MPDZ
|
multiple PDZ domain protein |
| chr12_-_91539918 | 2.23 |
ENST00000548218.1
|
DCN
|
decorin |
| chr8_+_106331769 | 2.23 |
ENST00000520492.1
|
ZFPM2
|
zinc finger protein, FOG family member 2 |
| chr5_-_158526756 | 2.23 |
ENST00000313708.6
ENST00000517373.1 |
EBF1
|
early B-cell factor 1 |
| chr3_-_134092561 | 2.21 |
ENST00000510560.1
ENST00000504234.1 ENST00000515172.1 |
AMOTL2
|
angiomotin like 2 |
| chr17_-_39041479 | 2.20 |
ENST00000167588.3
|
KRT20
|
keratin 20 |
| chr4_-_100212132 | 2.18 |
ENST00000209668.2
|
ADH1A
|
alcohol dehydrogenase 1A (class I), alpha polypeptide |
| chr7_+_20687017 | 2.17 |
ENST00000258738.6
|
ABCB5
|
ATP-binding cassette, sub-family B (MDR/TAP), member 5 |
| chr16_+_31483451 | 2.13 |
ENST00000565360.1
ENST00000361773.3 |
TGFB1I1
|
transforming growth factor beta 1 induced transcript 1 |
| chr14_-_21562671 | 2.11 |
ENST00000554923.1
|
ZNF219
|
zinc finger protein 219 |
| chrX_-_17878827 | 2.11 |
ENST00000360011.1
|
RAI2
|
retinoic acid induced 2 |
| chr2_+_234580499 | 2.09 |
ENST00000354728.4
|
UGT1A9
|
UDP glucuronosyltransferase 1 family, polypeptide A9 |
| chr4_+_151503077 | 2.07 |
ENST00000317605.4
|
MAB21L2
|
mab-21-like 2 (C. elegans) |
| chr11_+_27015628 | 2.06 |
ENST00000318627.2
|
FIBIN
|
fin bud initiation factor homolog (zebrafish) |
| chr15_+_74466744 | 2.05 |
ENST00000560862.1
ENST00000395118.1 |
ISLR
|
immunoglobulin superfamily containing leucine-rich repeat |
| chr1_-_204135450 | 2.05 |
ENST00000272190.8
ENST00000367195.2 |
REN
|
renin |
| chr12_-_6484715 | 2.04 |
ENST00000228916.2
|
SCNN1A
|
sodium channel, non-voltage-gated 1 alpha subunit |
| chr4_-_41216492 | 2.02 |
ENST00000503503.1
ENST00000509446.1 ENST00000503264.1 ENST00000508707.1 ENST00000508593.1 |
APBB2
|
amyloid beta (A4) precursor protein-binding, family B, member 2 |
| chr3_+_148415571 | 2.01 |
ENST00000497524.1
ENST00000349243.3 ENST00000542281.1 ENST00000418473.2 ENST00000404754.2 |
AGTR1
|
angiotensin II receptor, type 1 |
| chr8_-_13134246 | 2.01 |
ENST00000503161.2
|
DLC1
|
deleted in liver cancer 1 |
| chr15_+_43985084 | 1.96 |
ENST00000434505.1
ENST00000411750.1 |
CKMT1A
|
creatine kinase, mitochondrial 1A |
| chr12_-_50616122 | 1.96 |
ENST00000552823.1
ENST00000552909.1 |
LIMA1
|
LIM domain and actin binding 1 |
| chr1_+_209602609 | 1.96 |
ENST00000458250.1
|
MIR205HG
|
MIR205 host gene (non-protein coding) |
| chr19_+_18496957 | 1.96 |
ENST00000252809.3
|
GDF15
|
growth differentiation factor 15 |
| chr4_+_41614909 | 1.96 |
ENST00000509454.1
ENST00000396595.3 ENST00000381753.4 |
LIMCH1
|
LIM and calponin homology domains 1 |
| chrX_-_10544942 | 1.94 |
ENST00000380779.1
|
MID1
|
midline 1 (Opitz/BBB syndrome) |
| chr1_-_156675535 | 1.94 |
ENST00000368221.1
|
CRABP2
|
cellular retinoic acid binding protein 2 |
| chr12_-_104443890 | 1.94 |
ENST00000547583.1
ENST00000360814.4 ENST00000546851.1 |
GLT8D2
|
glycosyltransferase 8 domain containing 2 |
| chr13_-_33780133 | 1.93 |
ENST00000399365.3
|
STARD13
|
StAR-related lipid transfer (START) domain containing 13 |
| chr4_-_73434498 | 1.86 |
ENST00000286657.4
|
ADAMTS3
|
ADAM metallopeptidase with thrombospondin type 1 motif, 3 |
| chr12_+_54422142 | 1.86 |
ENST00000243108.4
|
HOXC6
|
homeobox C6 |
| chr22_-_38380543 | 1.86 |
ENST00000396884.2
|
SOX10
|
SRY (sex determining region Y)-box 10 |
| chr3_+_151451707 | 1.86 |
ENST00000356517.3
|
AADACL2
|
arylacetamide deacetylase-like 2 |
| chr6_+_151662815 | 1.86 |
ENST00000359755.5
|
AKAP12
|
A kinase (PRKA) anchor protein 12 |
| chr1_-_156675368 | 1.85 |
ENST00000368222.3
|
CRABP2
|
cellular retinoic acid binding protein 2 |
| chr4_-_41216473 | 1.84 |
ENST00000513140.1
|
APBB2
|
amyloid beta (A4) precursor protein-binding, family B, member 2 |
| chr10_-_50323543 | 1.84 |
ENST00000332853.4
ENST00000298454.3 |
VSTM4
|
V-set and transmembrane domain containing 4 |
| chr11_-_9482010 | 1.84 |
ENST00000596206.1
|
AC132192.1
|
LOC644656 protein; Uncharacterized protein |
| chr9_-_95186739 | 1.83 |
ENST00000375550.4
|
OMD
|
osteomodulin |
| chr5_+_38846101 | 1.82 |
ENST00000274276.3
|
OSMR
|
oncostatin M receptor |
| chr16_+_86612112 | 1.82 |
ENST00000320241.3
|
FOXL1
|
forkhead box L1 |
| chr2_+_27301435 | 1.81 |
ENST00000380320.4
|
EMILIN1
|
elastin microfibril interfacer 1 |
| chr14_+_63671577 | 1.81 |
ENST00000555125.1
|
RHOJ
|
ras homolog family member J |
| chr5_+_148960931 | 1.81 |
ENST00000333677.6
|
ARHGEF37
|
Rho guanine nucleotide exchange factor (GEF) 37 |
| chr4_-_41750922 | 1.80 |
ENST00000226382.2
|
PHOX2B
|
paired-like homeobox 2b |
| chr13_-_86373536 | 1.80 |
ENST00000400286.2
|
SLITRK6
|
SLIT and NTRK-like family, member 6 |
| chr12_-_7245018 | 1.79 |
ENST00000543835.1
ENST00000535233.2 |
C1R
|
complement component 1, r subcomponent |
| chr5_+_32788945 | 1.79 |
ENST00000326958.1
|
AC026703.1
|
AC026703.1 |
| chr12_+_12938541 | 1.78 |
ENST00000356591.4
|
APOLD1
|
apolipoprotein L domain containing 1 |
| chr5_-_158526693 | 1.77 |
ENST00000380654.4
|
EBF1
|
early B-cell factor 1 |
| chr6_-_75912508 | 1.76 |
ENST00000416123.2
|
COL12A1
|
collagen, type XII, alpha 1 |
| chr2_-_183387064 | 1.75 |
ENST00000536095.1
ENST00000331935.6 ENST00000358139.2 ENST00000456212.1 |
PDE1A
|
phosphodiesterase 1A, calmodulin-dependent |
| chr6_-_47010061 | 1.75 |
ENST00000371253.2
|
GPR110
|
G protein-coupled receptor 110 |
| chr9_+_124062071 | 1.74 |
ENST00000373818.4
|
GSN
|
gelsolin |
| chr6_-_10415470 | 1.73 |
ENST00000379604.2
ENST00000379613.3 |
TFAP2A
|
transcription factor AP-2 alpha (activating enhancer binding protein 2 alpha) |
| chr7_-_156803329 | 1.70 |
ENST00000252971.6
|
MNX1
|
motor neuron and pancreas homeobox 1 |
| chr22_-_36236265 | 1.70 |
ENST00000414461.2
ENST00000416721.2 ENST00000449924.2 ENST00000262829.7 ENST00000397305.3 |
RBFOX2
|
RNA binding protein, fox-1 homolog (C. elegans) 2 |
| chr20_+_55204351 | 1.70 |
ENST00000201031.2
|
TFAP2C
|
transcription factor AP-2 gamma (activating enhancer binding protein 2 gamma) |
| chr11_-_76381029 | 1.69 |
ENST00000407242.2
ENST00000421973.1 |
LRRC32
|
leucine rich repeat containing 32 |
| chr12_+_26348582 | 1.68 |
ENST00000535504.1
|
SSPN
|
sarcospan |
| chr2_+_149974684 | 1.67 |
ENST00000450639.1
|
LYPD6B
|
LY6/PLAUR domain containing 6B |
| chrX_+_105937068 | 1.67 |
ENST00000324342.3
|
RNF128
|
ring finger protein 128, E3 ubiquitin protein ligase |
| chr12_+_52450298 | 1.67 |
ENST00000550582.2
|
NR4A1
|
nuclear receptor subfamily 4, group A, member 1 |
| chr3_-_73673991 | 1.67 |
ENST00000308537.4
ENST00000263666.4 |
PDZRN3
|
PDZ domain containing ring finger 3 |
| chr5_+_38845960 | 1.66 |
ENST00000502536.1
|
OSMR
|
oncostatin M receptor |
| chr6_-_112575912 | 1.66 |
ENST00000522006.1
ENST00000230538.7 ENST00000519932.1 |
LAMA4
|
laminin, alpha 4 |
| chr4_-_71532207 | 1.66 |
ENST00000543780.1
ENST00000391614.3 |
IGJ
|
immunoglobulin J polypeptide, linker protein for immunoglobulin alpha and mu polypeptides |
| chr20_-_57089934 | 1.65 |
ENST00000439429.1
ENST00000371149.3 |
APCDD1L
|
adenomatosis polyposis coli down-regulated 1-like |
| chr1_-_32169920 | 1.65 |
ENST00000373672.3
ENST00000373668.3 |
COL16A1
|
collagen, type XVI, alpha 1 |
| chr11_-_119293903 | 1.65 |
ENST00000580275.1
|
THY1
|
Thy-1 cell surface antigen |
| chr14_-_21562648 | 1.64 |
ENST00000555270.1
|
ZNF219
|
zinc finger protein 219 |
| chr5_-_42812143 | 1.64 |
ENST00000514985.1
|
SEPP1
|
selenoprotein P, plasma, 1 |
| chr17_+_48912744 | 1.64 |
ENST00000311378.4
|
WFIKKN2
|
WAP, follistatin/kazal, immunoglobulin, kunitz and netrin domain containing 2 |
| chr4_+_55095264 | 1.63 |
ENST00000257290.5
|
PDGFRA
|
platelet-derived growth factor receptor, alpha polypeptide |
| chr20_+_36149602 | 1.62 |
ENST00000062104.2
ENST00000346199.2 |
NNAT
|
neuronatin |
| chr5_+_155753745 | 1.62 |
ENST00000435422.3
ENST00000337851.4 ENST00000447401.1 |
SGCD
|
sarcoglycan, delta (35kDa dystrophin-associated glycoprotein) |
| chr3_+_52828805 | 1.61 |
ENST00000416872.2
ENST00000449956.2 |
ITIH3
|
inter-alpha-trypsin inhibitor heavy chain 3 |
| chr6_+_31916733 | 1.58 |
ENST00000483004.1
|
CFB
|
complement factor B |
| chr11_-_89223883 | 1.58 |
ENST00000528341.1
|
NOX4
|
NADPH oxidase 4 |
| chr12_+_54402790 | 1.58 |
ENST00000040584.4
|
HOXC8
|
homeobox C8 |
| chr1_+_22138758 | 1.55 |
ENST00000344642.2
ENST00000543870.1 |
LDLRAD2
|
low density lipoprotein receptor class A domain containing 2 |
| chr12_-_52585765 | 1.55 |
ENST00000313234.5
ENST00000394815.2 |
KRT80
|
keratin 80 |
| chr12_-_59314246 | 1.55 |
ENST00000320743.3
|
LRIG3
|
leucine-rich repeats and immunoglobulin-like domains 3 |
| chr7_+_120629653 | 1.55 |
ENST00000450913.2
ENST00000340646.5 |
CPED1
|
cadherin-like and PC-esterase domain containing 1 |
| chr3_+_128720424 | 1.54 |
ENST00000480450.1
ENST00000436022.2 |
EFCC1
|
EF-hand and coiled-coil domain containing 1 |
| chr5_+_140207536 | 1.54 |
ENST00000529310.1
ENST00000527624.1 |
PCDHA6
|
protocadherin alpha 6 |
| chr11_-_89224139 | 1.54 |
ENST00000413594.2
|
NOX4
|
NADPH oxidase 4 |
| chr1_-_171621815 | 1.53 |
ENST00000037502.6
|
MYOC
|
myocilin, trabecular meshwork inducible glucocorticoid response |
| chr2_-_183387430 | 1.52 |
ENST00000410103.1
|
PDE1A
|
phosphodiesterase 1A, calmodulin-dependent |
| chr11_+_60467142 | 1.51 |
ENST00000529752.1
|
MS4A8
|
membrane-spanning 4-domains, subfamily A, member 8 |
| chr6_-_112575758 | 1.51 |
ENST00000431543.2
ENST00000453937.2 ENST00000368638.4 ENST00000389463.4 |
LAMA4
|
laminin, alpha 4 |
| chr5_+_140201183 | 1.49 |
ENST00000529619.1
ENST00000529859.1 ENST00000378126.3 |
PCDHA5
|
protocadherin alpha 5 |
| chr5_-_42811986 | 1.49 |
ENST00000511224.1
ENST00000507920.1 ENST00000510965.1 |
SEPP1
|
selenoprotein P, plasma, 1 |
| chr5_-_148758839 | 1.48 |
ENST00000261796.3
|
IL17B
|
interleukin 17B |
| chr12_+_93130311 | 1.47 |
ENST00000344636.3
|
PLEKHG7
|
pleckstrin homology domain containing, family G (with RhoGef domain) member 7 |
| chr15_-_70994612 | 1.47 |
ENST00000558758.1
ENST00000379983.2 ENST00000560441.1 |
UACA
|
uveal autoantigen with coiled-coil domains and ankyrin repeats |
| chr12_+_54447637 | 1.46 |
ENST00000609810.1
ENST00000430889.2 |
HOXC4
HOXC4
|
homeobox C4 Homeobox protein Hox-C4 |
| chr1_-_32169761 | 1.46 |
ENST00000271069.6
|
COL16A1
|
collagen, type XVI, alpha 1 |
| chr11_+_19799327 | 1.45 |
ENST00000540292.1
|
NAV2
|
neuron navigator 2 |
| chr9_+_137533615 | 1.44 |
ENST00000371817.3
|
COL5A1
|
collagen, type V, alpha 1 |
Network of associatons between targets according to the STRING database.

First level regulatory network of NFATC2_NFATC3
Gene Ontology Analysis
Gene overrepresentation in biological_process category:
| Log-likelihood per target | Total log-likelihood | Term | Description |
|---|---|---|---|
| 3.6 | 10.9 | GO:1902362 | melanocyte apoptotic process(GO:1902362) |
| 2.1 | 6.3 | GO:1901207 | mammary placode formation(GO:0060596) regulation of heart looping(GO:1901207) |
| 1.9 | 5.7 | GO:0001868 | regulation of complement activation, lectin pathway(GO:0001868) negative regulation of complement activation, lectin pathway(GO:0001869) |
| 1.8 | 5.5 | GO:1903225 | negative regulation of endodermal cell differentiation(GO:1903225) |
| 1.5 | 23.1 | GO:1900747 | negative regulation of vascular endothelial growth factor signaling pathway(GO:1900747) |
| 1.4 | 5.5 | GO:0009956 | radial pattern formation(GO:0009956) |
| 1.3 | 7.8 | GO:1900748 | positive regulation of vascular endothelial growth factor signaling pathway(GO:1900748) |
| 1.3 | 6.4 | GO:2000297 | negative regulation of synapse maturation(GO:2000297) |
| 1.2 | 4.9 | GO:0086097 | phospholipase C-activating angiotensin-activated signaling pathway(GO:0086097) |
| 1.2 | 4.8 | GO:2000298 | regulation of Rho-dependent protein serine/threonine kinase activity(GO:2000298) |
| 1.0 | 3.9 | GO:0042663 | regulation of pronephros size(GO:0035565) pronephric nephron tubule development(GO:0039020) regulation of endodermal cell fate specification(GO:0042663) |
| 0.9 | 3.6 | GO:1901842 | negative regulation of high voltage-gated calcium channel activity(GO:1901842) |
| 0.8 | 3.2 | GO:0060720 | spongiotrophoblast cell proliferation(GO:0060720) regulation of spongiotrophoblast cell proliferation(GO:0060721) cell proliferation involved in embryonic placenta development(GO:0060722) regulation of cell proliferation involved in embryonic placenta development(GO:0060723) |
| 0.8 | 2.4 | GO:0007412 | axon target recognition(GO:0007412) |
| 0.8 | 2.3 | GO:0061033 | secretion by lung epithelial cell involved in lung growth(GO:0061033) |
| 0.8 | 1.5 | GO:0014734 | skeletal muscle hypertrophy(GO:0014734) |
| 0.8 | 10.7 | GO:0048251 | elastic fiber assembly(GO:0048251) |
| 0.7 | 2.2 | GO:0021934 | hindbrain tangential cell migration(GO:0021934) |
| 0.7 | 2.0 | GO:0002018 | renin-angiotensin regulation of aldosterone production(GO:0002018) |
| 0.7 | 3.3 | GO:0048749 | compound eye development(GO:0048749) |
| 0.7 | 1.3 | GO:0042704 | uterine wall breakdown(GO:0042704) |
| 0.6 | 3.2 | GO:0042631 | cellular response to water deprivation(GO:0042631) |
| 0.6 | 5.0 | GO:0003065 | positive regulation of heart rate by epinephrine(GO:0003065) |
| 0.6 | 2.4 | GO:2000097 | regulation of smooth muscle cell-matrix adhesion(GO:2000097) |
| 0.6 | 4.1 | GO:2000490 | negative regulation of hepatic stellate cell activation(GO:2000490) |
| 0.6 | 2.2 | GO:0003221 | right ventricular cardiac muscle tissue morphogenesis(GO:0003221) |
| 0.6 | 3.9 | GO:0014846 | esophagus smooth muscle contraction(GO:0014846) |
| 0.5 | 2.7 | GO:0003409 | optic cup structural organization(GO:0003409) |
| 0.5 | 1.6 | GO:0044278 | cell wall disruption in other organism(GO:0044278) |
| 0.5 | 5.5 | GO:0060449 | bud elongation involved in lung branching(GO:0060449) |
| 0.5 | 7.1 | GO:0003278 | apoptotic process involved in heart morphogenesis(GO:0003278) |
| 0.5 | 3.6 | GO:0060671 | epithelial cell differentiation involved in embryonic placenta development(GO:0060671) epithelial cell morphogenesis involved in placental branching(GO:0060672) |
| 0.5 | 6.4 | GO:0052697 | flavonoid glucuronidation(GO:0052696) xenobiotic glucuronidation(GO:0052697) |
| 0.5 | 5.9 | GO:0007168 | receptor guanylyl cyclase signaling pathway(GO:0007168) |
| 0.5 | 2.4 | GO:2000229 | pancreatic stellate cell proliferation(GO:0072343) regulation of pancreatic stellate cell proliferation(GO:2000229) |
| 0.5 | 2.8 | GO:0097498 | endothelial tube lumen extension(GO:0097498) |
| 0.5 | 1.9 | GO:0071393 | cellular response to progesterone stimulus(GO:0071393) |
| 0.5 | 1.4 | GO:0060981 | cell migration involved in coronary angiogenesis(GO:0060981) |
| 0.4 | 4.5 | GO:0043569 | negative regulation of insulin-like growth factor receptor signaling pathway(GO:0043569) |
| 0.4 | 3.5 | GO:0038165 | oncostatin-M-mediated signaling pathway(GO:0038165) |
| 0.4 | 1.3 | GO:0035910 | ascending aorta development(GO:0035905) ascending aorta morphogenesis(GO:0035910) auditory receptor cell fate determination(GO:0042668) cell-cell signaling involved in cell fate commitment(GO:0045168) negative regulation of auditory receptor cell differentiation(GO:0045608) negative regulation of pro-B cell differentiation(GO:2000974) |
| 0.4 | 4.7 | GO:0001886 | endothelial cell morphogenesis(GO:0001886) |
| 0.4 | 5.1 | GO:0061299 | retina vasculature morphogenesis in camera-type eye(GO:0061299) |
| 0.4 | 5.1 | GO:0003406 | retinal pigment epithelium development(GO:0003406) |
| 0.4 | 1.2 | GO:0060279 | positive regulation of ovulation(GO:0060279) |
| 0.4 | 1.2 | GO:0034164 | negative regulation of toll-like receptor 9 signaling pathway(GO:0034164) |
| 0.4 | 3.6 | GO:0048539 | bone marrow development(GO:0048539) |
| 0.4 | 2.4 | GO:0002803 | positive regulation of antimicrobial peptide production(GO:0002225) positive regulation of antimicrobial humoral response(GO:0002760) positive regulation of antibacterial peptide production(GO:0002803) |
| 0.4 | 1.6 | GO:0014859 | negative regulation of skeletal muscle cell proliferation(GO:0014859) negative regulation of skeletal muscle satellite cell proliferation(GO:1902723) |
| 0.4 | 1.6 | GO:0036229 | glutamine secretion(GO:0010585) L-glutamine import(GO:0036229) L-glutamine import into cell(GO:1903803) |
| 0.4 | 1.2 | GO:0060086 | circadian temperature homeostasis(GO:0060086) |
| 0.4 | 3.8 | GO:0010724 | regulation of definitive erythrocyte differentiation(GO:0010724) |
| 0.4 | 5.8 | GO:0021563 | glossopharyngeal nerve development(GO:0021563) |
| 0.4 | 2.5 | GO:0061146 | Peyer's patch morphogenesis(GO:0061146) |
| 0.4 | 1.4 | GO:1904425 | negative regulation of GTP binding(GO:1904425) |
| 0.4 | 0.7 | GO:2001027 | negative regulation of endothelial cell chemotaxis(GO:2001027) |
| 0.3 | 11.5 | GO:0030214 | hyaluronan catabolic process(GO:0030214) |
| 0.3 | 4.2 | GO:1901552 | positive regulation of endothelial cell development(GO:1901552) positive regulation of establishment of endothelial barrier(GO:1903142) |
| 0.3 | 1.7 | GO:0044856 | plasma membrane raft distribution(GO:0044855) plasma membrane raft localization(GO:0044856) plasma membrane raft polarization(GO:0044858) regulation of plasma membrane raft polarization(GO:1903906) |
| 0.3 | 2.0 | GO:0060800 | regulation of cell differentiation involved in embryonic placenta development(GO:0060800) |
| 0.3 | 1.6 | GO:0072276 | metanephric glomerulus morphogenesis(GO:0072275) metanephric glomerulus vasculature morphogenesis(GO:0072276) metanephric glomerular capillary formation(GO:0072277) |
| 0.3 | 2.6 | GO:0035932 | mineralocorticoid secretion(GO:0035931) aldosterone secretion(GO:0035932) regulation of mineralocorticoid secretion(GO:2000855) regulation of aldosterone secretion(GO:2000858) |
| 0.3 | 2.9 | GO:0048664 | neuron fate determination(GO:0048664) |
| 0.3 | 2.9 | GO:0060523 | prostate epithelial cord elongation(GO:0060523) |
| 0.3 | 4.4 | GO:2000324 | positive regulation of glucocorticoid receptor signaling pathway(GO:2000324) |
| 0.3 | 1.6 | GO:0032474 | otolith morphogenesis(GO:0032474) |
| 0.3 | 2.4 | GO:0086048 | membrane depolarization during bundle of His cell action potential(GO:0086048) |
| 0.3 | 1.8 | GO:0021562 | vestibulocochlear nerve development(GO:0021562) vestibular reflex(GO:0060005) |
| 0.3 | 2.0 | GO:0003433 | chondrocyte development involved in endochondral bone morphogenesis(GO:0003433) |
| 0.3 | 1.1 | GO:1902161 | positive regulation of cyclic nucleotide-gated ion channel activity(GO:1902161) |
| 0.3 | 2.3 | GO:0032439 | endosome localization(GO:0032439) |
| 0.3 | 4.6 | GO:0048672 | positive regulation of collateral sprouting(GO:0048672) |
| 0.3 | 1.4 | GO:0001970 | positive regulation of activation of membrane attack complex(GO:0001970) |
| 0.3 | 5.2 | GO:1900119 | positive regulation of execution phase of apoptosis(GO:1900119) |
| 0.3 | 0.3 | GO:0014889 | skeletal muscle atrophy(GO:0014732) muscle atrophy(GO:0014889) striated muscle atrophy(GO:0014891) |
| 0.3 | 13.1 | GO:0016339 | calcium-dependent cell-cell adhesion via plasma membrane cell adhesion molecules(GO:0016339) |
| 0.3 | 0.5 | GO:0060664 | epithelial cell proliferation involved in salivary gland morphogenesis(GO:0060664) |
| 0.3 | 1.1 | GO:0009386 | translational attenuation(GO:0009386) |
| 0.3 | 2.1 | GO:0030579 | ubiquitin-dependent SMAD protein catabolic process(GO:0030579) |
| 0.3 | 0.8 | GO:0021797 | forebrain anterior/posterior pattern specification(GO:0021797) |
| 0.3 | 1.3 | GO:0046086 | adenosine biosynthetic process(GO:0046086) |
| 0.2 | 1.0 | GO:0031117 | positive regulation of microtubule depolymerization(GO:0031117) |
| 0.2 | 1.2 | GO:0051549 | positive regulation of keratinocyte migration(GO:0051549) |
| 0.2 | 2.2 | GO:1990504 | dense core granule exocytosis(GO:1990504) |
| 0.2 | 1.0 | GO:0070434 | positive regulation of nucleotide-binding oligomerization domain containing signaling pathway(GO:0070426) positive regulation of nucleotide-binding oligomerization domain containing 2 signaling pathway(GO:0070434) |
| 0.2 | 0.5 | GO:0051771 | negative regulation of nitric-oxide synthase biosynthetic process(GO:0051771) |
| 0.2 | 0.7 | GO:0070093 | negative regulation of glucagon secretion(GO:0070093) |
| 0.2 | 0.9 | GO:0061073 | ciliary body morphogenesis(GO:0061073) |
| 0.2 | 0.7 | GO:0048861 | leukemia inhibitory factor signaling pathway(GO:0048861) |
| 0.2 | 0.7 | GO:0021569 | rhombomere 3 development(GO:0021569) |
| 0.2 | 2.3 | GO:0001957 | intramembranous ossification(GO:0001957) direct ossification(GO:0036072) |
| 0.2 | 2.0 | GO:0070995 | NADPH oxidation(GO:0070995) |
| 0.2 | 1.6 | GO:0071638 | negative regulation of monocyte chemotactic protein-1 production(GO:0071638) |
| 0.2 | 2.0 | GO:0098532 | histone H3-K27 trimethylation(GO:0098532) |
| 0.2 | 0.9 | GO:0043006 | activation of phospholipase A2 activity by calcium-mediated signaling(GO:0043006) |
| 0.2 | 1.9 | GO:0038089 | positive regulation of cell migration by vascular endothelial growth factor signaling pathway(GO:0038089) |
| 0.2 | 4.2 | GO:0046069 | cGMP catabolic process(GO:0046069) |
| 0.2 | 2.7 | GO:0061042 | vascular wound healing(GO:0061042) |
| 0.2 | 1.0 | GO:0034334 | adherens junction maintenance(GO:0034334) |
| 0.2 | 1.2 | GO:0071711 | basement membrane organization(GO:0071711) |
| 0.2 | 2.7 | GO:0018231 | peptidyl-L-cysteine S-palmitoylation(GO:0018230) peptidyl-S-diacylglycerol-L-cysteine biosynthetic process from peptidyl-cysteine(GO:0018231) |
| 0.2 | 3.1 | GO:1904706 | negative regulation of vascular smooth muscle cell proliferation(GO:1904706) |
| 0.2 | 5.0 | GO:0038065 | collagen-activated signaling pathway(GO:0038065) |
| 0.2 | 1.0 | GO:0051562 | negative regulation of mitochondrial calcium ion concentration(GO:0051562) |
| 0.2 | 0.8 | GO:0002879 | positive regulation of acute inflammatory response to non-antigenic stimulus(GO:0002879) |
| 0.2 | 0.8 | GO:0070173 | regulation of enamel mineralization(GO:0070173) |
| 0.2 | 0.6 | GO:0010644 | cell communication by electrical coupling(GO:0010644) |
| 0.2 | 18.3 | GO:0030574 | collagen catabolic process(GO:0030574) |
| 0.2 | 2.6 | GO:1904352 | positive regulation of protein catabolic process in the vacuole(GO:1904352) |
| 0.2 | 0.7 | GO:0014806 | smooth muscle hyperplasia(GO:0014806) |
| 0.2 | 1.6 | GO:0035331 | negative regulation of hippo signaling(GO:0035331) |
| 0.2 | 0.7 | GO:0045744 | negative regulation of G-protein coupled receptor protein signaling pathway(GO:0045744) |
| 0.2 | 0.9 | GO:1900039 | positive regulation of cellular response to hypoxia(GO:1900039) |
| 0.2 | 2.4 | GO:0060670 | branching involved in labyrinthine layer morphogenesis(GO:0060670) |
| 0.2 | 2.0 | GO:0052695 | cellular glucuronidation(GO:0052695) |
| 0.2 | 3.1 | GO:0042340 | keratan sulfate catabolic process(GO:0042340) |
| 0.2 | 1.1 | GO:2000394 | positive regulation of lamellipodium morphogenesis(GO:2000394) |
| 0.2 | 2.7 | GO:0006600 | creatine metabolic process(GO:0006600) |
| 0.2 | 1.2 | GO:0046604 | positive regulation of mitotic centrosome separation(GO:0046604) |
| 0.2 | 0.8 | GO:0021553 | olfactory nerve development(GO:0021553) |
| 0.2 | 1.4 | GO:2000253 | positive regulation of feeding behavior(GO:2000253) |
| 0.2 | 2.9 | GO:0008595 | tripartite regional subdivision(GO:0007351) anterior/posterior axis specification, embryo(GO:0008595) |
| 0.1 | 0.7 | GO:0035993 | deltoid tuberosity development(GO:0035993) |
| 0.1 | 1.7 | GO:0061469 | response to corticotropin-releasing hormone(GO:0043435) regulation of type B pancreatic cell proliferation(GO:0061469) cellular response to corticotropin-releasing hormone stimulus(GO:0071376) |
| 0.1 | 2.2 | GO:2001212 | regulation of vasculogenesis(GO:2001212) |
| 0.1 | 0.4 | GO:0070904 | L-ascorbic acid transport(GO:0015882) transepithelial L-ascorbic acid transport(GO:0070904) |
| 0.1 | 1.1 | GO:0007197 | adenylate cyclase-inhibiting G-protein coupled acetylcholine receptor signaling pathway(GO:0007197) |
| 0.1 | 2.1 | GO:0006527 | arginine catabolic process(GO:0006527) |
| 0.1 | 0.4 | GO:0045210 | FasL biosynthetic process(GO:0045210) |
| 0.1 | 0.8 | GO:0097398 | response to interleukin-17(GO:0097396) cellular response to interleukin-17(GO:0097398) |
| 0.1 | 1.6 | GO:0009249 | protein lipoylation(GO:0009249) |
| 0.1 | 1.9 | GO:0010739 | positive regulation of protein kinase A signaling(GO:0010739) |
| 0.1 | 0.5 | GO:0006556 | S-adenosylmethionine biosynthetic process(GO:0006556) |
| 0.1 | 0.6 | GO:0090362 | positive regulation of platelet-derived growth factor production(GO:0090362) |
| 0.1 | 0.5 | GO:2000863 | positive regulation of estrogen secretion(GO:2000863) positive regulation of estradiol secretion(GO:2000866) |
| 0.1 | 1.0 | GO:1903976 | negative regulation of glial cell migration(GO:1903976) |
| 0.1 | 0.6 | GO:0001834 | trophectodermal cell proliferation(GO:0001834) regulation of trophectodermal cell proliferation(GO:1904073) positive regulation of trophectodermal cell proliferation(GO:1904075) |
| 0.1 | 1.8 | GO:0035542 | regulation of SNARE complex assembly(GO:0035542) |
| 0.1 | 0.7 | GO:0035407 | histone H3-T11 phosphorylation(GO:0035407) |
| 0.1 | 0.5 | GO:0035502 | metanephric part of ureteric bud development(GO:0035502) |
| 0.1 | 1.9 | GO:0035372 | protein localization to microtubule(GO:0035372) |
| 0.1 | 2.8 | GO:0090190 | positive regulation of branching involved in ureteric bud morphogenesis(GO:0090190) |
| 0.1 | 0.9 | GO:0098912 | membrane depolarization during atrial cardiac muscle cell action potential(GO:0098912) |
| 0.1 | 0.3 | GO:0072428 | signal transduction involved in intra-S DNA damage checkpoint(GO:0072428) response to bisphenol A(GO:1903925) cellular response to bisphenol A(GO:1903926) |
| 0.1 | 0.4 | GO:0032430 | positive regulation of phospholipase A2 activity(GO:0032430) |
| 0.1 | 0.5 | GO:0070171 | negative regulation of tooth mineralization(GO:0070171) |
| 0.1 | 1.7 | GO:0021520 | spinal cord motor neuron cell fate specification(GO:0021520) |
| 0.1 | 0.8 | GO:0060414 | aorta smooth muscle tissue morphogenesis(GO:0060414) |
| 0.1 | 0.8 | GO:1990009 | retinal cell apoptotic process(GO:1990009) |
| 0.1 | 1.3 | GO:0055059 | asymmetric neuroblast division(GO:0055059) |
| 0.1 | 0.1 | GO:1900227 | positive regulation of NLRP3 inflammasome complex assembly(GO:1900227) |
| 0.1 | 0.3 | GO:0060796 | regulation of transcription involved in primary germ layer cell fate commitment(GO:0060796) |
| 0.1 | 0.7 | GO:2001288 | positive regulation of caveolin-mediated endocytosis(GO:2001288) |
| 0.1 | 0.8 | GO:0031666 | positive regulation of lipopolysaccharide-mediated signaling pathway(GO:0031666) |
| 0.1 | 2.7 | GO:0005513 | detection of calcium ion(GO:0005513) |
| 0.1 | 0.9 | GO:0003344 | pericardium morphogenesis(GO:0003344) |
| 0.1 | 0.7 | GO:0070120 | ciliary neurotrophic factor-mediated signaling pathway(GO:0070120) |
| 0.1 | 0.5 | GO:0015862 | uridine transport(GO:0015862) |
| 0.1 | 0.8 | GO:0014807 | regulation of somitogenesis(GO:0014807) |
| 0.1 | 2.6 | GO:0007597 | blood coagulation, intrinsic pathway(GO:0007597) |
| 0.1 | 3.1 | GO:0033622 | integrin activation(GO:0033622) |
| 0.1 | 9.7 | GO:0008542 | visual learning(GO:0008542) |
| 0.1 | 1.1 | GO:1904322 | response to forskolin(GO:1904321) cellular response to forskolin(GO:1904322) |
| 0.1 | 0.5 | GO:0038018 | Wnt receptor catabolic process(GO:0038018) |
| 0.1 | 3.8 | GO:0003298 | physiological muscle hypertrophy(GO:0003298) physiological cardiac muscle hypertrophy(GO:0003301) cell growth involved in cardiac muscle cell development(GO:0061049) |
| 0.1 | 0.8 | GO:0021869 | forebrain ventricular zone progenitor cell division(GO:0021869) |
| 0.1 | 2.0 | GO:0003334 | keratinocyte development(GO:0003334) |
| 0.1 | 4.4 | GO:0071480 | cellular response to gamma radiation(GO:0071480) |
| 0.1 | 16.7 | GO:0007156 | homophilic cell adhesion via plasma membrane adhesion molecules(GO:0007156) |
| 0.1 | 0.3 | GO:0001545 | primary ovarian follicle growth(GO:0001545) |
| 0.1 | 2.2 | GO:0045109 | intermediate filament organization(GO:0045109) |
| 0.1 | 0.8 | GO:0045078 | positive regulation of interferon-gamma biosynthetic process(GO:0045078) |
| 0.1 | 1.5 | GO:1900017 | positive regulation of cytokine production involved in inflammatory response(GO:1900017) |
| 0.1 | 1.2 | GO:2001224 | positive regulation of neuron migration(GO:2001224) |
| 0.1 | 0.5 | GO:0050885 | neuromuscular process controlling balance(GO:0050885) |
| 0.1 | 0.5 | GO:1905098 | negative regulation of guanyl-nucleotide exchange factor activity(GO:1905098) |
| 0.1 | 1.3 | GO:0099601 | regulation of neurotransmitter receptor activity(GO:0099601) |
| 0.1 | 1.0 | GO:1901374 | acetate ester transport(GO:1901374) |
| 0.1 | 0.6 | GO:0002159 | desmosome assembly(GO:0002159) |
| 0.1 | 1.1 | GO:0090179 | planar cell polarity pathway involved in neural tube closure(GO:0090179) |
| 0.1 | 0.7 | GO:0035881 | amacrine cell differentiation(GO:0035881) |
| 0.1 | 0.9 | GO:0045601 | regulation of endothelial cell differentiation(GO:0045601) |
| 0.1 | 0.8 | GO:0048387 | negative regulation of retinoic acid receptor signaling pathway(GO:0048387) |
| 0.1 | 0.2 | GO:0051941 | regulation of amino acid import(GO:0010958) regulation of amino acid uptake involved in synaptic transmission(GO:0051941) regulation of glutamate uptake involved in transmission of nerve impulse(GO:0051946) regulation of L-glutamate import(GO:1900920) |
| 0.1 | 1.1 | GO:0060287 | epithelial cilium movement involved in determination of left/right asymmetry(GO:0060287) |
| 0.1 | 1.6 | GO:0006957 | complement activation, alternative pathway(GO:0006957) |
| 0.1 | 1.1 | GO:0038084 | vascular endothelial growth factor signaling pathway(GO:0038084) |
| 0.1 | 0.3 | GO:0046716 | muscle cell cellular homeostasis(GO:0046716) |
| 0.1 | 1.1 | GO:0090050 | positive regulation of cell migration involved in sprouting angiogenesis(GO:0090050) |
| 0.1 | 0.3 | GO:2001054 | negative regulation of mesenchymal cell apoptotic process(GO:2001054) |
| 0.1 | 13.9 | GO:0010811 | positive regulation of cell-substrate adhesion(GO:0010811) |
| 0.1 | 0.2 | GO:0006566 | threonine metabolic process(GO:0006566) |
| 0.1 | 0.5 | GO:0006561 | proline biosynthetic process(GO:0006561) |
| 0.1 | 1.6 | GO:0010172 | embryonic body morphogenesis(GO:0010172) |
| 0.1 | 2.2 | GO:0017144 | drug metabolic process(GO:0017144) |
| 0.1 | 0.4 | GO:1904694 | negative regulation of vascular smooth muscle contraction(GO:1904694) |
| 0.1 | 0.4 | GO:1902731 | negative regulation of chondrocyte proliferation(GO:1902731) |
| 0.1 | 1.2 | GO:0070863 | positive regulation of protein exit from endoplasmic reticulum(GO:0070863) |
| 0.1 | 7.6 | GO:0048704 | embryonic skeletal system morphogenesis(GO:0048704) |
| 0.1 | 1.0 | GO:0070886 | positive regulation of calcineurin-NFAT signaling cascade(GO:0070886) |
| 0.1 | 1.1 | GO:0046520 | sphingoid biosynthetic process(GO:0046520) |
| 0.1 | 0.3 | GO:1903860 | negative regulation of dendrite extension(GO:1903860) |
| 0.1 | 2.9 | GO:0010862 | positive regulation of pathway-restricted SMAD protein phosphorylation(GO:0010862) |
| 0.1 | 0.1 | GO:0090214 | spongiotrophoblast layer developmental growth(GO:0090214) |
| 0.1 | 0.3 | GO:1903377 | negative regulation of oxidative stress-induced neuron intrinsic apoptotic signaling pathway(GO:1903377) |
| 0.1 | 0.3 | GO:0007621 | courtship behavior(GO:0007619) negative regulation of female receptivity(GO:0007621) female courtship behavior(GO:0008050) |
| 0.0 | 0.7 | GO:0038007 | netrin-activated signaling pathway(GO:0038007) |
| 0.0 | 0.3 | GO:2000329 | negative regulation of T-helper 17 cell lineage commitment(GO:2000329) |
| 0.0 | 0.6 | GO:0006975 | DNA damage induced protein phosphorylation(GO:0006975) |
| 0.0 | 0.5 | GO:0046485 | ether lipid metabolic process(GO:0046485) |
| 0.0 | 0.9 | GO:0098915 | membrane repolarization during ventricular cardiac muscle cell action potential(GO:0098915) |
| 0.0 | 0.2 | GO:0090080 | positive regulation of MAPKKK cascade by fibroblast growth factor receptor signaling pathway(GO:0090080) |
| 0.0 | 3.3 | GO:0031529 | ruffle organization(GO:0031529) |
| 0.0 | 1.2 | GO:0055001 | muscle cell development(GO:0055001) |
| 0.0 | 0.4 | GO:0060689 | cell differentiation involved in salivary gland development(GO:0060689) |
| 0.0 | 2.2 | GO:0035329 | hippo signaling(GO:0035329) |
| 0.0 | 0.1 | GO:0031446 | regulation of fast-twitch skeletal muscle fiber contraction(GO:0031446) positive regulation of fast-twitch skeletal muscle fiber contraction(GO:0031448) |
| 0.0 | 0.6 | GO:2000580 | positive regulation of microtubule motor activity(GO:2000576) regulation of ATP-dependent microtubule motor activity, plus-end-directed(GO:2000580) positive regulation of ATP-dependent microtubule motor activity, plus-end-directed(GO:2000582) |
| 0.0 | 3.9 | GO:0033275 | muscle filament sliding(GO:0030049) actin-myosin filament sliding(GO:0033275) |
| 0.0 | 1.2 | GO:0007635 | chemosensory behavior(GO:0007635) |
| 0.0 | 0.7 | GO:0031398 | positive regulation of protein ubiquitination(GO:0031398) |
| 0.0 | 0.6 | GO:0045793 | positive regulation of cell size(GO:0045793) |
| 0.0 | 5.5 | GO:0030449 | regulation of complement activation(GO:0030449) regulation of protein activation cascade(GO:2000257) |
| 0.0 | 0.1 | GO:0048859 | sensory organ boundary specification(GO:0008052) formation of organ boundary(GO:0010160) formation of anatomical boundary(GO:0048859) taste bud development(GO:0061193) |
| 0.0 | 0.2 | GO:0045586 | regulation of gamma-delta T cell differentiation(GO:0045586) |
| 0.0 | 0.2 | GO:0052565 | response to defense-related nitric oxide production by other organism involved in symbiotic interaction(GO:0052551) response to defense-related host nitric oxide production(GO:0052565) |
| 0.0 | 0.1 | GO:1903966 | monounsaturated fatty acid metabolic process(GO:1903964) monounsaturated fatty acid biosynthetic process(GO:1903966) |
| 0.0 | 0.9 | GO:0033539 | fatty acid beta-oxidation using acyl-CoA dehydrogenase(GO:0033539) |
| 0.0 | 0.2 | GO:2001295 | malonyl-CoA biosynthetic process(GO:2001295) |
| 0.0 | 0.9 | GO:0035162 | embryonic hemopoiesis(GO:0035162) |
| 0.0 | 0.5 | GO:0072189 | ureter development(GO:0072189) |
| 0.0 | 0.3 | GO:0007217 | tachykinin receptor signaling pathway(GO:0007217) |
| 0.0 | 0.3 | GO:0030263 | apoptotic chromosome condensation(GO:0030263) |
| 0.0 | 0.2 | GO:0044210 | 'de novo' CTP biosynthetic process(GO:0044210) |
| 0.0 | 0.9 | GO:0043562 | cellular response to nitrogen starvation(GO:0006995) cellular response to nitrogen levels(GO:0043562) |
| 0.0 | 0.3 | GO:0007195 | adenylate cyclase-inhibiting dopamine receptor signaling pathway(GO:0007195) peptidyl-arginine methylation, to symmetrical-dimethyl arginine(GO:0019918) |
| 0.0 | 1.1 | GO:0010800 | positive regulation of peptidyl-threonine phosphorylation(GO:0010800) |
| 0.0 | 0.9 | GO:0006828 | manganese ion transport(GO:0006828) |
| 0.0 | 0.4 | GO:0051639 | actin filament network formation(GO:0051639) |
| 0.0 | 3.3 | GO:0045995 | regulation of embryonic development(GO:0045995) |
| 0.0 | 0.7 | GO:0071360 | cellular response to exogenous dsRNA(GO:0071360) |
| 0.0 | 0.2 | GO:0006002 | fructose 6-phosphate metabolic process(GO:0006002) |
| 0.0 | 0.1 | GO:0003050 | regulation of systemic arterial blood pressure by atrial natriuretic peptide(GO:0003050) |
| 0.0 | 2.1 | GO:0050673 | epithelial cell proliferation(GO:0050673) |
| 0.0 | 1.7 | GO:0015721 | bile acid and bile salt transport(GO:0015721) |
| 0.0 | 1.7 | GO:0050819 | negative regulation of coagulation(GO:0050819) |
| 0.0 | 0.2 | GO:0003190 | atrioventricular valve formation(GO:0003190) |
| 0.0 | 1.2 | GO:0030212 | hyaluronan metabolic process(GO:0030212) |
| 0.0 | 1.6 | GO:0030866 | cortical actin cytoskeleton organization(GO:0030866) |
| 0.0 | 0.2 | GO:0006574 | valine catabolic process(GO:0006574) |
| 0.0 | 0.4 | GO:2000651 | positive regulation of sodium ion transmembrane transporter activity(GO:2000651) |
| 0.0 | 0.2 | GO:0033489 | cholesterol biosynthetic process via desmosterol(GO:0033489) cholesterol biosynthetic process via lathosterol(GO:0033490) |
| 0.0 | 0.2 | GO:2000018 | regulation of male gonad development(GO:2000018) positive regulation of male gonad development(GO:2000020) |
| 0.0 | 0.2 | GO:0008218 | bioluminescence(GO:0008218) |
| 0.0 | 0.1 | GO:0030222 | eosinophil differentiation(GO:0030222) regulation of eosinophil differentiation(GO:0045643) positive regulation of eosinophil differentiation(GO:0045645) |
| 0.0 | 0.3 | GO:0070307 | lens fiber cell development(GO:0070307) |
| 0.0 | 0.4 | GO:1904354 | negative regulation of telomere capping(GO:1904354) |
| 0.0 | 2.7 | GO:0048678 | response to axon injury(GO:0048678) |
| 0.0 | 2.3 | GO:0043392 | negative regulation of DNA binding(GO:0043392) |
| 0.0 | 0.1 | GO:0032185 | septin cytoskeleton organization(GO:0032185) |
| 0.0 | 0.1 | GO:0060754 | positive regulation of mast cell chemotaxis(GO:0060754) |
| 0.0 | 0.9 | GO:0015695 | organic cation transport(GO:0015695) |
| 0.0 | 0.4 | GO:0060539 | diaphragm development(GO:0060539) |
| 0.0 | 0.1 | GO:0032223 | negative regulation of synaptic transmission, cholinergic(GO:0032223) neurotransmitter receptor biosynthetic process(GO:0045212) |
| 0.0 | 0.5 | GO:0043508 | negative regulation of JUN kinase activity(GO:0043508) |
| 0.0 | 0.9 | GO:0010669 | epithelial structure maintenance(GO:0010669) |
| 0.0 | 0.1 | GO:0007185 | transmembrane receptor protein tyrosine phosphatase signaling pathway(GO:0007185) |
| 0.0 | 0.1 | GO:0007089 | traversing start control point of mitotic cell cycle(GO:0007089) |
| 0.0 | 0.2 | GO:1900383 | regulation of synaptic plasticity by receptor localization to synapse(GO:1900383) |
| 0.0 | 1.2 | GO:0050891 | multicellular organismal water homeostasis(GO:0050891) |
| 0.0 | 1.0 | GO:0071377 | cellular response to glucagon stimulus(GO:0071377) |
| 0.0 | 0.0 | GO:0099640 | axo-dendritic protein transport(GO:0099640) |
| 0.0 | 1.1 | GO:0010107 | potassium ion import(GO:0010107) |
| 0.0 | 0.1 | GO:0014043 | negative regulation of neuron maturation(GO:0014043) |
| 0.0 | 0.5 | GO:2000480 | negative regulation of cAMP-dependent protein kinase activity(GO:2000480) |
| 0.0 | 0.9 | GO:1901685 | glutathione derivative metabolic process(GO:1901685) glutathione derivative biosynthetic process(GO:1901687) |
| 0.0 | 0.5 | GO:0044458 | motile cilium assembly(GO:0044458) |
| 0.0 | 0.2 | GO:0060291 | long-term synaptic potentiation(GO:0060291) |
| 0.0 | 1.4 | GO:0071260 | cellular response to mechanical stimulus(GO:0071260) |
| 0.0 | 0.4 | GO:1901748 | leukotriene D4 metabolic process(GO:1901748) leukotriene D4 biosynthetic process(GO:1901750) |
| 0.0 | 0.7 | GO:0008038 | neuron recognition(GO:0008038) |
| 0.0 | 0.3 | GO:0016486 | peptide hormone processing(GO:0016486) |
| 0.0 | 0.1 | GO:0072675 | osteoclast fusion(GO:0072675) |
| 0.0 | 0.5 | GO:0051496 | positive regulation of stress fiber assembly(GO:0051496) |
| 0.0 | 0.3 | GO:0010738 | regulation of protein kinase A signaling(GO:0010738) |
| 0.0 | 2.8 | GO:0030308 | negative regulation of cell growth(GO:0030308) |
| 0.0 | 0.1 | GO:0038161 | prolactin signaling pathway(GO:0038161) |
| 0.0 | 0.5 | GO:0043968 | histone H2A acetylation(GO:0043968) |
| 0.0 | 0.6 | GO:0006999 | nuclear pore organization(GO:0006999) |
| 0.0 | 0.5 | GO:0051145 | smooth muscle cell differentiation(GO:0051145) |
| 0.0 | 0.2 | GO:0036066 | protein O-linked fucosylation(GO:0036066) |
| 0.0 | 0.8 | GO:1903955 | positive regulation of protein targeting to mitochondrion(GO:1903955) |
| 0.0 | 0.2 | GO:0032148 | activation of protein kinase B activity(GO:0032148) |
| 0.0 | 0.1 | GO:1902410 | mitotic cytokinetic process(GO:1902410) |
| 0.0 | 1.5 | GO:0000271 | polysaccharide biosynthetic process(GO:0000271) |
| 0.0 | 0.3 | GO:0045663 | positive regulation of myoblast differentiation(GO:0045663) |
| 0.0 | 0.3 | GO:0048706 | embryonic skeletal system development(GO:0048706) |
| 0.0 | 0.1 | GO:0046784 | viral mRNA export from host cell nucleus(GO:0046784) |
| 0.0 | 2.0 | GO:0035335 | peptidyl-tyrosine dephosphorylation(GO:0035335) |
| 0.0 | 0.8 | GO:0007368 | determination of left/right symmetry(GO:0007368) |
| 0.0 | 0.3 | GO:0006309 | apoptotic DNA fragmentation(GO:0006309) |
| 0.0 | 0.4 | GO:0010569 | regulation of double-strand break repair via homologous recombination(GO:0010569) |
| 0.0 | 0.2 | GO:0043586 | tongue development(GO:0043586) |
| 0.0 | 0.1 | GO:0070778 | L-aspartate transport(GO:0070778) L-aspartate transmembrane transport(GO:0089712) |
| 0.0 | 0.3 | GO:0005980 | glycogen catabolic process(GO:0005980) |
| 0.0 | 0.1 | GO:0048569 | post-embryonic organ development(GO:0048569) |
| 0.0 | 0.1 | GO:0045899 | positive regulation of RNA polymerase II transcriptional preinitiation complex assembly(GO:0045899) |
| 0.0 | 0.1 | GO:0010839 | negative regulation of keratinocyte proliferation(GO:0010839) |
| 0.0 | 1.4 | GO:0046546 | male gonad development(GO:0008584) development of primary male sexual characteristics(GO:0046546) |
| 0.0 | 0.2 | GO:0044341 | sodium-dependent phosphate transport(GO:0044341) |
Gene overrepresentation in cellular_component category:
| Log-likelihood per target | Total log-likelihood | Term | Description |
|---|---|---|---|
| 2.4 | 2.4 | GO:0034681 | integrin alpha11-beta1 complex(GO:0034681) |
| 2.1 | 31.3 | GO:0005589 | collagen type VI trimer(GO:0005589) collagen beaded filament(GO:0098647) |
| 1.8 | 5.5 | GO:0005588 | collagen type V trimer(GO:0005588) |
| 1.5 | 5.9 | GO:0045160 | myosin I complex(GO:0045160) |
| 1.2 | 3.5 | GO:0005900 | oncostatin-M receptor complex(GO:0005900) |
| 1.1 | 5.5 | GO:0071149 | TEAD-2-YAP complex(GO:0071149) |
| 1.0 | 10.7 | GO:0071953 | elastic fiber(GO:0071953) |
| 0.6 | 10.9 | GO:0071438 | invadopodium membrane(GO:0071438) |
| 0.6 | 1.8 | GO:0005595 | collagen type XII trimer(GO:0005595) |
| 0.6 | 18.1 | GO:0005614 | interstitial matrix(GO:0005614) |
| 0.5 | 2.1 | GO:0030936 | collagen type XIII trimer(GO:0005600) transmembrane collagen trimer(GO:0030936) |
| 0.5 | 10.4 | GO:0005862 | muscle thin filament tropomyosin(GO:0005862) |
| 0.4 | 1.3 | GO:1990032 | parallel fiber(GO:1990032) |
| 0.4 | 1.2 | GO:0043512 | inhibin complex(GO:0043511) inhibin A complex(GO:0043512) |
| 0.4 | 3.1 | GO:0008282 | ATP-sensitive potassium channel complex(GO:0008282) |
| 0.3 | 3.1 | GO:0005593 | FACIT collagen trimer(GO:0005593) |
| 0.3 | 3.2 | GO:0098642 | network-forming collagen trimer(GO:0098642) collagen network(GO:0098645) |
| 0.3 | 0.9 | GO:0097489 | multivesicular body, internal vesicle lumen(GO:0097489) |
| 0.3 | 2.0 | GO:0036021 | endolysosome lumen(GO:0036021) |
| 0.3 | 4.3 | GO:0030478 | actin cap(GO:0030478) |
| 0.3 | 6.6 | GO:0031362 | anchored component of external side of plasma membrane(GO:0031362) |
| 0.2 | 1.1 | GO:0032279 | asymmetric synapse(GO:0032279) |
| 0.2 | 2.9 | GO:0097550 | transcriptional preinitiation complex(GO:0097550) |
| 0.2 | 1.1 | GO:0031205 | endoplasmic reticulum Sec complex(GO:0031205) |
| 0.2 | 1.9 | GO:0016012 | sarcoglycan complex(GO:0016012) |
| 0.2 | 3.3 | GO:1990454 | L-type voltage-gated calcium channel complex(GO:1990454) |
| 0.2 | 5.0 | GO:0043220 | Schmidt-Lanterman incisure(GO:0043220) |
| 0.2 | 6.1 | GO:0008074 | guanylate cyclase complex, soluble(GO:0008074) |
| 0.1 | 1.4 | GO:0005579 | membrane attack complex(GO:0005579) |
| 0.1 | 0.7 | GO:0097059 | CNTFR-CLCF1 complex(GO:0097059) |
| 0.1 | 0.5 | GO:0005896 | interleukin-6 receptor complex(GO:0005896) |
| 0.1 | 2.0 | GO:0097433 | dense body(GO:0097433) |
| 0.1 | 0.5 | GO:0048237 | rough endoplasmic reticulum lumen(GO:0048237) |
| 0.1 | 2.4 | GO:0043020 | NADPH oxidase complex(GO:0043020) |
| 0.1 | 2.5 | GO:0034663 | endoplasmic reticulum chaperone complex(GO:0034663) |
| 0.1 | 1.1 | GO:0001739 | sex chromatin(GO:0001739) |
| 0.1 | 8.4 | GO:0016235 | aggresome(GO:0016235) |
| 0.1 | 4.6 | GO:0005605 | basal lamina(GO:0005605) |
| 0.1 | 1.6 | GO:0031089 | platelet dense granule lumen(GO:0031089) |
| 0.1 | 0.9 | GO:0044305 | calyx of Held(GO:0044305) |
| 0.1 | 2.4 | GO:0032045 | guanyl-nucleotide exchange factor complex(GO:0032045) |
| 0.1 | 1.9 | GO:0005881 | cytoplasmic microtubule(GO:0005881) |
| 0.1 | 1.5 | GO:0045179 | apical cortex(GO:0045179) |
| 0.1 | 1.3 | GO:0016461 | unconventional myosin complex(GO:0016461) |
| 0.1 | 0.4 | GO:0000333 | telomerase catalytic core complex(GO:0000333) |
| 0.1 | 1.6 | GO:0008091 | spectrin(GO:0008091) |
| 0.1 | 1.6 | GO:0005884 | actin filament(GO:0005884) |
| 0.1 | 1.2 | GO:0097512 | cardiac myofibril(GO:0097512) |
| 0.1 | 5.0 | GO:0030286 | dynein complex(GO:0030286) |
| 0.1 | 2.0 | GO:0034706 | sodium channel complex(GO:0034706) |
| 0.1 | 0.2 | GO:0043614 | multi-eIF complex(GO:0043614) translation preinitiation complex(GO:0070993) glial limiting end-foot(GO:0097451) |
| 0.1 | 2.0 | GO:0090665 | dystrophin-associated glycoprotein complex(GO:0016010) glycoprotein complex(GO:0090665) |
| 0.1 | 29.0 | GO:0005578 | proteinaceous extracellular matrix(GO:0005578) |
| 0.1 | 0.6 | GO:0042567 | insulin-like growth factor ternary complex(GO:0042567) |
| 0.1 | 11.5 | GO:0005923 | bicellular tight junction(GO:0005923) |
| 0.1 | 0.3 | GO:1990604 | IRE1-TRAF2-ASK1 complex(GO:1990604) |
| 0.1 | 2.6 | GO:0051233 | spindle midzone(GO:0051233) |
| 0.1 | 1.4 | GO:0030122 | AP-2 adaptor complex(GO:0030122) |
| 0.1 | 5.3 | GO:0097610 | cleavage furrow(GO:0032154) cell surface furrow(GO:0097610) |
| 0.1 | 0.9 | GO:0042589 | zymogen granule membrane(GO:0042589) |
| 0.0 | 6.2 | GO:0031093 | platelet alpha granule lumen(GO:0031093) |
| 0.0 | 1.6 | GO:0031594 | neuromuscular junction(GO:0031594) |
| 0.0 | 4.7 | GO:0030864 | cortical actin cytoskeleton(GO:0030864) |
| 0.0 | 2.3 | GO:0000421 | autophagosome membrane(GO:0000421) |
| 0.0 | 0.6 | GO:0031211 | serine C-palmitoyltransferase complex(GO:0017059) endoplasmic reticulum palmitoyltransferase complex(GO:0031211) |
| 0.0 | 1.1 | GO:0031526 | brush border membrane(GO:0031526) |
| 0.0 | 1.9 | GO:0031312 | extrinsic component of organelle membrane(GO:0031312) |
| 0.0 | 1.2 | GO:0009925 | basal plasma membrane(GO:0009925) |
| 0.0 | 1.3 | GO:0098563 | integral component of synaptic vesicle membrane(GO:0030285) intrinsic component of synaptic vesicle membrane(GO:0098563) |
| 0.0 | 0.6 | GO:0000788 | nuclear nucleosome(GO:0000788) |
| 0.0 | 0.1 | GO:0005899 | insulin receptor complex(GO:0005899) |
| 0.0 | 1.8 | GO:0005581 | collagen trimer(GO:0005581) |
| 0.0 | 0.6 | GO:0005652 | nuclear lamina(GO:0005652) |
| 0.0 | 0.7 | GO:0032585 | multivesicular body membrane(GO:0032585) |
| 0.0 | 2.1 | GO:0030426 | growth cone(GO:0030426) |
| 0.0 | 0.5 | GO:1990752 | microtubule end(GO:1990752) |
| 0.0 | 0.3 | GO:0046581 | intercellular canaliculus(GO:0046581) |
| 0.0 | 2.4 | GO:0055038 | recycling endosome membrane(GO:0055038) |
| 0.0 | 0.3 | GO:0042382 | paraspeckles(GO:0042382) |
| 0.0 | 2.5 | GO:0045095 | keratin filament(GO:0045095) |
| 0.0 | 4.1 | GO:0005913 | cell-cell adherens junction(GO:0005913) |
| 0.0 | 0.5 | GO:0032433 | filopodium tip(GO:0032433) |
| 0.0 | 0.8 | GO:0010369 | chromocenter(GO:0010369) |
| 0.0 | 0.4 | GO:0002116 | semaphorin receptor complex(GO:0002116) |
| 0.0 | 0.5 | GO:0005861 | troponin complex(GO:0005861) |
| 0.0 | 4.0 | GO:0045111 | intermediate filament cytoskeleton(GO:0045111) |
| 0.0 | 11.1 | GO:0016324 | apical plasma membrane(GO:0016324) |
| 0.0 | 0.8 | GO:0031307 | integral component of mitochondrial outer membrane(GO:0031307) |
| 0.0 | 0.6 | GO:0005922 | connexon complex(GO:0005922) |
| 0.0 | 0.3 | GO:0035686 | sperm fibrous sheath(GO:0035686) |
| 0.0 | 1.5 | GO:0045177 | apical part of cell(GO:0045177) |
| 0.0 | 0.5 | GO:0005771 | multivesicular body(GO:0005771) |
| 0.0 | 0.6 | GO:0005901 | caveola(GO:0005901) |
| 0.0 | 2.8 | GO:0031012 | extracellular matrix(GO:0031012) |
| 0.0 | 2.3 | GO:0005811 | lipid particle(GO:0005811) |
| 0.0 | 0.1 | GO:1902560 | GMP reductase complex(GO:1902560) |
| 0.0 | 10.7 | GO:0005667 | transcription factor complex(GO:0005667) |
| 0.0 | 0.9 | GO:1904115 | axon cytoplasm(GO:1904115) |
| 0.0 | 1.5 | GO:0042470 | melanosome(GO:0042470) pigment granule(GO:0048770) |
| 0.0 | 0.3 | GO:0034709 | methylosome(GO:0034709) |
| 0.0 | 0.1 | GO:0097427 | microtubule bundle(GO:0097427) |
| 0.0 | 0.4 | GO:0016328 | lateral plasma membrane(GO:0016328) |
| 0.0 | 0.4 | GO:0071004 | U2-type prespliceosome(GO:0071004) |
| 0.0 | 2.4 | GO:0072562 | blood microparticle(GO:0072562) |
| 0.0 | 0.1 | GO:0097209 | epidermal lamellar body(GO:0097209) |
| 0.0 | 0.3 | GO:0000346 | transcription export complex(GO:0000346) |
| 0.0 | 0.5 | GO:0034707 | chloride channel complex(GO:0034707) |
| 0.0 | 0.9 | GO:0031907 | peroxisomal matrix(GO:0005782) microbody lumen(GO:0031907) |
| 0.0 | 0.2 | GO:0032591 | dendritic spine membrane(GO:0032591) |
| 0.0 | 0.3 | GO:0031092 | platelet alpha granule membrane(GO:0031092) |
| 0.0 | 1.6 | GO:0035579 | specific granule membrane(GO:0035579) |
| 0.0 | 0.1 | GO:0031595 | nuclear proteasome complex(GO:0031595) |
Gene overrepresentation in molecular_function category:
| Log-likelihood per target | Total log-likelihood | Term | Description |
|---|---|---|---|
| 1.6 | 4.9 | GO:0001596 | angiotensin type I receptor activity(GO:0001596) |
| 1.0 | 4.1 | GO:0047888 | fatty acid peroxidase activity(GO:0047888) |
| 0.8 | 5.7 | GO:0043120 | tumor necrosis factor binding(GO:0043120) |
| 0.8 | 2.4 | GO:0086057 | voltage-gated calcium channel activity involved in bundle of His cell action potential(GO:0086057) |
| 0.7 | 5.9 | GO:0016941 | natriuretic peptide receptor activity(GO:0016941) |
| 0.7 | 5.5 | GO:0004035 | alkaline phosphatase activity(GO:0004035) |
| 0.6 | 1.8 | GO:0098640 | integrin binding involved in cell-matrix adhesion(GO:0098640) |
| 0.6 | 4.2 | GO:0048101 | calcium- and calmodulin-regulated 3',5'-cyclic-GMP phosphodiesterase activity(GO:0048101) |
| 0.6 | 2.4 | GO:0031694 | alpha-2A adrenergic receptor binding(GO:0031694) |
| 0.6 | 3.5 | GO:0004924 | oncostatin-M receptor activity(GO:0004924) |
| 0.6 | 2.2 | GO:0008281 | sulfonylurea receptor activity(GO:0008281) |
| 0.4 | 2.7 | GO:0097001 | ceramide binding(GO:0097001) |
| 0.4 | 1.3 | GO:0060001 | minus-end directed microfilament motor activity(GO:0060001) |
| 0.4 | 4.8 | GO:0034235 | GPI anchor binding(GO:0034235) |
| 0.4 | 3.3 | GO:0015562 | efflux transmembrane transporter activity(GO:0015562) |
| 0.4 | 1.6 | GO:0005018 | platelet-derived growth factor alpha-receptor activity(GO:0005018) |
| 0.4 | 3.2 | GO:0015168 | glycerol transmembrane transporter activity(GO:0015168) |
| 0.4 | 2.8 | GO:0008508 | bile acid:sodium symporter activity(GO:0008508) |
| 0.4 | 3.9 | GO:0008449 | N-acetylglucosamine-6-sulfatase activity(GO:0008449) |
| 0.4 | 1.9 | GO:0033906 | protein tyrosine kinase inhibitor activity(GO:0030292) hyaluronoglucuronidase activity(GO:0033906) |
| 0.4 | 17.6 | GO:0001972 | retinoic acid binding(GO:0001972) |
| 0.3 | 1.4 | GO:0005017 | platelet-derived growth factor-activated receptor activity(GO:0005017) platelet-derived growth factor beta-receptor activity(GO:0005019) |
| 0.3 | 1.3 | GO:0034714 | type III transforming growth factor beta receptor binding(GO:0034714) |
| 0.3 | 1.0 | GO:0004531 | deoxyribonuclease II activity(GO:0004531) |
| 0.3 | 10.9 | GO:0008239 | dipeptidyl-peptidase activity(GO:0008239) |
| 0.3 | 2.9 | GO:0038052 | RNA polymerase II transcription factor activity, estrogen-activated sequence-specific DNA binding(GO:0038052) |
| 0.3 | 5.7 | GO:0042975 | peroxisome proliferator activated receptor binding(GO:0042975) |
| 0.3 | 2.4 | GO:0098639 | protein binding involved in cell-matrix adhesion(GO:0098634) collagen binding involved in cell-matrix adhesion(GO:0098639) |
| 0.3 | 1.8 | GO:0004517 | nitric-oxide synthase activity(GO:0004517) |
| 0.3 | 41.6 | GO:0005518 | collagen binding(GO:0005518) |
| 0.3 | 1.1 | GO:0005260 | channel-conductance-controlling ATPase activity(GO:0005260) |
| 0.3 | 4.0 | GO:0003708 | retinoic acid receptor activity(GO:0003708) |
| 0.3 | 9.4 | GO:0005540 | hyaluronic acid binding(GO:0005540) |
| 0.3 | 2.7 | GO:0004111 | creatine kinase activity(GO:0004111) |
| 0.3 | 6.1 | GO:0045504 | dynein heavy chain binding(GO:0045504) |
| 0.2 | 1.0 | GO:0004967 | glucagon receptor activity(GO:0004967) |
| 0.2 | 1.0 | GO:1901375 | acetylcholine transmembrane transporter activity(GO:0005277) secondary active organic cation transmembrane transporter activity(GO:0008513) acetate ester transmembrane transporter activity(GO:1901375) |
| 0.2 | 0.7 | GO:0005146 | leukemia inhibitory factor receptor binding(GO:0005146) |
| 0.2 | 1.1 | GO:0047391 | alkylglycerophosphoethanolamine phosphodiesterase activity(GO:0047391) |
| 0.2 | 2.0 | GO:0004499 | N,N-dimethylaniline monooxygenase activity(GO:0004499) |
| 0.2 | 2.8 | GO:0004969 | histamine receptor activity(GO:0004969) |
| 0.2 | 0.9 | GO:0017098 | sulfonylurea receptor binding(GO:0017098) |
| 0.2 | 6.9 | GO:0001968 | fibronectin binding(GO:0001968) |
| 0.2 | 2.1 | GO:0048495 | Roundabout binding(GO:0048495) |
| 0.2 | 3.1 | GO:0019826 | oxygen sensor activity(GO:0019826) |
| 0.2 | 1.2 | GO:0070699 | type II activin receptor binding(GO:0070699) |
| 0.2 | 4.9 | GO:0030898 | actin-dependent ATPase activity(GO:0030898) |
| 0.2 | 1.6 | GO:0015186 | L-glutamine transmembrane transporter activity(GO:0015186) |
| 0.2 | 0.6 | GO:0017082 | mineralocorticoid receptor activity(GO:0017082) |
| 0.2 | 0.9 | GO:0005006 | epidermal growth factor-activated receptor activity(GO:0005006) |
| 0.2 | 4.0 | GO:0044213 | intronic transcription regulatory region sequence-specific DNA binding(GO:0001161) intronic transcription regulatory region DNA binding(GO:0044213) |
| 0.2 | 1.4 | GO:0048407 | platelet-derived growth factor binding(GO:0048407) |
| 0.2 | 0.7 | GO:0031735 | CCR10 chemokine receptor binding(GO:0031735) |
| 0.2 | 1.3 | GO:0035662 | Toll-like receptor 4 binding(GO:0035662) |
| 0.2 | 1.8 | GO:0030020 | extracellular matrix structural constituent conferring tensile strength(GO:0030020) |
| 0.2 | 0.7 | GO:0032564 | adenyl deoxyribonucleotide binding(GO:0032558) dATP binding(GO:0032564) |
| 0.2 | 5.7 | GO:0005520 | insulin-like growth factor binding(GO:0005520) |
| 0.2 | 2.3 | GO:0070700 | BMP receptor binding(GO:0070700) |
| 0.2 | 1.4 | GO:0050544 | arachidonic acid binding(GO:0050544) |
| 0.1 | 1.0 | GO:0016403 | dimethylargininase activity(GO:0016403) |
| 0.1 | 3.1 | GO:0008179 | adenylate cyclase binding(GO:0008179) |
| 0.1 | 2.6 | GO:0004065 | arylsulfatase activity(GO:0004065) |
| 0.1 | 1.1 | GO:0008241 | peptidyl-dipeptidase activity(GO:0008241) |
| 0.1 | 0.4 | GO:0070890 | L-ascorbate:sodium symporter activity(GO:0008520) L-ascorbic acid transporter activity(GO:0015229) sodium-dependent L-ascorbate transmembrane transporter activity(GO:0070890) |
| 0.1 | 1.1 | GO:0016907 | G-protein coupled acetylcholine receptor activity(GO:0016907) |
| 0.1 | 5.4 | GO:0070064 | proline-rich region binding(GO:0070064) |
| 0.1 | 4.3 | GO:0004190 | aspartic-type endopeptidase activity(GO:0004190) |
| 0.1 | 0.9 | GO:0016402 | pristanoyl-CoA oxidase activity(GO:0016402) |
| 0.1 | 1.6 | GO:0042731 | PH domain binding(GO:0042731) |
| 0.1 | 4.2 | GO:0071837 | HMG box domain binding(GO:0071837) |
| 0.1 | 0.5 | GO:0030899 | calcium-dependent ATPase activity(GO:0030899) |
| 0.1 | 1.2 | GO:0004198 | calcium-dependent cysteine-type endopeptidase activity(GO:0004198) |
| 0.1 | 2.3 | GO:0000146 | microfilament motor activity(GO:0000146) |
| 0.1 | 1.1 | GO:0005250 | A-type (transient outward) potassium channel activity(GO:0005250) |
| 0.1 | 2.0 | GO:0051371 | muscle alpha-actinin binding(GO:0051371) |
| 0.1 | 0.7 | GO:0035402 | histone kinase activity (H3-T11 specific)(GO:0035402) |
| 0.1 | 0.7 | GO:0004897 | ciliary neurotrophic factor receptor activity(GO:0004897) |
| 0.1 | 0.5 | GO:0035939 | microsatellite binding(GO:0035939) |
| 0.1 | 1.2 | GO:0071532 | ankyrin repeat binding(GO:0071532) |
| 0.1 | 2.7 | GO:0008349 | MAP kinase kinase kinase kinase activity(GO:0008349) |
| 0.1 | 1.9 | GO:0030548 | acetylcholine receptor regulator activity(GO:0030548) neurotransmitter receptor regulator activity(GO:0099602) |
| 0.1 | 0.5 | GO:0005138 | interleukin-6 receptor binding(GO:0005138) |
| 0.1 | 2.0 | GO:0015280 | ligand-gated sodium channel activity(GO:0015280) |
| 0.1 | 10.2 | GO:0005201 | extracellular matrix structural constituent(GO:0005201) |
| 0.1 | 4.0 | GO:0070742 | C2H2 zinc finger domain binding(GO:0070742) |
| 0.1 | 3.8 | GO:0008093 | cytoskeletal adaptor activity(GO:0008093) |
| 0.1 | 0.3 | GO:0047696 | beta-adrenergic receptor kinase activity(GO:0047696) |
| 0.1 | 0.9 | GO:0086056 | voltage-gated calcium channel activity involved in AV node cell action potential(GO:0086056) |
| 0.1 | 3.5 | GO:0005104 | fibroblast growth factor receptor binding(GO:0005104) |
| 0.1 | 0.5 | GO:0031708 | endothelin B receptor binding(GO:0031708) |
| 0.1 | 0.8 | GO:0005534 | galactose binding(GO:0005534) |
| 0.1 | 0.3 | GO:0031432 | titin binding(GO:0031432) |
| 0.1 | 0.8 | GO:0008321 | Ral guanyl-nucleotide exchange factor activity(GO:0008321) |
| 0.1 | 1.1 | GO:0005021 | vascular endothelial growth factor-activated receptor activity(GO:0005021) |
| 0.1 | 0.9 | GO:0019534 | toxin transporter activity(GO:0019534) |
| 0.1 | 0.8 | GO:0030368 | interleukin-17 receptor activity(GO:0030368) |
| 0.1 | 0.7 | GO:0008467 | [heparan sulfate]-glucosamine 3-sulfotransferase 1 activity(GO:0008467) |
| 0.1 | 0.3 | GO:0004963 | follicle-stimulating hormone receptor activity(GO:0004963) |
| 0.1 | 0.7 | GO:0004957 | prostaglandin E receptor activity(GO:0004957) |
| 0.1 | 1.2 | GO:0035374 | chondroitin sulfate binding(GO:0035374) |
| 0.1 | 0.5 | GO:0004735 | pyrroline-5-carboxylate reductase activity(GO:0004735) |
| 0.1 | 1.4 | GO:0022833 | mechanically-gated ion channel activity(GO:0008381) mechanically gated channel activity(GO:0022833) |
| 0.1 | 0.5 | GO:0050508 | glucuronosyl-N-acetylglucosaminyl-proteoglycan 4-alpha-N-acetylglucosaminyltransferase activity(GO:0050508) |
| 0.1 | 0.3 | GO:0005042 | netrin receptor activity(GO:0005042) |
| 0.1 | 11.5 | GO:0004867 | serine-type endopeptidase inhibitor activity(GO:0004867) |
| 0.1 | 3.8 | GO:0005109 | frizzled binding(GO:0005109) |
| 0.1 | 4.8 | GO:0042169 | SH2 domain binding(GO:0042169) |
| 0.1 | 1.5 | GO:0070492 | oligosaccharide binding(GO:0070492) |
| 0.1 | 0.9 | GO:0015271 | outward rectifier potassium channel activity(GO:0015271) |
| 0.1 | 2.5 | GO:0019198 | transmembrane receptor protein tyrosine phosphatase activity(GO:0005001) transmembrane receptor protein phosphatase activity(GO:0019198) |
| 0.1 | 2.5 | GO:0015269 | calcium-activated potassium channel activity(GO:0015269) |
| 0.1 | 0.6 | GO:0016454 | serine C-palmitoyltransferase activity(GO:0004758) C-palmitoyltransferase activity(GO:0016454) |
| 0.1 | 3.4 | GO:0003785 | actin monomer binding(GO:0003785) |
| 0.1 | 3.5 | GO:0005160 | transforming growth factor beta receptor binding(GO:0005160) |
| 0.1 | 8.0 | GO:0008307 | structural constituent of muscle(GO:0008307) |
| 0.1 | 0.8 | GO:0030274 | LIM domain binding(GO:0030274) |
| 0.1 | 1.1 | GO:0031821 | G-protein coupled serotonin receptor binding(GO:0031821) |
| 0.1 | 12.1 | GO:0005178 | integrin binding(GO:0005178) |
| 0.1 | 1.8 | GO:0005523 | tropomyosin binding(GO:0005523) |
| 0.1 | 4.1 | GO:0050699 | WW domain binding(GO:0050699) |
| 0.1 | 0.3 | GO:0008184 | glycogen phosphorylase activity(GO:0008184) |
| 0.1 | 1.3 | GO:0031435 | mitogen-activated protein kinase kinase kinase binding(GO:0031435) |
| 0.1 | 0.4 | GO:0004522 | ribonuclease A activity(GO:0004522) |
| 0.1 | 0.6 | GO:1903763 | gap junction channel activity involved in cell communication by electrical coupling(GO:1903763) |
| 0.1 | 0.4 | GO:1990254 | keratin filament binding(GO:1990254) |
| 0.1 | 0.5 | GO:0004687 | myosin light chain kinase activity(GO:0004687) |
| 0.1 | 1.3 | GO:0008253 | 5'-nucleotidase activity(GO:0008253) |
| 0.1 | 0.9 | GO:0042974 | retinoic acid receptor binding(GO:0042974) |
| 0.1 | 1.0 | GO:0015279 | store-operated calcium channel activity(GO:0015279) |
| 0.1 | 1.7 | GO:0001848 | complement binding(GO:0001848) |
| 0.0 | 1.4 | GO:0008301 | DNA binding, bending(GO:0008301) |
| 0.0 | 3.5 | GO:0001105 | RNA polymerase II transcription coactivator activity(GO:0001105) |
| 0.0 | 0.1 | GO:0043183 | vascular endothelial growth factor receptor 1 binding(GO:0043183) |
| 0.0 | 0.1 | GO:0015183 | L-aspartate transmembrane transporter activity(GO:0015183) |
| 0.0 | 0.1 | GO:0005137 | interleukin-5 receptor binding(GO:0005137) |
| 0.0 | 1.2 | GO:0001222 | transcription corepressor binding(GO:0001222) |
| 0.0 | 0.1 | GO:0034040 | lipid-transporting ATPase activity(GO:0034040) |
| 0.0 | 5.8 | GO:0005179 | hormone activity(GO:0005179) |
| 0.0 | 6.5 | GO:0004222 | metalloendopeptidase activity(GO:0004222) |
| 0.0 | 0.7 | GO:0019871 | sodium channel inhibitor activity(GO:0019871) |
| 0.0 | 0.4 | GO:0005025 | transforming growth factor beta receptor activity, type I(GO:0005025) |
| 0.0 | 3.3 | GO:0005200 | structural constituent of cytoskeleton(GO:0005200) |
| 0.0 | 1.5 | GO:0098641 | cadherin binding involved in cell-cell adhesion(GO:0098641) |
| 0.0 | 0.2 | GO:0003989 | acetyl-CoA carboxylase activity(GO:0003989) |
| 0.0 | 0.4 | GO:0017040 | ceramidase activity(GO:0017040) |
| 0.0 | 0.2 | GO:0003883 | CTP synthase activity(GO:0003883) |
| 0.0 | 0.3 | GO:0035243 | protein-arginine omega-N symmetric methyltransferase activity(GO:0035243) |
| 0.0 | 1.2 | GO:0004602 | glutathione peroxidase activity(GO:0004602) |
| 0.0 | 3.2 | GO:0001540 | beta-amyloid binding(GO:0001540) |
| 0.0 | 2.4 | GO:0005507 | copper ion binding(GO:0005507) |
| 0.0 | 0.2 | GO:0016453 | C-acetyltransferase activity(GO:0016453) |
| 0.0 | 0.4 | GO:0004565 | beta-galactosidase activity(GO:0004565) |
| 0.0 | 34.6 | GO:0005509 | calcium ion binding(GO:0005509) |
| 0.0 | 13.2 | GO:0003714 | transcription corepressor activity(GO:0003714) |
| 0.0 | 1.7 | GO:0019894 | kinesin binding(GO:0019894) |
| 0.0 | 0.8 | GO:0005212 | structural constituent of eye lens(GO:0005212) |
| 0.0 | 1.0 | GO:0098811 | transcriptional activator activity, RNA polymerase II transcription factor binding(GO:0001190) transcriptional repressor activity, RNA polymerase II activating transcription factor binding(GO:0098811) |
| 0.0 | 0.1 | GO:0051373 | FATZ binding(GO:0051373) |
| 0.0 | 1.3 | GO:0005549 | odorant binding(GO:0005549) |
| 0.0 | 1.0 | GO:0044183 | protein binding involved in protein folding(GO:0044183) |
| 0.0 | 0.2 | GO:0043813 | phosphatidylinositol-3,5-bisphosphate 5-phosphatase activity(GO:0043813) |
| 0.0 | 0.3 | GO:0030957 | Tat protein binding(GO:0030957) |
| 0.0 | 0.9 | GO:0004364 | glutathione transferase activity(GO:0004364) |
| 0.0 | 0.1 | GO:0004925 | prolactin receptor activity(GO:0004925) |
| 0.0 | 0.7 | GO:0016712 | oxidoreductase activity, acting on paired donors, with incorporation or reduction of molecular oxygen, reduced flavin or flavoprotein as one donor, and incorporation of one atom of oxygen(GO:0016712) |
| 0.0 | 0.1 | GO:0016176 | superoxide-generating NADPH oxidase activator activity(GO:0016176) |
| 0.0 | 0.4 | GO:0017154 | semaphorin receptor activity(GO:0017154) |
| 0.0 | 0.2 | GO:0003872 | 6-phosphofructokinase activity(GO:0003872) |
| 0.0 | 0.4 | GO:0036374 | glutathione hydrolase activity(GO:0036374) |
| 0.0 | 1.9 | GO:0019003 | GDP binding(GO:0019003) |
| 0.0 | 0.6 | GO:0004707 | MAP kinase activity(GO:0004707) |
| 0.0 | 0.3 | GO:0017166 | vinculin binding(GO:0017166) |
| 0.0 | 0.1 | GO:0003920 | GMP reductase activity(GO:0003920) oxidoreductase activity, acting on NAD(P)H, nitrogenous group as acceptor(GO:0016657) |
| 0.0 | 0.1 | GO:0047757 | chondroitin-glucuronate 5-epimerase activity(GO:0047757) |
| 0.0 | 0.3 | GO:0003705 | transcription factor activity, RNA polymerase II distal enhancer sequence-specific binding(GO:0003705) |
| 0.0 | 0.0 | GO:0015925 | galactosidase activity(GO:0015925) |
| 0.0 | 0.1 | GO:0005166 | neurotrophin p75 receptor binding(GO:0005166) |
| 0.0 | 0.2 | GO:0039706 | co-receptor binding(GO:0039706) |
| 0.0 | 0.2 | GO:0035005 | 1-phosphatidylinositol-4-phosphate 3-kinase activity(GO:0035005) |
| 0.0 | 0.5 | GO:0005337 | nucleoside transmembrane transporter activity(GO:0005337) |
| 0.0 | 0.9 | GO:0048306 | calcium-dependent protein binding(GO:0048306) |
| 0.0 | 0.5 | GO:0070182 | DNA polymerase binding(GO:0070182) |
| 0.0 | 0.2 | GO:0022850 | serotonin-gated cation channel activity(GO:0022850) |
| 0.0 | 1.3 | GO:0008138 | protein tyrosine/serine/threonine phosphatase activity(GO:0008138) |
| 0.0 | 0.8 | GO:0050839 | cell adhesion molecule binding(GO:0050839) |
| 0.0 | 0.5 | GO:0004697 | protein kinase C activity(GO:0004697) |
| 0.0 | 0.7 | GO:0043015 | gamma-tubulin binding(GO:0043015) |
| 0.0 | 0.3 | GO:0015037 | peptide disulfide oxidoreductase activity(GO:0015037) |
| 0.0 | 0.2 | GO:0017034 | Rap guanyl-nucleotide exchange factor activity(GO:0017034) |
| 0.0 | 0.4 | GO:0005247 | voltage-gated chloride channel activity(GO:0005247) |
| 0.0 | 0.2 | GO:0061578 | Lys63-specific deubiquitinase activity(GO:0061578) |
| 0.0 | 0.1 | GO:0035259 | glucocorticoid receptor binding(GO:0035259) |
| 0.0 | 0.3 | GO:0051018 | protein kinase A binding(GO:0051018) |
| 0.0 | 0.2 | GO:0043394 | proteoglycan binding(GO:0043394) heparan sulfate proteoglycan binding(GO:0043395) |
| 0.0 | 0.4 | GO:0070402 | NADPH binding(GO:0070402) |
| 0.0 | 0.1 | GO:0004468 | lysine N-acetyltransferase activity, acting on acetyl phosphate as donor(GO:0004468) |
| 0.0 | 0.6 | GO:0005487 | nucleocytoplasmic transporter activity(GO:0005487) |
| 0.0 | 1.2 | GO:0019838 | growth factor binding(GO:0019838) |
| 0.0 | 0.1 | GO:0036402 | proteasome-activating ATPase activity(GO:0036402) |
| 0.0 | 0.2 | GO:0015321 | sodium-dependent phosphate transmembrane transporter activity(GO:0015321) |
| 0.0 | 1.9 | GO:0004930 | G-protein coupled receptor activity(GO:0004930) |
| 0.0 | 0.3 | GO:0034237 | protein kinase A regulatory subunit binding(GO:0034237) |
Gene overrepresentation in curated gene sets: canonical pathways category:
| Log-likelihood per target | Total log-likelihood | Term | Description |
|---|---|---|---|
| 0.4 | 25.9 | NABA COLLAGENS | Genes encoding collagen proteins |
| 0.3 | 23.2 | NABA PROTEOGLYCANS | Genes encoding proteoglycans |
| 0.2 | 1.1 | PID CD40 PATHWAY | CD40/CD40L signaling |
| 0.2 | 13.4 | PID INTEGRIN3 PATHWAY | Beta3 integrin cell surface interactions |
| 0.1 | 0.5 | ST DIFFERENTIATION PATHWAY IN PC12 CELLS | Differentiation Pathway in PC12 Cells; this is a specific case of PAC1 Receptor Pathway. |
| 0.1 | 2.6 | PID SYNDECAN 1 PATHWAY | Syndecan-1-mediated signaling events |
| 0.1 | 5.5 | PID INTEGRIN1 PATHWAY | Beta1 integrin cell surface interactions |
| 0.1 | 37.4 | NABA ECM GLYCOPROTEINS | Genes encoding structural ECM glycoproteins |
| 0.1 | 4.6 | PID UPA UPAR PATHWAY | Urokinase-type plasminogen activator (uPA) and uPAR-mediated signaling |
| 0.1 | 1.3 | PID S1P S1P3 PATHWAY | S1P3 pathway |
| 0.1 | 6.1 | PID RXR VDR PATHWAY | RXR and RAR heterodimerization with other nuclear receptor |
| 0.1 | 4.5 | PID S1P S1P2 PATHWAY | S1P2 pathway |
| 0.1 | 1.0 | ST IL 13 PATHWAY | Interleukin 13 (IL-13) Pathway |
| 0.1 | 6.4 | PID TAP63 PATHWAY | Validated transcriptional targets of TAp63 isoforms |
| 0.1 | 3.4 | PID ER NONGENOMIC PATHWAY | Plasma membrane estrogen receptor signaling |
| 0.1 | 6.0 | PID ERBB2 ERBB3 PATHWAY | ErbB2/ErbB3 signaling events |
| 0.1 | 7.0 | PID TGFBR PATHWAY | TGF-beta receptor signaling |
| 0.1 | 0.3 | PID GLYPICAN 1PATHWAY | Glypican 1 network |
| 0.1 | 19.5 | NABA ECM REGULATORS | Genes encoding enzymes and their regulators involved in the remodeling of the extracellular matrix |
| 0.1 | 1.6 | PID CIRCADIAN PATHWAY | Circadian rhythm pathway |
| 0.0 | 2.2 | PID PTP1B PATHWAY | Signaling events mediated by PTP1B |
| 0.0 | 1.1 | PID INTEGRIN A9B1 PATHWAY | Alpha9 beta1 integrin signaling events |
| 0.0 | 1.2 | PID ALK1 PATHWAY | ALK1 signaling events |
| 0.0 | 0.5 | ST STAT3 PATHWAY | STAT3 Pathway |
| 0.0 | 1.0 | PID ERBB1 RECEPTOR PROXIMAL PATHWAY | EGF receptor (ErbB1) signaling pathway |
| 0.0 | 0.8 | PID PDGFRA PATHWAY | PDGFR-alpha signaling pathway |
| 0.0 | 2.0 | ST G ALPHA I PATHWAY | G alpha i Pathway |
| 0.0 | 1.9 | PID IGF1 PATHWAY | IGF1 pathway |
| 0.0 | 3.3 | PID ECADHERIN STABILIZATION PATHWAY | Stabilization and expansion of the E-cadherin adherens junction |
| 0.0 | 3.0 | PID AURORA B PATHWAY | Aurora B signaling |
| 0.0 | 3.0 | PID HNF3A PATHWAY | FOXA1 transcription factor network |
| 0.0 | 1.0 | PID FAK PATHWAY | Signaling events mediated by focal adhesion kinase |
| 0.0 | 0.6 | PID P38 GAMMA DELTA PATHWAY | Signaling mediated by p38-gamma and p38-delta |
| 0.0 | 1.6 | PID ARF6 TRAFFICKING PATHWAY | Arf6 trafficking events |
| 0.0 | 2.4 | PID HNF3B PATHWAY | FOXA2 and FOXA3 transcription factor networks |
| 0.0 | 0.8 | PID NETRIN PATHWAY | Netrin-mediated signaling events |
| 0.0 | 0.3 | PID ECADHERIN KERATINOCYTE PATHWAY | E-cadherin signaling in keratinocytes |
| 0.0 | 0.4 | PID IL4 2PATHWAY | IL4-mediated signaling events |
| 0.0 | 0.3 | SIG REGULATION OF THE ACTIN CYTOSKELETON BY RHO GTPASES | Genes related to regulation of the actin cytoskeleton |
| 0.0 | 1.0 | PID RAS PATHWAY | Regulation of Ras family activation |
| 0.0 | 0.6 | PID EPHB FWD PATHWAY | EPHB forward signaling |
| 0.0 | 1.4 | PID TNF PATHWAY | TNF receptor signaling pathway |
| 0.0 | 1.9 | PID AR PATHWAY | Coregulation of Androgen receptor activity |
| 0.0 | 4.3 | NABA ECM AFFILIATED | Genes encoding proteins affiliated structurally or functionally to extracellular matrix proteins |
| 0.0 | 0.2 | PID SMAD2 3PATHWAY | Regulation of cytoplasmic and nuclear SMAD2/3 signaling |
| 0.0 | 0.1 | PID VEGF VEGFR PATHWAY | VEGF and VEGFR signaling network |
Gene overrepresentation in curated gene sets: REACTOME pathways category:
| Log-likelihood per target | Total log-likelihood | Term | Description |
|---|---|---|---|
| 0.7 | 11.7 | REACTOME HYALURONAN UPTAKE AND DEGRADATION | Genes involved in Hyaluronan uptake and degradation |
| 0.7 | 21.7 | REACTOME CS DS DEGRADATION | Genes involved in CS/DS degradation |
| 0.3 | 8.3 | REACTOME INTRINSIC PATHWAY | Genes involved in Intrinsic Pathway |
| 0.3 | 28.8 | REACTOME COLLAGEN FORMATION | Genes involved in Collagen formation |
| 0.2 | 10.5 | REACTOME SIGNALING BY HIPPO | Genes involved in Signaling by Hippo |
| 0.2 | 7.3 | REACTOME GLUCURONIDATION | Genes involved in Glucuronidation |
| 0.2 | 3.2 | REACTOME PASSIVE TRANSPORT BY AQUAPORINS | Genes involved in Passive Transport by Aquaporins |
| 0.2 | 12.8 | REACTOME SMOOTH MUSCLE CONTRACTION | Genes involved in Smooth Muscle Contraction |
| 0.2 | 3.1 | REACTOME ABACAVIR TRANSPORT AND METABOLISM | Genes involved in Abacavir transport and metabolism |
| 0.2 | 3.1 | REACTOME KERATAN SULFATE DEGRADATION | Genes involved in Keratan sulfate degradation |
| 0.2 | 2.6 | REACTOME THE ACTIVATION OF ARYLSULFATASES | Genes involved in The activation of arylsulfatases |
| 0.1 | 6.7 | REACTOME CGMP EFFECTS | Genes involved in cGMP effects |
| 0.1 | 2.8 | REACTOME BILE SALT AND ORGANIC ANION SLC TRANSPORTERS | Genes involved in Bile salt and organic anion SLC transporters |
| 0.1 | 2.0 | REACTOME NITRIC OXIDE STIMULATES GUANYLATE CYCLASE | Genes involved in Nitric oxide stimulates guanylate cyclase |
| 0.1 | 1.5 | REACTOME REGULATION OF INSULIN SECRETION BY ACETYLCHOLINE | Genes involved in Regulation of Insulin Secretion by Acetylcholine |
| 0.1 | 2.3 | REACTOME ACTIVATED POINT MUTANTS OF FGFR2 | Genes involved in Activated point mutants of FGFR2 |
| 0.1 | 1.2 | REACTOME TRAFFICKING AND PROCESSING OF ENDOSOMAL TLR | Genes involved in Trafficking and processing of endosomal TLR |
| 0.1 | 1.2 | REACTOME RECEPTOR LIGAND BINDING INITIATES THE SECOND PROTEOLYTIC CLEAVAGE OF NOTCH RECEPTOR | Genes involved in Receptor-ligand binding initiates the second proteolytic cleavage of Notch receptor |
| 0.1 | 1.2 | REACTOME GLYCOPROTEIN HORMONES | Genes involved in Glycoprotein hormones |
| 0.1 | 1.7 | REACTOME APOPTOSIS INDUCED DNA FRAGMENTATION | Genes involved in Apoptosis induced DNA fragmentation |
| 0.1 | 1.3 | REACTOME PURINE CATABOLISM | Genes involved in Purine catabolism |
| 0.1 | 1.8 | REACTOME VEGF LIGAND RECEPTOR INTERACTIONS | Genes involved in VEGF ligand-receptor interactions |
| 0.1 | 4.3 | REACTOME ABC FAMILY PROTEINS MEDIATED TRANSPORT | Genes involved in ABC-family proteins mediated transport |
| 0.1 | 3.1 | REACTOME CASPASE MEDIATED CLEAVAGE OF CYTOSKELETAL PROTEINS | Genes involved in Caspase-mediated cleavage of cytoskeletal proteins |
| 0.1 | 0.7 | REACTOME PROSTANOID LIGAND RECEPTORS | Genes involved in Prostanoid ligand receptors |
| 0.1 | 8.5 | REACTOME TRANSCRIPTIONAL REGULATION OF WHITE ADIPOCYTE DIFFERENTIATION | Genes involved in Transcriptional Regulation of White Adipocyte Differentiation |
| 0.1 | 4.9 | REACTOME NUCLEAR SIGNALING BY ERBB4 | Genes involved in Nuclear signaling by ERBB4 |
| 0.1 | 1.3 | REACTOME GAP JUNCTION DEGRADATION | Genes involved in Gap junction degradation |
| 0.1 | 0.9 | REACTOME GLUCAGON TYPE LIGAND RECEPTORS | Genes involved in Glucagon-type ligand receptors |
| 0.1 | 0.1 | REACTOME SOS MEDIATED SIGNALLING | Genes involved in SOS-mediated signalling |
| 0.0 | 0.5 | REACTOME IL 6 SIGNALING | Genes involved in Interleukin-6 signaling |
| 0.0 | 1.6 | REACTOME REGULATION OF COMPLEMENT CASCADE | Genes involved in Regulation of Complement cascade |
| 0.0 | 2.7 | REACTOME ADHERENS JUNCTIONS INTERACTIONS | Genes involved in Adherens junctions interactions |
| 0.0 | 1.0 | REACTOME G2 M DNA DAMAGE CHECKPOINT | Genes involved in G2/M DNA damage checkpoint |
| 0.0 | 2.7 | REACTOME REGULATION OF BETA CELL DEVELOPMENT | Genes involved in Regulation of beta-cell development |
| 0.0 | 0.8 | REACTOME SYNTHESIS SECRETION AND INACTIVATION OF GLP1 | Genes involved in Synthesis, Secretion, and Inactivation of Glucagon-like Peptide-1 (GLP-1) |
| 0.0 | 1.1 | REACTOME ADENYLATE CYCLASE INHIBITORY PATHWAY | Genes involved in Adenylate cyclase inhibitory pathway |
| 0.0 | 0.9 | REACTOME GRB2 EVENTS IN ERBB2 SIGNALING | Genes involved in GRB2 events in ERBB2 signaling |
| 0.0 | 0.7 | REACTOME TANDEM PORE DOMAIN POTASSIUM CHANNELS | Genes involved in Tandem pore domain potassium channels |
| 0.0 | 1.5 | REACTOME DOWNSTREAM SIGNAL TRANSDUCTION | Genes involved in Downstream signal transduction |
| 0.0 | 0.3 | REACTOME CIRCADIAN REPRESSION OF EXPRESSION BY REV ERBA | Genes involved in Circadian Repression of Expression by REV-ERBA |
| 0.0 | 1.3 | REACTOME EXTRACELLULAR MATRIX ORGANIZATION | Genes involved in Extracellular matrix organization |
| 0.0 | 1.5 | REACTOME PIP3 ACTIVATES AKT SIGNALING | Genes involved in PIP3 activates AKT signaling |
| 0.0 | 1.1 | REACTOME REGULATION OF WATER BALANCE BY RENAL AQUAPORINS | Genes involved in Regulation of Water Balance by Renal Aquaporins |
| 0.0 | 0.9 | REACTOME INWARDLY RECTIFYING K CHANNELS | Genes involved in Inwardly rectifying K+ channels |
| 0.0 | 0.6 | REACTOME GAP JUNCTION TRAFFICKING | Genes involved in Gap junction trafficking |
| 0.0 | 0.2 | REACTOME FGFR LIGAND BINDING AND ACTIVATION | Genes involved in FGFR ligand binding and activation |
| 0.0 | 0.9 | REACTOME RNA POL III TRANSCRIPTION INITIATION FROM TYPE 3 PROMOTER | Genes involved in RNA Polymerase III Transcription Initiation From Type 3 Promoter |
| 0.0 | 0.6 | REACTOME P38MAPK EVENTS | Genes involved in p38MAPK events |
| 0.0 | 0.9 | REACTOME TERMINATION OF O GLYCAN BIOSYNTHESIS | Genes involved in Termination of O-glycan biosynthesis |
| 0.0 | 3.0 | REACTOME INTEGRIN CELL SURFACE INTERACTIONS | Genes involved in Integrin cell surface interactions |
| 0.0 | 0.9 | REACTOME CELL CELL JUNCTION ORGANIZATION | Genes involved in Cell-cell junction organization |
| 0.0 | 1.0 | REACTOME HS GAG BIOSYNTHESIS | Genes involved in HS-GAG biosynthesis |
| 0.0 | 0.1 | REACTOME NRIF SIGNALS CELL DEATH FROM THE NUCLEUS | Genes involved in NRIF signals cell death from the nucleus |
| 0.0 | 0.5 | REACTOME ENDOGENOUS STEROLS | Genes involved in Endogenous sterols |
| 0.0 | 0.7 | REACTOME NCAM1 INTERACTIONS | Genes involved in NCAM1 interactions |
| 0.0 | 0.3 | REACTOME DOWNREGULATION OF SMAD2 3 SMAD4 TRANSCRIPTIONAL ACTIVITY | Genes involved in Downregulation of SMAD2/3:SMAD4 transcriptional activity |
| 0.0 | 0.4 | REACTOME REGULATION OF AMPK ACTIVITY VIA LKB1 | Genes involved in Regulation of AMPK activity via LKB1 |
| 0.0 | 0.3 | REACTOME METABOLISM OF RNA | Genes involved in Metabolism of RNA |
| 0.0 | 0.3 | REACTOME GLYCOGEN BREAKDOWN GLYCOGENOLYSIS | Genes involved in Glycogen breakdown (glycogenolysis) |
| 0.0 | 3.1 | REACTOME GASTRIN CREB SIGNALLING PATHWAY VIA PKC AND MAPK | Genes involved in Gastrin-CREB signalling pathway via PKC and MAPK |
| 0.0 | 0.2 | REACTOME XENOBIOTICS | Genes involved in Xenobiotics |
| 0.0 | 0.5 | REACTOME SULFUR AMINO ACID METABOLISM | Genes involved in Sulfur amino acid metabolism |