Project
Illumina Body Map 2: averaged replicates
Navigation
Downloads
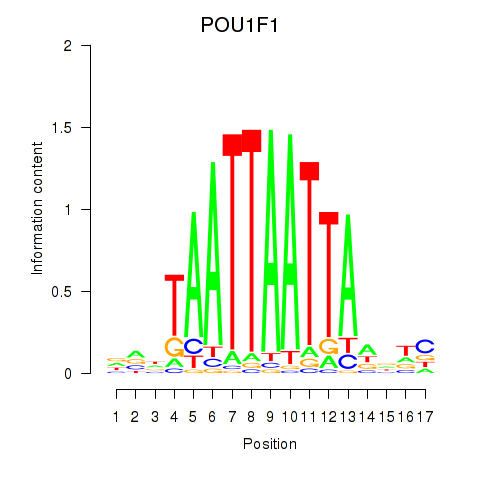
Results for POU1F1
Z-value: 2.16
Motif logo
Transcription factors associated with POU1F1
| Gene Symbol | Gene ID | Gene Info |
|---|---|---|
|
POU1F1
|
ENSG00000064835.6 | POU class 1 homeobox 1 |
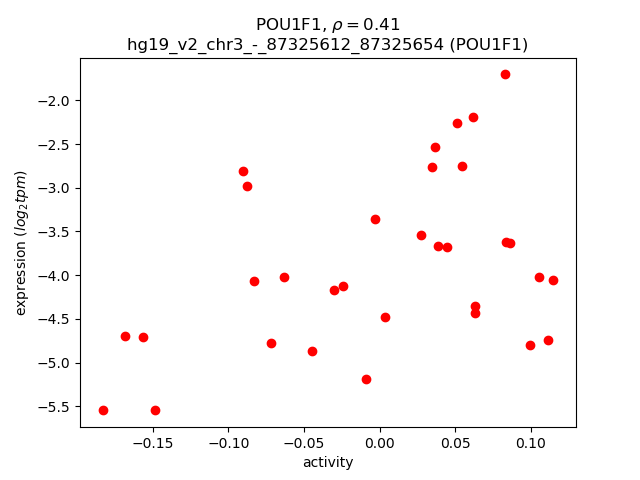
Activity-expression correlation:
| Gene | Promoter | Pearson corr. coef. | P-value | Plot |
|---|---|---|---|---|
| POU1F1 | hg19_v2_chr3_-_87325612_87325654 | 0.41 | 1.9e-02 | Click! |
Activity profile of POU1F1 motif
Sorted Z-values of POU1F1 motif
| Promoter | Log-likelihood | Transcript | Gene | Gene Info |
|---|---|---|---|---|
| chr15_+_101417919 | 3.62 |
ENST00000561338.1
|
ALDH1A3
|
aldehyde dehydrogenase 1 family, member A3 |
| chr12_+_78359999 | 3.60 |
ENST00000550503.1
|
NAV3
|
neuron navigator 3 |
| chr21_-_43735628 | 3.54 |
ENST00000291525.10
ENST00000518498.1 |
TFF3
|
trefoil factor 3 (intestinal) |
| chr21_-_15583165 | 3.37 |
ENST00000536861.1
|
LIPI
|
lipase, member I |
| chr12_+_26164645 | 3.29 |
ENST00000542004.1
|
RASSF8
|
Ras association (RalGDS/AF-6) domain family (N-terminal) member 8 |
| chr14_+_101295638 | 3.28 |
ENST00000523671.2
|
MEG3
|
maternally expressed 3 (non-protein coding) |
| chr1_+_77333117 | 3.28 |
ENST00000477717.1
|
ST6GALNAC5
|
ST6 (alpha-N-acetyl-neuraminyl-2,3-beta-galactosyl-1,3)-N-acetylgalactosaminide alpha-2,6-sialyltransferase 5 |
| chr15_-_56757329 | 3.23 |
ENST00000260453.3
|
MNS1
|
meiosis-specific nuclear structural 1 |
| chr4_-_118006697 | 3.14 |
ENST00000310754.4
|
TRAM1L1
|
translocation associated membrane protein 1-like 1 |
| chr10_-_13043697 | 3.05 |
ENST00000378825.3
|
CCDC3
|
coiled-coil domain containing 3 |
| chr5_+_140588269 | 2.90 |
ENST00000541609.1
ENST00000239450.2 |
PCDHB12
|
protocadherin beta 12 |
| chrX_-_102531717 | 2.88 |
ENST00000372680.1
|
TCEAL5
|
transcription elongation factor A (SII)-like 5 |
| chrX_-_55057403 | 2.88 |
ENST00000396198.3
ENST00000335854.4 ENST00000455688.1 ENST00000330807.5 |
ALAS2
|
aminolevulinate, delta-, synthase 2 |
| chr8_+_98900132 | 2.87 |
ENST00000520016.1
|
MATN2
|
matrilin 2 |
| chr4_+_119809984 | 2.80 |
ENST00000307142.4
ENST00000448416.2 ENST00000429713.2 |
SYNPO2
|
synaptopodin 2 |
| chr3_+_28390637 | 2.80 |
ENST00000420223.1
ENST00000383768.2 |
ZCWPW2
|
zinc finger, CW type with PWWP domain 2 |
| chr17_-_67224812 | 2.74 |
ENST00000423818.2
|
ABCA10
|
ATP-binding cassette, sub-family A (ABC1), member 10 |
| chr7_+_134528635 | 2.73 |
ENST00000445569.2
|
CALD1
|
caldesmon 1 |
| chr10_+_53806501 | 2.65 |
ENST00000373975.2
|
PRKG1
|
protein kinase, cGMP-dependent, type I |
| chr1_+_87012753 | 2.63 |
ENST00000370563.3
|
CLCA4
|
chloride channel accessory 4 |
| chr5_+_140762268 | 2.56 |
ENST00000518325.1
|
PCDHGA7
|
protocadherin gamma subfamily A, 7 |
| chr4_+_119810134 | 2.54 |
ENST00000434046.2
|
SYNPO2
|
synaptopodin 2 |
| chr8_+_30244580 | 2.53 |
ENST00000523115.1
ENST00000519647.1 |
RBPMS
|
RNA binding protein with multiple splicing |
| chr6_-_49712147 | 2.50 |
ENST00000433368.2
ENST00000354620.4 |
CRISP3
|
cysteine-rich secretory protein 3 |
| chr7_-_16872932 | 2.46 |
ENST00000419572.2
ENST00000412973.1 |
AGR2
|
anterior gradient 2 |
| chr8_-_38008783 | 2.45 |
ENST00000276449.4
|
STAR
|
steroidogenic acute regulatory protein |
| chr6_-_49712123 | 2.44 |
ENST00000263045.4
|
CRISP3
|
cysteine-rich secretory protein 3 |
| chr14_-_80697396 | 2.42 |
ENST00000557010.1
|
DIO2
|
deiodinase, iodothyronine, type II |
| chr6_-_76072719 | 2.41 |
ENST00000370020.1
|
FILIP1
|
filamin A interacting protein 1 |
| chr11_+_12399071 | 2.39 |
ENST00000539723.1
ENST00000550549.1 |
PARVA
|
parvin, alpha |
| chr2_-_166930131 | 2.38 |
ENST00000303395.4
ENST00000409050.1 ENST00000423058.2 ENST00000375405.3 |
SCN1A
|
sodium channel, voltage-gated, type I, alpha subunit |
| chr18_-_64271363 | 2.36 |
ENST00000262150.2
|
CDH19
|
cadherin 19, type 2 |
| chr1_+_43613566 | 2.35 |
ENST00000409396.1
|
FAM183A
|
family with sequence similarity 183, member A |
| chr6_-_49712072 | 2.35 |
ENST00000423399.2
|
CRISP3
|
cysteine-rich secretory protein 3 |
| chr6_-_52859046 | 2.34 |
ENST00000457564.1
ENST00000541324.1 ENST00000370960.1 |
GSTA4
|
glutathione S-transferase alpha 4 |
| chr8_+_70404996 | 2.33 |
ENST00000402687.4
ENST00000419716.3 |
SULF1
|
sulfatase 1 |
| chr2_+_232135245 | 2.28 |
ENST00000446447.1
|
ARMC9
|
armadillo repeat containing 9 |
| chr6_-_49712091 | 2.28 |
ENST00000371159.4
|
CRISP3
|
cysteine-rich secretory protein 3 |
| chr5_+_140552218 | 2.26 |
ENST00000231137.3
|
PCDHB7
|
protocadherin beta 7 |
| chr5_+_140593509 | 2.25 |
ENST00000341948.4
|
PCDHB13
|
protocadherin beta 13 |
| chr12_-_15038779 | 2.23 |
ENST00000228938.5
ENST00000539261.1 |
MGP
|
matrix Gla protein |
| chr1_+_87012922 | 2.23 |
ENST00000263723.5
|
CLCA4
|
chloride channel accessory 4 |
| chr3_+_16216137 | 2.22 |
ENST00000339732.5
|
GALNT15
|
UDP-N-acetyl-alpha-D-galactosamine:polypeptide N-acetylgalactosaminyltransferase 15 |
| chr8_-_101117847 | 2.21 |
ENST00000523287.1
ENST00000519092.1 |
RGS22
|
regulator of G-protein signaling 22 |
| chr1_+_43613612 | 2.21 |
ENST00000335282.4
|
FAM183A
|
family with sequence similarity 183, member A |
| chr12_+_26348429 | 2.20 |
ENST00000242729.2
|
SSPN
|
sarcospan |
| chr4_-_46911248 | 2.18 |
ENST00000355591.3
ENST00000505102.1 |
COX7B2
|
cytochrome c oxidase subunit VIIb2 |
| chr12_-_7596735 | 2.17 |
ENST00000416109.2
ENST00000396630.1 ENST00000313599.3 |
CD163L1
|
CD163 molecule-like 1 |
| chr4_-_138453606 | 2.16 |
ENST00000412923.2
ENST00000344876.4 ENST00000507846.1 ENST00000510305.1 |
PCDH18
|
protocadherin 18 |
| chr9_-_28670283 | 2.14 |
ENST00000379992.2
|
LINGO2
|
leucine rich repeat and Ig domain containing 2 |
| chr4_-_16675930 | 2.09 |
ENST00000503178.2
|
LDB2
|
LIM domain binding 2 |
| chr17_+_12569306 | 2.08 |
ENST00000425538.1
|
MYOCD
|
myocardin |
| chr22_-_40289759 | 2.04 |
ENST00000325157.6
|
ENTHD1
|
ENTH domain containing 1 |
| chr11_-_128894053 | 2.00 |
ENST00000392657.3
|
ARHGAP32
|
Rho GTPase activating protein 32 |
| chr11_+_101918153 | 2.00 |
ENST00000434758.2
ENST00000526781.1 ENST00000534360.1 |
C11orf70
|
chromosome 11 open reading frame 70 |
| chr17_-_57158523 | 1.95 |
ENST00000581468.1
|
TRIM37
|
tripartite motif containing 37 |
| chr5_+_125798031 | 1.95 |
ENST00000502348.1
|
GRAMD3
|
GRAM domain containing 3 |
| chrX_-_73061339 | 1.95 |
ENST00000602863.1
|
XIST
|
X inactive specific transcript (non-protein coding) |
| chr15_+_84115868 | 1.92 |
ENST00000427482.2
|
SH3GL3
|
SH3-domain GRB2-like 3 |
| chr1_+_15668240 | 1.92 |
ENST00000444385.1
|
FHAD1
|
forkhead-associated (FHA) phosphopeptide binding domain 1 |
| chr1_-_160924589 | 1.91 |
ENST00000368029.3
|
ITLN2
|
intelectin 2 |
| chr3_-_20053741 | 1.88 |
ENST00000389050.4
|
PP2D1
|
protein phosphatase 2C-like domain containing 1 |
| chr4_-_122854612 | 1.87 |
ENST00000264811.5
|
TRPC3
|
transient receptor potential cation channel, subfamily C, member 3 |
| chr3_-_160823158 | 1.85 |
ENST00000392779.2
ENST00000392780.1 ENST00000494173.1 |
B3GALNT1
|
beta-1,3-N-acetylgalactosaminyltransferase 1 (globoside blood group) |
| chr11_-_26593649 | 1.85 |
ENST00000455601.2
|
MUC15
|
mucin 15, cell surface associated |
| chr3_+_132843652 | 1.84 |
ENST00000508711.1
|
TMEM108
|
transmembrane protein 108 |
| chr19_-_36001113 | 1.83 |
ENST00000434389.1
|
DMKN
|
dermokine |
| chr12_-_71148413 | 1.83 |
ENST00000440835.2
ENST00000549308.1 ENST00000550661.1 |
PTPRR
|
protein tyrosine phosphatase, receptor type, R |
| chr1_+_112938803 | 1.81 |
ENST00000271277.6
|
CTTNBP2NL
|
CTTNBP2 N-terminal like |
| chr12_-_86650154 | 1.78 |
ENST00000552435.2
|
MGAT4C
|
mannosyl (alpha-1,3-)-glycoprotein beta-1,4-N-acetylglucosaminyltransferase, isozyme C (putative) |
| chr9_+_95997205 | 1.73 |
ENST00000411624.1
|
WNK2
|
WNK lysine deficient protein kinase 2 |
| chr3_-_160823040 | 1.73 |
ENST00000484127.1
ENST00000492353.1 ENST00000473142.1 ENST00000468268.1 ENST00000460353.1 ENST00000320474.4 ENST00000392781.2 |
B3GALNT1
|
beta-1,3-N-acetylgalactosaminyltransferase 1 (globoside blood group) |
| chr14_-_54425475 | 1.73 |
ENST00000559642.1
|
BMP4
|
bone morphogenetic protein 4 |
| chr8_-_124741451 | 1.70 |
ENST00000520519.1
|
ANXA13
|
annexin A13 |
| chr8_+_133909919 | 1.69 |
ENST00000518505.1
|
TG
|
thyroglobulin |
| chr10_+_18549645 | 1.68 |
ENST00000396576.2
|
CACNB2
|
calcium channel, voltage-dependent, beta 2 subunit |
| chr12_+_26348246 | 1.68 |
ENST00000422622.2
|
SSPN
|
sarcospan |
| chr5_+_119867159 | 1.68 |
ENST00000505123.1
|
PRR16
|
proline rich 16 |
| chr5_+_173472607 | 1.67 |
ENST00000303177.3
ENST00000519867.1 |
NSG2
|
Neuron-specific protein family member 2 |
| chr11_-_107729504 | 1.66 |
ENST00000265836.7
|
SLC35F2
|
solute carrier family 35, member F2 |
| chr3_-_145940126 | 1.66 |
ENST00000498625.1
|
PLSCR4
|
phospholipid scramblase 4 |
| chr6_-_110501200 | 1.65 |
ENST00000392586.1
ENST00000419252.1 ENST00000392589.1 ENST00000392588.1 ENST00000359451.2 |
WASF1
|
WAS protein family, member 1 |
| chr1_-_91813006 | 1.64 |
ENST00000430465.1
|
HFM1
|
HFM1, ATP-dependent DNA helicase homolog (S. cerevisiae) |
| chr12_-_86650045 | 1.64 |
ENST00000604798.1
|
MGAT4C
|
mannosyl (alpha-1,3-)-glycoprotein beta-1,4-N-acetylglucosaminyltransferase, isozyme C (putative) |
| chr12_-_71148357 | 1.63 |
ENST00000378778.1
|
PTPRR
|
protein tyrosine phosphatase, receptor type, R |
| chr4_-_186570679 | 1.62 |
ENST00000451974.1
|
SORBS2
|
sorbin and SH3 domain containing 2 |
| chr19_-_22193706 | 1.62 |
ENST00000597040.1
|
ZNF208
|
zinc finger protein 208 |
| chr4_-_138453559 | 1.62 |
ENST00000511115.1
|
PCDH18
|
protocadherin 18 |
| chr11_-_107729287 | 1.61 |
ENST00000375682.4
|
SLC35F2
|
solute carrier family 35, member F2 |
| chrX_-_13835147 | 1.60 |
ENST00000493677.1
ENST00000355135.2 |
GPM6B
|
glycoprotein M6B |
| chr1_+_8378140 | 1.59 |
ENST00000377479.2
|
SLC45A1
|
solute carrier family 45, member 1 |
| chr4_+_9446156 | 1.58 |
ENST00000334879.1
|
DEFB131
|
defensin, beta 131 |
| chr18_-_59274139 | 1.57 |
ENST00000586949.1
|
RP11-879F14.2
|
RP11-879F14.2 |
| chr18_+_21269404 | 1.56 |
ENST00000313654.9
|
LAMA3
|
laminin, alpha 3 |
| chr11_-_107729887 | 1.55 |
ENST00000525815.1
|
SLC35F2
|
solute carrier family 35, member F2 |
| chr1_+_81771806 | 1.54 |
ENST00000370721.1
ENST00000370727.1 ENST00000370725.1 ENST00000370723.1 ENST00000370728.1 ENST00000370730.1 |
LPHN2
|
latrophilin 2 |
| chr4_-_159956333 | 1.53 |
ENST00000434826.2
|
C4orf45
|
chromosome 4 open reading frame 45 |
| chr21_-_27423339 | 1.53 |
ENST00000415997.1
|
APP
|
amyloid beta (A4) precursor protein |
| chr11_-_26593677 | 1.50 |
ENST00000527569.1
|
MUC15
|
mucin 15, cell surface associated |
| chr12_+_131438496 | 1.50 |
ENST00000543826.1
|
GPR133
|
G protein-coupled receptor 133 |
| chr18_+_616672 | 1.47 |
ENST00000338387.7
|
CLUL1
|
clusterin-like 1 (retinal) |
| chr6_-_110501126 | 1.46 |
ENST00000368938.1
|
WASF1
|
WAS protein family, member 1 |
| chr9_+_111624577 | 1.45 |
ENST00000333999.3
|
ACTL7A
|
actin-like 7A |
| chr2_+_242913327 | 1.45 |
ENST00000426962.1
|
AC093642.3
|
AC093642.3 |
| chr11_-_102651343 | 1.44 |
ENST00000279441.4
ENST00000539681.1 |
MMP10
|
matrix metallopeptidase 10 (stromelysin 2) |
| chrX_+_154113317 | 1.43 |
ENST00000354461.2
|
H2AFB1
|
H2A histone family, member B1 |
| chrX_-_142605301 | 1.42 |
ENST00000370503.2
|
SPANXN3
|
SPANX family, member N3 |
| chr17_+_12569472 | 1.41 |
ENST00000343344.4
|
MYOCD
|
myocardin |
| chr18_+_21269556 | 1.40 |
ENST00000399516.3
|
LAMA3
|
laminin, alpha 3 |
| chr21_-_30047095 | 1.40 |
ENST00000452028.1
ENST00000433310.2 |
AF131217.1
|
AF131217.1 |
| chrX_-_11308598 | 1.39 |
ENST00000380717.3
|
ARHGAP6
|
Rho GTPase activating protein 6 |
| chr2_+_210517895 | 1.36 |
ENST00000447185.1
|
MAP2
|
microtubule-associated protein 2 |
| chr11_+_4664650 | 1.35 |
ENST00000396952.5
|
OR51E1
|
olfactory receptor, family 51, subfamily E, member 1 |
| chr2_+_149974684 | 1.34 |
ENST00000450639.1
|
LYPD6B
|
LY6/PLAUR domain containing 6B |
| chr13_+_24144796 | 1.34 |
ENST00000403372.2
|
TNFRSF19
|
tumor necrosis factor receptor superfamily, member 19 |
| chr22_-_32767017 | 1.34 |
ENST00000400234.1
|
RFPL3S
|
RFPL3 antisense |
| chr12_-_22063787 | 1.32 |
ENST00000544039.1
|
ABCC9
|
ATP-binding cassette, sub-family C (CFTR/MRP), member 9 |
| chr5_-_125930929 | 1.30 |
ENST00000553117.1
ENST00000447989.2 ENST00000409134.3 |
ALDH7A1
|
aldehyde dehydrogenase 7 family, member A1 |
| chr11_+_122753391 | 1.28 |
ENST00000307257.6
ENST00000227349.2 |
C11orf63
|
chromosome 11 open reading frame 63 |
| chr1_-_205391178 | 1.28 |
ENST00000367153.4
ENST00000367151.2 ENST00000391936.2 ENST00000367149.3 |
LEMD1
|
LEM domain containing 1 |
| chr2_+_11696464 | 1.28 |
ENST00000234142.5
|
GREB1
|
growth regulation by estrogen in breast cancer 1 |
| chr12_-_85430024 | 1.28 |
ENST00000547836.1
ENST00000532498.2 |
TSPAN19
|
tetraspanin 19 |
| chr18_-_73967160 | 1.27 |
ENST00000579714.1
|
RP11-94B19.7
|
RP11-94B19.7 |
| chr7_-_84122033 | 1.26 |
ENST00000424555.1
|
SEMA3A
|
sema domain, immunoglobulin domain (Ig), short basic domain, secreted, (semaphorin) 3A |
| chr3_-_145940214 | 1.24 |
ENST00000481701.1
|
PLSCR4
|
phospholipid scramblase 4 |
| chr3_+_169539710 | 1.23 |
ENST00000340806.6
|
LRRIQ4
|
leucine-rich repeats and IQ motif containing 4 |
| chr14_-_25479811 | 1.21 |
ENST00000550887.1
|
STXBP6
|
syntaxin binding protein 6 (amisyn) |
| chr7_-_86688990 | 1.18 |
ENST00000450689.2
|
KIAA1324L
|
KIAA1324-like |
| chr4_-_46126093 | 1.18 |
ENST00000295452.4
|
GABRG1
|
gamma-aminobutyric acid (GABA) A receptor, gamma 1 |
| chr6_-_26235206 | 1.16 |
ENST00000244534.5
|
HIST1H1D
|
histone cluster 1, H1d |
| chr19_+_49199209 | 1.16 |
ENST00000522966.1
ENST00000425340.2 ENST00000391876.4 |
FUT2
|
fucosyltransferase 2 (secretor status included) |
| chr17_+_1674982 | 1.15 |
ENST00000572048.1
ENST00000573763.1 |
SERPINF1
|
serpin peptidase inhibitor, clade F (alpha-2 antiplasmin, pigment epithelium derived factor), member 1 |
| chr11_-_13517565 | 1.15 |
ENST00000282091.1
ENST00000529816.1 |
PTH
|
parathyroid hormone |
| chr4_+_3344141 | 1.15 |
ENST00000306648.7
|
RGS12
|
regulator of G-protein signaling 12 |
| chr14_+_20187174 | 1.15 |
ENST00000557414.1
|
OR4N2
|
olfactory receptor, family 4, subfamily N, member 2 |
| chr21_-_39705323 | 1.14 |
ENST00000436845.1
|
AP001422.3
|
AP001422.3 |
| chrX_+_153533275 | 1.14 |
ENST00000426989.1
ENST00000426203.1 ENST00000369912.2 |
TKTL1
|
transketolase-like 1 |
| chr22_+_31460091 | 1.14 |
ENST00000432777.1
ENST00000422839.1 |
SMTN
|
smoothelin |
| chr4_+_169552748 | 1.14 |
ENST00000504519.1
ENST00000512127.1 |
PALLD
|
palladin, cytoskeletal associated protein |
| chr5_+_81575281 | 1.13 |
ENST00000380167.4
|
ATP6AP1L
|
ATPase, H+ transporting, lysosomal accessory protein 1-like |
| chr16_-_67217844 | 1.12 |
ENST00000563902.1
ENST00000561621.1 ENST00000290881.7 |
KIAA0895L
|
KIAA0895-like |
| chr19_+_54466179 | 1.11 |
ENST00000270458.2
|
CACNG8
|
calcium channel, voltage-dependent, gamma subunit 8 |
| chr12_-_86650077 | 1.11 |
ENST00000552808.2
ENST00000547225.1 |
MGAT4C
|
mannosyl (alpha-1,3-)-glycoprotein beta-1,4-N-acetylglucosaminyltransferase, isozyme C (putative) |
| chr6_-_52859968 | 1.09 |
ENST00000370959.1
|
GSTA4
|
glutathione S-transferase alpha 4 |
| chr5_-_111754948 | 1.08 |
ENST00000261486.5
|
EPB41L4A
|
erythrocyte membrane protein band 4.1 like 4A |
| chr10_+_127585093 | 1.07 |
ENST00000368695.1
ENST00000368693.1 |
FANK1
|
fibronectin type III and ankyrin repeat domains 1 |
| chr11_-_4719072 | 1.06 |
ENST00000396950.3
ENST00000532598.1 |
OR51E2
|
olfactory receptor, family 51, subfamily E, member 2 |
| chr20_-_29978383 | 1.06 |
ENST00000339144.3
ENST00000376321.3 |
DEFB119
|
defensin, beta 119 |
| chrX_-_15288154 | 1.05 |
ENST00000380483.3
ENST00000380485.3 ENST00000380488.4 |
ASB9
|
ankyrin repeat and SOCS box containing 9 |
| chr4_+_96012614 | 1.04 |
ENST00000264568.4
|
BMPR1B
|
bone morphogenetic protein receptor, type IB |
| chrX_-_102941596 | 1.04 |
ENST00000441076.2
ENST00000422355.1 ENST00000442614.1 ENST00000422154.2 ENST00000451301.1 |
MORF4L2
|
mortality factor 4 like 2 |
| chrX_-_154689596 | 1.04 |
ENST00000369444.2
|
H2AFB3
|
H2A histone family, member B3 |
| chr3_-_46759314 | 1.03 |
ENST00000315170.7
|
PRSS50
|
protease, serine, 50 |
| chr2_-_190044480 | 1.03 |
ENST00000374866.3
|
COL5A2
|
collagen, type V, alpha 2 |
| chr9_-_34729457 | 1.03 |
ENST00000378788.3
|
FAM205A
|
family with sequence similarity 205, member A |
| chr21_-_22175341 | 1.02 |
ENST00000416768.1
ENST00000452561.1 ENST00000419299.1 ENST00000437238.1 |
LINC00320
|
long intergenic non-protein coding RNA 320 |
| chr12_-_11150474 | 1.01 |
ENST00000538986.1
|
TAS2R20
|
taste receptor, type 2, member 20 |
| chr1_+_197237352 | 1.01 |
ENST00000538660.1
ENST00000367400.3 ENST00000367399.2 |
CRB1
|
crumbs homolog 1 (Drosophila) |
| chrX_+_43515467 | 1.01 |
ENST00000338702.3
ENST00000542639.1 |
MAOA
|
monoamine oxidase A |
| chr20_-_56647116 | 1.01 |
ENST00000441277.2
ENST00000452842.1 |
RP13-379L11.1
|
RP13-379L11.1 |
| chr1_-_182921119 | 1.00 |
ENST00000423786.1
|
SHCBP1L
|
SHC SH2-domain binding protein 1-like |
| chr17_-_4938712 | 0.99 |
ENST00000254853.5
ENST00000424747.1 |
SLC52A1
|
solute carrier family 52 (riboflavin transporter), member 1 |
| chr8_+_36641842 | 0.98 |
ENST00000523973.1
ENST00000399881.3 |
KCNU1
|
potassium channel, subfamily U, member 1 |
| chr9_+_12693336 | 0.97 |
ENST00000381137.2
ENST00000388918.5 |
TYRP1
|
tyrosinase-related protein 1 |
| chr19_-_22193731 | 0.96 |
ENST00000601773.1
ENST00000397126.4 ENST00000601993.1 ENST00000599916.1 |
ZNF208
|
zinc finger protein 208 |
| chr15_-_75748143 | 0.96 |
ENST00000568431.1
ENST00000568309.1 ENST00000568190.1 ENST00000570115.1 ENST00000564778.1 |
SIN3A
|
SIN3 transcription regulator family member A |
| chr19_+_52873166 | 0.95 |
ENST00000424032.2
ENST00000600321.1 ENST00000344085.5 ENST00000597976.1 ENST00000422689.2 |
ZNF880
|
zinc finger protein 880 |
| chr21_-_39705286 | 0.95 |
ENST00000414189.1
|
AP001422.3
|
AP001422.3 |
| chr2_-_207078154 | 0.94 |
ENST00000447845.1
|
GPR1
|
G protein-coupled receptor 1 |
| chr1_+_76251912 | 0.93 |
ENST00000370826.3
|
RABGGTB
|
Rab geranylgeranyltransferase, beta subunit |
| chr9_-_21482312 | 0.93 |
ENST00000448696.3
|
IFNE
|
interferon, epsilon |
| chrX_-_52827141 | 0.92 |
ENST00000375511.3
|
SPANXN5
|
SPANX family, member N5 |
| chr1_-_152779104 | 0.91 |
ENST00000606576.1
ENST00000368768.1 |
LCE1C
|
late cornified envelope 1C |
| chr7_+_130126165 | 0.91 |
ENST00000427521.1
ENST00000416162.2 ENST00000378576.4 |
MEST
|
mesoderm specific transcript |
| chr2_+_44001172 | 0.91 |
ENST00000260605.8
ENST00000406852.3 ENST00000443170.3 ENST00000398823.2 ENST00000605786.1 |
DYNC2LI1
|
dynein, cytoplasmic 2, light intermediate chain 1 |
| chr6_-_47445214 | 0.90 |
ENST00000604014.1
|
RP11-385F7.1
|
RP11-385F7.1 |
| chr10_+_17270214 | 0.88 |
ENST00000544301.1
|
VIM
|
vimentin |
| chr17_-_38821373 | 0.88 |
ENST00000394052.3
|
KRT222
|
keratin 222 |
| chr4_+_147145709 | 0.88 |
ENST00000504313.1
|
RP11-6L6.2
|
Uncharacterized protein |
| chr8_+_39972170 | 0.87 |
ENST00000521257.1
|
RP11-359E19.2
|
RP11-359E19.2 |
| chr1_-_247921982 | 0.87 |
ENST00000408896.2
|
OR1C1
|
olfactory receptor, family 1, subfamily C, member 1 |
| chr7_+_128349106 | 0.86 |
ENST00000485070.1
|
FAM71F1
|
family with sequence similarity 71, member F1 |
| chr14_-_36990354 | 0.86 |
ENST00000518149.1
|
NKX2-1
|
NK2 homeobox 1 |
| chr4_-_70518941 | 0.85 |
ENST00000286604.4
ENST00000505512.1 ENST00000514019.1 |
UGT2A1
UGT2A1
|
UDP glucuronosyltransferase 2 family, polypeptide A1, complex locus UDP glucuronosyltransferase 2 family, polypeptide A1, complex locus |
| chr2_+_217732661 | 0.84 |
ENST00000451711.1
|
AC007557.3
|
AC007557.3 |
| chr12_-_106480587 | 0.84 |
ENST00000548902.1
|
NUAK1
|
NUAK family, SNF1-like kinase, 1 |
| chr2_-_207078086 | 0.84 |
ENST00000442134.1
|
GPR1
|
G protein-coupled receptor 1 |
| chr2_-_43266680 | 0.83 |
ENST00000425212.1
ENST00000422351.1 ENST00000449766.1 |
AC016735.2
|
AC016735.2 |
| chr3_+_38537960 | 0.82 |
ENST00000453767.1
|
EXOG
|
endo/exonuclease (5'-3'), endonuclease G-like |
| chr9_-_21351377 | 0.82 |
ENST00000380210.1
|
IFNA6
|
interferon, alpha 6 |
| chr10_+_695888 | 0.81 |
ENST00000441152.2
|
PRR26
|
proline rich 26 |
| chr22_+_43011247 | 0.81 |
ENST00000602478.1
|
RNU12
|
RNA, U12 small nuclear |
| chr4_-_139051839 | 0.81 |
ENST00000514600.1
ENST00000513895.1 ENST00000512536.1 |
LINC00616
|
long intergenic non-protein coding RNA 616 |
| chr1_-_228613026 | 0.80 |
ENST00000366696.1
|
HIST3H3
|
histone cluster 3, H3 |
| chr8_-_57233103 | 0.80 |
ENST00000303749.3
ENST00000522671.1 |
SDR16C5
|
short chain dehydrogenase/reductase family 16C, member 5 |
| chr16_-_75734044 | 0.80 |
ENST00000398113.2
ENST00000538623.1 |
AC025287.1
|
Uncharacterized protein |
| chr12_+_131438443 | 0.78 |
ENST00000261654.5
|
GPR133
|
G protein-coupled receptor 133 |
| chr7_+_12544025 | 0.78 |
ENST00000443874.1
ENST00000424453.1 |
AC005281.1
|
AC005281.1 |
| chr2_-_27712583 | 0.77 |
ENST00000260570.3
ENST00000359466.6 ENST00000416524.2 |
IFT172
|
intraflagellar transport 172 homolog (Chlamydomonas) |
| chr16_+_16434185 | 0.76 |
ENST00000524823.2
|
AC138969.4
|
Protein PKD1P1 |
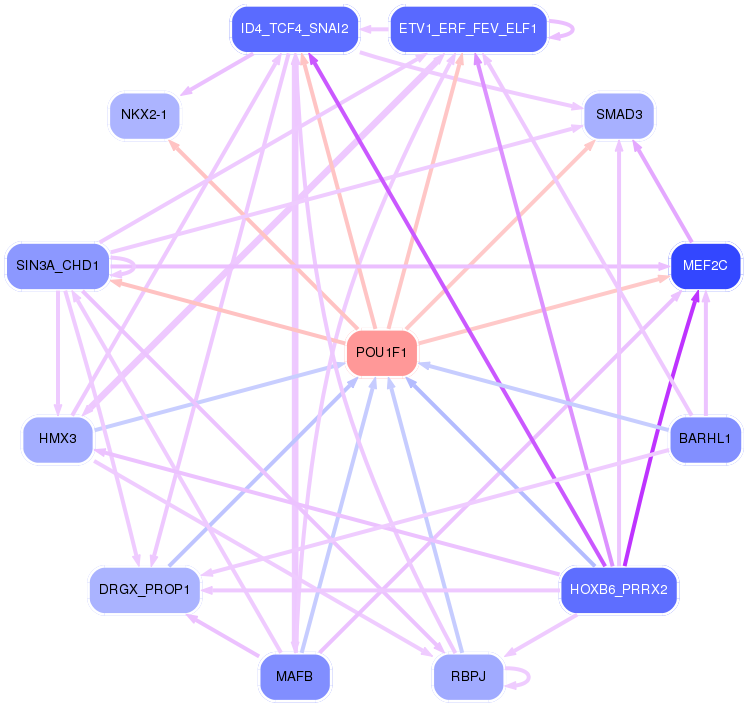
Network of associatons between targets according to the STRING database.

First level regulatory network of POU1F1
Gene Ontology Analysis
Gene overrepresentation in biological_process category:
| Log-likelihood per target | Total log-likelihood | Term | Description |
|---|---|---|---|
| 0.9 | 3.6 | GO:0060166 | olfactory pit development(GO:0060166) |
| 0.9 | 3.5 | GO:0001560 | regulation of cell growth by extracellular stimulus(GO:0001560) |
| 0.7 | 3.3 | GO:0034334 | adherens junction maintenance(GO:0034334) |
| 0.6 | 2.5 | GO:0018963 | insecticide metabolic process(GO:0017143) phthalate metabolic process(GO:0018963) |
| 0.5 | 1.5 | GO:0070563 | negative regulation of vitamin D receptor signaling pathway(GO:0070563) |
| 0.5 | 3.5 | GO:1903385 | regulation of homophilic cell adhesion(GO:1903385) |
| 0.5 | 1.9 | GO:0032053 | ciliary basal body organization(GO:0032053) |
| 0.4 | 1.2 | GO:1900158 | negative regulation of bone mineralization involved in bone maturation(GO:1900158) |
| 0.4 | 2.5 | GO:0060480 | lung goblet cell differentiation(GO:0060480) |
| 0.3 | 1.7 | GO:0061216 | apoptotic process involved in endocardial cushion morphogenesis(GO:0003277) intermediate mesoderm morphogenesis(GO:0048390) intermediate mesoderm formation(GO:0048391) intermediate mesodermal cell differentiation(GO:0048392) regulation of cardiac muscle fiber development(GO:0055018) positive regulation of cardiac muscle fiber development(GO:0055020) bud dilation involved in lung branching(GO:0060503) BMP signaling pathway involved in ureter morphogenesis(GO:0061149) renal system segmentation(GO:0061150) BMP signaling pathway involved in renal system segmentation(GO:0061151) pulmonary artery endothelial tube morphogenesis(GO:0061155) regulation of transcription from RNA polymerase II promoter involved in mesonephros development(GO:0061216) BMP signaling pathway involved in nephric duct formation(GO:0071893) negative regulation of branch elongation involved in ureteric bud branching(GO:0072096) negative regulation of branch elongation involved in ureteric bud branching by BMP signaling pathway(GO:0072097) anterior/posterior pattern specification involved in ureteric bud development(GO:0072099) specification of ureteric bud anterior/posterior symmetry(GO:0072100) specification of ureteric bud anterior/posterior symmetry by BMP signaling pathway(GO:0072101) ureter epithelial cell differentiation(GO:0072192) negative regulation of mesenchymal cell proliferation involved in ureter development(GO:0072200) positive regulation of cell proliferation involved in outflow tract morphogenesis(GO:1901964) cardiac jelly development(GO:1905072) regulation of metanephric S-shaped body morphogenesis(GO:2000004) negative regulation of metanephric S-shaped body morphogenesis(GO:2000005) regulation of metanephric comma-shaped body morphogenesis(GO:2000006) negative regulation of metanephric comma-shaped body morphogenesis(GO:2000007) |
| 0.3 | 1.0 | GO:1903225 | negative regulation of endodermal cell differentiation(GO:1903225) |
| 0.3 | 2.3 | GO:0014846 | esophagus smooth muscle contraction(GO:0014846) |
| 0.3 | 5.0 | GO:1990416 | cellular response to brain-derived neurotrophic factor stimulus(GO:1990416) |
| 0.3 | 2.0 | GO:0036353 | histone H2A-K119 monoubiquitination(GO:0036353) |
| 0.3 | 1.3 | GO:0019285 | glycine betaine biosynthetic process from choline(GO:0019285) glycine betaine metabolic process(GO:0031455) glycine betaine biosynthetic process(GO:0031456) |
| 0.3 | 1.0 | GO:0043438 | acetoacetic acid metabolic process(GO:0043438) |
| 0.3 | 1.3 | GO:1903045 | neural crest cell migration involved in sympathetic nervous system development(GO:1903045) |
| 0.3 | 1.5 | GO:0071874 | cellular response to norepinephrine stimulus(GO:0071874) |
| 0.3 | 1.4 | GO:1901675 | negative regulation of histone H3-K27 acetylation(GO:1901675) |
| 0.3 | 1.8 | GO:1903575 | cornified envelope assembly(GO:1903575) |
| 0.2 | 1.6 | GO:0001550 | ovarian cumulus expansion(GO:0001550) fused antrum stage(GO:0048165) |
| 0.2 | 1.9 | GO:0010615 | positive regulation of cardiac muscle adaptation(GO:0010615) positive regulation of cardiac muscle hypertrophy in response to stress(GO:1903244) |
| 0.2 | 6.9 | GO:0009312 | oligosaccharide biosynthetic process(GO:0009312) |
| 0.2 | 0.7 | GO:0035378 | carbon dioxide transmembrane transport(GO:0035378) |
| 0.2 | 1.7 | GO:1904879 | positive regulation of calcium ion transmembrane transport via high voltage-gated calcium channel(GO:1904879) |
| 0.2 | 1.0 | GO:0032218 | riboflavin transport(GO:0032218) |
| 0.2 | 0.6 | GO:0061300 | cerebellum vasculature development(GO:0061300) |
| 0.2 | 2.7 | GO:0060087 | relaxation of vascular smooth muscle(GO:0060087) |
| 0.2 | 4.0 | GO:0070986 | left/right axis specification(GO:0070986) |
| 0.2 | 1.2 | GO:0071279 | cellular response to cobalt ion(GO:0071279) |
| 0.2 | 2.2 | GO:0032364 | oxygen homeostasis(GO:0032364) |
| 0.2 | 2.4 | GO:0050966 | detection of mechanical stimulus involved in sensory perception of pain(GO:0050966) |
| 0.2 | 1.5 | GO:0018344 | protein geranylgeranylation(GO:0018344) |
| 0.2 | 1.1 | GO:1900133 | regulation of renin secretion into blood stream(GO:1900133) |
| 0.1 | 1.6 | GO:0051581 | negative regulation of neurotransmitter uptake(GO:0051581) regulation of serotonin uptake(GO:0051611) negative regulation of serotonin uptake(GO:0051612) |
| 0.1 | 2.4 | GO:0001514 | selenocysteine incorporation(GO:0001514) translational readthrough(GO:0006451) |
| 0.1 | 2.4 | GO:0071670 | smooth muscle cell chemotaxis(GO:0071670) |
| 0.1 | 0.5 | GO:0010430 | fatty acid omega-oxidation(GO:0010430) |
| 0.1 | 1.2 | GO:0098532 | histone H3-K27 trimethylation(GO:0098532) |
| 0.1 | 0.7 | GO:0043128 | regulation of 1-phosphatidylinositol 4-kinase activity(GO:0043126) positive regulation of 1-phosphatidylinositol 4-kinase activity(GO:0043128) |
| 0.1 | 1.7 | GO:0015705 | iodide transport(GO:0015705) |
| 0.1 | 2.9 | GO:0017121 | phospholipid scrambling(GO:0017121) |
| 0.1 | 0.7 | GO:0014038 | regulation of Schwann cell differentiation(GO:0014038) |
| 0.1 | 1.2 | GO:0042354 | fucose catabolic process(GO:0019317) L-fucose metabolic process(GO:0042354) L-fucose catabolic process(GO:0042355) |
| 0.1 | 2.5 | GO:0060391 | positive regulation of SMAD protein import into nucleus(GO:0060391) |
| 0.1 | 0.1 | GO:0098905 | regulation of bundle of His cell action potential(GO:0098905) |
| 0.1 | 0.4 | GO:0000706 | meiotic DNA double-strand break processing(GO:0000706) double-strand break repair involved in meiotic recombination(GO:1990918) |
| 0.1 | 0.7 | GO:0051012 | microtubule sliding(GO:0051012) |
| 0.1 | 0.3 | GO:1903947 | positive regulation of voltage-gated potassium channel activity involved in ventricular cardiac muscle cell action potential repolarization(GO:1903762) positive regulation of ventricular cardiac muscle cell action potential(GO:1903947) positive regulation of membrane repolarization during ventricular cardiac muscle cell action potential(GO:1905026) positive regulation of membrane repolarization during cardiac muscle cell action potential(GO:1905033) |
| 0.1 | 0.5 | GO:0035948 | positive regulation of gluconeogenesis by positive regulation of transcription from RNA polymerase II promoter(GO:0035948) |
| 0.1 | 1.7 | GO:0045793 | positive regulation of cell size(GO:0045793) |
| 0.1 | 3.0 | GO:0010804 | negative regulation of tumor necrosis factor-mediated signaling pathway(GO:0010804) |
| 0.1 | 0.5 | GO:2000301 | negative regulation of synaptic vesicle exocytosis(GO:2000301) |
| 0.1 | 3.4 | GO:1901687 | glutathione derivative metabolic process(GO:1901685) glutathione derivative biosynthetic process(GO:1901687) |
| 0.1 | 1.6 | GO:0000712 | resolution of meiotic recombination intermediates(GO:0000712) |
| 0.1 | 1.9 | GO:0033141 | positive regulation of peptidyl-serine phosphorylation of STAT protein(GO:0033141) |
| 0.1 | 0.7 | GO:1904694 | negative regulation of vascular smooth muscle contraction(GO:1904694) |
| 0.1 | 3.0 | GO:0031581 | hemidesmosome assembly(GO:0031581) |
| 0.1 | 2.2 | GO:0001502 | cartilage condensation(GO:0001502) |
| 0.1 | 0.6 | GO:0035610 | protein side chain deglutamylation(GO:0035610) |
| 0.1 | 0.4 | GO:0090362 | positive regulation of platelet-derived growth factor production(GO:0090362) |
| 0.1 | 1.2 | GO:0035542 | regulation of SNARE complex assembly(GO:0035542) |
| 0.1 | 0.7 | GO:2000253 | positive regulation of feeding behavior(GO:2000253) |
| 0.1 | 0.9 | GO:0021759 | globus pallidus development(GO:0021759) |
| 0.1 | 0.8 | GO:0035507 | regulation of myosin-light-chain-phosphatase activity(GO:0035507) |
| 0.1 | 4.1 | GO:0006654 | phosphatidic acid biosynthetic process(GO:0006654) |
| 0.1 | 0.3 | GO:0034343 | type III interferon production(GO:0034343) regulation of type III interferon production(GO:0034344) positive regulation of interferon-alpha biosynthetic process(GO:0045356) |
| 0.1 | 0.4 | GO:0003185 | primary heart field specification(GO:0003138) sinoatrial valve development(GO:0003172) sinoatrial valve morphogenesis(GO:0003185) |
| 0.1 | 0.9 | GO:0060020 | Bergmann glial cell differentiation(GO:0060020) |
| 0.1 | 1.0 | GO:0042420 | dopamine catabolic process(GO:0042420) |
| 0.1 | 0.6 | GO:0034144 | negative regulation of toll-like receptor 4 signaling pathway(GO:0034144) |
| 0.1 | 0.5 | GO:0046485 | ether lipid metabolic process(GO:0046485) |
| 0.1 | 12.6 | GO:0007156 | homophilic cell adhesion via plasma membrane adhesion molecules(GO:0007156) |
| 0.1 | 2.2 | GO:2000651 | positive regulation of sodium ion transmembrane transporter activity(GO:2000651) |
| 0.1 | 2.1 | GO:0010669 | epithelial structure maintenance(GO:0010669) |
| 0.1 | 0.5 | GO:0071896 | protein localization to adherens junction(GO:0071896) |
| 0.1 | 5.6 | GO:0032233 | positive regulation of actin filament bundle assembly(GO:0032233) |
| 0.1 | 0.3 | GO:1904468 | negative regulation of tumor necrosis factor secretion(GO:1904468) |
| 0.1 | 0.9 | GO:0035721 | intraciliary retrograde transport(GO:0035721) |
| 0.1 | 0.3 | GO:1901979 | regulation of inward rectifier potassium channel activity(GO:1901979) |
| 0.0 | 0.7 | GO:0032074 | negative regulation of nuclease activity(GO:0032074) |
| 0.0 | 0.4 | GO:0006772 | thiamine metabolic process(GO:0006772) |
| 0.0 | 0.7 | GO:0036066 | protein O-linked fucosylation(GO:0036066) |
| 0.0 | 1.1 | GO:0003334 | keratinocyte development(GO:0003334) |
| 0.0 | 1.1 | GO:2000311 | regulation of alpha-amino-3-hydroxy-5-methyl-4-isoxazole propionate selective glutamate receptor activity(GO:2000311) |
| 0.0 | 0.3 | GO:1904550 | chemotaxis to arachidonic acid(GO:0034670) response to arachidonic acid(GO:1904550) |
| 0.0 | 0.2 | GO:2000698 | glomerular parietal epithelial cell differentiation(GO:0072139) positive regulation of epithelial cell differentiation involved in kidney development(GO:2000698) positive regulation of nephron tubule epithelial cell differentiation(GO:2000768) |
| 0.0 | 1.7 | GO:0048268 | clathrin coat assembly(GO:0048268) |
| 0.0 | 0.3 | GO:0046604 | positive regulation of mitotic centrosome separation(GO:0046604) |
| 0.0 | 0.8 | GO:0042574 | retinal metabolic process(GO:0042574) |
| 0.0 | 0.7 | GO:0008212 | mineralocorticoid biosynthetic process(GO:0006705) mineralocorticoid metabolic process(GO:0008212) |
| 0.0 | 0.7 | GO:0018298 | protein-chromophore linkage(GO:0018298) |
| 0.0 | 1.6 | GO:0061049 | physiological muscle hypertrophy(GO:0003298) physiological cardiac muscle hypertrophy(GO:0003301) cell growth involved in cardiac muscle cell development(GO:0061049) |
| 0.0 | 0.7 | GO:0019371 | cyclooxygenase pathway(GO:0019371) |
| 0.0 | 1.4 | GO:0051895 | negative regulation of focal adhesion assembly(GO:0051895) |
| 0.0 | 0.8 | GO:0052695 | cellular glucuronidation(GO:0052695) |
| 0.0 | 2.9 | GO:0008347 | glial cell migration(GO:0008347) |
| 0.0 | 0.5 | GO:0043568 | positive regulation of insulin-like growth factor receptor signaling pathway(GO:0043568) |
| 0.0 | 0.3 | GO:0045629 | negative regulation of T-helper 2 cell differentiation(GO:0045629) |
| 0.0 | 0.2 | GO:0044026 | DNA hypermethylation(GO:0044026) |
| 0.0 | 0.1 | GO:2000397 | positive regulation of viral budding via host ESCRT complex(GO:1903774) regulation of ubiquitin-dependent endocytosis(GO:2000395) positive regulation of ubiquitin-dependent endocytosis(GO:2000397) |
| 0.0 | 0.5 | GO:0038007 | netrin-activated signaling pathway(GO:0038007) |
| 0.0 | 0.9 | GO:0048935 | peripheral nervous system neuron differentiation(GO:0048934) peripheral nervous system neuron development(GO:0048935) |
| 0.0 | 1.0 | GO:0043968 | histone H2A acetylation(GO:0043968) |
| 0.0 | 0.9 | GO:0089711 | L-glutamate transmembrane transport(GO:0089711) |
| 0.0 | 4.6 | GO:1902476 | chloride transmembrane transport(GO:1902476) |
| 0.0 | 1.4 | GO:0099601 | regulation of neurotransmitter receptor activity(GO:0099601) |
| 0.0 | 0.7 | GO:0051642 | centrosome localization(GO:0051642) |
| 0.0 | 2.8 | GO:0016266 | O-glycan processing(GO:0016266) |
| 0.0 | 0.4 | GO:0031987 | locomotion involved in locomotory behavior(GO:0031987) |
| 0.0 | 0.3 | GO:0046689 | response to mercury ion(GO:0046689) |
| 0.0 | 1.1 | GO:0015991 | ATP hydrolysis coupled proton transport(GO:0015991) |
| 0.0 | 2.1 | GO:0051965 | positive regulation of synapse assembly(GO:0051965) |
| 0.0 | 1.3 | GO:0010107 | potassium ion import(GO:0010107) |
| 0.0 | 0.8 | GO:0051290 | protein heterotetramerization(GO:0051290) |
| 0.0 | 0.4 | GO:0002260 | lymphocyte homeostasis(GO:0002260) |
| 0.0 | 0.3 | GO:0046602 | regulation of mitotic centrosome separation(GO:0046602) |
| 0.0 | 5.9 | GO:0050911 | detection of chemical stimulus involved in sensory perception of smell(GO:0050911) |
| 0.0 | 1.8 | GO:0032410 | negative regulation of transporter activity(GO:0032410) |
| 0.0 | 1.0 | GO:0042462 | eye photoreceptor cell development(GO:0042462) |
| 0.0 | 0.3 | GO:0030259 | lipid glycosylation(GO:0030259) |
| 0.0 | 0.4 | GO:0097503 | sialylation(GO:0097503) |
| 0.0 | 1.3 | GO:0035036 | sperm-egg recognition(GO:0035036) |
| 0.0 | 1.5 | GO:0018149 | peptide cross-linking(GO:0018149) |
| 0.0 | 0.7 | GO:0001580 | detection of chemical stimulus involved in sensory perception of bitter taste(GO:0001580) |
| 0.0 | 0.2 | GO:0000160 | phosphorelay signal transduction system(GO:0000160) |
| 0.0 | 0.3 | GO:0016973 | poly(A)+ mRNA export from nucleus(GO:0016973) |
| 0.0 | 0.1 | GO:0016576 | histone dephosphorylation(GO:0016576) |
| 0.0 | 1.7 | GO:0007218 | neuropeptide signaling pathway(GO:0007218) |
| 0.0 | 0.4 | GO:0099517 | anterograde synaptic vesicle transport(GO:0048490) synaptic vesicle cytoskeletal transport(GO:0099514) synaptic vesicle transport along microtubule(GO:0099517) |
| 0.0 | 2.4 | GO:0007586 | digestion(GO:0007586) |
| 0.0 | 0.2 | GO:1902572 | negative regulation of serine-type endopeptidase activity(GO:1900004) negative regulation of serine-type peptidase activity(GO:1902572) |
| 0.0 | 1.4 | GO:0030574 | collagen catabolic process(GO:0030574) multicellular organism catabolic process(GO:0044243) |
| 0.0 | 1.4 | GO:0021954 | central nervous system neuron development(GO:0021954) |
| 0.0 | 0.6 | GO:0090162 | establishment of epithelial cell polarity(GO:0090162) |
| 0.0 | 6.1 | GO:0006936 | muscle contraction(GO:0006936) |
| 0.0 | 1.2 | GO:0006342 | chromatin silencing(GO:0006342) |
| 0.0 | 3.5 | GO:0043413 | protein glycosylation(GO:0006486) macromolecule glycosylation(GO:0043413) |
| 0.0 | 0.1 | GO:0010172 | embryonic body morphogenesis(GO:0010172) |
Gene overrepresentation in cellular_component category:
| Log-likelihood per target | Total log-likelihood | Term | Description |
|---|---|---|---|
| 0.3 | 1.0 | GO:0005588 | collagen type V trimer(GO:0005588) |
| 0.3 | 1.5 | GO:0005968 | Rab-protein geranylgeranyltransferase complex(GO:0005968) |
| 0.3 | 3.0 | GO:0005610 | laminin-5 complex(GO:0005610) |
| 0.3 | 0.8 | GO:0097598 | sperm cytoplasmic droplet(GO:0097598) |
| 0.2 | 0.6 | GO:0042720 | mitochondrial inner membrane peptidase complex(GO:0042720) |
| 0.2 | 2.7 | GO:0030478 | actin cap(GO:0030478) |
| 0.2 | 3.1 | GO:0031209 | SCAR complex(GO:0031209) |
| 0.2 | 1.3 | GO:0008282 | ATP-sensitive potassium channel complex(GO:0008282) |
| 0.2 | 2.6 | GO:0000788 | nuclear nucleosome(GO:0000788) |
| 0.2 | 1.5 | GO:1990812 | growth cone filopodium(GO:1990812) |
| 0.1 | 0.7 | GO:0097125 | cyclin B1-CDK1 complex(GO:0097125) |
| 0.1 | 0.4 | GO:0043159 | cytoskeletal calyx(GO:0033150) acrosomal matrix(GO:0043159) |
| 0.1 | 1.4 | GO:0097442 | CA3 pyramidal cell dendrite(GO:0097442) |
| 0.1 | 2.0 | GO:1990454 | L-type voltage-gated calcium channel complex(GO:1990454) |
| 0.1 | 1.5 | GO:0030061 | mitochondrial crista(GO:0030061) |
| 0.1 | 2.2 | GO:0045277 | respiratory chain complex IV(GO:0045277) |
| 0.1 | 0.4 | GO:0097233 | lamellar body membrane(GO:0097232) alveolar lamellar body membrane(GO:0097233) |
| 0.1 | 1.5 | GO:0001673 | male germ cell nucleus(GO:0001673) |
| 0.1 | 1.4 | GO:1990712 | HFE-transferrin receptor complex(GO:1990712) |
| 0.1 | 2.4 | GO:0001518 | voltage-gated sodium channel complex(GO:0001518) |
| 0.1 | 4.4 | GO:0016010 | dystrophin-associated glycoprotein complex(GO:0016010) glycoprotein complex(GO:0090665) |
| 0.1 | 8.9 | GO:1904724 | tertiary granule lumen(GO:1904724) |
| 0.1 | 1.0 | GO:0072687 | meiotic spindle(GO:0072687) |
| 0.1 | 0.2 | GO:0000806 | Y chromosome(GO:0000806) |
| 0.1 | 0.3 | GO:0097635 | extrinsic component of autophagosome membrane(GO:0097635) |
| 0.1 | 3.4 | GO:0005640 | nuclear outer membrane(GO:0005640) |
| 0.1 | 0.7 | GO:0030868 | smooth endoplasmic reticulum membrane(GO:0030868) smooth endoplasmic reticulum part(GO:0097425) |
| 0.1 | 1.1 | GO:0033180 | proton-transporting V-type ATPase, V1 domain(GO:0033180) |
| 0.1 | 2.5 | GO:0005685 | U1 snRNP(GO:0005685) |
| 0.1 | 0.6 | GO:0000836 | Hrd1p ubiquitin ligase complex(GO:0000836) |
| 0.1 | 1.2 | GO:0043203 | axon hillock(GO:0043203) |
| 0.1 | 1.0 | GO:0045009 | melanosome membrane(GO:0033162) chitosome(GO:0045009) |
| 0.1 | 1.7 | GO:0032585 | multivesicular body membrane(GO:0032585) |
| 0.0 | 0.5 | GO:0042567 | insulin-like growth factor ternary complex(GO:0042567) |
| 0.0 | 1.4 | GO:0016580 | Sin3 complex(GO:0016580) |
| 0.0 | 2.0 | GO:0035098 | ESC/E(Z) complex(GO:0035098) |
| 0.0 | 1.6 | GO:0005868 | cytoplasmic dynein complex(GO:0005868) |
| 0.0 | 0.4 | GO:0005955 | calcineurin complex(GO:0005955) |
| 0.0 | 0.8 | GO:0032982 | myosin filament(GO:0032982) |
| 0.0 | 9.6 | GO:0030018 | Z disc(GO:0030018) |
| 0.0 | 0.3 | GO:1990589 | ATF4-CREB1 transcription factor complex(GO:1990589) |
| 0.0 | 3.7 | GO:0005796 | Golgi lumen(GO:0005796) |
| 0.0 | 0.5 | GO:0097025 | MPP7-DLG1-LIN7 complex(GO:0097025) |
| 0.0 | 0.3 | GO:0036128 | CatSper complex(GO:0036128) |
| 0.0 | 1.2 | GO:0005719 | nuclear euchromatin(GO:0005719) |
| 0.0 | 1.0 | GO:0043189 | NuA4 histone acetyltransferase complex(GO:0035267) H4/H2A histone acetyltransferase complex(GO:0043189) H4 histone acetyltransferase complex(GO:1902562) |
| 0.0 | 1.6 | GO:1904115 | axon cytoplasm(GO:1904115) |
| 0.0 | 0.3 | GO:0071144 | SMAD2-SMAD3 protein complex(GO:0071144) |
| 0.0 | 1.1 | GO:0005891 | voltage-gated calcium channel complex(GO:0005891) |
| 0.0 | 3.9 | GO:0097014 | axoneme(GO:0005930) ciliary plasm(GO:0097014) |
| 0.0 | 14.4 | GO:0005578 | proteinaceous extracellular matrix(GO:0005578) |
| 0.0 | 2.5 | GO:0001750 | photoreceptor outer segment(GO:0001750) |
| 0.0 | 0.5 | GO:0030992 | intraciliary transport particle B(GO:0030992) |
| 0.0 | 0.1 | GO:1902912 | pyruvate kinase complex(GO:1902912) |
| 0.0 | 1.4 | GO:0001533 | cornified envelope(GO:0001533) |
| 0.0 | 0.6 | GO:0000145 | exocyst(GO:0000145) |
| 0.0 | 0.3 | GO:0000346 | transcription export complex(GO:0000346) |
| 0.0 | 6.1 | GO:0000790 | nuclear chromatin(GO:0000790) |
| 0.0 | 2.8 | GO:0001650 | fibrillar center(GO:0001650) |
| 0.0 | 0.7 | GO:0001772 | immunological synapse(GO:0001772) |
| 0.0 | 1.1 | GO:0043234 | protein complex(GO:0043234) |
| 0.0 | 0.1 | GO:0030905 | retromer, tubulation complex(GO:0030905) |
| 0.0 | 1.7 | GO:0008076 | voltage-gated potassium channel complex(GO:0008076) |
| 0.0 | 2.4 | GO:0031225 | anchored component of membrane(GO:0031225) |
Gene overrepresentation in molecular_function category:
| Log-likelihood per target | Total log-likelihood | Term | Description |
|---|---|---|---|
| 0.9 | 3.6 | GO:0047273 | galactosylgalactosylglucosylceramide beta-D-acetylgalactosaminyltransferase activity(GO:0047273) |
| 0.5 | 2.7 | GO:0004692 | cGMP-dependent protein kinase activity(GO:0004692) |
| 0.5 | 4.5 | GO:0008454 | alpha-1,3-mannosylglycoprotein 4-beta-N-acetylglucosaminyltransferase activity(GO:0008454) |
| 0.4 | 3.7 | GO:0001665 | alpha-N-acetylgalactosaminide alpha-2,6-sialyltransferase activity(GO:0001665) |
| 0.4 | 2.5 | GO:0035614 | snRNA stem-loop binding(GO:0035614) |
| 0.3 | 1.3 | GO:0008281 | sulfonylurea receptor activity(GO:0008281) |
| 0.3 | 1.6 | GO:0004666 | prostaglandin-endoperoxide synthase activity(GO:0004666) |
| 0.3 | 2.4 | GO:0004800 | thyroxine 5'-deiodinase activity(GO:0004800) |
| 0.3 | 1.1 | GO:0004802 | transketolase activity(GO:0004802) |
| 0.3 | 0.8 | GO:0016749 | 5-aminolevulinate synthase activity(GO:0003870) N-succinyltransferase activity(GO:0016749) |
| 0.3 | 1.5 | GO:0004663 | Rab geranylgeranyltransferase activity(GO:0004663) |
| 0.2 | 3.7 | GO:0070324 | thyroid hormone binding(GO:0070324) |
| 0.2 | 1.0 | GO:0016716 | oxidoreductase activity, acting on paired donors, with incorporation or reduction of molecular oxygen, another compound as one donor, and incorporation of one atom of oxygen(GO:0016716) |
| 0.2 | 2.3 | GO:0008449 | N-acetylglucosamine-6-sulfatase activity(GO:0008449) |
| 0.2 | 0.7 | GO:0035379 | carbon dioxide transmembrane transporter activity(GO:0035379) |
| 0.2 | 2.9 | GO:0017128 | phospholipid scramblase activity(GO:0017128) |
| 0.2 | 1.0 | GO:0032217 | riboflavin transporter activity(GO:0032217) |
| 0.2 | 1.7 | GO:0086056 | voltage-gated calcium channel activity involved in AV node cell action potential(GO:0086056) |
| 0.2 | 0.7 | GO:0004769 | steroid delta-isomerase activity(GO:0004769) |
| 0.2 | 0.5 | GO:0008160 | protein tyrosine phosphatase activator activity(GO:0008160) |
| 0.2 | 6.5 | GO:0051371 | muscle alpha-actinin binding(GO:0051371) |
| 0.2 | 2.1 | GO:0030274 | LIM domain binding(GO:0030274) |
| 0.1 | 1.6 | GO:0005025 | transforming growth factor beta receptor activity, type I(GO:0005025) |
| 0.1 | 4.9 | GO:0005229 | intracellular calcium activated chloride channel activity(GO:0005229) |
| 0.1 | 2.0 | GO:0099602 | acetylcholine receptor regulator activity(GO:0030548) neurotransmitter receptor regulator activity(GO:0099602) |
| 0.1 | 1.9 | GO:0005132 | type I interferon receptor binding(GO:0005132) |
| 0.1 | 4.3 | GO:0002162 | dystroglycan binding(GO:0002162) |
| 0.1 | 0.5 | GO:0004031 | aldehyde oxidase activity(GO:0004031) |
| 0.1 | 1.7 | GO:0032051 | clathrin light chain binding(GO:0032051) |
| 0.1 | 0.9 | GO:1990254 | keratin filament binding(GO:1990254) |
| 0.1 | 1.7 | GO:0070700 | BMP receptor binding(GO:0070700) |
| 0.1 | 1.0 | GO:0008131 | primary amine oxidase activity(GO:0008131) |
| 0.1 | 1.5 | GO:0051425 | PTB domain binding(GO:0051425) |
| 0.1 | 1.0 | GO:0060072 | large conductance calcium-activated potassium channel activity(GO:0060072) |
| 0.1 | 0.4 | GO:0003918 | DNA topoisomerase type II (ATP-hydrolyzing) activity(GO:0003918) DNA topoisomerase II activity(GO:0061505) |
| 0.1 | 0.7 | GO:0005502 | 11-cis retinal binding(GO:0005502) |
| 0.1 | 0.5 | GO:0052740 | 1-acyl-2-lysophosphatidylserine acylhydrolase activity(GO:0052740) |
| 0.1 | 1.9 | GO:0015279 | store-operated calcium channel activity(GO:0015279) |
| 0.1 | 2.7 | GO:0005523 | tropomyosin binding(GO:0005523) |
| 0.1 | 0.5 | GO:0098519 | nucleotide phosphatase activity, acting on free nucleotides(GO:0098519) |
| 0.1 | 2.5 | GO:0017127 | cholesterol transporter activity(GO:0017127) |
| 0.1 | 2.4 | GO:0005248 | voltage-gated sodium channel activity(GO:0005248) voltage-gated ion channel activity involved in regulation of postsynaptic membrane potential(GO:1905030) |
| 0.1 | 1.6 | GO:0045504 | dynein heavy chain binding(GO:0045504) |
| 0.1 | 1.2 | GO:0008417 | fucosyltransferase activity(GO:0008417) |
| 0.1 | 3.4 | GO:0004364 | glutathione transferase activity(GO:0004364) |
| 0.1 | 1.2 | GO:0005225 | volume-sensitive anion channel activity(GO:0005225) |
| 0.1 | 1.1 | GO:0001011 | transcription factor activity, sequence-specific DNA binding, RNA polymerase recruiting(GO:0001011) transcription factor activity, TFIIB-class binding(GO:0001087) |
| 0.1 | 1.3 | GO:0030215 | semaphorin receptor binding(GO:0030215) |
| 0.1 | 2.2 | GO:0004653 | polypeptide N-acetylgalactosaminyltransferase activity(GO:0004653) |
| 0.1 | 3.8 | GO:0070412 | R-SMAD binding(GO:0070412) |
| 0.0 | 2.9 | GO:0050699 | WW domain binding(GO:0050699) |
| 0.0 | 0.9 | GO:0005314 | high-affinity glutamate transmembrane transporter activity(GO:0005314) |
| 0.0 | 1.2 | GO:0017049 | GTP-Rho binding(GO:0017049) |
| 0.0 | 0.4 | GO:0033192 | calmodulin-dependent protein phosphatase activity(GO:0033192) |
| 0.0 | 1.3 | GO:0004029 | aldehyde dehydrogenase (NAD) activity(GO:0004029) |
| 0.0 | 0.9 | GO:0001161 | intronic transcription regulatory region sequence-specific DNA binding(GO:0001161) intronic transcription regulatory region DNA binding(GO:0044213) |
| 0.0 | 1.1 | GO:0042923 | neuropeptide binding(GO:0042923) |
| 0.0 | 1.8 | GO:0051721 | protein phosphatase 2A binding(GO:0051721) |
| 0.0 | 1.1 | GO:0046933 | proton-transporting ATP synthase activity, rotational mechanism(GO:0046933) |
| 0.0 | 1.2 | GO:0048018 | receptor agonist activity(GO:0048018) |
| 0.0 | 1.2 | GO:0050811 | GABA receptor binding(GO:0050811) |
| 0.0 | 1.4 | GO:0005001 | transmembrane receptor protein tyrosine phosphatase activity(GO:0005001) transmembrane receptor protein phosphatase activity(GO:0019198) |
| 0.0 | 1.5 | GO:0008093 | cytoskeletal adaptor activity(GO:0008093) |
| 0.0 | 0.3 | GO:1990763 | arrestin family protein binding(GO:1990763) |
| 0.0 | 1.0 | GO:0004298 | threonine-type endopeptidase activity(GO:0004298) threonine-type peptidase activity(GO:0070003) |
| 0.0 | 0.3 | GO:0005078 | MAP-kinase scaffold activity(GO:0005078) |
| 0.0 | 0.7 | GO:0033038 | bitter taste receptor activity(GO:0033038) |
| 0.0 | 0.6 | GO:1990459 | transferrin receptor binding(GO:1990459) |
| 0.0 | 1.3 | GO:0005035 | tumor necrosis factor-activated receptor activity(GO:0005031) death receptor activity(GO:0005035) |
| 0.0 | 0.7 | GO:0003906 | DNA-(apurinic or apyrimidinic site) lyase activity(GO:0003906) |
| 0.0 | 0.7 | GO:0008353 | RNA polymerase II carboxy-terminal domain kinase activity(GO:0008353) |
| 0.0 | 0.7 | GO:0035259 | glucocorticoid receptor binding(GO:0035259) |
| 0.0 | 7.0 | GO:0004984 | olfactory receptor activity(GO:0004984) |
| 0.0 | 0.4 | GO:0003680 | AT DNA binding(GO:0003680) |
| 0.0 | 0.6 | GO:1904264 | ubiquitin protein ligase activity involved in ERAD pathway(GO:1904264) |
| 0.0 | 3.4 | GO:0005201 | extracellular matrix structural constituent(GO:0005201) |
| 0.0 | 0.8 | GO:0008409 | 5'-3' exonuclease activity(GO:0008409) |
| 0.0 | 1.6 | GO:0001106 | RNA polymerase II transcription corepressor activity(GO:0001106) |
| 0.0 | 0.3 | GO:0019826 | oxygen sensor activity(GO:0019826) |
| 0.0 | 0.5 | GO:0008432 | JUN kinase binding(GO:0008432) |
| 0.0 | 1.1 | GO:0005245 | voltage-gated calcium channel activity(GO:0005245) |
| 0.0 | 0.3 | GO:0003831 | beta-N-acetylglucosaminylglycopeptide beta-1,4-galactosyltransferase activity(GO:0003831) |
| 0.0 | 1.1 | GO:0008307 | structural constituent of muscle(GO:0008307) |
| 0.0 | 2.4 | GO:0005544 | calcium-dependent phospholipid binding(GO:0005544) |
| 0.0 | 0.5 | GO:0031434 | mitogen-activated protein kinase kinase binding(GO:0031434) |
| 0.0 | 3.3 | GO:0004222 | metalloendopeptidase activity(GO:0004222) |
| 0.0 | 0.7 | GO:0015002 | cytochrome-c oxidase activity(GO:0004129) heme-copper terminal oxidase activity(GO:0015002) oxidoreductase activity, acting on a heme group of donors, oxygen as acceptor(GO:0016676) |
| 0.0 | 0.3 | GO:0050998 | nitric-oxide synthase binding(GO:0050998) |
| 0.0 | 0.2 | GO:0000155 | phosphorelay sensor kinase activity(GO:0000155) |
| 0.0 | 2.8 | GO:0005179 | hormone activity(GO:0005179) |
| 0.0 | 0.2 | GO:0008503 | benzodiazepine receptor activity(GO:0008503) |
| 0.0 | 0.7 | GO:0016805 | dipeptidase activity(GO:0016805) |
| 0.0 | 17.5 | GO:0005509 | calcium ion binding(GO:0005509) |
| 0.0 | 0.8 | GO:0015020 | glucuronosyltransferase activity(GO:0015020) |
| 0.0 | 1.6 | GO:0004004 | ATP-dependent RNA helicase activity(GO:0004004) |
| 0.0 | 0.8 | GO:0031492 | nucleosomal DNA binding(GO:0031492) |
| 0.0 | 1.2 | GO:0031490 | chromatin DNA binding(GO:0031490) |
| 0.0 | 0.4 | GO:0008139 | nuclear localization sequence binding(GO:0008139) |
| 0.0 | 0.3 | GO:0008574 | ATP-dependent microtubule motor activity, plus-end-directed(GO:0008574) |
| 0.0 | 1.7 | GO:0004722 | protein serine/threonine phosphatase activity(GO:0004722) |
| 0.0 | 0.1 | GO:0046790 | virion binding(GO:0046790) |
| 0.0 | 1.7 | GO:0004867 | serine-type endopeptidase inhibitor activity(GO:0004867) |
| 0.0 | 0.5 | GO:0016248 | ion channel inhibitor activity(GO:0008200) channel inhibitor activity(GO:0016248) |
Gene overrepresentation in curated gene sets: canonical pathways category:
| Log-likelihood per target | Total log-likelihood | Term | Description |
|---|---|---|---|
| 0.1 | 3.0 | PID INTEGRIN4 PATHWAY | Alpha6 beta4 integrin-ligand interactions |
| 0.0 | 3.1 | SIG REGULATION OF THE ACTIN CYTOSKELETON BY RHO GTPASES | Genes related to regulation of the actin cytoskeleton |
| 0.0 | 1.5 | PID PRL SIGNALING EVENTS PATHWAY | Signaling events mediated by PRL |
| 0.0 | 2.7 | PID BMP PATHWAY | BMP receptor signaling |
| 0.0 | 2.2 | PID FRA PATHWAY | Validated transcriptional targets of AP1 family members Fra1 and Fra2 |
| 0.0 | 0.8 | ST G ALPHA S PATHWAY | G alpha s Pathway |
| 0.0 | 2.4 | PID HEDGEHOG GLI PATHWAY | Hedgehog signaling events mediated by Gli proteins |
| 0.0 | 1.5 | PID GLYPICAN 1PATHWAY | Glypican 1 network |
| 0.0 | 2.4 | PID ILK PATHWAY | Integrin-linked kinase signaling |
| 0.0 | 1.9 | PID PI3K PLC TRK PATHWAY | Trk receptor signaling mediated by PI3K and PLC-gamma |
| 0.0 | 1.5 | PID KIT PATHWAY | Signaling events mediated by Stem cell factor receptor (c-Kit) |
| 0.0 | 1.4 | PID SYNDECAN 1 PATHWAY | Syndecan-1-mediated signaling events |
| 0.0 | 0.5 | PID EPHA2 FWD PATHWAY | EPHA2 forward signaling |
| 0.0 | 0.7 | PID RETINOIC ACID PATHWAY | Retinoic acid receptors-mediated signaling |
| 0.0 | 1.3 | PID CD8 TCR DOWNSTREAM PATHWAY | Downstream signaling in naïve CD8+ T cells |
| 0.0 | 1.0 | PID TXA2PATHWAY | Thromboxane A2 receptor signaling |
| 0.0 | 1.0 | PID INTEGRIN A4B1 PATHWAY | Alpha4 beta1 integrin signaling events |
| 0.0 | 1.7 | PID ERA GENOMIC PATHWAY | Validated nuclear estrogen receptor alpha network |
| 0.0 | 1.6 | PID RHOA REG PATHWAY | Regulation of RhoA activity |
| 0.0 | 2.5 | PID PDGFRB PATHWAY | PDGFR-beta signaling pathway |
| 0.0 | 1.1 | PID TRKR PATHWAY | Neurotrophic factor-mediated Trk receptor signaling |
| 0.0 | 0.9 | PID LKB1 PATHWAY | LKB1 signaling events |
| 0.0 | 0.8 | PID TGFBR PATHWAY | TGF-beta receptor signaling |
| 0.0 | 0.4 | PID MAPK TRK PATHWAY | Trk receptor signaling mediated by the MAPK pathway |
| 0.0 | 0.9 | PID AURORA B PATHWAY | Aurora B signaling |
| 0.0 | 0.2 | PID P38 MK2 PATHWAY | p38 signaling mediated by MAPKAP kinases |
Gene overrepresentation in curated gene sets: REACTOME pathways category:
| Log-likelihood per target | Total log-likelihood | Term | Description |
|---|---|---|---|
| 0.1 | 1.9 | REACTOME ELEVATION OF CYTOSOLIC CA2 LEVELS | Genes involved in Elevation of cytosolic Ca2+ levels |
| 0.1 | 3.1 | REACTOME ABCA TRANSPORTERS IN LIPID HOMEOSTASIS | Genes involved in ABCA transporters in lipid homeostasis |
| 0.1 | 3.7 | REACTOME TERMINATION OF O GLYCAN BIOSYNTHESIS | Genes involved in Termination of O-glycan biosynthesis |
| 0.1 | 4.2 | REACTOME BETA DEFENSINS | Genes involved in Beta defensins |
| 0.1 | 2.4 | REACTOME AMINE DERIVED HORMONES | Genes involved in Amine-derived hormones |
| 0.1 | 1.5 | REACTOME THE NLRP3 INFLAMMASOME | Genes involved in The NLRP3 inflammasome |
| 0.1 | 3.4 | REACTOME GLUTATHIONE CONJUGATION | Genes involved in Glutathione conjugation |
| 0.1 | 3.2 | REACTOME STEROID HORMONES | Genes involved in Steroid hormones |
| 0.1 | 0.9 | REACTOME GLUTAMATE NEUROTRANSMITTER RELEASE CYCLE | Genes involved in Glutamate Neurotransmitter Release Cycle |
| 0.1 | 2.4 | REACTOME CELL EXTRACELLULAR MATRIX INTERACTIONS | Genes involved in Cell-extracellular matrix interactions |
| 0.1 | 2.7 | REACTOME CGMP EFFECTS | Genes involved in cGMP effects |
| 0.1 | 1.3 | REACTOME SIGNALLING TO P38 VIA RIT AND RIN | Genes involved in Signalling to p38 via RIT and RIN |
| 0.1 | 0.7 | REACTOME OPSINS | Genes involved in Opsins |
| 0.0 | 1.3 | REACTOME SEMA3A PLEXIN REPULSION SIGNALING BY INHIBITING INTEGRIN ADHESION | Genes involved in SEMA3A-Plexin repulsion signaling by inhibiting Integrin adhesion |
| 0.0 | 1.0 | REACTOME NOREPINEPHRINE NEUROTRANSMITTER RELEASE CYCLE | Genes involved in Norepinephrine Neurotransmitter Release Cycle |
| 0.0 | 0.9 | REACTOME APOPTOSIS INDUCED DNA FRAGMENTATION | Genes involved in Apoptosis induced DNA fragmentation |
| 0.0 | 1.4 | REACTOME N GLYCAN ANTENNAE ELONGATION | Genes involved in N-Glycan antennae elongation |
| 0.0 | 2.7 | REACTOME SMOOTH MUSCLE CONTRACTION | Genes involved in Smooth Muscle Contraction |
| 0.0 | 2.7 | REACTOME NCAM1 INTERACTIONS | Genes involved in NCAM1 interactions |
| 0.0 | 1.4 | REACTOME DEGRADATION OF THE EXTRACELLULAR MATRIX | Genes involved in Degradation of the extracellular matrix |
| 0.0 | 0.8 | REACTOME METABOLISM OF PORPHYRINS | Genes involved in Metabolism of porphyrins |
| 0.0 | 0.4 | REACTOME ERKS ARE INACTIVATED | Genes involved in ERKs are inactivated |
| 0.0 | 1.4 | REACTOME SIGNALING BY BMP | Genes involved in Signaling by BMP |
| 0.0 | 0.8 | REACTOME GLUCURONIDATION | Genes involved in Glucuronidation |
| 0.0 | 0.5 | REACTOME ETHANOL OXIDATION | Genes involved in Ethanol oxidation |
| 0.0 | 0.9 | REACTOME REGULATION OF IFNA SIGNALING | Genes involved in Regulation of IFNA signaling |
| 0.0 | 0.5 | REACTOME ACYL CHAIN REMODELLING OF PS | Genes involved in Acyl chain remodelling of PS |
| 0.0 | 5.8 | REACTOME OLFACTORY SIGNALING PATHWAY | Genes involved in Olfactory Signaling Pathway |
| 0.0 | 1.4 | REACTOME MUSCLE CONTRACTION | Genes involved in Muscle contraction |
| 0.0 | 0.7 | REACTOME SYNTHESIS OF PA | Genes involved in Synthesis of PA |
| 0.0 | 1.3 | REACTOME INWARDLY RECTIFYING K CHANNELS | Genes involved in Inwardly rectifying K+ channels |
| 0.0 | 0.5 | REACTOME REGULATION OF INSULIN LIKE GROWTH FACTOR IGF ACTIVITY BY INSULIN LIKE GROWTH FACTOR BINDING PROTEINS IGFBPS | Genes involved in Regulation of Insulin-like Growth Factor (IGF) Activity by Insulin-like Growth Factor Binding Proteins (IGFBPs) |
| 0.0 | 3.0 | REACTOME CELL JUNCTION ORGANIZATION | Genes involved in Cell junction organization |
| 0.0 | 0.3 | REACTOME TRAFFICKING AND PROCESSING OF ENDOSOMAL TLR | Genes involved in Trafficking and processing of endosomal TLR |
| 0.0 | 1.6 | REACTOME MYOGENESIS | Genes involved in Myogenesis |
| 0.0 | 0.5 | REACTOME SYNTHESIS SECRETION AND DEACYLATION OF GHRELIN | Genes involved in Synthesis, Secretion, and Deacylation of Ghrelin |
| 0.0 | 1.0 | REACTOME PACKAGING OF TELOMERE ENDS | Genes involved in Packaging Of Telomere Ends |
| 0.0 | 0.8 | REACTOME NCAM SIGNALING FOR NEURITE OUT GROWTH | Genes involved in NCAM signaling for neurite out-growth |
| 0.0 | 0.7 | REACTOME AMINE COMPOUND SLC TRANSPORTERS | Genes involved in Amine compound SLC transporters |
| 0.0 | 1.1 | REACTOME TRAFFICKING OF AMPA RECEPTORS | Genes involved in Trafficking of AMPA receptors |
| 0.0 | 0.8 | REACTOME PHASE1 FUNCTIONALIZATION OF COMPOUNDS | Genes involved in Phase 1 - Functionalization of compounds |
| 0.0 | 0.3 | REACTOME SIGNALING BY NODAL | Genes involved in Signaling by NODAL |
| 0.0 | 0.7 | REACTOME VOLTAGE GATED POTASSIUM CHANNELS | Genes involved in Voltage gated Potassium channels |