Project
Illumina Body Map 2: averaged replicates
Navigation
Downloads
Results for ZNF410
Z-value: 0.51
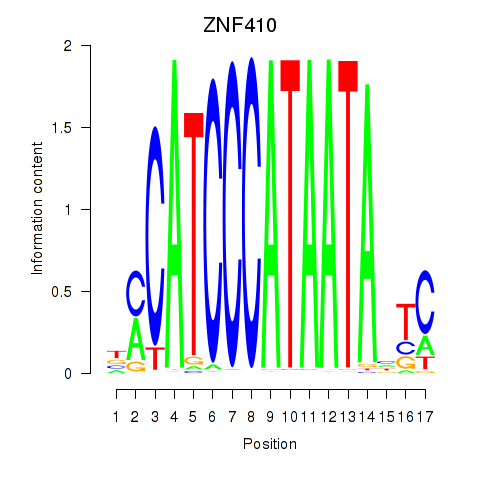
Motif logo
Transcription factors associated with ZNF410
| Gene Symbol | Gene ID | Gene Info |
|---|---|---|
|
ZNF410
|
ENSG00000119725.13 | zinc finger protein 410 |
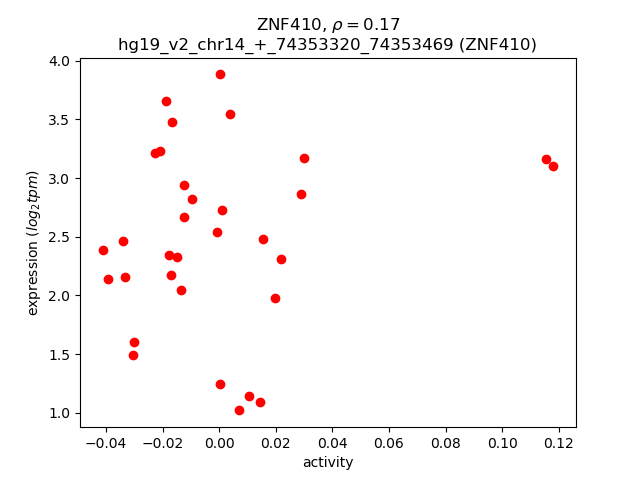
Activity-expression correlation:
| Gene | Promoter | Pearson corr. coef. | P-value | Plot |
|---|---|---|---|---|
| ZNF410 | hg19_v2_chr14_+_74353320_74353469 | 0.17 | 3.5e-01 | Click! |
Activity profile of ZNF410 motif
Sorted Z-values of ZNF410 motif
| Promoter | Log-likelihood | Transcript | Gene | Gene Info |
|---|---|---|---|---|
| chr12_-_6716569 | 2.41 |
ENST00000544040.1
ENST00000545942.1 |
CHD4
|
chromodomain helicase DNA binding protein 4 |
| chr12_-_6716534 | 1.54 |
ENST00000544484.1
ENST00000309577.6 ENST00000357008.2 |
CHD4
|
chromodomain helicase DNA binding protein 4 |
| chr7_+_2695726 | 1.07 |
ENST00000429448.1
|
TTYH3
|
tweety family member 3 |
| chr19_+_47840346 | 1.02 |
ENST00000600626.1
|
C5AR2
|
complement component 5a receptor 2 |
| chr12_+_122241928 | 1.00 |
ENST00000604567.1
ENST00000542440.1 |
SETD1B
|
SET domain containing 1B |
| chr1_+_206137237 | 0.75 |
ENST00000468509.1
ENST00000367129.2 |
FAM72A
|
family with sequence similarity 72, member A |
| chr17_-_77770830 | 0.51 |
ENST00000269385.4
|
CBX8
|
chromobox homolog 8 |
| chr22_-_39268308 | 0.50 |
ENST00000407418.3
|
CBX6
|
chromobox homolog 6 |
| chr11_-_57334732 | 0.45 |
ENST00000526659.1
ENST00000527022.1 |
UBE2L6
|
ubiquitin-conjugating enzyme E2L 6 |
| chr22_-_39268192 | 0.44 |
ENST00000216083.6
|
CBX6
|
chromobox homolog 6 |
| chr4_-_83933999 | 0.43 |
ENST00000510557.1
|
LIN54
|
lin-54 homolog (C. elegans) |
| chr18_-_59274139 | 0.37 |
ENST00000586949.1
|
RP11-879F14.2
|
RP11-879F14.2 |
| chr20_+_15177480 | 0.35 |
ENST00000402914.1
|
MACROD2
|
MACRO domain containing 2 |
| chr12_-_122241812 | 0.35 |
ENST00000538335.1
|
AC084018.1
|
AC084018.1 |
| chr4_-_83934078 | 0.31 |
ENST00000505397.1
|
LIN54
|
lin-54 homolog (C. elegans) |
| chr14_-_21852119 | 0.13 |
ENST00000555943.1
|
SUPT16H
|
suppressor of Ty 16 homolog (S. cerevisiae) |
| chr18_-_14970301 | 0.02 |
ENST00000580867.1
|
RP11-527H14.3
|
RP11-527H14.3 |
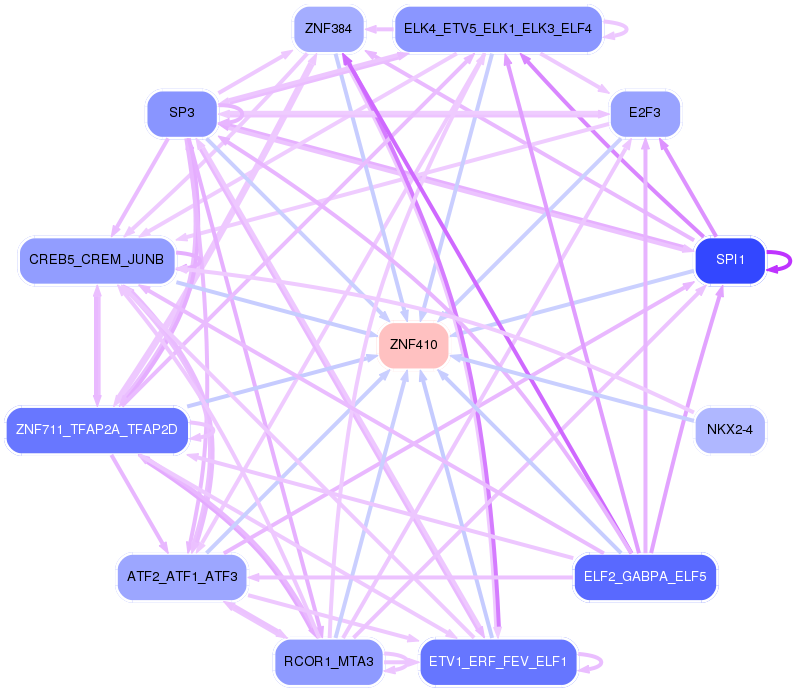
Network of associatons between targets according to the STRING database.

First level regulatory network of ZNF410
Gene Ontology Analysis
Gene overrepresentation in biological_process category:
| Log-likelihood per target | Total log-likelihood | Term | Description |
|---|---|---|---|
| 0.4 | 4.0 | GO:0072553 | terminal button organization(GO:0072553) |
| 0.3 | 1.0 | GO:0038178 | complement component C5a signaling pathway(GO:0038178) negative regulation of granulocyte chemotaxis(GO:0071623) negative regulation of neutrophil chemotaxis(GO:0090024) negative regulation of neutrophil migration(GO:1902623) |
| 0.0 | 0.3 | GO:0051725 | protein de-ADP-ribosylation(GO:0051725) |
| 0.0 | 0.5 | GO:0032020 | ISG15-protein conjugation(GO:0032020) |
| 0.0 | 0.5 | GO:0032967 | positive regulation of collagen biosynthetic process(GO:0032967) |
| 0.0 | 1.0 | GO:0051568 | histone H3-K4 methylation(GO:0051568) |
| 0.0 | 0.1 | GO:0032968 | positive regulation of transcription elongation from RNA polymerase II promoter(GO:0032968) |
Gene overrepresentation in cellular_component category:
| Log-likelihood per target | Total log-likelihood | Term | Description |
|---|---|---|---|
| 0.1 | 4.0 | GO:0016581 | NuRD complex(GO:0016581) CHD-type complex(GO:0090545) |
| 0.0 | 0.1 | GO:0035101 | FACT complex(GO:0035101) |
| 0.0 | 1.0 | GO:0048188 | Set1C/COMPASS complex(GO:0048188) |
| 0.0 | 0.5 | GO:0035102 | PRC1 complex(GO:0035102) |
| 0.0 | 1.0 | GO:0009925 | basal plasma membrane(GO:0009925) |
| 0.0 | 0.9 | GO:0031519 | PcG protein complex(GO:0031519) |
Gene overrepresentation in molecular_function category:
| Log-likelihood per target | Total log-likelihood | Term | Description |
|---|---|---|---|
| 0.3 | 1.0 | GO:0004878 | complement component C5a receptor activity(GO:0004878) |
| 0.1 | 4.0 | GO:0004003 | ATP-dependent DNA helicase activity(GO:0004003) |
| 0.0 | 0.5 | GO:0042296 | ISG15 transferase activity(GO:0042296) |
| 0.0 | 0.5 | GO:0097027 | ubiquitin-protein transferase activator activity(GO:0097027) |
| 0.0 | 1.0 | GO:0042800 | histone methyltransferase activity (H3-K4 specific)(GO:0042800) |
| 0.0 | 1.1 | GO:0005229 | intracellular calcium activated chloride channel activity(GO:0005229) |
Gene overrepresentation in curated gene sets: canonical pathways category:
| Log-likelihood per target | Total log-likelihood | Term | Description |
|---|---|---|---|
| 0.0 | 4.0 | PID HDAC CLASSI PATHWAY | Signaling events mediated by HDAC Class I |
Gene overrepresentation in curated gene sets: REACTOME pathways category:
| Log-likelihood per target | Total log-likelihood | Term | Description |
|---|---|---|---|
| 0.0 | 0.7 | REACTOME G0 AND EARLY G1 | Genes involved in G0 and Early G1 |