Project
Illumina Body Map 2
Navigation
Downloads
Results for AIRE
Z-value: 0.95
Motif logo
Transcription factors associated with AIRE
| Gene Symbol | Gene ID | Gene Info |
|---|---|---|
|
AIRE
|
ENSG00000160224.12 | autoimmune regulator |
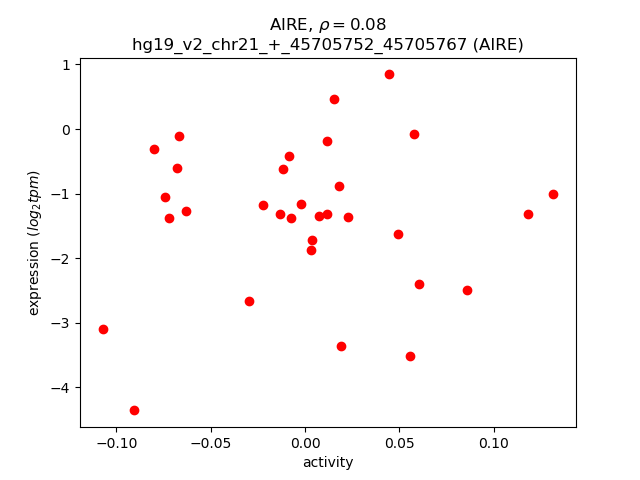
Activity-expression correlation:
| Gene | Promoter | Pearson corr. coef. | P-value | Plot |
|---|---|---|---|---|
| AIRE | hg19_v2_chr21_+_45705752_45705767 | 0.08 | 6.6e-01 | Click! |
Activity profile of AIRE motif
Sorted Z-values of AIRE motif
| Promoter | Log-likelihood | Transcript | Gene | Gene Info |
|---|---|---|---|---|
| chr14_-_106668095 | 3.71 |
ENST00000390606.2
|
IGHV3-20
|
immunoglobulin heavy variable 3-20 |
| chr14_-_106967788 | 3.66 |
ENST00000390622.2
|
IGHV1-46
|
immunoglobulin heavy variable 1-46 |
| chr7_-_142181009 | 3.18 |
ENST00000390368.2
|
TRBV6-5
|
T cell receptor beta variable 6-5 |
| chr9_-_104198042 | 3.17 |
ENST00000374855.4
|
ALDOB
|
aldolase B, fructose-bisphosphate |
| chr16_+_32077386 | 2.99 |
ENST00000354689.6
|
IGHV3OR16-9
|
immunoglobulin heavy variable 3/OR16-9 (non-functional) |
| chr17_-_38721711 | 2.56 |
ENST00000578085.1
ENST00000246657.2 |
CCR7
|
chemokine (C-C motif) receptor 7 |
| chr7_-_142162390 | 2.39 |
ENST00000390371.3
|
TRBV6-6
|
T cell receptor beta variable 6-6 |
| chr3_+_46412345 | 2.38 |
ENST00000292303.4
|
CCR5
|
chemokine (C-C motif) receptor 5 (gene/pseudogene) |
| chr15_-_22448819 | 2.31 |
ENST00000604066.1
|
IGHV1OR15-1
|
immunoglobulin heavy variable 1/OR15-1 (non-functional) |
| chr2_-_89568263 | 2.21 |
ENST00000473726.1
|
IGKV1-33
|
immunoglobulin kappa variable 1-33 |
| chr7_-_36764142 | 2.13 |
ENST00000258749.5
ENST00000535891.1 |
AOAH
|
acyloxyacyl hydrolase (neutrophil) |
| chr7_-_36764004 | 2.10 |
ENST00000431169.1
|
AOAH
|
acyloxyacyl hydrolase (neutrophil) |
| chr7_+_150498783 | 2.02 |
ENST00000475536.1
ENST00000468689.1 |
TMEM176A
|
transmembrane protein 176A |
| chr22_+_40322595 | 1.98 |
ENST00000420971.1
ENST00000544756.1 |
GRAP2
|
GRB2-related adaptor protein 2 |
| chr14_-_107283278 | 1.79 |
ENST00000390639.2
|
IGHV7-81
|
immunoglobulin heavy variable 7-81 (non-functional) |
| chr7_-_36764062 | 1.75 |
ENST00000435386.1
|
AOAH
|
acyloxyacyl hydrolase (neutrophil) |
| chr12_+_75874984 | 1.75 |
ENST00000550491.1
|
GLIPR1
|
GLI pathogenesis-related 1 |
| chr22_+_40322623 | 1.65 |
ENST00000399090.2
|
GRAP2
|
GRB2-related adaptor protein 2 |
| chr20_+_44637526 | 1.63 |
ENST00000372330.3
|
MMP9
|
matrix metallopeptidase 9 (gelatinase B, 92kDa gelatinase, 92kDa type IV collagenase) |
| chr6_-_149806105 | 1.59 |
ENST00000389942.5
ENST00000416573.2 ENST00000542614.1 ENST00000409806.3 |
ZC3H12D
|
zinc finger CCCH-type containing 12D |
| chr12_+_75874580 | 1.58 |
ENST00000456650.3
|
GLIPR1
|
GLI pathogenesis-related 1 |
| chr1_+_40840320 | 1.56 |
ENST00000372708.1
|
SMAP2
|
small ArfGAP2 |
| chr4_+_156775910 | 1.55 |
ENST00000506072.1
ENST00000507590.1 |
TDO2
|
tryptophan 2,3-dioxygenase |
| chr5_+_118691008 | 1.52 |
ENST00000504642.1
|
TNFAIP8
|
tumor necrosis factor, alpha-induced protein 8 |
| chr16_+_72088376 | 1.52 |
ENST00000570083.1
ENST00000355906.5 ENST00000398131.2 ENST00000569639.1 ENST00000564499.1 ENST00000357763.4 ENST00000562526.1 ENST00000565574.1 ENST00000568417.2 ENST00000356967.5 |
HP
HPR
|
haptoglobin haptoglobin-related protein |
| chrX_-_153191708 | 1.40 |
ENST00000393721.1
ENST00000370028.3 |
ARHGAP4
|
Rho GTPase activating protein 4 |
| chrX_-_153191674 | 1.36 |
ENST00000350060.5
ENST00000370016.1 |
ARHGAP4
|
Rho GTPase activating protein 4 |
| chr2_+_204732487 | 1.33 |
ENST00000302823.3
|
CTLA4
|
cytotoxic T-lymphocyte-associated protein 4 |
| chr1_+_207669573 | 1.28 |
ENST00000400960.2
ENST00000534202.1 |
CR1
|
complement component (3b/4b) receptor 1 (Knops blood group) |
| chr1_+_207669613 | 1.22 |
ENST00000367049.4
ENST00000529814.1 |
CR1
|
complement component (3b/4b) receptor 1 (Knops blood group) |
| chr2_-_225811747 | 1.19 |
ENST00000409592.3
|
DOCK10
|
dedicator of cytokinesis 10 |
| chr8_+_24241789 | 1.17 |
ENST00000256412.4
ENST00000538205.1 |
ADAMDEC1
|
ADAM-like, decysin 1 |
| chrX_-_153192211 | 1.14 |
ENST00000461052.1
ENST00000422091.1 |
ARHGAP4
|
Rho GTPase activating protein 4 |
| chr1_-_161208013 | 1.09 |
ENST00000515452.1
ENST00000367983.4 |
NR1I3
|
nuclear receptor subfamily 1, group I, member 3 |
| chr19_+_18208603 | 1.08 |
ENST00000262811.6
|
MAST3
|
microtubule associated serine/threonine kinase 3 |
| chr12_+_75874460 | 1.04 |
ENST00000266659.3
|
GLIPR1
|
GLI pathogenesis-related 1 |
| chr15_-_52043722 | 1.00 |
ENST00000454181.2
|
LYSMD2
|
LysM, putative peptidoglycan-binding, domain containing 2 |
| chr14_-_75330537 | 0.99 |
ENST00000556084.2
ENST00000556489.2 ENST00000445876.1 |
PROX2
|
prospero homeobox 2 |
| chr13_-_46756351 | 0.97 |
ENST00000323076.2
|
LCP1
|
lymphocyte cytosolic protein 1 (L-plastin) |
| chr19_+_45417812 | 0.94 |
ENST00000592535.1
|
APOC1
|
apolipoprotein C-I |
| chr12_+_7282795 | 0.94 |
ENST00000266546.6
|
CLSTN3
|
calsyntenin 3 |
| chr6_+_167525277 | 0.94 |
ENST00000400926.2
|
CCR6
|
chemokine (C-C motif) receptor 6 |
| chr1_+_47603109 | 0.92 |
ENST00000371890.3
ENST00000294337.3 ENST00000371891.3 |
CYP4A22
|
cytochrome P450, family 4, subfamily A, polypeptide 22 |
| chr7_-_55606346 | 0.90 |
ENST00000545390.1
|
VOPP1
|
vesicular, overexpressed in cancer, prosurvival protein 1 |
| chr5_+_118690466 | 0.88 |
ENST00000503646.1
|
TNFAIP8
|
tumor necrosis factor, alpha-induced protein 8 |
| chr15_-_52043631 | 0.85 |
ENST00000558126.1
|
LYSMD2
|
LysM, putative peptidoglycan-binding, domain containing 2 |
| chr19_-_23869999 | 0.82 |
ENST00000601935.1
ENST00000359788.4 ENST00000600313.1 ENST00000596211.1 ENST00000599168.1 |
ZNF675
|
zinc finger protein 675 |
| chr19_+_45417921 | 0.77 |
ENST00000252491.4
ENST00000592885.1 ENST00000589781.1 |
APOC1
|
apolipoprotein C-I |
| chr10_-_101841588 | 0.74 |
ENST00000370418.3
|
CPN1
|
carboxypeptidase N, polypeptide 1 |
| chr19_+_45418067 | 0.71 |
ENST00000589078.1
ENST00000586638.1 |
APOC1
|
apolipoprotein C-I |
| chr15_-_81202118 | 0.70 |
ENST00000560560.1
|
RP11-351M8.1
|
Uncharacterized protein |
| chr1_-_154600421 | 0.70 |
ENST00000368471.3
ENST00000292205.5 |
ADAR
|
adenosine deaminase, RNA-specific |
| chr1_-_161207986 | 0.69 |
ENST00000506209.1
ENST00000367980.2 |
NR1I3
|
nuclear receptor subfamily 1, group I, member 3 |
| chr16_+_11439286 | 0.69 |
ENST00000312499.5
ENST00000576027.1 |
RMI2
|
RecQ mediated genome instability 2 |
| chr8_+_124780672 | 0.69 |
ENST00000521166.1
ENST00000334705.7 |
FAM91A1
|
family with sequence similarity 91, member A1 |
| chr16_+_50914085 | 0.69 |
ENST00000576842.1
|
CTD-2034I21.2
|
CTD-2034I21.2 |
| chr7_-_86849836 | 0.68 |
ENST00000455575.1
|
TMEM243
|
transmembrane protein 243, mitochondrial |
| chr1_+_96208646 | 0.66 |
ENST00000603401.1
|
RP11-286B14.2
|
RP11-286B14.2 |
| chr11_+_94038759 | 0.64 |
ENST00000440961.2
ENST00000328458.4 |
FOLR4
|
folate receptor 4, delta (putative) |
| chr12_-_6579833 | 0.62 |
ENST00000396308.3
|
VAMP1
|
vesicle-associated membrane protein 1 (synaptobrevin 1) |
| chr21_+_39644305 | 0.61 |
ENST00000398930.1
|
KCNJ15
|
potassium inwardly-rectifying channel, subfamily J, member 15 |
| chr16_+_56672571 | 0.61 |
ENST00000290705.8
|
MT1A
|
metallothionein 1A |
| chr3_+_193965426 | 0.60 |
ENST00000455821.1
|
RP11-513G11.3
|
RP11-513G11.3 |
| chr2_+_62423242 | 0.60 |
ENST00000301998.4
|
B3GNT2
|
UDP-GlcNAc:betaGal beta-1,3-N-acetylglucosaminyltransferase 2 |
| chr12_-_6579808 | 0.60 |
ENST00000535180.1
ENST00000400911.3 |
VAMP1
|
vesicle-associated membrane protein 1 (synaptobrevin 1) |
| chr14_-_65409438 | 0.60 |
ENST00000557049.1
|
GPX2
|
glutathione peroxidase 2 (gastrointestinal) |
| chr21_+_39644172 | 0.59 |
ENST00000398932.1
|
KCNJ15
|
potassium inwardly-rectifying channel, subfamily J, member 15 |
| chr9_+_90112117 | 0.56 |
ENST00000358077.5
|
DAPK1
|
death-associated protein kinase 1 |
| chr19_-_48753104 | 0.56 |
ENST00000447740.2
|
CARD8
|
caspase recruitment domain family, member 8 |
| chr4_-_120222076 | 0.56 |
ENST00000504110.1
|
C4orf3
|
chromosome 4 open reading frame 3 |
| chr16_-_89119355 | 0.55 |
ENST00000537498.1
|
CTD-2555A7.2
|
CTD-2555A7.2 |
| chr15_+_52043813 | 0.55 |
ENST00000435126.2
|
TMOD2
|
tropomodulin 2 (neuronal) |
| chr10_-_106240032 | 0.54 |
ENST00000447860.1
|
RP11-127O4.3
|
RP11-127O4.3 |
| chr21_+_39644214 | 0.53 |
ENST00000438657.1
|
KCNJ15
|
potassium inwardly-rectifying channel, subfamily J, member 15 |
| chr18_-_56985776 | 0.53 |
ENST00000587244.1
|
CPLX4
|
complexin 4 |
| chr13_-_26795840 | 0.52 |
ENST00000381570.3
ENST00000399762.2 ENST00000346166.3 |
RNF6
|
ring finger protein (C3H2C3 type) 6 |
| chr19_-_48752812 | 0.51 |
ENST00000359009.4
|
CARD8
|
caspase recruitment domain family, member 8 |
| chr12_-_6580094 | 0.49 |
ENST00000361716.3
|
VAMP1
|
vesicle-associated membrane protein 1 (synaptobrevin 1) |
| chr4_+_69917078 | 0.49 |
ENST00000502942.1
|
UGT2B7
|
UDP glucuronosyltransferase 2 family, polypeptide B7 |
| chr12_+_20963647 | 0.49 |
ENST00000381545.3
|
SLCO1B3
|
solute carrier organic anion transporter family, member 1B3 |
| chr7_-_87936195 | 0.47 |
ENST00000414498.1
ENST00000301959.5 ENST00000380079.4 |
STEAP4
|
STEAP family member 4 |
| chrY_-_21738068 | 0.47 |
ENST00000599485.1
|
AC009977.1
|
Uncharacterized protein |
| chr19_-_23869970 | 0.46 |
ENST00000601010.1
|
ZNF675
|
zinc finger protein 675 |
| chr16_-_20566616 | 0.45 |
ENST00000569163.1
|
ACSM2B
|
acyl-CoA synthetase medium-chain family member 2B |
| chr15_+_85523671 | 0.45 |
ENST00000310298.4
ENST00000557957.1 |
PDE8A
|
phosphodiesterase 8A |
| chr10_+_90660832 | 0.44 |
ENST00000371924.1
|
STAMBPL1
|
STAM binding protein-like 1 |
| chr19_-_48753064 | 0.44 |
ENST00000520153.1
ENST00000357778.5 ENST00000520015.1 |
CARD8
|
caspase recruitment domain family, member 8 |
| chr20_-_33735070 | 0.43 |
ENST00000374491.3
ENST00000542871.1 ENST00000374492.3 |
EDEM2
|
ER degradation enhancer, mannosidase alpha-like 2 |
| chr19_-_48753028 | 0.42 |
ENST00000522431.1
|
CARD8
|
caspase recruitment domain family, member 8 |
| chr4_-_120243545 | 0.42 |
ENST00000274024.3
|
FABP2
|
fatty acid binding protein 2, intestinal |
| chr15_+_52043758 | 0.41 |
ENST00000249700.4
ENST00000539962.2 |
TMOD2
|
tropomodulin 2 (neuronal) |
| chr11_-_327537 | 0.40 |
ENST00000602735.1
|
IFITM3
|
interferon induced transmembrane protein 3 |
| chr6_-_127663543 | 0.40 |
ENST00000531582.1
|
ECHDC1
|
enoyl CoA hydratase domain containing 1 |
| chr3_-_49466686 | 0.39 |
ENST00000273598.3
ENST00000436744.2 |
NICN1
|
nicolin 1 |
| chr13_-_30160925 | 0.39 |
ENST00000450494.1
|
SLC7A1
|
solute carrier family 7 (cationic amino acid transporter, y+ system), member 1 |
| chr15_-_38519066 | 0.38 |
ENST00000561320.1
ENST00000561161.1 |
RP11-346D14.1
|
RP11-346D14.1 |
| chr11_+_6947647 | 0.38 |
ENST00000278319.5
|
ZNF215
|
zinc finger protein 215 |
| chr19_-_36304201 | 0.37 |
ENST00000301175.3
|
PRODH2
|
proline dehydrogenase (oxidase) 2 |
| chr10_-_46030841 | 0.37 |
ENST00000453424.2
|
MARCH8
|
membrane-associated ring finger (C3HC4) 8, E3 ubiquitin protein ligase |
| chr6_+_26104104 | 0.37 |
ENST00000377803.2
|
HIST1H4C
|
histone cluster 1, H4c |
| chr21_+_39644395 | 0.36 |
ENST00000398934.1
|
KCNJ15
|
potassium inwardly-rectifying channel, subfamily J, member 15 |
| chr5_-_36242119 | 0.35 |
ENST00000511088.1
ENST00000282512.3 ENST00000506945.1 |
NADK2
|
NAD kinase 2, mitochondrial |
| chr8_+_105352050 | 0.35 |
ENST00000297581.2
|
DCSTAMP
|
dendrocyte expressed seven transmembrane protein |
| chr19_-_21950362 | 0.34 |
ENST00000358296.6
|
ZNF100
|
zinc finger protein 100 |
| chr1_+_174670143 | 0.34 |
ENST00000367687.1
ENST00000347255.2 |
RABGAP1L
|
RAB GTPase activating protein 1-like |
| chr16_+_75182376 | 0.33 |
ENST00000570010.1
ENST00000568079.1 ENST00000464850.1 ENST00000332307.4 ENST00000393430.2 |
ZFP1
|
ZFP1 zinc finger protein |
| chr17_-_70989072 | 0.32 |
ENST00000582769.1
|
SLC39A11
|
solute carrier family 39, member 11 |
| chr17_-_295730 | 0.32 |
ENST00000329099.4
|
FAM101B
|
family with sequence similarity 101, member B |
| chr9_-_4666421 | 0.32 |
ENST00000381895.5
|
SPATA6L
|
spermatogenesis associated 6-like |
| chr8_-_16043780 | 0.32 |
ENST00000445506.2
|
MSR1
|
macrophage scavenger receptor 1 |
| chr16_+_50059125 | 0.31 |
ENST00000427478.2
|
CNEP1R1
|
CTD nuclear envelope phosphatase 1 regulatory subunit 1 |
| chr7_-_64467031 | 0.31 |
ENST00000394323.2
|
ERV3-1
|
endogenous retrovirus group 3, member 1 |
| chr5_+_72143988 | 0.31 |
ENST00000506351.2
|
TNPO1
|
transportin 1 |
| chr1_+_36038971 | 0.30 |
ENST00000373235.3
|
TFAP2E
|
transcription factor AP-2 epsilon (activating enhancer binding protein 2 epsilon) |
| chr1_+_79115503 | 0.30 |
ENST00000370747.4
ENST00000438486.1 ENST00000545124.1 |
IFI44
|
interferon-induced protein 44 |
| chr18_-_56985873 | 0.29 |
ENST00000299721.3
|
CPLX4
|
complexin 4 |
| chr8_+_86851932 | 0.29 |
ENST00000517368.1
|
CTA-392E5.1
|
CTA-392E5.1 |
| chr8_+_54764346 | 0.29 |
ENST00000297313.3
ENST00000344277.6 |
RGS20
|
regulator of G-protein signaling 20 |
| chr14_-_46185155 | 0.29 |
ENST00000555442.1
|
RP11-369C8.1
|
RP11-369C8.1 |
| chr4_-_47465666 | 0.29 |
ENST00000381571.4
|
COMMD8
|
COMM domain containing 8 |
| chr12_-_113772835 | 0.29 |
ENST00000552014.1
ENST00000548186.1 ENST00000202831.3 ENST00000549181.1 |
SLC8B1
|
solute carrier family 8 (sodium/lithium/calcium exchanger), member B1 |
| chr14_-_55658252 | 0.28 |
ENST00000395425.2
|
DLGAP5
|
discs, large (Drosophila) homolog-associated protein 5 |
| chr19_-_4902877 | 0.28 |
ENST00000381781.2
|
ARRDC5
|
arrestin domain containing 5 |
| chr16_+_50059182 | 0.28 |
ENST00000562576.1
|
CNEP1R1
|
CTD nuclear envelope phosphatase 1 regulatory subunit 1 |
| chrX_+_70503526 | 0.27 |
ENST00000413858.1
ENST00000450092.1 |
NONO
|
non-POU domain containing, octamer-binding |
| chr8_+_128748308 | 0.26 |
ENST00000377970.2
|
MYC
|
v-myc avian myelocytomatosis viral oncogene homolog |
| chr4_-_104119528 | 0.26 |
ENST00000380026.3
ENST00000503705.1 ENST00000265148.3 |
CENPE
|
centromere protein E, 312kDa |
| chrX_-_100307043 | 0.26 |
ENST00000372939.1
ENST00000372935.1 ENST00000372936.3 |
TRMT2B
|
tRNA methyltransferase 2 homolog B (S. cerevisiae) |
| chr2_-_104496621 | 0.25 |
ENST00000455716.1
|
AC013727.1
|
AC013727.1 |
| chr7_+_80255472 | 0.25 |
ENST00000428497.1
|
CD36
|
CD36 molecule (thrombospondin receptor) |
| chr7_-_64023441 | 0.25 |
ENST00000309683.6
|
ZNF680
|
zinc finger protein 680 |
| chr11_+_327171 | 0.24 |
ENST00000534483.1
ENST00000524824.1 ENST00000531076.1 |
RP11-326C3.12
|
RP11-326C3.12 |
| chr16_-_29499154 | 0.24 |
ENST00000354563.5
|
RP11-231C14.4
|
Uncharacterized protein |
| chr21_+_30502806 | 0.24 |
ENST00000399928.1
ENST00000399926.1 |
MAP3K7CL
|
MAP3K7 C-terminal like |
| chr14_-_24911971 | 0.23 |
ENST00000555365.1
ENST00000399395.3 |
SDR39U1
|
short chain dehydrogenase/reductase family 39U, member 1 |
| chr10_-_4720333 | 0.23 |
ENST00000430998.2
|
LINC00704
|
long intergenic non-protein coding RNA 704 |
| chr14_-_24912047 | 0.23 |
ENST00000553930.1
|
SDR39U1
|
short chain dehydrogenase/reductase family 39U, member 1 |
| chr11_-_85376121 | 0.23 |
ENST00000527447.1
|
CREBZF
|
CREB/ATF bZIP transcription factor |
| chr14_-_55658323 | 0.22 |
ENST00000554067.1
ENST00000247191.2 |
DLGAP5
|
discs, large (Drosophila) homolog-associated protein 5 |
| chr12_-_11287243 | 0.22 |
ENST00000539585.1
|
TAS2R30
|
taste receptor, type 2, member 30 |
| chr9_-_114361919 | 0.22 |
ENST00000422125.1
|
PTGR1
|
prostaglandin reductase 1 |
| chr6_-_32806506 | 0.22 |
ENST00000374897.2
ENST00000452392.2 |
TAP2
TAP2
|
transporter 2, ATP-binding cassette, sub-family B (MDR/TAP) Uncharacterized protein |
| chrX_-_100307076 | 0.22 |
ENST00000338687.7
ENST00000545398.1 ENST00000372931.5 |
TRMT2B
|
tRNA methyltransferase 2 homolog B (S. cerevisiae) |
| chr13_+_103459704 | 0.22 |
ENST00000602836.1
|
BIVM-ERCC5
|
BIVM-ERCC5 readthrough |
| chr9_-_113761720 | 0.21 |
ENST00000541779.1
ENST00000374430.2 |
LPAR1
|
lysophosphatidic acid receptor 1 |
| chr10_-_46030787 | 0.20 |
ENST00000395769.2
|
MARCH8
|
membrane-associated ring finger (C3HC4) 8, E3 ubiquitin protein ligase |
| chrM_+_5824 | 0.20 |
ENST00000361624.2
|
MT-CO1
|
mitochondrially encoded cytochrome c oxidase I |
| chr19_+_56280507 | 0.20 |
ENST00000341750.4
|
RFPL4AL1
|
ret finger protein-like 4A-like 1 |
| chr2_+_172864490 | 0.18 |
ENST00000315796.4
|
METAP1D
|
methionyl aminopeptidase type 1D (mitochondrial) |
| chrM_+_12331 | 0.18 |
ENST00000361567.2
|
MT-ND5
|
mitochondrially encoded NADH dehydrogenase 5 |
| chr17_+_3323862 | 0.17 |
ENST00000291231.1
|
OR3A3
|
olfactory receptor, family 3, subfamily A, member 3 |
| chr1_-_158300747 | 0.17 |
ENST00000451207.1
|
CD1B
|
CD1b molecule |
| chr19_-_10491234 | 0.17 |
ENST00000524462.1
ENST00000531836.1 ENST00000525621.1 |
TYK2
|
tyrosine kinase 2 |
| chr4_-_17513851 | 0.17 |
ENST00000281243.5
|
QDPR
|
quinoid dihydropteridine reductase |
| chr3_+_107318157 | 0.16 |
ENST00000406780.1
|
BBX
|
bobby sox homolog (Drosophila) |
| chr21_-_44495964 | 0.15 |
ENST00000398168.1
ENST00000398165.3 |
CBS
|
cystathionine-beta-synthase |
| chr3_-_121264848 | 0.15 |
ENST00000264233.5
|
POLQ
|
polymerase (DNA directed), theta |
| chr6_+_26538566 | 0.15 |
ENST00000377575.2
|
HMGN4
|
high mobility group nucleosomal binding domain 4 |
| chr9_+_71357171 | 0.15 |
ENST00000440050.1
|
PIP5K1B
|
phosphatidylinositol-4-phosphate 5-kinase, type I, beta |
| chr2_-_127977654 | 0.15 |
ENST00000409327.1
|
CYP27C1
|
cytochrome P450, family 27, subfamily C, polypeptide 1 |
| chr20_+_58203664 | 0.15 |
ENST00000541461.1
|
PHACTR3
|
phosphatase and actin regulator 3 |
| chr19_-_59084922 | 0.14 |
ENST00000215057.2
ENST00000599369.1 |
MZF1
|
myeloid zinc finger 1 |
| chr7_-_15601595 | 0.14 |
ENST00000342526.3
|
AGMO
|
alkylglycerol monooxygenase |
| chr16_-_28503327 | 0.13 |
ENST00000535392.1
ENST00000395653.4 |
CLN3
|
ceroid-lipofuscinosis, neuronal 3 |
| chr5_+_122181279 | 0.13 |
ENST00000395451.4
ENST00000506996.1 |
SNX24
|
sorting nexin 24 |
| chr19_+_11455900 | 0.12 |
ENST00000588790.1
|
CCDC159
|
coiled-coil domain containing 159 |
| chr1_-_52456352 | 0.12 |
ENST00000371655.3
|
RAB3B
|
RAB3B, member RAS oncogene family |
| chr12_+_20848486 | 0.12 |
ENST00000545102.1
|
SLCO1C1
|
solute carrier organic anion transporter family, member 1C1 |
| chr12_-_50677255 | 0.11 |
ENST00000551691.1
ENST00000394943.3 ENST00000341247.4 |
LIMA1
|
LIM domain and actin binding 1 |
| chr18_+_39766626 | 0.11 |
ENST00000593234.1
ENST00000585627.1 ENST00000591199.1 ENST00000586990.1 ENST00000593051.1 ENST00000593316.1 ENST00000591381.1 ENST00000585639.1 ENST00000589068.1 |
LINC00907
|
long intergenic non-protein coding RNA 907 |
| chr5_+_122181184 | 0.10 |
ENST00000513881.1
|
SNX24
|
sorting nexin 24 |
| chr2_+_38177575 | 0.10 |
ENST00000407257.1
ENST00000417700.2 ENST00000234195.3 ENST00000442857.1 |
RMDN2
|
regulator of microtubule dynamics 2 |
| chrM_+_7586 | 0.10 |
ENST00000361739.1
|
MT-CO2
|
mitochondrially encoded cytochrome c oxidase II |
| chr6_-_106773610 | 0.10 |
ENST00000369076.3
ENST00000369070.1 |
ATG5
|
autophagy related 5 |
| chr3_-_133648656 | 0.10 |
ENST00000408895.2
|
C3orf36
|
chromosome 3 open reading frame 36 |
| chr1_-_35497506 | 0.09 |
ENST00000317538.5
ENST00000373340.2 ENST00000357182.4 |
ZMYM6
|
zinc finger, MYM-type 6 |
| chr10_-_75682535 | 0.09 |
ENST00000409178.1
|
C10orf55
|
chromosome 10 open reading frame 55 |
| chr2_-_166060571 | 0.09 |
ENST00000360093.3
|
SCN3A
|
sodium channel, voltage-gated, type III, alpha subunit |
| chr7_-_149194843 | 0.09 |
ENST00000458143.2
ENST00000340622.3 |
ZNF746
|
zinc finger protein 746 |
| chr21_-_44495919 | 0.08 |
ENST00000398158.1
|
CBS
|
cystathionine-beta-synthase |
| chr16_+_57126428 | 0.08 |
ENST00000290776.8
|
CPNE2
|
copine II |
| chr9_-_70429731 | 0.08 |
ENST00000377413.1
|
FOXD4L4
|
forkhead box D4-like 4 |
| chrX_+_70503433 | 0.07 |
ENST00000276079.8
ENST00000373856.3 ENST00000373841.1 ENST00000420903.1 |
NONO
|
non-POU domain containing, octamer-binding |
| chr19_-_10491130 | 0.07 |
ENST00000530829.1
ENST00000529370.1 |
TYK2
|
tyrosine kinase 2 |
| chr16_+_57126482 | 0.07 |
ENST00000537605.1
ENST00000535318.2 |
CPNE2
|
copine II |
| chr4_+_1385340 | 0.06 |
ENST00000324803.4
|
CRIPAK
|
cysteine-rich PAK1 inhibitor |
| chr5_+_122181128 | 0.06 |
ENST00000261369.4
|
SNX24
|
sorting nexin 24 |
| chr15_+_27112948 | 0.06 |
ENST00000555060.1
|
GABRA5
|
gamma-aminobutyric acid (GABA) A receptor, alpha 5 |
| chr8_-_141728444 | 0.06 |
ENST00000521562.1
|
PTK2
|
protein tyrosine kinase 2 |
| chr3_-_176914191 | 0.06 |
ENST00000437738.1
ENST00000424913.1 ENST00000443315.1 |
TBL1XR1
|
transducin (beta)-like 1 X-linked receptor 1 |
| chr20_+_12989596 | 0.06 |
ENST00000434210.1
ENST00000399002.2 |
SPTLC3
|
serine palmitoyltransferase, long chain base subunit 3 |
| chr1_+_100810575 | 0.05 |
ENST00000542213.1
|
CDC14A
|
cell division cycle 14A |
| chr9_-_114361665 | 0.05 |
ENST00000309195.5
|
PTGR1
|
prostaglandin reductase 1 |
| chr2_-_166060552 | 0.05 |
ENST00000283254.7
ENST00000453007.1 |
SCN3A
|
sodium channel, voltage-gated, type III, alpha subunit |
| chr4_+_78829479 | 0.05 |
ENST00000504901.1
|
MRPL1
|
mitochondrial ribosomal protein L1 |
| chr7_+_76101379 | 0.05 |
ENST00000429179.1
|
DTX2
|
deltex homolog 2 (Drosophila) |
| chr12_-_11139511 | 0.05 |
ENST00000506868.1
|
TAS2R50
|
taste receptor, type 2, member 50 |
| chr17_-_39334460 | 0.04 |
ENST00000377726.2
|
KRTAP4-2
|
keratin associated protein 4-2 |
| chr7_+_116451100 | 0.03 |
ENST00000464223.1
ENST00000484325.1 |
CAPZA2
|
capping protein (actin filament) muscle Z-line, alpha 2 |
| chr15_-_83209210 | 0.03 |
ENST00000561157.1
ENST00000330244.6 |
RPS17L
|
ribosomal protein S17-like |
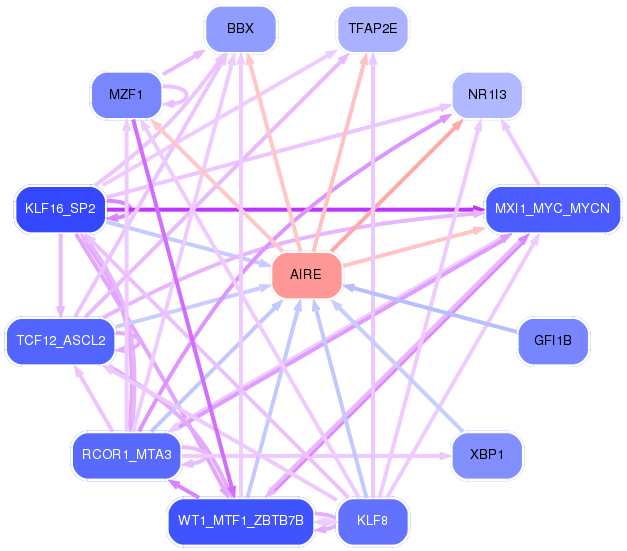
Network of associatons between targets according to the STRING database.

First level regulatory network of AIRE
Gene Ontology Analysis
Gene overrepresentation in biological_process category:
| Log-likelihood per target | Total log-likelihood | Term | Description |
|---|---|---|---|
| 0.9 | 2.6 | GO:2000523 | regulation of T cell costimulation(GO:2000523) positive regulation of T cell costimulation(GO:2000525) regulation of dendritic cell dendrite assembly(GO:2000547) |
| 0.8 | 2.5 | GO:0030451 | regulation of complement activation, alternative pathway(GO:0030451) negative regulation of complement activation, alternative pathway(GO:0045957) |
| 0.6 | 2.4 | GO:0010900 | negative regulation of phosphatidylcholine catabolic process(GO:0010900) |
| 0.5 | 3.2 | GO:0061624 | fructose catabolic process(GO:0006001) fructose catabolic process to hydroxyacetone phosphate and glyceraldehyde-3-phosphate(GO:0061624) |
| 0.5 | 1.5 | GO:2000296 | negative regulation of hydrogen peroxide catabolic process(GO:2000296) |
| 0.4 | 1.3 | GO:0045590 | negative regulation of regulatory T cell differentiation(GO:0045590) |
| 0.4 | 1.5 | GO:0019442 | tryptophan catabolic process to acetyl-CoA(GO:0019442) |
| 0.3 | 2.4 | GO:0019064 | fusion of virus membrane with host plasma membrane(GO:0019064) membrane fusion involved in viral entry into host cell(GO:0039663) multi-organism membrane fusion(GO:0044800) |
| 0.2 | 0.7 | GO:1900369 | negative regulation of RNA interference(GO:1900369) |
| 0.2 | 3.9 | GO:0010764 | negative regulation of fibroblast migration(GO:0010764) |
| 0.2 | 0.9 | GO:0060474 | positive regulation of sperm motility involved in capacitation(GO:0060474) |
| 0.2 | 0.3 | GO:0034238 | macrophage fusion(GO:0034238) regulation of macrophage fusion(GO:0034239) positive regulation of macrophage fusion(GO:0034241) |
| 0.2 | 1.0 | GO:0070309 | lens fiber cell morphogenesis(GO:0070309) |
| 0.2 | 1.6 | GO:0051549 | positive regulation of keratinocyte migration(GO:0051549) |
| 0.1 | 0.7 | GO:0030070 | insulin processing(GO:0030070) |
| 0.1 | 1.3 | GO:2000660 | negative regulation of interleukin-1-mediated signaling pathway(GO:2000660) |
| 0.1 | 2.0 | GO:2001199 | negative regulation of dendritic cell differentiation(GO:2001199) |
| 0.1 | 11.0 | GO:0006910 | phagocytosis, recognition(GO:0006910) |
| 0.1 | 0.5 | GO:0044314 | protein K27-linked ubiquitination(GO:0044314) |
| 0.1 | 0.9 | GO:0002933 | lipid hydroxylation(GO:0002933) |
| 0.1 | 0.6 | GO:0030311 | poly-N-acetyllactosamine biosynthetic process(GO:0030311) |
| 0.1 | 0.8 | GO:0007079 | mitotic chromosome movement towards spindle pole(GO:0007079) |
| 0.1 | 1.9 | GO:0050713 | negative regulation of interleukin-1 beta secretion(GO:0050713) |
| 0.1 | 1.0 | GO:0051694 | pointed-end actin filament capping(GO:0051694) |
| 0.1 | 0.4 | GO:0036512 | trimming of terminal mannose on B branch(GO:0036509) trimming of first mannose on A branch(GO:0036511) trimming of second mannose on A branch(GO:0036512) |
| 0.1 | 0.2 | GO:0002476 | antigen processing and presentation of endogenous peptide antigen via MHC class Ib(GO:0002476) |
| 0.1 | 1.6 | GO:0061158 | 3'-UTR-mediated mRNA destabilization(GO:0061158) |
| 0.1 | 0.9 | GO:1902474 | positive regulation of protein localization to synapse(GO:1902474) |
| 0.1 | 1.2 | GO:0002315 | marginal zone B cell differentiation(GO:0002315) |
| 0.1 | 0.3 | GO:0090095 | regulation of metanephric cap mesenchymal cell proliferation(GO:0090095) positive regulation of metanephric cap mesenchymal cell proliferation(GO:0090096) |
| 0.1 | 1.7 | GO:0035493 | SNARE complex assembly(GO:0035493) |
| 0.1 | 0.2 | GO:0006535 | cysteine biosynthetic process from serine(GO:0006535) |
| 0.1 | 0.5 | GO:0097461 | ferric iron import into cell(GO:0097461) ferric iron import across plasma membrane(GO:0098706) |
| 0.1 | 0.4 | GO:0010133 | proline catabolic process to glutamate(GO:0010133) |
| 0.1 | 5.9 | GO:0006958 | complement activation, classical pathway(GO:0006958) |
| 0.0 | 0.3 | GO:0097327 | response to antineoplastic agent(GO:0097327) |
| 0.0 | 0.4 | GO:0006741 | NADP biosynthetic process(GO:0006741) |
| 0.0 | 0.4 | GO:1903826 | arginine transmembrane transport(GO:1903826) |
| 0.0 | 0.2 | GO:1904566 | response to 1-oleoyl-sn-glycerol 3-phosphate(GO:1904565) cellular response to 1-oleoyl-sn-glycerol 3-phosphate(GO:1904566) |
| 0.0 | 0.3 | GO:1903377 | negative regulation of oxidative stress-induced neuron intrinsic apoptotic signaling pathway(GO:1903377) |
| 0.0 | 0.2 | GO:0051066 | dihydrobiopterin metabolic process(GO:0051066) |
| 0.0 | 1.0 | GO:0071803 | positive regulation of podosome assembly(GO:0071803) |
| 0.0 | 0.1 | GO:0035752 | lysosomal lumen pH elevation(GO:0035752) |
| 0.0 | 2.1 | GO:0010107 | potassium ion import(GO:0010107) |
| 0.0 | 0.6 | GO:0071447 | cellular response to hydroperoxide(GO:0071447) |
| 0.0 | 3.6 | GO:0031295 | T cell costimulation(GO:0031295) |
| 0.0 | 0.1 | GO:0018125 | peptidyl-cysteine methylation(GO:0018125) |
| 0.0 | 0.3 | GO:0010886 | positive regulation of cholesterol storage(GO:0010886) |
| 0.0 | 0.6 | GO:0010867 | positive regulation of triglyceride biosynthetic process(GO:0010867) |
| 0.0 | 0.3 | GO:0006610 | ribosomal protein import into nucleus(GO:0006610) |
| 0.0 | 0.1 | GO:0071277 | cellular response to calcium ion(GO:0071277) |
| 0.0 | 0.3 | GO:2001256 | regulation of store-operated calcium entry(GO:2001256) |
| 0.0 | 0.5 | GO:0052695 | cellular glucuronidation(GO:0052695) |
| 0.0 | 0.6 | GO:0071294 | cellular response to zinc ion(GO:0071294) |
| 0.0 | 0.1 | GO:0044034 | negative stranded viral RNA replication(GO:0039689) multi-organism biosynthetic process(GO:0044034) |
| 0.0 | 0.4 | GO:1903206 | negative regulation of hydrogen peroxide-induced cell death(GO:1903206) |
| 0.0 | 0.7 | GO:0000732 | strand displacement(GO:0000732) |
| 0.0 | 0.2 | GO:0048003 | antigen processing and presentation of lipid antigen via MHC class Ib(GO:0048003) antigen processing and presentation, exogenous lipid antigen via MHC class Ib(GO:0048007) |
| 0.0 | 0.1 | GO:0046485 | ether lipid metabolic process(GO:0046485) |
| 0.0 | 1.8 | GO:0030521 | androgen receptor signaling pathway(GO:0030521) |
| 0.0 | 0.4 | GO:0046597 | negative regulation of viral entry into host cell(GO:0046597) |
| 0.0 | 2.3 | GO:0043154 | negative regulation of cysteine-type endopeptidase activity involved in apoptotic process(GO:0043154) |
| 0.0 | 0.2 | GO:0018206 | peptidyl-methionine modification(GO:0018206) |
| 0.0 | 0.3 | GO:0006123 | mitochondrial electron transport, cytochrome c to oxygen(GO:0006123) |
| 0.0 | 0.6 | GO:0043252 | sodium-independent organic anion transport(GO:0043252) |
| 0.0 | 0.2 | GO:2000042 | negative regulation of double-strand break repair via homologous recombination(GO:2000042) |
Gene overrepresentation in cellular_component category:
| Log-likelihood per target | Total log-likelihood | Term | Description |
|---|---|---|---|
| 0.4 | 1.5 | GO:0031838 | haptoglobin-hemoglobin complex(GO:0031838) |
| 0.2 | 10.8 | GO:0042571 | immunoglobulin complex, circulating(GO:0042571) |
| 0.1 | 0.7 | GO:0044530 | supraspliceosomal complex(GO:0044530) |
| 0.1 | 1.9 | GO:0072559 | NLRP3 inflammasome complex(GO:0072559) |
| 0.1 | 0.6 | GO:0071595 | Nem1-Spo7 phosphatase complex(GO:0071595) |
| 0.1 | 2.4 | GO:0042627 | chylomicron(GO:0042627) |
| 0.1 | 3.2 | GO:0034451 | centriolar satellite(GO:0034451) |
| 0.1 | 0.9 | GO:0097524 | sperm plasma membrane(GO:0097524) |
| 0.1 | 0.3 | GO:0036338 | viral envelope(GO:0019031) viral membrane(GO:0036338) |
| 0.1 | 6.1 | GO:0035577 | azurophil granule membrane(GO:0035577) |
| 0.0 | 0.2 | GO:0042825 | TAP complex(GO:0042825) |
| 0.0 | 0.3 | GO:0042382 | paraspeckles(GO:0042382) |
| 0.0 | 1.0 | GO:0001891 | phagocytic cup(GO:0001891) |
| 0.0 | 2.5 | GO:0101003 | ficolin-1-rich granule membrane(GO:0101003) |
| 0.0 | 0.3 | GO:0030061 | mitochondrial crista(GO:0030061) |
| 0.0 | 0.5 | GO:0031616 | spindle pole centrosome(GO:0031616) |
| 0.0 | 1.3 | GO:0098636 | protein complex involved in cell adhesion(GO:0098636) |
| 0.0 | 0.3 | GO:0034362 | low-density lipoprotein particle(GO:0034362) |
| 0.0 | 0.3 | GO:0005751 | mitochondrial respiratory chain complex IV(GO:0005751) |
| 0.0 | 1.6 | GO:1904724 | tertiary granule lumen(GO:1904724) |
| 0.0 | 1.0 | GO:0005865 | striated muscle thin filament(GO:0005865) |
| 0.0 | 0.3 | GO:1990023 | mitotic spindle midzone(GO:1990023) |
| 0.0 | 5.0 | GO:0009897 | external side of plasma membrane(GO:0009897) |
| 0.0 | 3.3 | GO:0031234 | extrinsic component of cytoplasmic side of plasma membrane(GO:0031234) |
| 0.0 | 0.1 | GO:0034274 | Atg12-Atg5-Atg16 complex(GO:0034274) |
| 0.0 | 2.1 | GO:0072562 | blood microparticle(GO:0072562) |
Gene overrepresentation in molecular_function category:
| Log-likelihood per target | Total log-likelihood | Term | Description |
|---|---|---|---|
| 1.5 | 6.0 | GO:0050528 | acyloxyacyl hydrolase activity(GO:0050528) |
| 0.8 | 2.5 | GO:0001861 | complement component C4b receptor activity(GO:0001861) complement component C3b receptor activity(GO:0004877) |
| 0.3 | 5.9 | GO:0019957 | C-C chemokine binding(GO:0019957) |
| 0.3 | 1.9 | GO:0032089 | NACHT domain binding(GO:0032089) |
| 0.3 | 1.8 | GO:0004882 | androgen receptor activity(GO:0004882) |
| 0.3 | 3.2 | GO:0004332 | fructose-bisphosphate aldolase activity(GO:0004332) |
| 0.3 | 1.5 | GO:0004833 | tryptophan 2,3-dioxygenase activity(GO:0004833) |
| 0.3 | 1.5 | GO:0030492 | hemoglobin binding(GO:0030492) |
| 0.2 | 2.4 | GO:0060228 | phosphatidylcholine-sterol O-acyltransferase activator activity(GO:0060228) |
| 0.2 | 10.8 | GO:0034987 | immunoglobulin receptor binding(GO:0034987) |
| 0.1 | 0.7 | GO:0003726 | double-stranded RNA adenosine deaminase activity(GO:0003726) |
| 0.1 | 0.6 | GO:0008532 | N-acetyllactosaminide beta-1,3-N-acetylglucosaminyltransferase activity(GO:0008532) |
| 0.1 | 0.4 | GO:0004492 | methylmalonyl-CoA decarboxylase activity(GO:0004492) |
| 0.1 | 0.3 | GO:0032440 | 2-alkenal reductase [NAD(P)] activity(GO:0032440) |
| 0.1 | 0.4 | GO:0004657 | proline dehydrogenase activity(GO:0004657) |
| 0.1 | 2.1 | GO:0015467 | G-protein activated inward rectifier potassium channel activity(GO:0015467) |
| 0.1 | 0.9 | GO:0016713 | oxidoreductase activity, acting on paired donors, with incorporation or reduction of molecular oxygen, reduced iron-sulfur protein as one donor, and incorporation of one atom of oxygen(GO:0016713) |
| 0.1 | 0.5 | GO:0008823 | cupric reductase activity(GO:0008823) ferric-chelate reductase (NADPH) activity(GO:0052851) |
| 0.1 | 0.2 | GO:0070025 | cystathionine beta-synthase activity(GO:0004122) oxidoreductase activity, acting on other nitrogenous compounds as donors, cytochrome as acceptor(GO:0016662) nitrite reductase (NO-forming) activity(GO:0050421) carbon monoxide binding(GO:0070025) nitrite reductase activity(GO:0098809) |
| 0.1 | 0.2 | GO:0004155 | 6,7-dihydropteridine reductase activity(GO:0004155) |
| 0.1 | 0.5 | GO:0016300 | tRNA (uracil) methyltransferase activity(GO:0016300) |
| 0.0 | 7.5 | GO:0005070 | SH3/SH2 adaptor activity(GO:0005070) |
| 0.0 | 0.2 | GO:0015433 | peptide antigen-transporting ATPase activity(GO:0015433) |
| 0.0 | 2.4 | GO:0043027 | cysteine-type endopeptidase inhibitor activity involved in apoptotic process(GO:0043027) |
| 0.0 | 0.4 | GO:0015181 | arginine transmembrane transporter activity(GO:0015181) |
| 0.0 | 0.1 | GO:0052810 | 1-phosphatidylinositol-5-kinase activity(GO:0052810) |
| 0.0 | 0.5 | GO:0004321 | fatty-acyl-CoA synthase activity(GO:0004321) |
| 0.0 | 0.7 | GO:0004185 | serine-type carboxypeptidase activity(GO:0004185) |
| 0.0 | 0.1 | GO:0005503 | all-trans retinal binding(GO:0005503) |
| 0.0 | 0.2 | GO:0005131 | growth hormone receptor binding(GO:0005131) |
| 0.0 | 0.4 | GO:0004571 | mannosyl-oligosaccharide 1,2-alpha-mannosidase activity(GO:0004571) |
| 0.0 | 1.0 | GO:0005523 | tropomyosin binding(GO:0005523) |
| 0.0 | 6.0 | GO:0003823 | antigen binding(GO:0003823) |
| 0.0 | 0.3 | GO:0043515 | kinetochore binding(GO:0043515) |
| 0.0 | 1.4 | GO:0005484 | SNAP receptor activity(GO:0005484) |
| 0.0 | 0.4 | GO:0061578 | Lys63-specific deubiquitinase activity(GO:0061578) |
| 0.0 | 0.2 | GO:0070892 | lipoteichoic acid receptor activity(GO:0070892) |
| 0.0 | 0.6 | GO:0015125 | bile acid transmembrane transporter activity(GO:0015125) |
| 0.0 | 0.2 | GO:0035727 | lysophosphatidic acid binding(GO:0035727) |
| 0.0 | 0.6 | GO:0004602 | glutathione peroxidase activity(GO:0004602) |
| 0.0 | 0.1 | GO:0019776 | Atg8 ligase activity(GO:0019776) |
| 0.0 | 2.8 | GO:0004222 | metalloendopeptidase activity(GO:0004222) |
| 0.0 | 0.3 | GO:0010314 | phosphatidylinositol-5-phosphate binding(GO:0010314) |
| 0.0 | 0.3 | GO:0005432 | calcium:sodium antiporter activity(GO:0005432) |
| 0.0 | 0.3 | GO:0030169 | low-density lipoprotein particle binding(GO:0030169) |
| 0.0 | 0.4 | GO:0005504 | fatty acid binding(GO:0005504) |
| 0.0 | 0.3 | GO:0033038 | bitter taste receptor activity(GO:0033038) |
| 0.0 | 0.1 | GO:0016714 | oxidoreductase activity, acting on paired donors, with incorporation or reduction of molecular oxygen, reduced pteridine as one donor, and incorporation of one atom of oxygen(GO:0016714) |
| 0.0 | 0.6 | GO:0017075 | syntaxin-1 binding(GO:0017075) |
| 0.0 | 0.5 | GO:0001972 | retinoic acid binding(GO:0001972) |
Gene overrepresentation in curated gene sets: canonical pathways category:
| Log-likelihood per target | Total log-likelihood | Term | Description |
|---|---|---|---|
| 0.1 | 3.6 | PID TCR JNK PATHWAY | JNK signaling in the CD4+ TCR pathway |
| 0.0 | 3.9 | SIG CHEMOTAXIS | Genes related to chemotaxis |
| 0.0 | 3.2 | PID HNF3B PATHWAY | FOXA2 and FOXA3 transcription factor networks |
| 0.0 | 2.1 | PID INTEGRIN A9B1 PATHWAY | Alpha9 beta1 integrin signaling events |
| 0.0 | 1.5 | PID AVB3 OPN PATHWAY | Osteopontin-mediated events |
| 0.0 | 2.6 | PID IL12 2PATHWAY | IL12-mediated signaling events |
| 0.0 | 1.3 | ST T CELL SIGNAL TRANSDUCTION | T Cell Signal Transduction |
| 0.0 | 1.4 | PID REG GR PATHWAY | Glucocorticoid receptor regulatory network |
Gene overrepresentation in curated gene sets: REACTOME pathways category:
| Log-likelihood per target | Total log-likelihood | Term | Description |
|---|---|---|---|
| 0.4 | 2.4 | REACTOME BINDING AND ENTRY OF HIV VIRION | Genes involved in Binding and entry of HIV virion |
| 0.1 | 2.5 | REACTOME REGULATION OF COMPLEMENT CASCADE | Genes involved in Regulation of Complement cascade |
| 0.1 | 1.5 | REACTOME TRYPTOPHAN CATABOLISM | Genes involved in Tryptophan catabolism |
| 0.1 | 3.6 | REACTOME GENERATION OF SECOND MESSENGER MOLECULES | Genes involved in Generation of second messenger molecules |
| 0.1 | 1.7 | REACTOME PROTEOLYTIC CLEAVAGE OF SNARE COMPLEX PROTEINS | Genes involved in Proteolytic cleavage of SNARE complex proteins |
| 0.0 | 3.5 | REACTOME CHEMOKINE RECEPTORS BIND CHEMOKINES | Genes involved in Chemokine receptors bind chemokines |
| 0.0 | 2.1 | REACTOME INHIBITION OF VOLTAGE GATED CA2 CHANNELS VIA GBETA GAMMA SUBUNITS | Genes involved in Inhibition of voltage gated Ca2+ channels via Gbeta/gamma subunits |
| 0.0 | 3.2 | REACTOME GLUCONEOGENESIS | Genes involved in Gluconeogenesis |
| 0.0 | 1.6 | REACTOME DEGRADATION OF THE EXTRACELLULAR MATRIX | Genes involved in Degradation of the extracellular matrix |
| 0.0 | 0.6 | REACTOME ROLE OF DCC IN REGULATING APOPTOSIS | Genes involved in Role of DCC in regulating apoptosis |
| 0.0 | 0.5 | REACTOME RECYCLING OF BILE ACIDS AND SALTS | Genes involved in Recycling of bile acids and salts |
| 0.0 | 2.7 | REACTOME NRAGE SIGNALS DEATH THROUGH JNK | Genes involved in NRAGE signals death through JNK |
| 0.0 | 1.3 | REACTOME CTLA4 INHIBITORY SIGNALING | Genes involved in CTLA4 inhibitory signaling |
| 0.0 | 4.7 | REACTOME PPARA ACTIVATES GENE EXPRESSION | Genes involved in PPARA Activates Gene Expression |
| 0.0 | 0.4 | REACTOME CALNEXIN CALRETICULIN CYCLE | Genes involved in Calnexin/calreticulin cycle |
| 0.0 | 1.8 | REACTOME NUCLEAR RECEPTOR TRANSCRIPTION PATHWAY | Genes involved in Nuclear Receptor transcription pathway |
| 0.0 | 0.5 | REACTOME GLUCURONIDATION | Genes involved in Glucuronidation |
| 0.0 | 0.6 | REACTOME KERATAN SULFATE BIOSYNTHESIS | Genes involved in Keratan sulfate biosynthesis |
| 0.0 | 1.3 | REACTOME INTERFERON ALPHA BETA SIGNALING | Genes involved in Interferon alpha/beta signaling |
| 0.0 | 0.3 | REACTOME DESTABILIZATION OF MRNA BY TRISTETRAPROLIN TTP | Genes involved in Destabilization of mRNA by Tristetraprolin (TTP) |