Project
Illumina Body Map 2
Navigation
Downloads
Results for CCAGCAU
Z-value: 0.31
Motif logo

miRNA associated with seed CCAGCAU
| Name | miRBASE accession |
|---|---|
|
hsa-miR-338-3p
|
MIMAT0000763 |
Activity profile of CCAGCAU motif
Sorted Z-values of CCAGCAU motif
| Promoter | Log-likelihood | Transcript | Gene | Gene Info |
|---|---|---|---|---|
| chr15_+_85359911 | 0.53 |
ENST00000258888.5
|
ALPK3
|
alpha-kinase 3 |
| chr16_-_51185149 | 0.51 |
ENST00000566102.1
ENST00000541611.1 |
SALL1
|
spalt-like transcription factor 1 |
| chr17_+_43971643 | 0.49 |
ENST00000344290.5
ENST00000262410.5 ENST00000351559.5 ENST00000340799.5 ENST00000535772.1 ENST00000347967.5 |
MAPT
|
microtubule-associated protein tau |
| chr12_-_54982420 | 0.49 |
ENST00000257905.8
|
PPP1R1A
|
protein phosphatase 1, regulatory (inhibitor) subunit 1A |
| chr5_-_45696253 | 0.37 |
ENST00000303230.4
|
HCN1
|
hyperpolarization activated cyclic nucleotide-gated potassium channel 1 |
| chr22_-_44258360 | 0.35 |
ENST00000330884.4
ENST00000249130.5 |
SULT4A1
|
sulfotransferase family 4A, member 1 |
| chr3_-_179754706 | 0.29 |
ENST00000465751.1
ENST00000467460.1 |
PEX5L
|
peroxisomal biogenesis factor 5-like |
| chr4_-_168155730 | 0.29 |
ENST00000502330.1
ENST00000357154.3 |
SPOCK3
|
sparc/osteonectin, cwcv and kazal-like domains proteoglycan (testican) 3 |
| chr6_+_16238786 | 0.28 |
ENST00000259727.4
|
GMPR
|
guanosine monophosphate reductase |
| chr10_-_91403625 | 0.27 |
ENST00000322191.6
ENST00000342512.3 ENST00000371774.2 |
PANK1
|
pantothenate kinase 1 |
| chr1_+_109792641 | 0.26 |
ENST00000271332.3
|
CELSR2
|
cadherin, EGF LAG seven-pass G-type receptor 2 |
| chr3_+_49591881 | 0.23 |
ENST00000296452.4
|
BSN
|
bassoon presynaptic cytomatrix protein |
| chr1_-_40137710 | 0.23 |
ENST00000235628.1
|
NT5C1A
|
5'-nucleotidase, cytosolic IA |
| chr6_-_116601044 | 0.23 |
ENST00000368608.3
|
TSPYL1
|
TSPY-like 1 |
| chr1_+_61547894 | 0.21 |
ENST00000403491.3
|
NFIA
|
nuclear factor I/A |
| chr12_-_113574028 | 0.21 |
ENST00000546530.1
ENST00000261729.5 |
RASAL1
|
RAS protein activator like 1 (GAP1 like) |
| chr5_+_143584814 | 0.21 |
ENST00000507359.3
|
KCTD16
|
potassium channel tetramerization domain containing 16 |
| chr5_-_36152031 | 0.20 |
ENST00000296603.4
|
LMBRD2
|
LMBR1 domain containing 2 |
| chrX_-_107975917 | 0.19 |
ENST00000563887.1
|
RP6-24A23.6
|
Uncharacterized protein |
| chr11_+_113930291 | 0.18 |
ENST00000335953.4
|
ZBTB16
|
zinc finger and BTB domain containing 16 |
| chr11_-_129062093 | 0.18 |
ENST00000310343.9
|
ARHGAP32
|
Rho GTPase activating protein 32 |
| chr8_-_124553437 | 0.18 |
ENST00000517956.1
ENST00000443022.2 |
FBXO32
|
F-box protein 32 |
| chrX_+_49126294 | 0.17 |
ENST00000466508.1
ENST00000438316.1 ENST00000055335.6 ENST00000495799.1 |
PPP1R3F
|
protein phosphatase 1, regulatory subunit 3F |
| chr2_-_183731882 | 0.17 |
ENST00000295113.4
|
FRZB
|
frizzled-related protein |
| chr20_-_41818373 | 0.17 |
ENST00000373187.1
ENST00000356100.2 ENST00000373184.1 ENST00000373190.1 |
PTPRT
|
protein tyrosine phosphatase, receptor type, T |
| chr2_-_2334888 | 0.17 |
ENST00000428368.2
ENST00000399161.2 |
MYT1L
|
myelin transcription factor 1-like |
| chr6_+_72596604 | 0.16 |
ENST00000348717.5
ENST00000517960.1 ENST00000518273.1 ENST00000522291.1 ENST00000521978.1 ENST00000520567.1 ENST00000264839.7 |
RIMS1
|
regulating synaptic membrane exocytosis 1 |
| chr6_-_2634820 | 0.16 |
ENST00000296847.3
|
C6orf195
|
chromosome 6 open reading frame 195 |
| chr1_+_70034081 | 0.16 |
ENST00000310961.5
ENST00000370958.1 |
LRRC7
|
leucine rich repeat containing 7 |
| chr2_-_152955537 | 0.16 |
ENST00000201943.5
ENST00000539935.1 |
CACNB4
|
calcium channel, voltage-dependent, beta 4 subunit |
| chr9_+_140032842 | 0.15 |
ENST00000371561.3
ENST00000315048.3 |
GRIN1
|
glutamate receptor, ionotropic, N-methyl D-aspartate 1 |
| chr17_+_11144580 | 0.15 |
ENST00000441885.3
ENST00000432116.3 ENST00000409168.3 |
SHISA6
|
shisa family member 6 |
| chr6_-_146135880 | 0.15 |
ENST00000237281.4
|
FBXO30
|
F-box protein 30 |
| chr1_-_51425902 | 0.15 |
ENST00000396153.2
|
FAF1
|
Fas (TNFRSF6) associated factor 1 |
| chr5_+_43602750 | 0.15 |
ENST00000505678.2
ENST00000512422.1 ENST00000264663.5 |
NNT
|
nicotinamide nucleotide transhydrogenase |
| chr9_-_111929560 | 0.14 |
ENST00000561981.2
|
FRRS1L
|
ferric-chelate reductase 1-like |
| chr5_+_175223313 | 0.14 |
ENST00000359546.4
|
CPLX2
|
complexin 2 |
| chr2_-_166930131 | 0.14 |
ENST00000303395.4
ENST00000409050.1 ENST00000423058.2 ENST00000375405.3 |
SCN1A
|
sodium channel, voltage-gated, type I, alpha subunit |
| chr9_+_124413873 | 0.14 |
ENST00000408936.3
|
DAB2IP
|
DAB2 interacting protein |
| chr1_+_164528866 | 0.14 |
ENST00000420696.2
|
PBX1
|
pre-B-cell leukemia homeobox 1 |
| chr5_+_134240800 | 0.13 |
ENST00000512783.1
|
PCBD2
|
pterin-4 alpha-carbinolamine dehydratase/dimerization cofactor of hepatocyte nuclear factor 1 alpha (TCF1) 2 |
| chr3_-_9291063 | 0.13 |
ENST00000383836.3
|
SRGAP3
|
SLIT-ROBO Rho GTPase activating protein 3 |
| chr4_-_142053952 | 0.13 |
ENST00000515673.2
|
RNF150
|
ring finger protein 150 |
| chr1_+_229440129 | 0.13 |
ENST00000366688.3
|
SPHAR
|
S-phase response (cyclin related) |
| chr12_+_113229737 | 0.13 |
ENST00000551052.1
ENST00000415485.3 |
RPH3A
|
rabphilin 3A homolog (mouse) |
| chr10_-_118502070 | 0.12 |
ENST00000369209.3
|
HSPA12A
|
heat shock 70kDa protein 12A |
| chr9_+_129567282 | 0.12 |
ENST00000449886.1
ENST00000373464.4 ENST00000450858.1 |
ZBTB43
|
zinc finger and BTB domain containing 43 |
| chr6_+_37787262 | 0.11 |
ENST00000287218.4
|
ZFAND3
|
zinc finger, AN1-type domain 3 |
| chr11_+_111473108 | 0.11 |
ENST00000304987.3
|
SIK2
|
salt-inducible kinase 2 |
| chr17_-_10741762 | 0.10 |
ENST00000580256.2
|
PIRT
|
phosphoinositide-interacting regulator of transient receptor potential channels |
| chr3_+_100428268 | 0.10 |
ENST00000240851.4
|
TFG
|
TRK-fused gene |
| chr15_+_73976545 | 0.09 |
ENST00000318443.5
ENST00000537340.2 ENST00000318424.5 |
CD276
|
CD276 molecule |
| chr4_+_48018781 | 0.09 |
ENST00000295461.5
|
NIPAL1
|
NIPA-like domain containing 1 |
| chr1_-_51763661 | 0.09 |
ENST00000530004.1
|
TTC39A
|
tetratricopeptide repeat domain 39A |
| chr17_+_46125707 | 0.09 |
ENST00000584137.1
ENST00000362042.3 ENST00000585291.1 ENST00000357480.5 |
NFE2L1
|
nuclear factor, erythroid 2-like 1 |
| chr3_-_134093395 | 0.09 |
ENST00000249883.5
|
AMOTL2
|
angiomotin like 2 |
| chr14_+_65171099 | 0.09 |
ENST00000247226.7
|
PLEKHG3
|
pleckstrin homology domain containing, family G (with RhoGef domain) member 3 |
| chr10_-_75634260 | 0.09 |
ENST00000372765.1
ENST00000351293.3 |
CAMK2G
|
calcium/calmodulin-dependent protein kinase II gamma |
| chr12_-_10875831 | 0.08 |
ENST00000279550.7
ENST00000228251.4 |
YBX3
|
Y box binding protein 3 |
| chr11_+_4116005 | 0.08 |
ENST00000300738.5
|
RRM1
|
ribonucleotide reductase M1 |
| chr3_-_28390581 | 0.08 |
ENST00000479665.1
|
AZI2
|
5-azacytidine induced 2 |
| chr19_-_56092187 | 0.08 |
ENST00000325421.4
ENST00000592239.1 |
ZNF579
|
zinc finger protein 579 |
| chr10_-_105615164 | 0.08 |
ENST00000355946.2
ENST00000369774.4 |
SH3PXD2A
|
SH3 and PX domains 2A |
| chr7_-_14942944 | 0.08 |
ENST00000403951.2
|
DGKB
|
diacylglycerol kinase, beta 90kDa |
| chr4_+_41992489 | 0.07 |
ENST00000264451.7
|
SLC30A9
|
solute carrier family 30 (zinc transporter), member 9 |
| chr8_+_21915368 | 0.07 |
ENST00000265800.5
ENST00000517418.1 |
DMTN
|
dematin actin binding protein |
| chr18_-_31803435 | 0.07 |
ENST00000589544.1
ENST00000269185.4 ENST00000261592.5 |
NOL4
|
nucleolar protein 4 |
| chr2_-_220094294 | 0.07 |
ENST00000436856.1
ENST00000428226.1 ENST00000409422.1 ENST00000431715.1 ENST00000457841.1 ENST00000439812.1 ENST00000361242.4 ENST00000396761.2 |
ATG9A
|
autophagy related 9A |
| chr7_-_87849340 | 0.07 |
ENST00000419179.1
ENST00000265729.2 |
SRI
|
sorcin |
| chr17_-_40950698 | 0.07 |
ENST00000328434.7
|
COA3
|
cytochrome c oxidase assembly factor 3 |
| chr11_-_73309228 | 0.07 |
ENST00000356467.4
ENST00000064778.4 |
FAM168A
|
family with sequence similarity 168, member A |
| chr8_+_77593448 | 0.07 |
ENST00000521891.2
|
ZFHX4
|
zinc finger homeobox 4 |
| chr5_+_140560980 | 0.07 |
ENST00000361016.2
|
PCDHB16
|
protocadherin beta 16 |
| chr2_+_210444142 | 0.07 |
ENST00000360351.4
ENST00000361559.4 |
MAP2
|
microtubule-associated protein 2 |
| chr10_-_94003003 | 0.07 |
ENST00000412050.4
|
CPEB3
|
cytoplasmic polyadenylation element binding protein 3 |
| chr2_-_69870835 | 0.06 |
ENST00000409085.4
ENST00000406297.3 |
AAK1
|
AP2 associated kinase 1 |
| chr5_+_141488070 | 0.06 |
ENST00000253814.4
|
NDFIP1
|
Nedd4 family interacting protein 1 |
| chr2_-_152684977 | 0.06 |
ENST00000428992.2
ENST00000295087.8 |
ARL5A
|
ADP-ribosylation factor-like 5A |
| chr1_-_205091115 | 0.06 |
ENST00000264515.6
ENST00000367164.1 |
RBBP5
|
retinoblastoma binding protein 5 |
| chr11_-_115375107 | 0.06 |
ENST00000545380.1
ENST00000452722.3 ENST00000537058.1 ENST00000536727.1 ENST00000542447.2 ENST00000331581.6 |
CADM1
|
cell adhesion molecule 1 |
| chr4_-_149365827 | 0.06 |
ENST00000344721.4
|
NR3C2
|
nuclear receptor subfamily 3, group C, member 2 |
| chr8_-_98290087 | 0.06 |
ENST00000322128.3
|
TSPYL5
|
TSPY-like 5 |
| chrX_-_152864632 | 0.06 |
ENST00000406277.2
|
FAM58A
|
family with sequence similarity 58, member A |
| chr4_-_153457197 | 0.05 |
ENST00000281708.4
|
FBXW7
|
F-box and WD repeat domain containing 7, E3 ubiquitin protein ligase |
| chr1_-_154531095 | 0.05 |
ENST00000292211.4
|
UBE2Q1
|
ubiquitin-conjugating enzyme E2Q family member 1 |
| chr7_-_156803329 | 0.05 |
ENST00000252971.6
|
MNX1
|
motor neuron and pancreas homeobox 1 |
| chr9_+_35749203 | 0.05 |
ENST00000456972.2
ENST00000378078.4 |
RGP1
|
RGP1 retrograde golgi transport homolog (S. cerevisiae) |
| chr1_+_244214577 | 0.05 |
ENST00000358704.4
|
ZBTB18
|
zinc finger and BTB domain containing 18 |
| chr22_-_44894178 | 0.05 |
ENST00000341255.3
|
LDOC1L
|
leucine zipper, down-regulated in cancer 1-like |
| chr7_+_139026057 | 0.05 |
ENST00000541515.3
|
LUC7L2
|
LUC7-like 2 (S. cerevisiae) |
| chr18_-_72921303 | 0.05 |
ENST00000322342.3
|
ZADH2
|
zinc binding alcohol dehydrogenase domain containing 2 |
| chr14_+_23775971 | 0.05 |
ENST00000250405.5
|
BCL2L2
|
BCL2-like 2 |
| chr1_+_201798269 | 0.05 |
ENST00000361565.4
|
IPO9
|
importin 9 |
| chr16_-_69419871 | 0.05 |
ENST00000603068.1
ENST00000254942.3 ENST00000567296.2 |
TERF2
|
telomeric repeat binding factor 2 |
| chr2_-_101767715 | 0.05 |
ENST00000376840.4
ENST00000409318.1 |
TBC1D8
|
TBC1 domain family, member 8 (with GRAM domain) |
| chr14_-_36989427 | 0.05 |
ENST00000354822.5
|
NKX2-1
|
NK2 homeobox 1 |
| chr19_+_45754505 | 0.04 |
ENST00000262891.4
ENST00000300843.4 |
MARK4
|
MAP/microtubule affinity-regulating kinase 4 |
| chr12_-_4647606 | 0.04 |
ENST00000261250.3
ENST00000541014.1 ENST00000545746.1 ENST00000542080.1 |
C12orf4
|
chromosome 12 open reading frame 4 |
| chr19_-_38210622 | 0.04 |
ENST00000591664.1
ENST00000355202.4 |
ZNF607
|
zinc finger protein 607 |
| chr5_+_158690089 | 0.04 |
ENST00000296786.6
|
UBLCP1
|
ubiquitin-like domain containing CTD phosphatase 1 |
| chr1_+_26438289 | 0.04 |
ENST00000374271.4
ENST00000374269.1 |
PDIK1L
|
PDLIM1 interacting kinase 1 like |
| chr9_-_14693417 | 0.04 |
ENST00000380916.4
|
ZDHHC21
|
zinc finger, DHHC-type containing 21 |
| chr3_-_71774516 | 0.04 |
ENST00000425534.3
|
EIF4E3
|
eukaryotic translation initiation factor 4E family member 3 |
| chr9_-_123964114 | 0.04 |
ENST00000373840.4
|
RAB14
|
RAB14, member RAS oncogene family |
| chr6_-_36304660 | 0.03 |
ENST00000437635.2
|
C6orf222
|
chromosome 6 open reading frame 222 |
| chr11_-_10562710 | 0.03 |
ENST00000528665.1
ENST00000265981.2 |
RNF141
|
ring finger protein 141 |
| chr1_-_78148324 | 0.03 |
ENST00000370801.3
ENST00000433749.1 |
ZZZ3
|
zinc finger, ZZ-type containing 3 |
| chr17_-_4269768 | 0.03 |
ENST00000396981.2
|
UBE2G1
|
ubiquitin-conjugating enzyme E2G 1 |
| chr10_+_102295616 | 0.03 |
ENST00000299163.6
|
HIF1AN
|
hypoxia inducible factor 1, alpha subunit inhibitor |
| chr1_+_113010056 | 0.03 |
ENST00000369686.5
|
WNT2B
|
wingless-type MMTV integration site family, member 2B |
| chr20_+_47538357 | 0.03 |
ENST00000371917.4
|
ARFGEF2
|
ADP-ribosylation factor guanine nucleotide-exchange factor 2 (brefeldin A-inhibited) |
| chr1_+_153606513 | 0.03 |
ENST00000368694.3
|
CHTOP
|
chromatin target of PRMT1 |
| chr10_-_100995540 | 0.03 |
ENST00000370546.1
ENST00000404542.1 |
HPSE2
|
heparanase 2 |
| chr2_+_48010221 | 0.03 |
ENST00000234420.5
|
MSH6
|
mutS homolog 6 |
| chr2_+_113239710 | 0.03 |
ENST00000233336.6
|
TTL
|
tubulin tyrosine ligase |
| chr3_-_142166904 | 0.03 |
ENST00000264951.4
|
XRN1
|
5'-3' exoribonuclease 1 |
| chr16_-_77468945 | 0.03 |
ENST00000282849.5
|
ADAMTS18
|
ADAM metallopeptidase with thrombospondin type 1 motif, 18 |
| chr16_+_67063036 | 0.03 |
ENST00000290858.6
ENST00000564034.1 |
CBFB
|
core-binding factor, beta subunit |
| chr2_-_85555385 | 0.03 |
ENST00000377386.3
|
TGOLN2
|
trans-golgi network protein 2 |
| chr6_-_116575226 | 0.02 |
ENST00000420283.1
|
TSPYL4
|
TSPY-like 4 |
| chr5_-_107006596 | 0.02 |
ENST00000333274.6
|
EFNA5
|
ephrin-A5 |
| chr14_+_67826709 | 0.02 |
ENST00000256383.4
|
EIF2S1
|
eukaryotic translation initiation factor 2, subunit 1 alpha, 35kDa |
| chr15_+_45422131 | 0.02 |
ENST00000321429.4
|
DUOX1
|
dual oxidase 1 |
| chr9_+_125026882 | 0.02 |
ENST00000297908.3
ENST00000373730.3 ENST00000546115.1 ENST00000344641.3 |
MRRF
|
mitochondrial ribosome recycling factor |
| chr2_+_28974668 | 0.02 |
ENST00000296122.6
ENST00000395366.2 |
PPP1CB
|
protein phosphatase 1, catalytic subunit, beta isozyme |
| chr6_-_99963252 | 0.02 |
ENST00000392738.2
ENST00000327681.6 ENST00000472914.2 |
USP45
|
ubiquitin specific peptidase 45 |
| chr22_-_22221900 | 0.02 |
ENST00000215832.6
ENST00000398822.3 |
MAPK1
|
mitogen-activated protein kinase 1 |
| chr9_-_86153218 | 0.02 |
ENST00000304195.3
ENST00000376438.1 |
FRMD3
|
FERM domain containing 3 |
| chr12_+_862089 | 0.02 |
ENST00000315939.6
ENST00000537687.1 ENST00000447667.2 |
WNK1
|
WNK lysine deficient protein kinase 1 |
| chr10_-_70287231 | 0.02 |
ENST00000609923.1
|
SLC25A16
|
solute carrier family 25 (mitochondrial carrier; Graves disease autoantigen), member 16 |
| chr1_-_35658736 | 0.01 |
ENST00000357214.5
|
SFPQ
|
splicing factor proline/glutamine-rich |
| chr3_-_14166316 | 0.01 |
ENST00000396914.3
ENST00000295767.5 |
CHCHD4
|
coiled-coil-helix-coiled-coil-helix domain containing 4 |
| chr5_+_63802109 | 0.01 |
ENST00000334025.2
|
RGS7BP
|
regulator of G-protein signaling 7 binding protein |
| chr8_+_120079478 | 0.01 |
ENST00000332843.2
|
COLEC10
|
collectin sub-family member 10 (C-type lectin) |
| chr3_+_183873098 | 0.01 |
ENST00000313143.3
|
DVL3
|
dishevelled segment polarity protein 3 |
| chr14_-_76127519 | 0.01 |
ENST00000256319.6
|
C14orf1
|
chromosome 14 open reading frame 1 |
| chr2_+_64681219 | 0.01 |
ENST00000238875.5
|
LGALSL
|
lectin, galactoside-binding-like |
| chr10_-_102279586 | 0.01 |
ENST00000370345.3
ENST00000451524.1 ENST00000370329.5 |
SEC31B
|
SEC31 homolog B (S. cerevisiae) |
| chr2_-_85788605 | 0.01 |
ENST00000233838.4
|
GGCX
|
gamma-glutamyl carboxylase |
| chr3_+_29322803 | 0.01 |
ENST00000396583.3
ENST00000383767.2 |
RBMS3
|
RNA binding motif, single stranded interacting protein 3 |
| chr7_+_74072011 | 0.01 |
ENST00000324896.4
ENST00000353920.4 ENST00000346152.4 ENST00000416070.1 |
GTF2I
|
general transcription factor IIi |
| chr10_+_105726862 | 0.01 |
ENST00000335753.4
ENST00000369755.3 |
SLK
|
STE20-like kinase |
| chr8_+_6565854 | 0.01 |
ENST00000285518.6
|
AGPAT5
|
1-acylglycerol-3-phosphate O-acyltransferase 5 |
| chr7_-_26240357 | 0.00 |
ENST00000354667.4
ENST00000356674.7 |
HNRNPA2B1
|
heterogeneous nuclear ribonucleoprotein A2/B1 |
| chr4_-_55991752 | 0.00 |
ENST00000263923.4
|
KDR
|
kinase insert domain receptor (a type III receptor tyrosine kinase) |
| chr12_+_69864129 | 0.00 |
ENST00000547219.1
ENST00000299293.2 ENST00000549921.1 ENST00000550316.1 ENST00000548154.1 ENST00000547414.1 ENST00000550389.1 ENST00000550937.1 ENST00000549092.1 ENST00000550169.1 |
FRS2
|
fibroblast growth factor receptor substrate 2 |
| chrX_-_119445263 | 0.00 |
ENST00000309720.5
|
TMEM255A
|
transmembrane protein 255A |
| chr3_-_114790179 | 0.00 |
ENST00000462705.1
|
ZBTB20
|
zinc finger and BTB domain containing 20 |
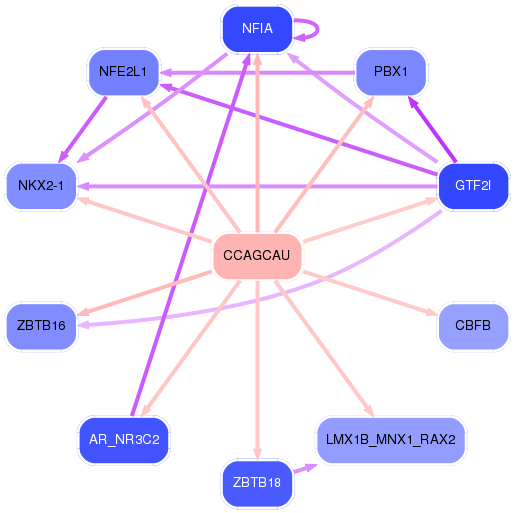
Network of associatons between targets according to the STRING database.

First level regulatory network of CCAGCAU
Gene Ontology Analysis
Gene overrepresentation in biological_process category:
| Log-likelihood per target | Total log-likelihood | Term | Description |
|---|---|---|---|
| 0.1 | 0.5 | GO:0061034 | olfactory bulb mitral cell layer development(GO:0061034) |
| 0.1 | 0.5 | GO:0090258 | negative regulation of mitochondrial fission(GO:0090258) |
| 0.1 | 0.2 | GO:0043449 | cellular alkene metabolic process(GO:0043449) |
| 0.0 | 0.4 | GO:0042670 | retinal cone cell differentiation(GO:0042670) retinal cone cell development(GO:0046549) |
| 0.0 | 0.1 | GO:0043553 | vascular endothelial growth factor receptor-2 signaling pathway(GO:0036324) negative regulation of phosphatidylinositol 3-kinase activity(GO:0043553) |
| 0.0 | 0.3 | GO:0016560 | protein import into peroxisome matrix, docking(GO:0016560) |
| 0.0 | 0.2 | GO:0051138 | positive regulation of NK T cell differentiation(GO:0051138) |
| 0.0 | 0.1 | GO:1905051 | regulation of base-excision repair(GO:1905051) positive regulation of base-excision repair(GO:1905053) |
| 0.0 | 0.3 | GO:0021999 | neural plate anterior/posterior regionalization(GO:0021999) |
| 0.0 | 0.1 | GO:1900365 | positive regulation of mRNA polyadenylation(GO:1900365) |
| 0.0 | 0.1 | GO:0006740 | NADPH regeneration(GO:0006740) |
| 0.0 | 0.2 | GO:0060029 | convergent extension involved in organogenesis(GO:0060029) |
| 0.0 | 0.1 | GO:0048294 | negative regulation of isotype switching to IgE isotypes(GO:0048294) |
| 0.0 | 0.3 | GO:0043101 | purine-containing compound salvage(GO:0043101) |
| 0.0 | 0.2 | GO:0046085 | purine nucleoside monophosphate catabolic process(GO:0009128) adenosine metabolic process(GO:0046085) |
| 0.0 | 0.1 | GO:0006729 | tetrahydrobiopterin biosynthetic process(GO:0006729) tetrahydrobiopterin metabolic process(GO:0046146) |
| 0.0 | 0.3 | GO:0019800 | peptide cross-linking via chondroitin 4-sulfate glycosaminoglycan(GO:0019800) |
| 0.0 | 0.1 | GO:0044805 | late nucleophagy(GO:0044805) |
| 0.0 | 0.0 | GO:1903517 | regulation of telomere maintenance via recombination(GO:0032207) negative regulation of telomere maintenance via recombination(GO:0032208) negative regulation of single strand break repair(GO:1903517) negative regulation of beta-galactosidase activity(GO:1903770) telomere single strand break repair(GO:1903823) negative regulation of telomere single strand break repair(GO:1903824) |
| 0.0 | 0.1 | GO:2000639 | regulation of SREBP signaling pathway(GO:2000638) negative regulation of SREBP signaling pathway(GO:2000639) |
| 0.0 | 0.3 | GO:0015937 | coenzyme A biosynthetic process(GO:0015937) |
Gene overrepresentation in cellular_component category:
| Log-likelihood per target | Total log-likelihood | Term | Description |
|---|---|---|---|
| 0.1 | 0.4 | GO:0098855 | HCN channel complex(GO:0098855) |
| 0.1 | 0.5 | GO:0045298 | tubulin complex(GO:0045298) |
| 0.0 | 0.1 | GO:1990032 | parallel fiber(GO:1990032) |
| 0.0 | 0.3 | GO:1902560 | GMP reductase complex(GO:1902560) |
| 0.0 | 0.5 | GO:0010369 | chromocenter(GO:0010369) |
| 0.0 | 0.1 | GO:0070033 | synaptobrevin 2-SNAP-25-syntaxin-1a-complexin II complex(GO:0070033) synaptobrevin 2-SNAP-25-syntaxin-3-complexin complex(GO:0070554) |
| 0.0 | 0.2 | GO:0098839 | postsynaptic density membrane(GO:0098839) |
Gene overrepresentation in molecular_function category:
| Log-likelihood per target | Total log-likelihood | Term | Description |
|---|---|---|---|
| 0.1 | 0.5 | GO:0099609 | microtubule lateral binding(GO:0099609) |
| 0.1 | 0.4 | GO:0005222 | intracellular cAMP activated cation channel activity(GO:0005222) |
| 0.0 | 0.1 | GO:0008746 | NAD(P)+ transhydrogenase activity(GO:0008746) oxidoreductase activity, acting on NAD(P)H, NAD(P) as acceptor(GO:0016652) |
| 0.0 | 0.1 | GO:0008124 | 4-alpha-hydroxytetrahydrobiopterin dehydratase activity(GO:0008124) |
| 0.0 | 0.3 | GO:0016657 | GMP reductase activity(GO:0003920) oxidoreductase activity, acting on NAD(P)H, nitrogenous group as acceptor(GO:0016657) |
| 0.0 | 0.3 | GO:0004594 | pantothenate kinase activity(GO:0004594) |
| 0.0 | 0.3 | GO:0005052 | peroxisome matrix targeting signal-1 binding(GO:0005052) |
| 0.0 | 0.5 | GO:0004865 | protein serine/threonine phosphatase inhibitor activity(GO:0004865) |
| 0.0 | 0.1 | GO:0035662 | Toll-like receptor 4 binding(GO:0035662) |
| 0.0 | 0.2 | GO:0070097 | delta-catenin binding(GO:0070097) |
| 0.0 | 0.2 | GO:0099529 | neurotransmitter receptor activity involved in regulation of postsynaptic membrane potential(GO:0099529) transmitter-gated ion channel activity involved in regulation of postsynaptic membrane potential(GO:1904315) |
| 0.0 | 0.3 | GO:0004062 | aryl sulfotransferase activity(GO:0004062) |
Gene overrepresentation in curated gene sets: canonical pathways category:
| Log-likelihood per target | Total log-likelihood | Term | Description |
|---|---|---|---|
| 0.0 | 0.5 | PID P38 GAMMA DELTA PATHWAY | Signaling mediated by p38-gamma and p38-delta |
Gene overrepresentation in curated gene sets: REACTOME pathways category:
| Log-likelihood per target | Total log-likelihood | Term | Description |
|---|---|---|---|
| 0.0 | 0.3 | REACTOME VITAMIN B5 PANTOTHENATE METABOLISM | Genes involved in Vitamin B5 (pantothenate) metabolism |
| 0.0 | 0.2 | REACTOME PYRIMIDINE CATABOLISM | Genes involved in Pyrimidine catabolism |
| 0.0 | 0.5 | REACTOME CASPASE MEDIATED CLEAVAGE OF CYTOSKELETAL PROTEINS | Genes involved in Caspase-mediated cleavage of cytoskeletal proteins |
| 0.0 | 0.3 | REACTOME CYTOSOLIC SULFONATION OF SMALL MOLECULES | Genes involved in Cytosolic sulfonation of small molecules |
| 0.0 | 0.3 | REACTOME PURINE SALVAGE | Genes involved in Purine salvage |