Project
Illumina Body Map 2
Navigation
Downloads
Results for HNF1A_HNF1B
Z-value: 9.13
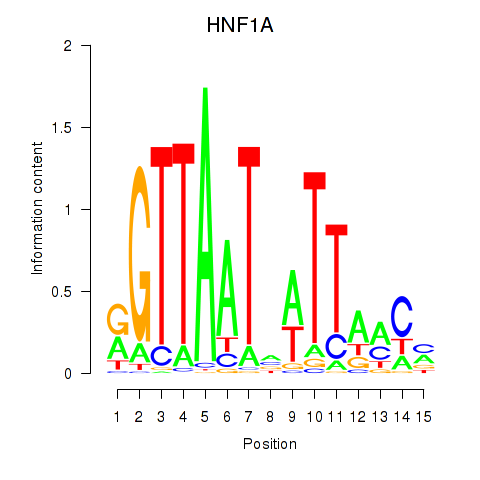
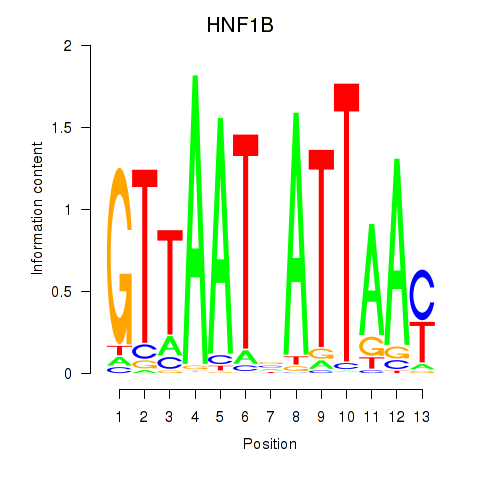
Motif logo
Transcription factors associated with HNF1A_HNF1B
| Gene Symbol | Gene ID | Gene Info |
|---|---|---|
|
HNF1A
|
ENSG00000135100.13 | HNF1 homeobox A |
|
HNF1B
|
ENSG00000108753.8 | HNF1 homeobox B |
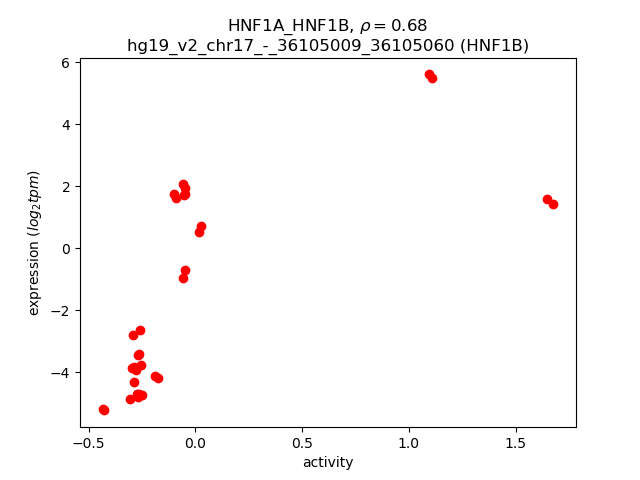
Activity-expression correlation:
| Gene | Promoter | Pearson corr. coef. | P-value | Plot |
|---|---|---|---|---|
| HNF1A | hg19_v2_chr12_+_121416489_121416552 | 0.84 | 1.4e-09 | Click! |
| HNF1B | hg19_v2_chr17_-_36105009_36105060 | 0.68 | 1.8e-05 | Click! |
Activity profile of HNF1A_HNF1B motif
Sorted Z-values of HNF1A_HNF1B motif
| Promoter | Log-likelihood | Transcript | Gene | Gene Info |
|---|---|---|---|---|
| chr4_-_72649763 | 137.34 |
ENST00000513476.1
|
GC
|
group-specific component (vitamin D binding protein) |
| chr4_+_74347400 | 115.09 |
ENST00000226355.3
|
AFM
|
afamin |
| chr17_-_64225508 | 102.94 |
ENST00000205948.6
|
APOH
|
apolipoprotein H (beta-2-glycoprotein I) |
| chr4_+_155484103 | 90.69 |
ENST00000302068.4
|
FGB
|
fibrinogen beta chain |
| chr4_-_155511887 | 89.73 |
ENST00000302053.3
ENST00000403106.3 |
FGA
|
fibrinogen alpha chain |
| chr4_+_155484155 | 88.97 |
ENST00000509493.1
|
FGB
|
fibrinogen beta chain |
| chr19_-_36304201 | 87.29 |
ENST00000301175.3
|
PRODH2
|
proline dehydrogenase (oxidase) 2 |
| chr2_+_234601512 | 73.28 |
ENST00000305139.6
|
UGT1A6
|
UDP glucuronosyltransferase 1 family, polypeptide A6 |
| chr2_+_234637754 | 71.68 |
ENST00000482026.1
ENST00000609767.1 |
UGT1A3
UGT1A1
|
UDP glucuronosyltransferase 1 family, polypeptide A3 UDP glucuronosyltransferase 1 family, polypeptide A8 |
| chr20_+_43029911 | 69.82 |
ENST00000443598.2
ENST00000316099.4 ENST00000415691.2 |
HNF4A
|
hepatocyte nuclear factor 4, alpha |
| chr6_+_161123270 | 68.94 |
ENST00000366924.2
ENST00000308192.9 ENST00000418964.1 |
PLG
|
plasminogen |
| chr1_-_159684371 | 68.58 |
ENST00000255030.5
ENST00000437342.1 ENST00000368112.1 ENST00000368111.1 ENST00000368110.1 ENST00000343919.2 |
CRP
|
C-reactive protein, pentraxin-related |
| chrX_-_105282712 | 64.32 |
ENST00000372563.1
|
SERPINA7
|
serpin peptidase inhibitor, clade A (alpha-1 antiproteinase, antitrypsin), member 7 |
| chr14_-_57960456 | 61.34 |
ENST00000534126.1
ENST00000422976.2 |
C14orf105
|
chromosome 14 open reading frame 105 |
| chr14_-_57960545 | 60.47 |
ENST00000526336.1
ENST00000216445.3 |
C14orf105
|
chromosome 14 open reading frame 105 |
| chr4_+_187187098 | 59.98 |
ENST00000403665.2
ENST00000264692.4 |
F11
|
coagulation factor XI |
| chr2_+_234668894 | 57.25 |
ENST00000305208.5
ENST00000608383.1 ENST00000360418.3 |
UGT1A8
UGT1A1
|
UDP glucuronosyltransferase 1 family, polypeptide A1 UDP glucuronosyltransferase 1 family, polypeptide A8 |
| chr1_+_207277590 | 55.48 |
ENST00000367070.3
|
C4BPA
|
complement component 4 binding protein, alpha |
| chr20_-_7921090 | 54.82 |
ENST00000378789.3
|
HAO1
|
hydroxyacid oxidase (glycolate oxidase) 1 |
| chr1_-_204183071 | 53.33 |
ENST00000308302.3
|
GOLT1A
|
golgi transport 1A |
| chr1_+_207277632 | 52.98 |
ENST00000421786.1
|
C4BPA
|
complement component 4 binding protein, alpha |
| chr4_-_69817481 | 52.69 |
ENST00000251566.4
|
UGT2A3
|
UDP glucuronosyltransferase 2 family, polypeptide A3 |
| chr20_+_42984330 | 52.38 |
ENST00000316673.4
ENST00000609795.1 ENST00000457232.1 ENST00000609262.1 |
HNF4A
|
hepatocyte nuclear factor 4, alpha |
| chr20_+_42187682 | 49.91 |
ENST00000373092.3
ENST00000373077.1 |
SGK2
|
serum/glucocorticoid regulated kinase 2 |
| chr5_+_175976324 | 47.48 |
ENST00000261944.5
|
CDHR2
|
cadherin-related family member 2 |
| chr7_-_50633078 | 47.17 |
ENST00000444124.2
|
DDC
|
dopa decarboxylase (aromatic L-amino acid decarboxylase) |
| chr4_+_74269956 | 46.91 |
ENST00000295897.4
ENST00000415165.2 ENST00000503124.1 ENST00000509063.1 ENST00000401494.3 |
ALB
|
albumin |
| chr10_+_115312825 | 46.27 |
ENST00000537906.1
ENST00000541666.1 |
HABP2
|
hyaluronan binding protein 2 |
| chrX_-_15683147 | 43.79 |
ENST00000380342.3
|
TMEM27
|
transmembrane protein 27 |
| chr9_-_123812542 | 43.60 |
ENST00000223642.1
|
C5
|
complement component 5 |
| chr14_-_94759361 | 42.78 |
ENST00000393096.1
|
SERPINA10
|
serpin peptidase inhibitor, clade A (alpha-1 antiproteinase, antitrypsin), member 10 |
| chr14_-_94759408 | 42.41 |
ENST00000554723.1
|
SERPINA10
|
serpin peptidase inhibitor, clade A (alpha-1 antiproteinase, antitrypsin), member 10 |
| chr10_+_101542462 | 41.52 |
ENST00000370449.4
ENST00000370434.1 |
ABCC2
|
ATP-binding cassette, sub-family C (CFTR/MRP), member 2 |
| chr15_+_58724184 | 41.47 |
ENST00000433326.2
|
LIPC
|
lipase, hepatic |
| chr14_-_94759595 | 41.27 |
ENST00000261994.4
|
SERPINA10
|
serpin peptidase inhibitor, clade A (alpha-1 antiproteinase, antitrypsin), member 10 |
| chr2_-_88427568 | 41.25 |
ENST00000393750.3
ENST00000295834.3 |
FABP1
|
fatty acid binding protein 1, liver |
| chr4_+_187187337 | 41.14 |
ENST00000492972.2
|
F11
|
coagulation factor XI |
| chr8_-_17752996 | 40.85 |
ENST00000381841.2
ENST00000427924.1 |
FGL1
|
fibrinogen-like 1 |
| chr3_+_186383741 | 40.83 |
ENST00000232003.4
|
HRG
|
histidine-rich glycoprotein |
| chr2_+_88047606 | 39.56 |
ENST00000359481.4
|
PLGLB2
|
plasminogen-like B2 |
| chr14_-_94854926 | 39.50 |
ENST00000402629.1
ENST00000556091.1 ENST00000554720.1 |
SERPINA1
|
serpin peptidase inhibitor, clade A (alpha-1 antiproteinase, antitrypsin), member 1 |
| chr1_-_197036364 | 38.87 |
ENST00000367412.1
|
F13B
|
coagulation factor XIII, B polypeptide |
| chr6_-_161085291 | 38.74 |
ENST00000316300.5
|
LPA
|
lipoprotein, Lp(a) |
| chr6_+_25754927 | 38.62 |
ENST00000377905.4
ENST00000439485.2 |
SLC17A4
|
solute carrier family 17, member 4 |
| chr5_+_176513868 | 38.40 |
ENST00000292408.4
|
FGFR4
|
fibroblast growth factor receptor 4 |
| chr20_+_42187608 | 38.25 |
ENST00000373100.1
|
SGK2
|
serum/glucocorticoid regulated kinase 2 |
| chr17_+_4692230 | 37.14 |
ENST00000331264.7
|
GLTPD2
|
glycolipid transfer protein domain containing 2 |
| chr6_-_25930819 | 36.53 |
ENST00000360488.3
|
SLC17A2
|
solute carrier family 17, member 2 |
| chr2_+_234621551 | 36.12 |
ENST00000608381.1
ENST00000373414.3 |
UGT1A1
UGT1A5
|
UDP glucuronosyltransferase 1 family, polypeptide A8 UDP glucuronosyltransferase 1 family, polypeptide A5 |
| chr6_-_25930904 | 36.08 |
ENST00000377850.3
|
SLC17A2
|
solute carrier family 17, member 2 |
| chr2_+_27719697 | 36.03 |
ENST00000264717.2
ENST00000424318.2 |
GCKR
|
glucokinase (hexokinase 4) regulator |
| chr10_+_115312766 | 36.00 |
ENST00000351270.3
|
HABP2
|
hyaluronan binding protein 2 |
| chr19_+_11350278 | 35.55 |
ENST00000252453.8
|
C19orf80
|
chromosome 19 open reading frame 80 |
| chr4_-_110723335 | 34.07 |
ENST00000394634.2
|
CFI
|
complement factor I |
| chr2_+_234526272 | 33.43 |
ENST00000373450.4
|
UGT1A1
|
UDP glucuronosyltransferase 1 family, polypeptide A8 |
| chr12_+_100867486 | 32.91 |
ENST00000548884.1
|
NR1H4
|
nuclear receptor subfamily 1, group H, member 4 |
| chr16_+_20462783 | 32.76 |
ENST00000574251.1
ENST00000576361.1 ENST00000417235.2 ENST00000573854.1 ENST00000424070.1 ENST00000536134.1 ENST00000219054.6 ENST00000575690.1 ENST00000571894.1 |
ACSM2A
|
acyl-CoA synthetase medium-chain family member 2A |
| chr16_+_20775358 | 32.59 |
ENST00000440284.2
|
ACSM3
|
acyl-CoA synthetase medium-chain family member 3 |
| chr4_+_3443614 | 32.56 |
ENST00000382774.3
ENST00000511533.1 |
HGFAC
|
HGF activator |
| chr9_-_116861337 | 32.48 |
ENST00000374118.3
|
KIF12
|
kinesin family member 12 |
| chr2_+_234627424 | 32.34 |
ENST00000373409.3
|
UGT1A4
|
UDP glucuronosyltransferase 1 family, polypeptide A4 |
| chr4_-_110723194 | 31.93 |
ENST00000394635.3
|
CFI
|
complement factor I |
| chr16_-_20587599 | 31.36 |
ENST00000566384.1
ENST00000565232.1 ENST00000567001.1 ENST00000565322.1 ENST00000569344.1 ENST00000329697.6 ENST00000414188.2 ENST00000568882.1 |
ACSM2B
|
acyl-CoA synthetase medium-chain family member 2B |
| chr4_-_110723134 | 31.12 |
ENST00000510800.1
ENST00000512148.1 |
CFI
|
complement factor I |
| chr17_+_41052808 | 31.06 |
ENST00000592383.1
ENST00000253801.2 ENST00000585489.1 |
G6PC
|
glucose-6-phosphatase, catalytic subunit |
| chr12_+_100867694 | 31.03 |
ENST00000392986.3
ENST00000549996.1 |
NR1H4
|
nuclear receptor subfamily 1, group H, member 4 |
| chr5_+_176513895 | 30.79 |
ENST00000503708.1
ENST00000393648.2 ENST00000514472.1 ENST00000502906.1 ENST00000292410.3 ENST00000510911.1 |
FGFR4
|
fibroblast growth factor receptor 4 |
| chr10_+_135340859 | 30.67 |
ENST00000252945.3
ENST00000421586.1 ENST00000418356.1 |
CYP2E1
|
cytochrome P450, family 2, subfamily E, polypeptide 1 |
| chr1_+_63063152 | 30.56 |
ENST00000371129.3
|
ANGPTL3
|
angiopoietin-like 3 |
| chr16_+_20775024 | 30.36 |
ENST00000289416.5
|
ACSM3
|
acyl-CoA synthetase medium-chain family member 3 |
| chr6_-_51952418 | 29.63 |
ENST00000371117.3
|
PKHD1
|
polycystic kidney and hepatic disease 1 (autosomal recessive) |
| chr17_+_73642315 | 29.58 |
ENST00000556126.2
|
SMIM6
|
small integral membrane protein 6 |
| chr6_-_25874440 | 29.04 |
ENST00000361703.6
ENST00000397060.4 |
SLC17A3
|
solute carrier family 17 (organic anion transporter), member 3 |
| chr11_-_117695449 | 28.74 |
ENST00000292079.2
|
FXYD2
|
FXYD domain containing ion transport regulator 2 |
| chr7_-_44580861 | 28.69 |
ENST00000546276.1
ENST00000289547.4 ENST00000381160.3 ENST00000423141.1 |
NPC1L1
|
NPC1-like 1 |
| chr17_+_73642486 | 28.30 |
ENST00000579469.1
|
SMIM6
|
small integral membrane protein 6 |
| chr7_+_45927956 | 28.14 |
ENST00000275525.3
ENST00000457280.1 |
IGFBP1
|
insulin-like growth factor binding protein 1 |
| chr5_+_176514413 | 27.92 |
ENST00000513166.1
|
FGFR4
|
fibroblast growth factor receptor 4 |
| chr6_+_50061315 | 25.65 |
ENST00000415106.1
|
RP11-397G17.1
|
RP11-397G17.1 |
| chr4_+_100495864 | 25.60 |
ENST00000265517.5
ENST00000422897.2 |
MTTP
|
microsomal triglyceride transfer protein |
| chr8_-_124749609 | 25.32 |
ENST00000262219.6
ENST00000419625.1 |
ANXA13
|
annexin A13 |
| chr1_+_57320437 | 25.07 |
ENST00000361249.3
|
C8A
|
complement component 8, alpha polypeptide |
| chr2_-_87248975 | 24.89 |
ENST00000409310.2
ENST00000355705.3 |
PLGLB1
|
plasminogen-like B1 |
| chr6_-_52628271 | 24.60 |
ENST00000493422.1
|
GSTA2
|
glutathione S-transferase alpha 2 |
| chr7_+_45928079 | 24.47 |
ENST00000468955.1
|
IGFBP1
|
insulin-like growth factor binding protein 1 |
| chr12_+_100867733 | 24.01 |
ENST00000546380.1
|
NR1H4
|
nuclear receptor subfamily 1, group H, member 4 |
| chr1_+_55505184 | 24.01 |
ENST00000302118.5
|
PCSK9
|
proprotein convertase subtilisin/kexin type 9 |
| chr1_+_18807424 | 23.86 |
ENST00000400664.1
|
KLHDC7A
|
kelch domain containing 7A |
| chr1_-_20141763 | 23.70 |
ENST00000375121.2
|
RNF186
|
ring finger protein 186 |
| chr11_+_64323098 | 23.58 |
ENST00000301891.4
|
SLC22A11
|
solute carrier family 22 (organic anion/urate transporter), member 11 |
| chr16_-_69385681 | 23.22 |
ENST00000288025.3
|
TMED6
|
transmembrane emp24 protein transport domain containing 6 |
| chr14_+_95027772 | 22.80 |
ENST00000555095.1
ENST00000298841.5 ENST00000554220.1 ENST00000553780.1 |
SERPINA4
SERPINA5
|
serpin peptidase inhibitor, clade A (alpha-1 antiproteinase, antitrypsin), member 4 serpin peptidase inhibitor, clade A (alpha-1 antiproteinase, antitrypsin), member 5 |
| chr12_+_100897130 | 22.66 |
ENST00000551379.1
ENST00000188403.7 ENST00000551184.1 |
NR1H4
|
nuclear receptor subfamily 1, group H, member 4 |
| chr11_-_111649074 | 22.51 |
ENST00000534218.1
|
RP11-108O10.2
|
RP11-108O10.2 |
| chr1_+_119911425 | 22.47 |
ENST00000361035.4
ENST00000325945.3 |
HAO2
|
hydroxyacid oxidase 2 (long chain) |
| chr21_-_47575481 | 22.44 |
ENST00000291670.5
ENST00000397748.1 ENST00000359679.2 ENST00000355384.2 ENST00000397746.3 ENST00000397743.1 |
FTCD
|
formimidoyltransferase cyclodeaminase |
| chr15_+_48498480 | 21.95 |
ENST00000380993.3
ENST00000396577.3 |
SLC12A1
|
solute carrier family 12 (sodium/potassium/chloride transporter), member 1 |
| chr17_+_1646130 | 21.87 |
ENST00000453066.1
ENST00000324015.3 ENST00000450523.2 ENST00000453723.1 ENST00000382061.4 |
SERPINF2
|
serpin peptidase inhibitor, clade F (alpha-2 antiplasmin, pigment epithelium derived factor), member 2 |
| chr4_+_74301880 | 21.55 |
ENST00000395792.2
ENST00000226359.2 |
AFP
|
alpha-fetoprotein |
| chr14_-_65409438 | 21.51 |
ENST00000557049.1
|
GPX2
|
glutathione peroxidase 2 (gastrointestinal) |
| chr14_-_65409502 | 21.33 |
ENST00000389614.5
|
GPX2
|
glutathione peroxidase 2 (gastrointestinal) |
| chr4_+_169013666 | 20.84 |
ENST00000359299.3
|
ANXA10
|
annexin A10 |
| chr4_-_69434245 | 20.50 |
ENST00000317746.2
|
UGT2B17
|
UDP glucuronosyltransferase 2 family, polypeptide B17 |
| chr1_+_207262170 | 20.34 |
ENST00000367078.3
|
C4BPB
|
complement component 4 binding protein, beta |
| chr11_+_46740730 | 19.84 |
ENST00000311907.5
ENST00000530231.1 ENST00000442468.1 |
F2
|
coagulation factor II (thrombin) |
| chr2_+_133174147 | 19.08 |
ENST00000329321.3
|
GPR39
|
G protein-coupled receptor 39 |
| chr7_-_155601766 | 18.13 |
ENST00000430104.1
|
SHH
|
sonic hedgehog |
| chr10_+_45406627 | 18.10 |
ENST00000389583.4
|
TMEM72
|
transmembrane protein 72 |
| chr11_+_64323156 | 18.07 |
ENST00000377585.3
|
SLC22A11
|
solute carrier family 22 (organic anion/urate transporter), member 11 |
| chr11_-_26744908 | 18.04 |
ENST00000533617.1
|
SLC5A12
|
solute carrier family 5 (sodium/monocarboxylate cotransporter), member 12 |
| chr10_+_5135981 | 18.01 |
ENST00000380554.3
|
AKR1C3
|
aldo-keto reductase family 1, member C3 |
| chr14_+_21156915 | 17.93 |
ENST00000397990.4
ENST00000555597.1 |
ANG
RNASE4
|
angiogenin, ribonuclease, RNase A family, 5 ribonuclease, RNase A family, 4 |
| chr10_+_99344071 | 17.41 |
ENST00000370647.4
ENST00000370646.4 |
HOGA1
|
4-hydroxy-2-oxoglutarate aldolase 1 |
| chr1_+_119911396 | 17.27 |
ENST00000457318.1
|
HAO2
|
hydroxyacid oxidase 2 (long chain) |
| chr3_-_74570291 | 17.09 |
ENST00000263665.6
|
CNTN3
|
contactin 3 (plasmacytoma associated) |
| chr10_-_52645416 | 16.66 |
ENST00000374001.2
ENST00000373997.3 ENST00000373995.3 ENST00000282641.2 ENST00000395495.1 ENST00000414883.1 |
A1CF
|
APOBEC1 complementation factor |
| chr12_+_21284118 | 16.42 |
ENST00000256958.2
|
SLCO1B1
|
solute carrier organic anion transporter family, member 1B1 |
| chr6_-_51952367 | 16.19 |
ENST00000340994.4
|
PKHD1
|
polycystic kidney and hepatic disease 1 (autosomal recessive) |
| chr5_-_138718973 | 15.69 |
ENST00000353963.3
ENST00000348729.3 |
SLC23A1
|
solute carrier family 23 (ascorbic acid transporter), member 1 |
| chr1_+_207262578 | 15.63 |
ENST00000243611.5
ENST00000367076.3 |
C4BPB
|
complement component 4 binding protein, beta |
| chr12_+_20963632 | 15.35 |
ENST00000540853.1
ENST00000261196.2 |
SLCO1B3
|
solute carrier organic anion transporter family, member 1B3 |
| chr3_-_169587621 | 15.19 |
ENST00000523069.1
ENST00000316428.5 ENST00000264676.5 |
LRRC31
|
leucine rich repeat containing 31 |
| chr1_+_207262627 | 14.58 |
ENST00000391923.1
|
C4BPB
|
complement component 4 binding protein, beta |
| chr12_+_20963647 | 14.53 |
ENST00000381545.3
|
SLCO1B3
|
solute carrier organic anion transporter family, member 1B3 |
| chr15_-_99057551 | 14.32 |
ENST00000558256.1
|
FAM169B
|
family with sequence similarity 169, member B |
| chr16_+_82068873 | 14.04 |
ENST00000566213.1
|
HSD17B2
|
hydroxysteroid (17-beta) dehydrogenase 2 |
| chr4_-_987217 | 13.42 |
ENST00000361661.2
ENST00000398516.2 |
SLC26A1
|
solute carrier family 26 (anion exchanger), member 1 |
| chr16_+_82068585 | 13.29 |
ENST00000563491.1
|
HSD17B2
|
hydroxysteroid (17-beta) dehydrogenase 2 |
| chr10_-_61495760 | 12.80 |
ENST00000395347.1
|
SLC16A9
|
solute carrier family 16, member 9 |
| chr6_+_54173227 | 12.62 |
ENST00000259782.4
ENST00000370864.3 |
TINAG
|
tubulointerstitial nephritis antigen |
| chr16_+_21244986 | 12.47 |
ENST00000311620.5
|
ANKS4B
|
ankyrin repeat and sterile alpha motif domain containing 4B |
| chr11_+_560956 | 12.46 |
ENST00000397582.3
ENST00000344375.4 ENST00000397583.3 |
RASSF7
|
Ras association (RalGDS/AF-6) domain family (N-terminal) member 7 |
| chr16_-_66952742 | 12.34 |
ENST00000565235.2
ENST00000568632.1 ENST00000565796.1 |
CDH16
|
cadherin 16, KSP-cadherin |
| chr16_-_66952779 | 12.32 |
ENST00000570262.1
ENST00000394055.3 ENST00000299752.4 |
CDH16
|
cadherin 16, KSP-cadherin |
| chr6_-_154751629 | 12.26 |
ENST00000424998.1
|
CNKSR3
|
CNKSR family member 3 |
| chr17_+_26800296 | 12.07 |
ENST00000444914.3
ENST00000314669.5 |
SLC13A2
|
solute carrier family 13 (sodium-dependent dicarboxylate transporter), member 2 |
| chr15_+_58430368 | 11.83 |
ENST00000558772.1
ENST00000219919.4 |
AQP9
|
aquaporin 9 |
| chr5_-_35195338 | 11.82 |
ENST00000509839.1
|
PRLR
|
prolactin receptor |
| chr10_-_52645379 | 11.81 |
ENST00000395489.2
|
A1CF
|
APOBEC1 complementation factor |
| chr4_+_39408470 | 11.72 |
ENST00000257408.4
|
KLB
|
klotho beta |
| chr16_-_55909255 | 11.62 |
ENST00000290567.9
|
CES5A
|
carboxylesterase 5A |
| chr6_+_54172653 | 11.47 |
ENST00000370869.3
|
TINAG
|
tubulointerstitial nephritis antigen |
| chr16_-_55909272 | 11.40 |
ENST00000319165.9
|
CES5A
|
carboxylesterase 5A |
| chr15_+_58430567 | 11.06 |
ENST00000536493.1
|
AQP9
|
aquaporin 9 |
| chr19_+_6464243 | 10.96 |
ENST00000600229.1
ENST00000356762.3 |
CRB3
|
crumbs homolog 3 (Drosophila) |
| chr1_+_162351503 | 10.96 |
ENST00000458626.2
|
C1orf226
|
chromosome 1 open reading frame 226 |
| chr16_-_55909211 | 10.90 |
ENST00000520435.1
|
CES5A
|
carboxylesterase 5A |
| chr16_-_87970122 | 10.70 |
ENST00000309893.2
|
CA5A
|
carbonic anhydrase VA, mitochondrial |
| chr4_-_69536346 | 10.46 |
ENST00000338206.5
|
UGT2B15
|
UDP glucuronosyltransferase 2 family, polypeptide B15 |
| chr17_+_68071389 | 10.43 |
ENST00000283936.1
ENST00000392671.1 |
KCNJ16
|
potassium inwardly-rectifying channel, subfamily J, member 16 |
| chr7_-_150020750 | 10.28 |
ENST00000539352.1
|
ACTR3C
|
ARP3 actin-related protein 3 homolog C (yeast) |
| chr17_-_202579 | 10.16 |
ENST00000577079.1
ENST00000331302.7 ENST00000536489.2 |
RPH3AL
|
rabphilin 3A-like (without C2 domains) |
| chr2_-_99917639 | 10.13 |
ENST00000308528.4
|
LYG1
|
lysozyme G-like 1 |
| chr3_-_157221128 | 10.02 |
ENST00000392833.2
ENST00000362010.2 |
VEPH1
|
ventricular zone expressed PH domain-containing 1 |
| chr6_+_167704798 | 10.01 |
ENST00000230256.3
|
UNC93A
|
unc-93 homolog A (C. elegans) |
| chr17_+_68071458 | 9.79 |
ENST00000589377.1
|
KCNJ16
|
potassium inwardly-rectifying channel, subfamily J, member 16 |
| chr14_+_39703112 | 9.74 |
ENST00000555143.1
ENST00000280082.3 |
MIA2
|
melanoma inhibitory activity 2 |
| chr11_+_64358686 | 9.58 |
ENST00000473690.1
|
SLC22A12
|
solute carrier family 22 (organic anion/urate transporter), member 12 |
| chr4_-_100212132 | 9.49 |
ENST00000209668.2
|
ADH1A
|
alcohol dehydrogenase 1A (class I), alpha polypeptide |
| chr6_+_167704838 | 9.25 |
ENST00000366829.2
|
UNC93A
|
unc-93 homolog A (C. elegans) |
| chr19_+_6464502 | 9.22 |
ENST00000308243.7
|
CRB3
|
crumbs homolog 3 (Drosophila) |
| chr16_+_81272287 | 9.06 |
ENST00000425577.2
ENST00000564552.1 |
BCMO1
|
beta-carotene 15,15'-monooxygenase 1 |
| chr2_+_38177575 | 8.58 |
ENST00000407257.1
ENST00000417700.2 ENST00000234195.3 ENST00000442857.1 |
RMDN2
|
regulator of microtubule dynamics 2 |
| chr7_-_150020814 | 8.44 |
ENST00000477871.1
|
ACTR3C
|
ARP3 actin-related protein 3 homolog C (yeast) |
| chr9_-_98079965 | 8.12 |
ENST00000289081.3
|
FANCC
|
Fanconi anemia, complementation group C |
| chr1_-_153585539 | 8.10 |
ENST00000368706.4
|
S100A16
|
S100 calcium binding protein A16 |
| chr17_-_26733604 | 7.87 |
ENST00000584426.1
ENST00000584995.1 |
SLC46A1
|
solute carrier family 46 (folate transporter), member 1 |
| chr7_-_104567066 | 7.87 |
ENST00000453666.1
|
RP11-325F22.5
|
RP11-325F22.5 |
| chr3_+_72200408 | 7.80 |
ENST00000473713.1
|
LINC00870
|
long intergenic non-protein coding RNA 870 |
| chr16_+_20911174 | 7.78 |
ENST00000568663.1
|
LYRM1
|
LYR motif containing 1 |
| chr11_-_26743546 | 7.78 |
ENST00000280467.6
ENST00000396005.3 |
SLC5A12
|
solute carrier family 5 (sodium/monocarboxylate cotransporter), member 12 |
| chr7_-_150020578 | 7.69 |
ENST00000478393.1
|
ACTR3C
|
ARP3 actin-related protein 3 homolog C (yeast) |
| chr22_-_38506619 | 7.62 |
ENST00000332536.5
ENST00000381669.3 |
BAIAP2L2
|
BAI1-associated protein 2-like 2 |
| chr17_+_26800648 | 7.56 |
ENST00000545060.1
|
SLC13A2
|
solute carrier family 13 (sodium-dependent dicarboxylate transporter), member 2 |
| chr11_+_64358722 | 7.37 |
ENST00000336464.7
|
SLC22A12
|
solute carrier family 22 (organic anion/urate transporter), member 12 |
| chr17_+_26800756 | 7.15 |
ENST00000537681.1
|
SLC13A2
|
solute carrier family 13 (sodium-dependent dicarboxylate transporter), member 2 |
| chr18_-_48346415 | 7.11 |
ENST00000431965.2
ENST00000436348.2 |
MRO
|
maestro |
| chr14_+_39703084 | 6.99 |
ENST00000553728.1
|
RP11-407N17.3
|
cTAGE family member 5 isoform 4 |
| chr4_-_1166954 | 6.98 |
ENST00000514490.1
ENST00000431380.1 ENST00000503765.1 |
SPON2
|
spondin 2, extracellular matrix protein |
| chr2_+_182850551 | 6.95 |
ENST00000452904.1
ENST00000409137.3 ENST00000280295.3 |
PPP1R1C
|
protein phosphatase 1, regulatory (inhibitor) subunit 1C |
| chr2_-_162931052 | 6.77 |
ENST00000360534.3
|
DPP4
|
dipeptidyl-peptidase 4 |
| chr4_+_71494461 | 6.67 |
ENST00000396073.3
|
ENAM
|
enamelin |
| chr21_+_39628852 | 6.34 |
ENST00000398938.2
|
KCNJ15
|
potassium inwardly-rectifying channel, subfamily J, member 15 |
| chr5_+_73109339 | 6.28 |
ENST00000296799.4
|
ARHGEF28
|
Rho guanine nucleotide exchange factor (GEF) 28 |
| chrX_-_124097620 | 6.24 |
ENST00000371130.3
ENST00000422452.2 |
TENM1
|
teneurin transmembrane protein 1 |
| chr22_+_32439019 | 6.19 |
ENST00000266088.4
|
SLC5A1
|
solute carrier family 5 (sodium/glucose cotransporter), member 1 |
| chr4_+_159442878 | 5.98 |
ENST00000307765.5
ENST00000423548.1 |
RXFP1
|
relaxin/insulin-like family peptide receptor 1 |
| chr7_-_27219632 | 5.98 |
ENST00000470747.4
|
RP1-170O19.20
|
Uncharacterized protein |
| chr13_+_96085847 | 5.93 |
ENST00000376873.3
|
CLDN10
|
claudin 10 |
| chr10_-_72648541 | 5.88 |
ENST00000299299.3
|
PCBD1
|
pterin-4 alpha-carbinolamine dehydratase/dimerization cofactor of hepatocyte nuclear factor 1 alpha |
| chr12_+_100750846 | 5.67 |
ENST00000323346.5
|
SLC17A8
|
solute carrier family 17 (vesicular glutamate transporter), member 8 |
| chr21_+_39628780 | 5.56 |
ENST00000417042.1
|
KCNJ15
|
potassium inwardly-rectifying channel, subfamily J, member 15 |
| chr2_+_21444025 | 5.55 |
ENST00000435237.1
ENST00000457901.1 |
AC067959.1
|
AC067959.1 |
| chr4_-_987164 | 5.31 |
ENST00000398520.2
|
SLC26A1
|
solute carrier family 26 (anion exchanger), member 1 |
| chr12_-_102874102 | 5.25 |
ENST00000392905.2
|
IGF1
|
insulin-like growth factor 1 (somatomedin C) |
| chr4_+_159443090 | 5.22 |
ENST00000343542.5
ENST00000470033.1 |
RXFP1
|
relaxin/insulin-like family peptide receptor 1 |
| chr4_+_8201091 | 5.06 |
ENST00000382521.3
ENST00000245105.3 ENST00000457650.2 ENST00000539824.1 |
SH3TC1
|
SH3 domain and tetratricopeptide repeats 1 |
| chr21_+_39628655 | 5.05 |
ENST00000398925.1
ENST00000398928.1 ENST00000328656.4 ENST00000443341.1 |
KCNJ15
|
potassium inwardly-rectifying channel, subfamily J, member 15 |
| chr4_+_159443024 | 4.90 |
ENST00000448688.2
|
RXFP1
|
relaxin/insulin-like family peptide receptor 1 |
| chr22_-_30970560 | 4.86 |
ENST00000402369.1
ENST00000406361.1 |
GAL3ST1
|
galactose-3-O-sulfotransferase 1 |
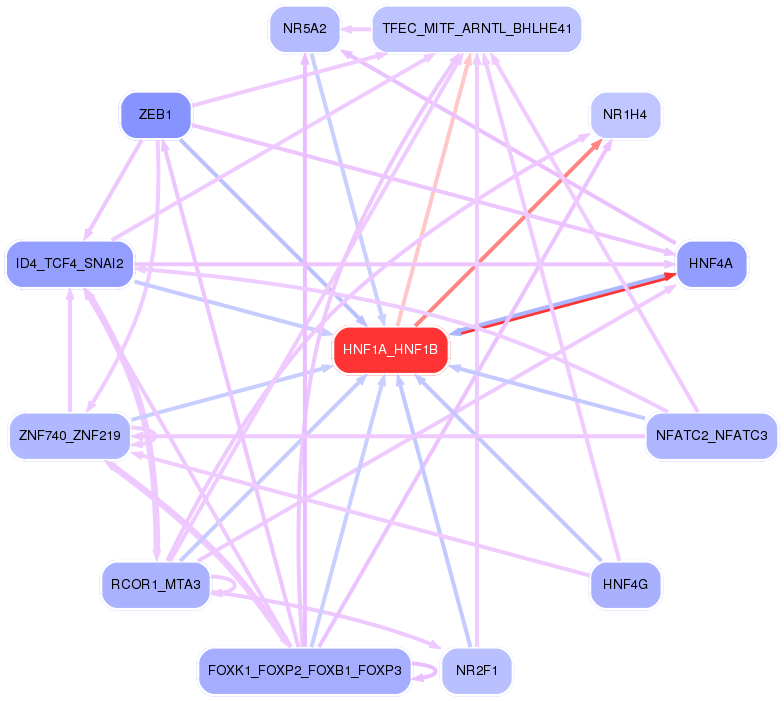
Network of associatons between targets according to the STRING database.

First level regulatory network of HNF1A_HNF1B
Gene Ontology Analysis
Gene overrepresentation in biological_process category:
| Log-likelihood per target | Total log-likelihood | Term | Description |
|---|---|---|---|
| 39.7 | 198.5 | GO:0070980 | biphenyl catabolic process(GO:0070980) |
| 34.0 | 170.1 | GO:0051919 | positive regulation of fibrinolysis(GO:0051919) |
| 32.3 | 32.3 | GO:0006789 | bilirubin conjugation(GO:0006789) |
| 27.7 | 110.6 | GO:2001248 | nitrogen catabolite regulation of transcription from RNA polymerase II promoter(GO:0001079) nitrogen catabolite activation of transcription from RNA polymerase II promoter(GO:0001080) regulation of urea metabolic process(GO:0034255) intracellular bile acid receptor signaling pathway(GO:0038185) interleukin-17 secretion(GO:0072615) nitrogen catabolite regulation of transcription(GO:0090293) nitrogen catabolite activation of transcription(GO:0090294) regulation of nitrogen cycle metabolic process(GO:1903314) positive regulation of glutamate metabolic process(GO:2000213) regulation of ammonia assimilation cycle(GO:2001248) positive regulation of ammonia assimilation cycle(GO:2001250) |
| 19.7 | 276.4 | GO:0043152 | induction of bacterial agglutination(GO:0043152) |
| 18.1 | 126.5 | GO:0008218 | bioluminescence(GO:0008218) |
| 16.3 | 162.7 | GO:0045959 | regulation of complement activation, classical pathway(GO:0030450) negative regulation of complement activation, classical pathway(GO:0045959) |
| 16.2 | 97.1 | GO:1903412 | response to bile acid(GO:1903412) |
| 15.8 | 47.5 | GO:0090675 | intermicrovillar adhesion(GO:0090675) |
| 15.7 | 47.2 | GO:0052314 | phytoalexin metabolic process(GO:0052314) |
| 15.6 | 46.9 | GO:0052331 | hemolysis by symbiont of host erythrocytes(GO:0019836) hemolysis in other organism(GO:0044179) hemolysis in other organism involved in symbiotic interaction(GO:0052331) |
| 14.8 | 44.4 | GO:0016999 | antibiotic metabolic process(GO:0016999) |
| 14.3 | 185.5 | GO:0051918 | negative regulation of fibrinolysis(GO:0051918) |
| 12.5 | 87.3 | GO:0010133 | proline catabolic process to glutamate(GO:0010133) |
| 12.2 | 122.2 | GO:2000189 | positive regulation of cholesterol homeostasis(GO:2000189) |
| 10.5 | 73.3 | GO:0052696 | flavonoid glucuronidation(GO:0052696) xenobiotic glucuronidation(GO:0052697) |
| 8.8 | 70.2 | GO:0009441 | glycolate metabolic process(GO:0009441) |
| 8.7 | 17.4 | GO:0019470 | 4-hydroxyproline catabolic process(GO:0019470) |
| 8.0 | 24.0 | GO:2000646 | positive regulation of receptor catabolic process(GO:2000646) |
| 7.6 | 167.5 | GO:0046415 | urate metabolic process(GO:0046415) |
| 7.3 | 43.6 | GO:0010760 | negative regulation of macrophage chemotaxis(GO:0010760) |
| 7.0 | 83.8 | GO:0052695 | cellular glucuronidation(GO:0052695) |
| 6.2 | 80.7 | GO:0070327 | thyroid hormone transport(GO:0070327) |
| 6.0 | 18.1 | GO:0060738 | intein-mediated protein splicing(GO:0016539) protein splicing(GO:0030908) positive regulation of immature T cell proliferation in thymus(GO:0033092) right lung development(GO:0060458) primary prostatic bud elongation(GO:0060516) epithelial-mesenchymal signaling involved in prostate gland development(GO:0060738) |
| 6.0 | 18.0 | GO:2000224 | sesquiterpenoid metabolic process(GO:0006714) sesquiterpenoid catabolic process(GO:0016107) farnesol metabolic process(GO:0016487) farnesol catabolic process(GO:0016488) regulation of testosterone biosynthetic process(GO:2000224) |
| 5.3 | 68.6 | GO:0008228 | opsonization(GO:0008228) |
| 5.2 | 15.7 | GO:0015882 | L-ascorbic acid transport(GO:0015882) transepithelial L-ascorbic acid transport(GO:0070904) |
| 5.1 | 30.7 | GO:0010193 | response to ozone(GO:0010193) |
| 4.6 | 22.9 | GO:0015722 | canalicular bile acid transport(GO:0015722) |
| 4.4 | 30.6 | GO:0055091 | phospholipid homeostasis(GO:0055091) |
| 4.2 | 266.5 | GO:0051180 | vitamin transport(GO:0051180) |
| 3.8 | 80.2 | GO:0034374 | low-density lipoprotein particle remodeling(GO:0034374) |
| 3.8 | 22.8 | GO:0061107 | seminal vesicle development(GO:0061107) |
| 3.7 | 118.5 | GO:0035435 | phosphate ion transmembrane transport(GO:0035435) |
| 3.2 | 22.4 | GO:0043606 | histidine catabolic process to glutamate and formamide(GO:0019556) histidine catabolic process to glutamate and formate(GO:0019557) formamide metabolic process(GO:0043606) |
| 3.1 | 12.5 | GO:1904106 | protein localization to microvillus(GO:1904106) |
| 3.0 | 17.9 | GO:0006651 | diacylglycerol biosynthetic process(GO:0006651) |
| 3.0 | 32.8 | GO:0036112 | medium-chain fatty-acyl-CoA metabolic process(GO:0036112) |
| 2.7 | 43.8 | GO:0035542 | regulation of SNARE complex assembly(GO:0035542) |
| 2.4 | 41.3 | GO:0032000 | positive regulation of fatty acid beta-oxidation(GO:0032000) |
| 2.3 | 25.6 | GO:0034378 | chylomicron assembly(GO:0034378) |
| 2.2 | 6.7 | GO:0070175 | positive regulation of enamel mineralization(GO:0070175) |
| 2.2 | 28.5 | GO:0016554 | cytidine to uridine editing(GO:0016554) |
| 1.9 | 18.7 | GO:0034036 | purine ribonucleoside bisphosphate biosynthetic process(GO:0034036) 3'-phosphoadenosine 5'-phosphosulfate biosynthetic process(GO:0050428) |
| 1.5 | 11.8 | GO:0038161 | prolactin signaling pathway(GO:0038161) |
| 1.5 | 11.7 | GO:0090080 | positive regulation of MAPKKK cascade by fibroblast growth factor receptor signaling pathway(GO:0090080) |
| 1.4 | 52.6 | GO:0043567 | regulation of insulin-like growth factor receptor signaling pathway(GO:0043567) |
| 1.4 | 28.7 | GO:1990573 | potassium ion import across plasma membrane(GO:1990573) |
| 1.3 | 27.3 | GO:0006703 | estrogen biosynthetic process(GO:0006703) |
| 1.3 | 10.1 | GO:0000270 | peptidoglycan metabolic process(GO:0000270) peptidoglycan catabolic process(GO:0009253) |
| 1.3 | 25.1 | GO:0006957 | complement activation, alternative pathway(GO:0006957) |
| 1.1 | 28.7 | GO:0098856 | intestinal cholesterol absorption(GO:0030299) intestinal lipid absorption(GO:0098856) |
| 1.1 | 21.5 | GO:0001542 | ovulation from ovarian follicle(GO:0001542) |
| 1.1 | 6.8 | GO:0010716 | negative regulation of extracellular matrix disassembly(GO:0010716) |
| 1.1 | 14.8 | GO:0035873 | lactate transport(GO:0015727) lactate transmembrane transport(GO:0035873) |
| 1.0 | 63.0 | GO:0055092 | cholesterol homeostasis(GO:0042632) sterol homeostasis(GO:0055092) |
| 0.8 | 36.5 | GO:0010107 | potassium ion import(GO:0010107) |
| 0.8 | 45.8 | GO:0010824 | regulation of centrosome duplication(GO:0010824) |
| 0.7 | 97.1 | GO:0030449 | regulation of complement activation(GO:0030449) |
| 0.7 | 28.9 | GO:0015721 | bile acid and bile salt transport(GO:0015721) |
| 0.7 | 6.2 | GO:0001951 | intestinal D-glucose absorption(GO:0001951) |
| 0.6 | 5.6 | GO:0000023 | maltose metabolic process(GO:0000023) |
| 0.6 | 7.8 | GO:0006682 | galactosylceramide biosynthetic process(GO:0006682) galactolipid biosynthetic process(GO:0019375) |
| 0.6 | 90.8 | GO:0032411 | positive regulation of transporter activity(GO:0032411) |
| 0.6 | 22.0 | GO:1901685 | glutathione derivative metabolic process(GO:1901685) glutathione derivative biosynthetic process(GO:1901687) |
| 0.5 | 5.9 | GO:0046146 | tetrahydrobiopterin biosynthetic process(GO:0006729) tetrahydrobiopterin metabolic process(GO:0046146) |
| 0.5 | 39.5 | GO:0006953 | acute-phase response(GO:0006953) |
| 0.5 | 32.2 | GO:0034314 | Arp2/3 complex-mediated actin nucleation(GO:0034314) |
| 0.5 | 4.7 | GO:0071896 | protein localization to adherens junction(GO:0071896) |
| 0.5 | 9.5 | GO:0006069 | ethanol oxidation(GO:0006069) |
| 0.4 | 4.2 | GO:0015747 | urate transport(GO:0015747) |
| 0.4 | 51.0 | GO:1990748 | cellular detoxification(GO:1990748) |
| 0.3 | 4.6 | GO:0015866 | ADP transport(GO:0015866) |
| 0.3 | 42.4 | GO:0009062 | fatty acid catabolic process(GO:0009062) |
| 0.3 | 2.9 | GO:0045218 | zonula adherens maintenance(GO:0045218) |
| 0.3 | 3.5 | GO:0006686 | sphingomyelin biosynthetic process(GO:0006686) |
| 0.3 | 7.6 | GO:2000251 | positive regulation of actin cytoskeleton reorganization(GO:2000251) |
| 0.3 | 13.3 | GO:0016339 | calcium-dependent cell-cell adhesion via plasma membrane cell adhesion molecules(GO:0016339) |
| 0.2 | 3.0 | GO:0006538 | glutamate catabolic process(GO:0006538) |
| 0.2 | 31.4 | GO:0006805 | xenobiotic metabolic process(GO:0006805) |
| 0.2 | 20.2 | GO:0070830 | bicellular tight junction assembly(GO:0070830) |
| 0.2 | 11.0 | GO:1900087 | positive regulation of G1/S transition of mitotic cell cycle(GO:1900087) |
| 0.2 | 3.7 | GO:0038203 | TORC2 signaling(GO:0038203) |
| 0.2 | 5.7 | GO:0089711 | L-glutamate transmembrane transport(GO:0089711) |
| 0.2 | 18.9 | GO:0006835 | dicarboxylic acid transport(GO:0006835) |
| 0.2 | 3.0 | GO:1902358 | sulfate transmembrane transport(GO:1902358) |
| 0.2 | 5.9 | GO:0016338 | calcium-independent cell-cell adhesion via plasma membrane cell-adhesion molecules(GO:0016338) |
| 0.2 | 10.7 | GO:0006730 | one-carbon metabolic process(GO:0006730) |
| 0.2 | 6.2 | GO:0006359 | regulation of transcription from RNA polymerase III promoter(GO:0006359) |
| 0.2 | 10.2 | GO:0045744 | negative regulation of G-protein coupled receptor protein signaling pathway(GO:0045744) |
| 0.1 | 22.0 | GO:1902476 | chloride transmembrane transport(GO:1902476) |
| 0.1 | 5.4 | GO:0048286 | lung alveolus development(GO:0048286) |
| 0.1 | 17.3 | GO:0006501 | C-terminal protein lipidation(GO:0006501) |
| 0.1 | 0.9 | GO:0000066 | mitochondrial ornithine transport(GO:0000066) |
| 0.1 | 1.3 | GO:0055059 | asymmetric neuroblast division(GO:0055059) |
| 0.1 | 3.7 | GO:0010738 | regulation of protein kinase A signaling(GO:0010738) |
| 0.1 | 0.8 | GO:0019471 | 4-hydroxyproline metabolic process(GO:0019471) |
| 0.1 | 4.1 | GO:0034198 | cellular response to amino acid starvation(GO:0034198) |
| 0.1 | 30.3 | GO:0007018 | microtubule-based movement(GO:0007018) |
| 0.1 | 28.6 | GO:0007596 | blood coagulation(GO:0007596) |
| 0.1 | 6.3 | GO:0048013 | ephrin receptor signaling pathway(GO:0048013) |
| 0.1 | 12.5 | GO:0070507 | regulation of microtubule cytoskeleton organization(GO:0070507) |
| 0.1 | 0.9 | GO:0061635 | regulation of protein complex stability(GO:0061635) |
| 0.1 | 10.8 | GO:0007188 | adenylate cyclase-modulating G-protein coupled receptor signaling pathway(GO:0007188) |
| 0.0 | 5.7 | GO:0051592 | response to calcium ion(GO:0051592) |
| 0.0 | 2.6 | GO:0002292 | T cell differentiation involved in immune response(GO:0002292) |
| 0.0 | 0.2 | GO:0036444 | calcium ion transmembrane import into mitochondrion(GO:0036444) |
| 0.0 | 84.4 | GO:0006508 | proteolysis(GO:0006508) |
| 0.0 | 2.2 | GO:0034605 | cellular response to heat(GO:0034605) |
| 0.0 | 15.2 | GO:0016567 | protein ubiquitination(GO:0016567) |
| 0.0 | 2.7 | GO:0070125 | mitochondrial translational elongation(GO:0070125) |
| 0.0 | 2.6 | GO:0007498 | mesoderm development(GO:0007498) |
| 0.0 | 1.1 | GO:0070301 | cellular response to hydrogen peroxide(GO:0070301) |
| 0.0 | 0.5 | GO:0043968 | histone H2A acetylation(GO:0043968) |
Gene overrepresentation in cellular_component category:
| Log-likelihood per target | Total log-likelihood | Term | Description |
|---|---|---|---|
| 23.7 | 332.1 | GO:0005577 | fibrinogen complex(GO:0005577) |
| 10.3 | 93.0 | GO:0031232 | extrinsic component of external side of plasma membrane(GO:0031232) |
| 9.5 | 47.5 | GO:0044214 | spanning component of plasma membrane(GO:0044214) spanning component of membrane(GO:0089717) |
| 9.5 | 28.5 | GO:0030895 | apolipoprotein B mRNA editing enzyme complex(GO:0030895) |
| 8.3 | 198.5 | GO:0034663 | endoplasmic reticulum chaperone complex(GO:0034663) |
| 7.0 | 125.7 | GO:0031089 | platelet dense granule lumen(GO:0031089) |
| 6.9 | 68.7 | GO:0005579 | membrane attack complex(GO:0005579) |
| 4.0 | 48.3 | GO:0046581 | intercellular canaliculus(GO:0046581) |
| 2.6 | 17.9 | GO:0032311 | angiogenin-PRI complex(GO:0032311) |
| 2.3 | 41.3 | GO:0045179 | apical cortex(GO:0045179) |
| 2.2 | 22.4 | GO:0030868 | smooth endoplasmic reticulum membrane(GO:0030868) smooth endoplasmic reticulum part(GO:0097425) |
| 2.2 | 110.6 | GO:0005719 | nuclear euchromatin(GO:0005719) |
| 1.9 | 15.3 | GO:0035867 | alphav-beta3 integrin-IGF-1-IGF1R complex(GO:0035867) |
| 1.9 | 5.7 | GO:0097451 | glial limiting end-foot(GO:0097451) |
| 1.8 | 461.1 | GO:0072562 | blood microparticle(GO:0072562) |
| 1.8 | 45.8 | GO:0031362 | anchored component of external side of plasma membrane(GO:0031362) |
| 1.5 | 143.2 | GO:0031526 | brush border membrane(GO:0031526) |
| 1.4 | 41.5 | GO:0034364 | high-density lipoprotein particle(GO:0034364) |
| 1.3 | 38.7 | GO:0034358 | plasma lipoprotein particle(GO:0034358) lipoprotein particle(GO:1990777) |
| 1.3 | 94.6 | GO:0005782 | peroxisomal matrix(GO:0005782) microbody lumen(GO:0031907) |
| 1.2 | 32.2 | GO:0005885 | Arp2/3 protein complex(GO:0005885) |
| 1.0 | 28.7 | GO:0005890 | sodium:potassium-exchanging ATPase complex(GO:0005890) |
| 0.7 | 8.1 | GO:0043240 | Fanconi anaemia nuclear complex(GO:0043240) |
| 0.5 | 260.1 | GO:0005788 | endoplasmic reticulum lumen(GO:0005788) |
| 0.4 | 7.6 | GO:0071439 | clathrin complex(GO:0071439) |
| 0.4 | 9.7 | GO:0070971 | endoplasmic reticulum exit site(GO:0070971) |
| 0.3 | 11.8 | GO:0031904 | endosome lumen(GO:0031904) |
| 0.3 | 35.6 | GO:0005871 | kinesin complex(GO:0005871) |
| 0.3 | 128.4 | GO:0016324 | apical plasma membrane(GO:0016324) |
| 0.3 | 44.1 | GO:0044216 | other organism(GO:0044215) other organism cell(GO:0044216) other organism part(GO:0044217) |
| 0.3 | 65.2 | GO:0031227 | intrinsic component of endoplasmic reticulum membrane(GO:0031227) |
| 0.3 | 128.8 | GO:0016323 | basolateral plasma membrane(GO:0016323) |
| 0.3 | 150.7 | GO:0030133 | transport vesicle(GO:0030133) |
| 0.3 | 462.6 | GO:0005615 | extracellular space(GO:0005615) |
| 0.2 | 150.0 | GO:0005759 | mitochondrial matrix(GO:0005759) |
| 0.2 | 23.9 | GO:0031463 | Cul3-RING ubiquitin ligase complex(GO:0031463) |
| 0.2 | 84.1 | GO:0005743 | mitochondrial inner membrane(GO:0005743) |
| 0.1 | 9.0 | GO:0005902 | microvillus(GO:0005902) |
| 0.1 | 3.7 | GO:0031932 | TORC2 complex(GO:0031932) |
| 0.1 | 156.9 | GO:0005789 | endoplasmic reticulum membrane(GO:0005789) |
| 0.1 | 17.3 | GO:0031225 | anchored component of membrane(GO:0031225) |
| 0.1 | 1.1 | GO:0001739 | sex chromatin(GO:0001739) |
| 0.1 | 15.6 | GO:0005886 | plasma membrane(GO:0005886) |
| 0.1 | 56.0 | GO:0000139 | Golgi membrane(GO:0000139) |
| 0.1 | 1.1 | GO:0031618 | nuclear pericentric heterochromatin(GO:0031618) |
| 0.1 | 1.8 | GO:0005795 | Golgi stack(GO:0005795) |
| 0.1 | 0.7 | GO:0000439 | core TFIIH complex(GO:0000439) |
| 0.1 | 7.8 | GO:0030496 | midbody(GO:0030496) |
| 0.0 | 5.9 | GO:0005923 | bicellular tight junction(GO:0005923) |
| 0.0 | 172.3 | GO:0005576 | extracellular region(GO:0005576) |
| 0.0 | 0.5 | GO:0032777 | Piccolo NuA4 histone acetyltransferase complex(GO:0032777) |
| 0.0 | 23.9 | GO:0005739 | mitochondrion(GO:0005739) |
| 0.0 | 52.6 | GO:0005887 | integral component of plasma membrane(GO:0005887) |
| 0.0 | 151.8 | GO:0005654 | nucleoplasm(GO:0005654) |
| 0.0 | 71.6 | GO:0016021 | integral component of membrane(GO:0016021) |
| 0.0 | 7.7 | GO:0005815 | microtubule organizing center(GO:0005815) |
| 0.0 | 7.1 | GO:0005730 | nucleolus(GO:0005730) |
Gene overrepresentation in molecular_function category:
| Log-likelihood per target | Total log-likelihood | Term | Description |
|---|---|---|---|
| 45.8 | 137.3 | GO:1902271 | D3 vitamins binding(GO:1902271) |
| 31.5 | 94.6 | GO:0052852 | (S)-2-hydroxy-acid oxidase activity(GO:0003973) very-long-chain-(S)-2-hydroxy-acid oxidase activity(GO:0052852) long-chain-(S)-2-hydroxy-long-chain-acid oxidase activity(GO:0052853) medium-chain-(S)-2-hydroxy-acid oxidase activity(GO:0052854) |
| 28.8 | 115.1 | GO:0008431 | vitamin E binding(GO:0008431) |
| 27.7 | 110.6 | GO:1902122 | chenodeoxycholic acid binding(GO:1902122) |
| 23.0 | 68.9 | GO:1904854 | proteasome core complex binding(GO:1904854) |
| 21.8 | 87.3 | GO:0004657 | proline dehydrogenase activity(GO:0004657) |
| 14.7 | 102.9 | GO:0060230 | lipoprotein lipase activator activity(GO:0060230) |
| 13.7 | 68.6 | GO:0033265 | choline binding(GO:0033265) |
| 9.8 | 127.1 | GO:0004321 | fatty-acyl-CoA synthase activity(GO:0004321) |
| 8.9 | 26.8 | GO:0015361 | low-affinity sodium:dicarboxylate symporter activity(GO:0015361) |
| 8.1 | 97.1 | GO:0005007 | fibroblast growth factor-activated receptor activity(GO:0005007) |
| 7.8 | 31.1 | GO:0050309 | glucose-6-phosphatase activity(GO:0004346) sugar-terminal-phosphatase activity(GO:0050309) |
| 7.4 | 147.6 | GO:0005436 | sodium:phosphate symporter activity(GO:0005436) |
| 7.3 | 387.9 | GO:0015020 | glucuronosyltransferase activity(GO:0015020) |
| 7.3 | 22.0 | GO:0008511 | sodium:potassium:chloride symporter activity(GO:0008511) |
| 7.2 | 36.0 | GO:0070095 | fructose-6-phosphate binding(GO:0070095) |
| 6.0 | 24.0 | GO:0070326 | very-low-density lipoprotein particle binding(GO:0034189) very-low-density lipoprotein particle receptor binding(GO:0070326) |
| 6.0 | 18.0 | GO:0047017 | geranylgeranyl reductase activity(GO:0045550) prostaglandin-F synthase activity(GO:0047017) |
| 5.9 | 41.3 | GO:0005324 | long-chain fatty acid transporter activity(GO:0005324) |
| 5.2 | 15.7 | GO:0008520 | L-ascorbate:sodium symporter activity(GO:0008520) L-ascorbic acid transporter activity(GO:0015229) sodium-dependent L-ascorbate transmembrane transporter activity(GO:0070890) |
| 4.6 | 22.9 | GO:0015254 | glycerol channel activity(GO:0015254) |
| 4.6 | 27.3 | GO:0047006 | 17-alpha,20-alpha-dihydroxypregn-4-en-3-one dehydrogenase activity(GO:0047006) |
| 4.0 | 32.0 | GO:0008241 | peptidyl-dipeptidase activity(GO:0008241) |
| 3.8 | 52.6 | GO:0031995 | insulin-like growth factor II binding(GO:0031995) |
| 3.7 | 58.6 | GO:0015143 | urate transmembrane transporter activity(GO:0015143) salt transmembrane transporter activity(GO:1901702) |
| 3.2 | 101.1 | GO:0070008 | serine-type exopeptidase activity(GO:0070008) |
| 3.1 | 80.2 | GO:0034185 | apolipoprotein binding(GO:0034185) |
| 3.0 | 169.1 | GO:0005504 | fatty acid binding(GO:0005504) |
| 2.8 | 22.4 | GO:0016841 | ammonia-lyase activity(GO:0016841) |
| 2.8 | 41.5 | GO:0043225 | anion transmembrane-transporting ATPase activity(GO:0043225) |
| 2.7 | 88.2 | GO:0017081 | chloride channel regulator activity(GO:0017081) |
| 2.6 | 17.9 | GO:0004522 | ribonuclease A activity(GO:0004522) |
| 2.5 | 17.4 | GO:0016833 | oxo-acid-lyase activity(GO:0016833) |
| 2.3 | 11.7 | GO:0008422 | beta-glucosidase activity(GO:0008422) |
| 2.3 | 22.8 | GO:0032190 | acrosin binding(GO:0032190) |
| 2.0 | 18.1 | GO:0043237 | laminin-1 binding(GO:0043237) |
| 2.0 | 11.8 | GO:0004925 | prolactin receptor activity(GO:0004925) |
| 2.0 | 5.9 | GO:0008124 | 4-alpha-hydroxytetrahydrobiopterin dehydratase activity(GO:0008124) |
| 1.9 | 11.2 | GO:0015350 | methotrexate transporter activity(GO:0015350) |
| 1.8 | 16.4 | GO:0015349 | thyroid hormone transmembrane transporter activity(GO:0015349) |
| 1.8 | 291.9 | GO:0004867 | serine-type endopeptidase inhibitor activity(GO:0004867) |
| 1.5 | 37.2 | GO:0015467 | G-protein activated inward rectifier potassium channel activity(GO:0015467) |
| 1.5 | 30.6 | GO:0004859 | phospholipase inhibitor activity(GO:0004859) |
| 1.3 | 30.7 | GO:0008391 | arachidonic acid monooxygenase activity(GO:0008391) arachidonic acid epoxygenase activity(GO:0008392) |
| 1.3 | 116.9 | GO:0005044 | scavenger receptor activity(GO:0005044) |
| 1.3 | 19.8 | GO:0070053 | thrombospondin receptor activity(GO:0070053) |
| 1.3 | 28.9 | GO:0015125 | bile acid transmembrane transporter activity(GO:0015125) |
| 1.3 | 42.8 | GO:0004602 | glutathione peroxidase activity(GO:0004602) |
| 1.2 | 28.7 | GO:0005391 | sodium:potassium-exchanging ATPase activity(GO:0005391) |
| 1.1 | 14.8 | GO:0015129 | lactate transmembrane transporter activity(GO:0015129) |
| 1.1 | 179.7 | GO:0051087 | chaperone binding(GO:0051087) |
| 1.1 | 9.5 | GO:0004024 | alcohol dehydrogenase activity, zinc-dependent(GO:0004024) |
| 1.0 | 21.7 | GO:0008271 | secondary active sulfate transmembrane transporter activity(GO:0008271) |
| 0.8 | 28.7 | GO:0031489 | myosin V binding(GO:0031489) |
| 0.8 | 6.7 | GO:0030021 | extracellular matrix structural constituent conferring compression resistance(GO:0030021) structural constituent of tooth enamel(GO:0030345) |
| 0.8 | 41.4 | GO:0008009 | chemokine activity(GO:0008009) |
| 0.8 | 10.2 | GO:0030274 | LIM domain binding(GO:0030274) |
| 0.8 | 3.0 | GO:0016639 | oxidoreductase activity, acting on the CH-NH2 group of donors, NAD or NADP as acceptor(GO:0016639) |
| 0.7 | 25.1 | GO:0001848 | complement binding(GO:0001848) |
| 0.7 | 47.2 | GO:0016831 | carboxy-lyase activity(GO:0016831) |
| 0.6 | 11.0 | GO:0004865 | protein serine/threonine phosphatase inhibitor activity(GO:0004865) |
| 0.6 | 7.8 | GO:0001733 | galactosylceramide sulfotransferase activity(GO:0001733) galactose 3-O-sulfotransferase activity(GO:0050694) |
| 0.6 | 5.6 | GO:0032450 | maltose alpha-glucosidase activity(GO:0032450) |
| 0.6 | 10.7 | GO:0004089 | carbonate dehydratase activity(GO:0004089) |
| 0.6 | 10.1 | GO:0003796 | lysozyme activity(GO:0003796) |
| 0.5 | 22.0 | GO:0004364 | glutathione transferase activity(GO:0004364) |
| 0.5 | 3.5 | GO:0047493 | sphingomyelin synthase activity(GO:0033188) ceramide cholinephosphotransferase activity(GO:0047493) |
| 0.5 | 2.9 | GO:0070573 | metallodipeptidase activity(GO:0070573) |
| 0.4 | 2.6 | GO:0008195 | phosphatidate phosphatase activity(GO:0008195) |
| 0.4 | 46.2 | GO:0005544 | calcium-dependent phospholipid binding(GO:0005544) |
| 0.4 | 15.3 | GO:0005158 | insulin receptor binding(GO:0005158) |
| 0.4 | 4.7 | GO:0086083 | cell adhesive protein binding involved in bundle of His cell-Purkinje myocyte communication(GO:0086083) |
| 0.4 | 121.6 | GO:0004252 | serine-type endopeptidase activity(GO:0004252) |
| 0.3 | 4.6 | GO:0005347 | ATP transmembrane transporter activity(GO:0005347) ADP transmembrane transporter activity(GO:0015217) |
| 0.3 | 12.8 | GO:0008028 | monocarboxylic acid transmembrane transporter activity(GO:0008028) |
| 0.2 | 4.2 | GO:0015101 | organic cation transmembrane transporter activity(GO:0015101) |
| 0.2 | 35.6 | GO:0003777 | microtubule motor activity(GO:0003777) |
| 0.2 | 4.1 | GO:0070513 | death domain binding(GO:0070513) |
| 0.2 | 21.2 | GO:0005548 | phospholipid transporter activity(GO:0005548) |
| 0.2 | 2.9 | GO:0031419 | cobalamin binding(GO:0031419) |
| 0.2 | 7.0 | GO:0001530 | lipopolysaccharide binding(GO:0001530) |
| 0.2 | 28.5 | GO:0003725 | double-stranded RNA binding(GO:0003725) |
| 0.2 | 5.7 | GO:0015172 | L-glutamate transmembrane transporter activity(GO:0005313) acidic amino acid transmembrane transporter activity(GO:0015172) |
| 0.2 | 62.0 | GO:0030674 | protein binding, bridging(GO:0030674) |
| 0.1 | 0.9 | GO:0000064 | L-ornithine transmembrane transporter activity(GO:0000064) |
| 0.1 | 3.7 | GO:0034237 | protein kinase A regulatory subunit binding(GO:0034237) |
| 0.1 | 24.1 | GO:0052689 | carboxylic ester hydrolase activity(GO:0052689) |
| 0.1 | 1.2 | GO:0032393 | MHC class I receptor activity(GO:0032393) |
| 0.1 | 0.8 | GO:0019826 | oxygen sensor activity(GO:0019826) |
| 0.1 | 11.6 | GO:0017124 | SH3 domain binding(GO:0017124) |
| 0.0 | 0.2 | GO:0017159 | pantetheine hydrolase activity(GO:0017159) |
| 0.0 | 93.9 | GO:0003723 | RNA binding(GO:0003723) |
| 0.0 | 31.2 | GO:0050839 | cell adhesion molecule binding(GO:0050839) |
| 0.0 | 0.9 | GO:0008239 | dipeptidyl-peptidase activity(GO:0008239) |
| 0.0 | 27.1 | GO:0004930 | G-protein coupled receptor activity(GO:0004930) |
| 0.0 | 0.6 | GO:0005328 | neurotransmitter:sodium symporter activity(GO:0005328) |
| 0.0 | 27.4 | GO:0004872 | receptor activity(GO:0004872) molecular transducer activity(GO:0060089) |
| 0.0 | 16.8 | GO:0004842 | ubiquitin-protein transferase activity(GO:0004842) |
| 0.0 | 1.5 | GO:0001158 | enhancer sequence-specific DNA binding(GO:0001158) |
| 0.0 | 4.3 | GO:0005543 | phospholipid binding(GO:0005543) |
| 0.0 | 0.2 | GO:0004691 | cAMP-dependent protein kinase activity(GO:0004691) |
Gene overrepresentation in curated gene sets: canonical pathways category:
| Log-likelihood per target | Total log-likelihood | Term | Description |
|---|---|---|---|
| 3.9 | 269.7 | PID INTEGRIN2 PATHWAY | Beta2 integrin cell surface interactions |
| 3.2 | 294.2 | PID HNF3B PATHWAY | FOXA2 and FOXA3 transcription factor networks |
| 1.8 | 110.6 | PID RXR VDR PATHWAY | RXR and RAR heterodimerization with other nuclear receptor |
| 1.7 | 108.5 | PID CD40 PATHWAY | CD40/CD40L signaling |
| 1.4 | 541.8 | NABA ECM REGULATORS | Genes encoding enzymes and their regulators involved in the remodeling of the extracellular matrix |
| 1.2 | 68.6 | PID IL6 7 PATHWAY | IL6-mediated signaling events |
| 0.8 | 100.2 | PID FGF PATHWAY | FGF signaling pathway |
| 0.8 | 72.4 | PID HNF3A PATHWAY | FOXA1 transcription factor network |
| 0.7 | 16.9 | PID INTEGRIN A9B1 PATHWAY | Alpha9 beta1 integrin signaling events |
| 0.4 | 42.8 | PID TAP63 PATHWAY | Validated transcriptional targets of TAp63 isoforms |
| 0.3 | 42.3 | PID AVB3 INTEGRIN PATHWAY | Integrins in angiogenesis |
| 0.3 | 35.0 | PID E2F PATHWAY | E2F transcription factor network |
| 0.2 | 8.1 | PID BARD1 PATHWAY | BARD1 signaling events |
| 0.2 | 54.0 | NABA ECM GLYCOPROTEINS | Genes encoding structural ECM glycoproteins |
| 0.1 | 11.8 | PID PTP1B PATHWAY | Signaling events mediated by PTP1B |
| 0.1 | 41.4 | NABA ECM AFFILIATED | Genes encoding proteins affiliated structurally or functionally to extracellular matrix proteins |
| 0.1 | 4.7 | PID AJDISS 2PATHWAY | Posttranslational regulation of adherens junction stability and dissassembly |
| 0.0 | 3.7 | PID MTOR 4PATHWAY | mTOR signaling pathway |
| 0.0 | 1.8 | PID CDC42 REG PATHWAY | Regulation of CDC42 activity |
Gene overrepresentation in curated gene sets: REACTOME pathways category:
| Log-likelihood per target | Total log-likelihood | Term | Description |
|---|---|---|---|
| 15.6 | 328.1 | REACTOME COMMON PATHWAY | Genes involved in Common Pathway |
| 10.5 | 324.7 | REACTOME GLUCURONIDATION | Genes involved in Glucuronidation |
| 8.4 | 259.9 | REACTOME REGULATION OF COMPLEMENT CASCADE | Genes involved in Regulation of Complement cascade |
| 5.3 | 137.2 | REACTOME COMPLEMENT CASCADE | Genes involved in Complement cascade |
| 5.1 | 92.2 | REACTOME RECYCLING OF BILE ACIDS AND SALTS | Genes involved in Recycling of bile acids and salts |
| 4.9 | 97.1 | REACTOME FGFR4 LIGAND BINDING AND ACTIVATION | Genes involved in FGFR4 ligand binding and activation |
| 4.3 | 121.6 | REACTOME REGULATION OF INSULIN LIKE GROWTH FACTOR IGF ACTIVITY BY INSULIN LIKE GROWTH FACTOR BINDING PROTEINS IGFBPS | Genes involved in Regulation of Insulin-like Growth Factor (IGF) Activity by Insulin-like Growth Factor Binding Proteins (IGFBPs) |
| 4.2 | 101.1 | REACTOME INTRINSIC PATHWAY | Genes involved in Intrinsic Pathway |
| 2.9 | 122.2 | REACTOME REGULATION OF GENE EXPRESSION IN BETA CELLS | Genes involved in Regulation of gene expression in beta cells |
| 2.7 | 137.3 | REACTOME STEROID HORMONES | Genes involved in Steroid hormones |
| 2.3 | 105.8 | REACTOME LIPOPROTEIN METABOLISM | Genes involved in Lipoprotein metabolism |
| 2.0 | 58.6 | REACTOME ORGANIC CATION ANION ZWITTERION TRANSPORT | Genes involved in Organic cation/anion/zwitterion transport |
| 1.7 | 30.7 | REACTOME XENOBIOTICS | Genes involved in Xenobiotics |
| 1.6 | 47.2 | REACTOME AMINE DERIVED HORMONES | Genes involved in Amine-derived hormones |
| 1.5 | 22.9 | REACTOME PASSIVE TRANSPORT BY AQUAPORINS | Genes involved in Passive Transport by Aquaporins |
| 1.0 | 67.1 | REACTOME GLUCOSE TRANSPORT | Genes involved in Glucose transport |
| 0.9 | 18.7 | REACTOME BILE SALT AND ORGANIC ANION SLC TRANSPORTERS | Genes involved in Bile salt and organic anion SLC transporters |
| 0.8 | 9.1 | REACTOME METABOLISM OF STEROID HORMONES AND VITAMINS A AND D | Genes involved in Metabolism of steroid hormones and vitamins A and D |
| 0.8 | 9.5 | REACTOME ABACAVIR TRANSPORT AND METABOLISM | Genes involved in Abacavir transport and metabolism |
| 0.8 | 41.5 | REACTOME ABC FAMILY PROTEINS MEDIATED TRANSPORT | Genes involved in ABC-family proteins mediated transport |
| 0.7 | 11.7 | REACTOME FGFR LIGAND BINDING AND ACTIVATION | Genes involved in FGFR ligand binding and activation |
| 0.7 | 37.2 | REACTOME INHIBITION OF VOLTAGE GATED CA2 CHANNELS VIA GBETA GAMMA SUBUNITS | Genes involved in Inhibition of voltage gated Ca2+ channels via Gbeta/gamma subunits |
| 0.7 | 10.7 | REACTOME REVERSIBLE HYDRATION OF CARBON DIOXIDE | Genes involved in Reversible Hydration of Carbon Dioxide |
| 0.6 | 99.4 | REACTOME RESPONSE TO ELEVATED PLATELET CYTOSOLIC CA2 | Genes involved in Response to elevated platelet cytosolic Ca2+ |
| 0.5 | 26.1 | REACTOME TIGHT JUNCTION INTERACTIONS | Genes involved in Tight junction interactions |
| 0.5 | 56.0 | REACTOME PHASE II CONJUGATION | Genes involved in Phase II conjugation |
| 0.4 | 28.7 | REACTOME ION TRANSPORT BY P TYPE ATPASES | Genes involved in Ion transport by P-type ATPases |
| 0.4 | 6.8 | REACTOME SYNTHESIS SECRETION AND INACTIVATION OF GIP | Genes involved in Synthesis, Secretion, and Inactivation of Glucose-dependent Insulinotropic Polypeptide (GIP) |
| 0.3 | 11.8 | REACTOME PROLACTIN RECEPTOR SIGNALING | Genes involved in Prolactin receptor signaling |
| 0.3 | 26.9 | REACTOME METABOLISM OF VITAMINS AND COFACTORS | Genes involved in Metabolism of vitamins and cofactors |
| 0.3 | 50.7 | REACTOME TRANSPORT OF INORGANIC CATIONS ANIONS AND AMINO ACIDS OLIGOPEPTIDES | Genes involved in Transport of inorganic cations/anions and amino acids/oligopeptides |
| 0.2 | 75.3 | REACTOME METABOLISM OF AMINO ACIDS AND DERIVATIVES | Genes involved in Metabolism of amino acids and derivatives |
| 0.2 | 8.1 | REACTOME FANCONI ANEMIA PATHWAY | Genes involved in Fanconi Anemia pathway |
| 0.2 | 41.3 | REACTOME PPARA ACTIVATES GENE EXPRESSION | Genes involved in PPARA Activates Gene Expression |
| 0.2 | 4.7 | REACTOME APOPTOTIC CLEAVAGE OF CELL ADHESION PROTEINS | Genes involved in Apoptotic cleavage of cell adhesion proteins |
| 0.1 | 28.5 | REACTOME MRNA PROCESSING | Genes involved in mRNA Processing |
| 0.1 | 12.8 | REACTOME CLASS B 2 SECRETIN FAMILY RECEPTORS | Genes involved in Class B/2 (Secretin family receptors) |
| 0.1 | 7.8 | REACTOME GLYCOSPHINGOLIPID METABOLISM | Genes involved in Glycosphingolipid metabolism |
| 0.1 | 2.6 | REACTOME SYNTHESIS OF PE | Genes involved in Synthesis of PE |
| 0.1 | 10.8 | REACTOME G ALPHA S SIGNALLING EVENTS | Genes involved in G alpha (s) signalling events |
| 0.1 | 3.5 | REACTOME SPHINGOLIPID DE NOVO BIOSYNTHESIS | Genes involved in Sphingolipid de novo biosynthesis |
| 0.1 | 2.9 | REACTOME ASSOCIATION OF TRIC CCT WITH TARGET PROTEINS DURING BIOSYNTHESIS | Genes involved in Association of TriC/CCT with target proteins during biosynthesis |
| 0.0 | 5.6 | REACTOME TRANSPORT OF GLUCOSE AND OTHER SUGARS BILE SALTS AND ORGANIC ACIDS METAL IONS AND AMINE COMPOUNDS | Genes involved in Transport of glucose and other sugars, bile salts and organic acids, metal ions and amine compounds |
| 0.0 | 0.8 | REACTOME OXYGEN DEPENDENT PROLINE HYDROXYLATION OF HYPOXIA INDUCIBLE FACTOR ALPHA | Genes involved in Oxygen-dependent Proline Hydroxylation of Hypoxia-inducible Factor Alpha |
| 0.0 | 6.2 | REACTOME CLASS A1 RHODOPSIN LIKE RECEPTORS | Genes involved in Class A/1 (Rhodopsin-like receptors) |
| 0.0 | 3.7 | REACTOME SIGNALING BY RHO GTPASES | Genes involved in Signaling by Rho GTPases |