Project
Illumina Body Map 2
Navigation
Downloads
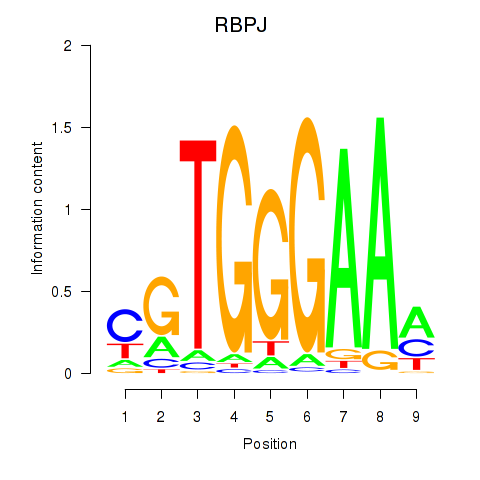
Results for RBPJ
Z-value: 1.30
Motif logo
Transcription factors associated with RBPJ
| Gene Symbol | Gene ID | Gene Info |
|---|---|---|
|
RBPJ
|
ENSG00000168214.16 | recombination signal binding protein for immunoglobulin kappa J region |
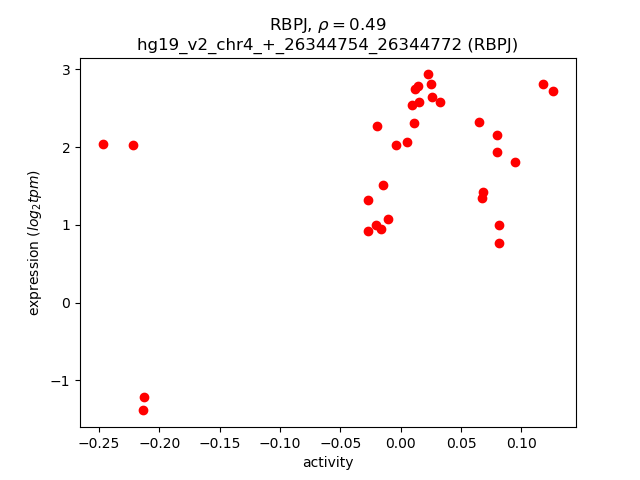
Activity-expression correlation:
| Gene | Promoter | Pearson corr. coef. | P-value | Plot |
|---|---|---|---|---|
| RBPJ | hg19_v2_chr4_+_26344754_26344772 | 0.49 | 4.2e-03 | Click! |
Activity profile of RBPJ motif
Sorted Z-values of RBPJ motif
| Promoter | Log-likelihood | Transcript | Gene | Gene Info |
|---|---|---|---|---|
| chr3_-_100712352 | 6.49 |
ENST00000471714.1
ENST00000284322.5 |
ABI3BP
|
ABI family, member 3 (NESH) binding protein |
| chr8_-_80680078 | 6.09 |
ENST00000337919.5
ENST00000354724.3 |
HEY1
|
hes-related family bHLH transcription factor with YRPW motif 1 |
| chr3_-_100712292 | 5.42 |
ENST00000495063.1
ENST00000530539.1 |
ABI3BP
|
ABI family, member 3 (NESH) binding protein |
| chr6_-_94129244 | 5.38 |
ENST00000369303.4
ENST00000369297.1 |
EPHA7
|
EPH receptor A7 |
| chr10_-_4285835 | 5.20 |
ENST00000454470.1
|
LINC00702
|
long intergenic non-protein coding RNA 702 |
| chr19_+_50706866 | 4.24 |
ENST00000440075.2
ENST00000376970.2 ENST00000425460.1 ENST00000599920.1 ENST00000601313.1 |
MYH14
|
myosin, heavy chain 14, non-muscle |
| chr7_-_120498357 | 4.06 |
ENST00000415871.1
ENST00000222747.3 ENST00000430985.1 |
TSPAN12
|
tetraspanin 12 |
| chr12_+_12938541 | 3.79 |
ENST00000356591.4
|
APOLD1
|
apolipoprotein L domain containing 1 |
| chr4_-_87515202 | 3.76 |
ENST00000502302.1
ENST00000513186.1 |
MAPK10
|
mitogen-activated protein kinase 10 |
| chr6_+_126070726 | 3.74 |
ENST00000368364.3
|
HEY2
|
hes-related family bHLH transcription factor with YRPW motif 2 |
| chr15_+_59730348 | 3.73 |
ENST00000288228.5
ENST00000559628.1 ENST00000557914.1 ENST00000560474.1 |
FAM81A
|
family with sequence similarity 81, member A |
| chr6_-_76203454 | 3.55 |
ENST00000237172.7
|
FILIP1
|
filamin A interacting protein 1 |
| chr11_+_118478313 | 3.33 |
ENST00000356063.5
|
PHLDB1
|
pleckstrin homology-like domain, family B, member 1 |
| chr9_+_72658490 | 3.29 |
ENST00000377182.4
|
MAMDC2
|
MAM domain containing 2 |
| chr10_+_124320156 | 3.23 |
ENST00000338354.3
ENST00000344338.3 ENST00000330163.4 ENST00000368909.3 ENST00000368955.3 ENST00000368956.2 |
DMBT1
|
deleted in malignant brain tumors 1 |
| chr9_+_102584128 | 3.23 |
ENST00000338488.4
ENST00000395097.2 |
NR4A3
|
nuclear receptor subfamily 4, group A, member 3 |
| chr20_+_30225682 | 3.18 |
ENST00000376075.3
|
COX4I2
|
cytochrome c oxidase subunit IV isoform 2 (lung) |
| chr17_-_39780819 | 3.17 |
ENST00000311208.8
|
KRT17
|
keratin 17 |
| chr9_-_35691017 | 3.03 |
ENST00000378292.3
|
TPM2
|
tropomyosin 2 (beta) |
| chr3_+_142442841 | 2.99 |
ENST00000476941.1
ENST00000273482.6 |
TRPC1
|
transient receptor potential cation channel, subfamily C, member 1 |
| chr4_-_186578674 | 2.95 |
ENST00000438278.1
|
SORBS2
|
sorbin and SH3 domain containing 2 |
| chr10_-_4285923 | 2.94 |
ENST00000418372.1
ENST00000608792.1 |
LINC00702
|
long intergenic non-protein coding RNA 702 |
| chr1_+_239882842 | 2.92 |
ENST00000448020.1
|
CHRM3
|
cholinergic receptor, muscarinic 3 |
| chr16_-_10276611 | 2.79 |
ENST00000396573.2
|
GRIN2A
|
glutamate receptor, ionotropic, N-methyl D-aspartate 2A |
| chr12_-_16759711 | 2.57 |
ENST00000447609.1
|
LMO3
|
LIM domain only 3 (rhombotin-like 2) |
| chr2_+_150187020 | 2.52 |
ENST00000334166.4
|
LYPD6
|
LY6/PLAUR domain containing 6 |
| chr12_-_16759440 | 2.52 |
ENST00000537304.1
|
LMO3
|
LIM domain only 3 (rhombotin-like 2) |
| chr11_-_32452357 | 2.51 |
ENST00000379079.2
ENST00000530998.1 |
WT1
|
Wilms tumor 1 |
| chr8_-_22089845 | 2.46 |
ENST00000454243.2
|
PHYHIP
|
phytanoyl-CoA 2-hydroxylase interacting protein |
| chr13_-_38443860 | 2.42 |
ENST00000426868.2
ENST00000379681.3 ENST00000338947.5 ENST00000355779.2 ENST00000358477.2 ENST00000379673.2 |
TRPC4
|
transient receptor potential cation channel, subfamily C, member 4 |
| chr14_-_53417732 | 2.41 |
ENST00000399304.3
ENST00000395631.2 ENST00000341590.3 ENST00000343279.4 |
FERMT2
|
fermitin family member 2 |
| chr8_-_22089533 | 2.41 |
ENST00000321613.3
|
PHYHIP
|
phytanoyl-CoA 2-hydroxylase interacting protein |
| chr11_-_790060 | 2.38 |
ENST00000330106.4
|
CEND1
|
cell cycle exit and neuronal differentiation 1 |
| chr12_-_16760021 | 2.34 |
ENST00000540445.1
|
LMO3
|
LIM domain only 3 (rhombotin-like 2) |
| chr1_-_85358850 | 2.33 |
ENST00000370611.3
|
LPAR3
|
lysophosphatidic acid receptor 3 |
| chr10_-_97200772 | 2.30 |
ENST00000371241.1
ENST00000354106.3 ENST00000371239.1 ENST00000361941.3 ENST00000277982.5 ENST00000371245.3 |
SORBS1
|
sorbin and SH3 domain containing 1 |
| chr11_+_112832090 | 2.29 |
ENST00000533760.1
|
NCAM1
|
neural cell adhesion molecule 1 |
| chr6_-_76203345 | 2.24 |
ENST00000393004.2
|
FILIP1
|
filamin A interacting protein 1 |
| chr15_+_57891609 | 2.24 |
ENST00000569089.1
|
MYZAP
|
myocardial zonula adherens protein |
| chr11_+_112832202 | 2.22 |
ENST00000534015.1
|
NCAM1
|
neural cell adhesion molecule 1 |
| chr7_+_6713376 | 2.20 |
ENST00000399484.3
ENST00000544825.1 ENST00000401847.1 |
AC073343.1
|
Uncharacterized protein |
| chr2_+_48796120 | 2.20 |
ENST00000394754.1
|
STON1-GTF2A1L
|
STON1-GTF2A1L readthrough |
| chr8_-_87242589 | 2.19 |
ENST00000419776.2
ENST00000297524.3 |
SLC7A13
|
solute carrier family 7 (anionic amino acid transporter), member 13 |
| chr3_-_150966902 | 2.18 |
ENST00000424796.2
|
P2RY14
|
purinergic receptor P2Y, G-protein coupled, 14 |
| chr3_-_100558953 | 2.17 |
ENST00000533795.1
|
ABI3BP
|
ABI family, member 3 (NESH) binding protein |
| chr17_-_70417365 | 2.10 |
ENST00000580948.1
|
LINC00511
|
long intergenic non-protein coding RNA 511 |
| chr10_+_124320195 | 2.08 |
ENST00000359586.6
|
DMBT1
|
deleted in malignant brain tumors 1 |
| chr12_-_291556 | 2.02 |
ENST00000537295.1
ENST00000537961.1 |
RP11-598F7.6
|
RP11-598F7.6 |
| chr2_+_219824357 | 1.97 |
ENST00000302625.4
|
CDK5R2
|
cyclin-dependent kinase 5, regulatory subunit 2 (p39) |
| chr7_-_16505440 | 1.94 |
ENST00000307068.4
|
SOSTDC1
|
sclerostin domain containing 1 |
| chr3_-_19975665 | 1.85 |
ENST00000295824.9
ENST00000389256.4 |
EFHB
|
EF-hand domain family, member B |
| chrX_-_46187069 | 1.84 |
ENST00000446884.1
|
RP1-30G7.2
|
RP1-30G7.2 |
| chr7_+_55177416 | 1.81 |
ENST00000450046.1
ENST00000454757.2 |
EGFR
|
epidermal growth factor receptor |
| chr3_+_159570722 | 1.80 |
ENST00000482804.1
|
SCHIP1
|
schwannomin interacting protein 1 |
| chr10_-_38146510 | 1.77 |
ENST00000395867.3
|
ZNF248
|
zinc finger protein 248 |
| chr14_+_29234870 | 1.77 |
ENST00000382535.3
|
FOXG1
|
forkhead box G1 |
| chr11_+_112832133 | 1.75 |
ENST00000524665.1
|
NCAM1
|
neural cell adhesion molecule 1 |
| chr20_+_43211149 | 1.74 |
ENST00000372886.1
|
PKIG
|
protein kinase (cAMP-dependent, catalytic) inhibitor gamma |
| chr16_+_23313591 | 1.71 |
ENST00000343070.2
|
SCNN1B
|
sodium channel, non-voltage-gated 1, beta subunit |
| chr3_+_155860751 | 1.71 |
ENST00000471742.1
|
KCNAB1
|
potassium voltage-gated channel, shaker-related subfamily, beta member 1 |
| chr17_-_27053216 | 1.70 |
ENST00000292090.3
|
TLCD1
|
TLC domain containing 1 |
| chr6_-_134373732 | 1.70 |
ENST00000275230.5
|
SLC2A12
|
solute carrier family 2 (facilitated glucose transporter), member 12 |
| chr5_+_38445641 | 1.70 |
ENST00000397210.3
ENST00000506135.1 ENST00000508131.1 |
EGFLAM
|
EGF-like, fibronectin type III and laminin G domains |
| chr16_-_70719925 | 1.64 |
ENST00000338779.6
|
MTSS1L
|
metastasis suppressor 1-like |
| chr6_-_131299929 | 1.64 |
ENST00000531356.1
|
EPB41L2
|
erythrocyte membrane protein band 4.1-like 2 |
| chr19_-_40724246 | 1.61 |
ENST00000311308.6
|
TTC9B
|
tetratricopeptide repeat domain 9B |
| chr2_+_159825143 | 1.61 |
ENST00000454300.1
ENST00000263635.6 |
TANC1
|
tetratricopeptide repeat, ankyrin repeat and coiled-coil containing 1 |
| chr15_+_74218787 | 1.59 |
ENST00000261921.7
|
LOXL1
|
lysyl oxidase-like 1 |
| chr16_-_77465450 | 1.58 |
ENST00000562345.1
|
ADAMTS18
|
ADAM metallopeptidase with thrombospondin type 1 motif, 18 |
| chr11_-_83393429 | 1.57 |
ENST00000426717.2
|
DLG2
|
discs, large homolog 2 (Drosophila) |
| chr7_-_137531606 | 1.54 |
ENST00000288490.5
|
DGKI
|
diacylglycerol kinase, iota |
| chr19_-_49118067 | 1.50 |
ENST00000593772.1
|
FAM83E
|
family with sequence similarity 83, member E |
| chr17_-_56606705 | 1.50 |
ENST00000317268.3
|
SEPT4
|
septin 4 |
| chr5_-_115872142 | 1.48 |
ENST00000510263.1
|
SEMA6A
|
sema domain, transmembrane domain (TM), and cytoplasmic domain, (semaphorin) 6A |
| chr1_-_40105617 | 1.47 |
ENST00000372852.3
|
HEYL
|
hes-related family bHLH transcription factor with YRPW motif-like |
| chr1_+_210406121 | 1.43 |
ENST00000367012.3
|
SERTAD4
|
SERTA domain containing 4 |
| chr7_-_22259845 | 1.42 |
ENST00000420196.1
|
RAPGEF5
|
Rap guanine nucleotide exchange factor (GEF) 5 |
| chr1_+_15272271 | 1.42 |
ENST00000400797.3
|
KAZN
|
kazrin, periplakin interacting protein |
| chrX_-_11369656 | 1.41 |
ENST00000413512.3
|
ARHGAP6
|
Rho GTPase activating protein 6 |
| chr17_-_56606664 | 1.40 |
ENST00000580844.1
|
SEPT4
|
septin 4 |
| chr5_+_63461642 | 1.39 |
ENST00000296615.6
ENST00000381081.2 ENST00000389100.4 |
RNF180
|
ring finger protein 180 |
| chr20_+_30063067 | 1.39 |
ENST00000201979.2
|
REM1
|
RAS (RAD and GEM)-like GTP-binding 1 |
| chr5_-_115872124 | 1.36 |
ENST00000515009.1
|
SEMA6A
|
sema domain, transmembrane domain (TM), and cytoplasmic domain, (semaphorin) 6A |
| chr16_-_10276251 | 1.36 |
ENST00000330684.3
|
GRIN2A
|
glutamate receptor, ionotropic, N-methyl D-aspartate 2A |
| chr14_+_51955831 | 1.33 |
ENST00000356218.4
|
FRMD6
|
FERM domain containing 6 |
| chr1_-_935519 | 1.27 |
ENST00000428771.2
|
HES4
|
hes family bHLH transcription factor 4 |
| chr1_-_935361 | 1.26 |
ENST00000484667.2
|
HES4
|
hes family bHLH transcription factor 4 |
| chr5_+_178322893 | 1.25 |
ENST00000361362.2
ENST00000520660.1 ENST00000520805.1 |
ZFP2
|
ZFP2 zinc finger protein |
| chr16_-_57831914 | 1.24 |
ENST00000421376.2
|
KIFC3
|
kinesin family member C3 |
| chr17_-_56606639 | 1.23 |
ENST00000579371.1
|
SEPT4
|
septin 4 |
| chr12_+_6309963 | 1.18 |
ENST00000382515.2
|
CD9
|
CD9 molecule |
| chr19_-_46296011 | 1.16 |
ENST00000377735.3
ENST00000270223.6 |
DMWD
|
dystrophia myotonica, WD repeat containing |
| chr5_+_178368186 | 1.16 |
ENST00000320129.3
ENST00000519564.1 |
ZNF454
|
zinc finger protein 454 |
| chr18_-_70305745 | 1.14 |
ENST00000581073.1
|
CBLN2
|
cerebellin 2 precursor |
| chr2_+_38177620 | 1.10 |
ENST00000402091.3
|
RMDN2
|
regulator of microtubule dynamics 2 |
| chr10_-_38146965 | 1.07 |
ENST00000395873.3
ENST00000357328.4 ENST00000395874.2 |
ZNF248
|
zinc finger protein 248 |
| chr10_-_49459800 | 1.07 |
ENST00000305531.3
|
FRMPD2
|
FERM and PDZ domain containing 2 |
| chr1_-_935491 | 1.06 |
ENST00000304952.6
|
HES4
|
hes family bHLH transcription factor 4 |
| chr10_-_128110441 | 1.06 |
ENST00000456514.1
|
LINC00601
|
long intergenic non-protein coding RNA 601 |
| chr5_-_124080203 | 1.05 |
ENST00000504926.1
|
ZNF608
|
zinc finger protein 608 |
| chr5_-_139943830 | 1.03 |
ENST00000412920.3
ENST00000511201.2 ENST00000356738.2 ENST00000354402.5 ENST00000358580.5 ENST00000508496.2 |
APBB3
|
amyloid beta (A4) precursor protein-binding, family B, member 3 |
| chr22_-_38245304 | 1.02 |
ENST00000609454.1
|
ANKRD54
|
ankyrin repeat domain 54 |
| chr11_-_101454658 | 0.98 |
ENST00000344327.3
|
TRPC6
|
transient receptor potential cation channel, subfamily C, member 6 |
| chr11_+_64053311 | 0.96 |
ENST00000540370.1
|
GPR137
|
G protein-coupled receptor 137 |
| chr17_+_2699697 | 0.94 |
ENST00000254695.8
ENST00000366401.4 ENST00000542807.1 |
RAP1GAP2
|
RAP1 GTPase activating protein 2 |
| chr17_+_48351785 | 0.94 |
ENST00000507382.1
|
TMEM92
|
transmembrane protein 92 |
| chr6_-_72129806 | 0.94 |
ENST00000413945.1
ENST00000602878.1 ENST00000436803.1 ENST00000421704.1 ENST00000441570.1 |
LINC00472
|
long intergenic non-protein coding RNA 472 |
| chr16_-_57832004 | 0.93 |
ENST00000562503.1
|
KIFC3
|
kinesin family member C3 |
| chr2_+_44001172 | 0.93 |
ENST00000260605.8
ENST00000406852.3 ENST00000443170.3 ENST00000398823.2 ENST00000605786.1 |
DYNC2LI1
|
dynein, cytoplasmic 2, light intermediate chain 1 |
| chr12_+_4918342 | 0.92 |
ENST00000280684.3
ENST00000433855.1 |
KCNA6
|
potassium voltage-gated channel, shaker-related subfamily, member 6 |
| chr17_-_71410794 | 0.92 |
ENST00000424778.1
|
SDK2
|
sidekick cell adhesion molecule 2 |
| chr14_-_93214988 | 0.87 |
ENST00000557434.1
ENST00000393218.2 ENST00000334869.4 |
LGMN
|
legumain |
| chr18_+_66382428 | 0.87 |
ENST00000578970.1
ENST00000582371.1 ENST00000584775.1 |
CCDC102B
|
coiled-coil domain containing 102B |
| chr1_+_43855545 | 0.87 |
ENST00000372450.4
ENST00000310739.4 |
SZT2
|
seizure threshold 2 homolog (mouse) |
| chr6_+_144665237 | 0.86 |
ENST00000421035.2
|
UTRN
|
utrophin |
| chr16_-_57831676 | 0.85 |
ENST00000465878.2
ENST00000539578.1 ENST00000561524.1 |
KIFC3
|
kinesin family member C3 |
| chr1_-_85870177 | 0.85 |
ENST00000542148.1
|
DDAH1
|
dimethylarginine dimethylaminohydrolase 1 |
| chr11_-_83393457 | 0.85 |
ENST00000404783.3
|
DLG2
|
discs, large homolog 2 (Drosophila) |
| chr19_-_39390212 | 0.84 |
ENST00000437828.1
|
SIRT2
|
sirtuin 2 |
| chr10_+_31608054 | 0.84 |
ENST00000320985.10
ENST00000361642.5 ENST00000560721.2 ENST00000558440.1 ENST00000424869.1 ENST00000542815.3 |
ZEB1
|
zinc finger E-box binding homeobox 1 |
| chr10_+_112836779 | 0.83 |
ENST00000280155.2
|
ADRA2A
|
adrenoceptor alpha 2A |
| chr2_+_204193101 | 0.83 |
ENST00000430418.1
ENST00000424558.1 ENST00000261016.6 |
ABI2
|
abl-interactor 2 |
| chr1_+_43855560 | 0.83 |
ENST00000562955.1
|
SZT2
|
seizure threshold 2 homolog (mouse) |
| chr2_+_110656005 | 0.83 |
ENST00000437679.2
|
LIMS3
|
LIM and senescent cell antigen-like domains 3 |
| chr4_+_184826418 | 0.82 |
ENST00000308497.4
ENST00000438269.1 |
STOX2
|
storkhead box 2 |
| chr19_-_55690758 | 0.82 |
ENST00000590851.1
|
SYT5
|
synaptotagmin V |
| chr14_-_93214915 | 0.82 |
ENST00000553918.1
ENST00000555699.1 ENST00000553802.1 ENST00000554397.1 ENST00000554919.1 ENST00000554080.1 ENST00000553371.1 |
LGMN
|
legumain |
| chr1_-_146644036 | 0.82 |
ENST00000425272.2
|
PRKAB2
|
protein kinase, AMP-activated, beta 2 non-catalytic subunit |
| chr19_-_39390440 | 0.81 |
ENST00000249396.7
ENST00000414941.1 ENST00000392081.2 |
SIRT2
|
sirtuin 2 |
| chr6_+_43968306 | 0.80 |
ENST00000442114.2
ENST00000336600.5 ENST00000439969.2 |
C6orf223
|
chromosome 6 open reading frame 223 |
| chr10_-_33624002 | 0.79 |
ENST00000432372.2
|
NRP1
|
neuropilin 1 |
| chr12_+_106976678 | 0.77 |
ENST00000392842.1
|
RFX4
|
regulatory factor X, 4 (influences HLA class II expression) |
| chr8_-_101348408 | 0.76 |
ENST00000519527.1
ENST00000522369.1 |
RNF19A
|
ring finger protein 19A, RBR E3 ubiquitin protein ligase |
| chr1_+_82165350 | 0.75 |
ENST00000359929.3
|
LPHN2
|
latrophilin 2 |
| chrX_-_153236819 | 0.74 |
ENST00000354233.3
|
HCFC1
|
host cell factor C1 (VP16-accessory protein) |
| chr16_-_53737795 | 0.70 |
ENST00000262135.4
ENST00000564374.1 ENST00000566096.1 |
RPGRIP1L
|
RPGRIP1-like |
| chr16_+_53738053 | 0.69 |
ENST00000394647.3
|
FTO
|
fat mass and obesity associated |
| chr17_+_67590125 | 0.68 |
ENST00000591334.1
|
AC003051.1
|
AC003051.1 |
| chr18_+_10526008 | 0.67 |
ENST00000542979.1
ENST00000322897.6 |
NAPG
|
N-ethylmaleimide-sensitive factor attachment protein, gamma |
| chr10_+_102759045 | 0.67 |
ENST00000370220.1
|
LZTS2
|
leucine zipper, putative tumor suppressor 2 |
| chr10_-_33623826 | 0.67 |
ENST00000374867.2
|
NRP1
|
neuropilin 1 |
| chr19_+_7660716 | 0.66 |
ENST00000160298.4
ENST00000446248.2 |
CAMSAP3
|
calmodulin regulated spectrin-associated protein family, member 3 |
| chr5_+_140792614 | 0.66 |
ENST00000398610.2
|
PCDHGA10
|
protocadherin gamma subfamily A, 10 |
| chr1_+_50571949 | 0.65 |
ENST00000357083.4
|
ELAVL4
|
ELAV like neuron-specific RNA binding protein 4 |
| chrX_-_73834449 | 0.64 |
ENST00000332687.6
ENST00000349225.2 |
RLIM
|
ring finger protein, LIM domain interacting |
| chr12_+_175930 | 0.62 |
ENST00000538872.1
ENST00000326261.4 |
IQSEC3
|
IQ motif and Sec7 domain 3 |
| chr3_-_171489085 | 0.62 |
ENST00000418087.1
|
PLD1
|
phospholipase D1, phosphatidylcholine-specific |
| chr15_-_96590126 | 0.59 |
ENST00000561051.1
|
RP11-4G2.1
|
RP11-4G2.1 |
| chr3_-_183735731 | 0.59 |
ENST00000334444.6
|
ABCC5
|
ATP-binding cassette, sub-family C (CFTR/MRP), member 5 |
| chr3_-_87325728 | 0.58 |
ENST00000350375.2
|
POU1F1
|
POU class 1 homeobox 1 |
| chr2_-_170219037 | 0.57 |
ENST00000443831.1
|
LRP2
|
low density lipoprotein receptor-related protein 2 |
| chr10_-_33623310 | 0.57 |
ENST00000395995.1
ENST00000374823.5 ENST00000374821.5 ENST00000374816.3 |
NRP1
|
neuropilin 1 |
| chr13_-_25496926 | 0.57 |
ENST00000545981.1
ENST00000381884.4 |
CENPJ
|
centromere protein J |
| chr10_-_38146482 | 0.55 |
ENST00000374648.3
|
ZNF248
|
zinc finger protein 248 |
| chr1_-_146644122 | 0.54 |
ENST00000254101.3
|
PRKAB2
|
protein kinase, AMP-activated, beta 2 non-catalytic subunit |
| chr11_+_111789580 | 0.53 |
ENST00000278601.5
|
C11orf52
|
chromosome 11 open reading frame 52 |
| chr4_-_176733377 | 0.53 |
ENST00000505375.1
|
GPM6A
|
glycoprotein M6A |
| chr9_+_706842 | 0.52 |
ENST00000382293.3
|
KANK1
|
KN motif and ankyrin repeat domains 1 |
| chr10_-_33623564 | 0.52 |
ENST00000374875.1
ENST00000374822.4 |
NRP1
|
neuropilin 1 |
| chr2_+_3642545 | 0.50 |
ENST00000382062.2
ENST00000236693.7 ENST00000349077.4 |
COLEC11
|
collectin sub-family member 11 |
| chr10_+_115439699 | 0.47 |
ENST00000369315.1
|
CASP7
|
caspase 7, apoptosis-related cysteine peptidase |
| chr15_-_77988485 | 0.45 |
ENST00000561030.1
|
LINGO1
|
leucine rich repeat and Ig domain containing 1 |
| chr19_-_39390350 | 0.44 |
ENST00000447739.1
ENST00000358931.5 ENST00000407552.1 |
SIRT2
|
sirtuin 2 |
| chr13_-_20805109 | 0.43 |
ENST00000241124.6
|
GJB6
|
gap junction protein, beta 6, 30kDa |
| chr2_-_219134822 | 0.43 |
ENST00000444053.1
ENST00000248450.4 |
AAMP
|
angio-associated, migratory cell protein |
| chr17_-_34257771 | 0.42 |
ENST00000394529.3
ENST00000293273.6 |
RDM1
|
RAD52 motif 1 |
| chr12_-_4758159 | 0.41 |
ENST00000545990.2
|
AKAP3
|
A kinase (PRKA) anchor protein 3 |
| chr10_+_115439630 | 0.38 |
ENST00000369318.3
|
CASP7
|
caspase 7, apoptosis-related cysteine peptidase |
| chr1_-_43855444 | 0.36 |
ENST00000372455.4
|
MED8
|
mediator complex subunit 8 |
| chr1_-_43855479 | 0.36 |
ENST00000290663.6
ENST00000372457.4 |
MED8
|
mediator complex subunit 8 |
| chr3_+_69812701 | 0.35 |
ENST00000472437.1
|
MITF
|
microphthalmia-associated transcription factor |
| chr3_-_131756559 | 0.34 |
ENST00000505957.1
|
CPNE4
|
copine IV |
| chr16_-_53737722 | 0.34 |
ENST00000569716.1
ENST00000562588.1 ENST00000562230.1 ENST00000379925.3 ENST00000563746.1 ENST00000568653.3 |
RPGRIP1L
|
RPGRIP1-like |
| chr19_+_39390587 | 0.34 |
ENST00000572515.1
ENST00000392079.3 ENST00000575359.1 ENST00000313582.5 |
NFKBIB
|
nuclear factor of kappa light polypeptide gene enhancer in B-cells inhibitor, beta |
| chr1_+_113933371 | 0.33 |
ENST00000369617.4
|
MAGI3
|
membrane associated guanylate kinase, WW and PDZ domain containing 3 |
| chr6_+_139135648 | 0.32 |
ENST00000541398.1
|
ECT2L
|
epithelial cell transforming sequence 2 oncogene-like |
| chr8_+_55466915 | 0.32 |
ENST00000522711.2
|
RP11-53M11.3
|
RP11-53M11.3 |
| chr16_+_28962128 | 0.31 |
ENST00000564978.1
ENST00000320805.4 |
NFATC2IP
|
nuclear factor of activated T-cells, cytoplasmic, calcineurin-dependent 2 interacting protein |
| chr18_-_52989217 | 0.30 |
ENST00000570287.2
|
TCF4
|
transcription factor 4 |
| chr2_+_175199674 | 0.30 |
ENST00000394967.2
|
SP9
|
Sp9 transcription factor |
| chr7_+_30811004 | 0.30 |
ENST00000265299.6
|
FAM188B
|
family with sequence similarity 188, member B |
| chr11_+_64053005 | 0.29 |
ENST00000538032.1
|
GPR137
|
G protein-coupled receptor 137 |
| chr14_-_24701539 | 0.28 |
ENST00000534348.1
ENST00000524927.1 ENST00000250495.5 |
NEDD8-MDP1
NEDD8
|
NEDD8-MDP1 readthrough neural precursor cell expressed, developmentally down-regulated 8 |
| chr2_+_219135115 | 0.28 |
ENST00000248451.3
ENST00000273077.4 |
PNKD
|
paroxysmal nonkinesigenic dyskinesia |
| chr20_+_2633269 | 0.28 |
ENST00000445139.1
|
NOP56
|
NOP56 ribonucleoprotein |
| chr1_-_112531777 | 0.28 |
ENST00000315987.2
ENST00000302127.4 |
KCND3
|
potassium voltage-gated channel, Shal-related subfamily, member 3 |
| chrX_+_9935392 | 0.27 |
ENST00000445307.2
|
AC002365.1
|
Homo sapiens uncharacterized LOC100288814 (LOC100288814), mRNA. |
| chr1_+_61869748 | 0.27 |
ENST00000357977.5
|
NFIA
|
nuclear factor I/A |
| chr1_+_61547894 | 0.26 |
ENST00000403491.3
|
NFIA
|
nuclear factor I/A |
| chrX_+_19362011 | 0.25 |
ENST00000379806.5
ENST00000545074.1 ENST00000540249.1 ENST00000423505.1 ENST00000417819.1 ENST00000422285.2 ENST00000355808.5 ENST00000379805.3 |
PDHA1
|
pyruvate dehydrogenase (lipoamide) alpha 1 |
| chr11_-_61596753 | 0.25 |
ENST00000448607.1
ENST00000421879.1 |
FADS1
|
fatty acid desaturase 1 |
| chr22_+_20862321 | 0.24 |
ENST00000541476.1
ENST00000438962.1 |
MED15
|
mediator complex subunit 15 |
| chr5_+_137514403 | 0.24 |
ENST00000513276.1
|
KIF20A
|
kinesin family member 20A |
| chr5_-_145895753 | 0.23 |
ENST00000311104.2
|
GPR151
|
G protein-coupled receptor 151 |
| chr19_+_42746927 | 0.22 |
ENST00000378108.1
|
AC006486.1
|
AC006486.1 |
| chr11_-_83393303 | 0.21 |
ENST00000398304.1
ENST00000420775.2 |
DLG2
|
discs, large homolog 2 (Drosophila) |
| chr2_-_164592497 | 0.21 |
ENST00000333129.3
ENST00000409634.1 |
FIGN
|
fidgetin |
| chr2_+_187350883 | 0.20 |
ENST00000337859.6
|
ZC3H15
|
zinc finger CCCH-type containing 15 |
| chr9_+_88556036 | 0.20 |
ENST00000361671.5
ENST00000416045.1 |
NAA35
|
N(alpha)-acetyltransferase 35, NatC auxiliary subunit |
| chrX_+_36065053 | 0.20 |
ENST00000313548.4
|
CHDC2
|
calponin homology domain containing 2 |
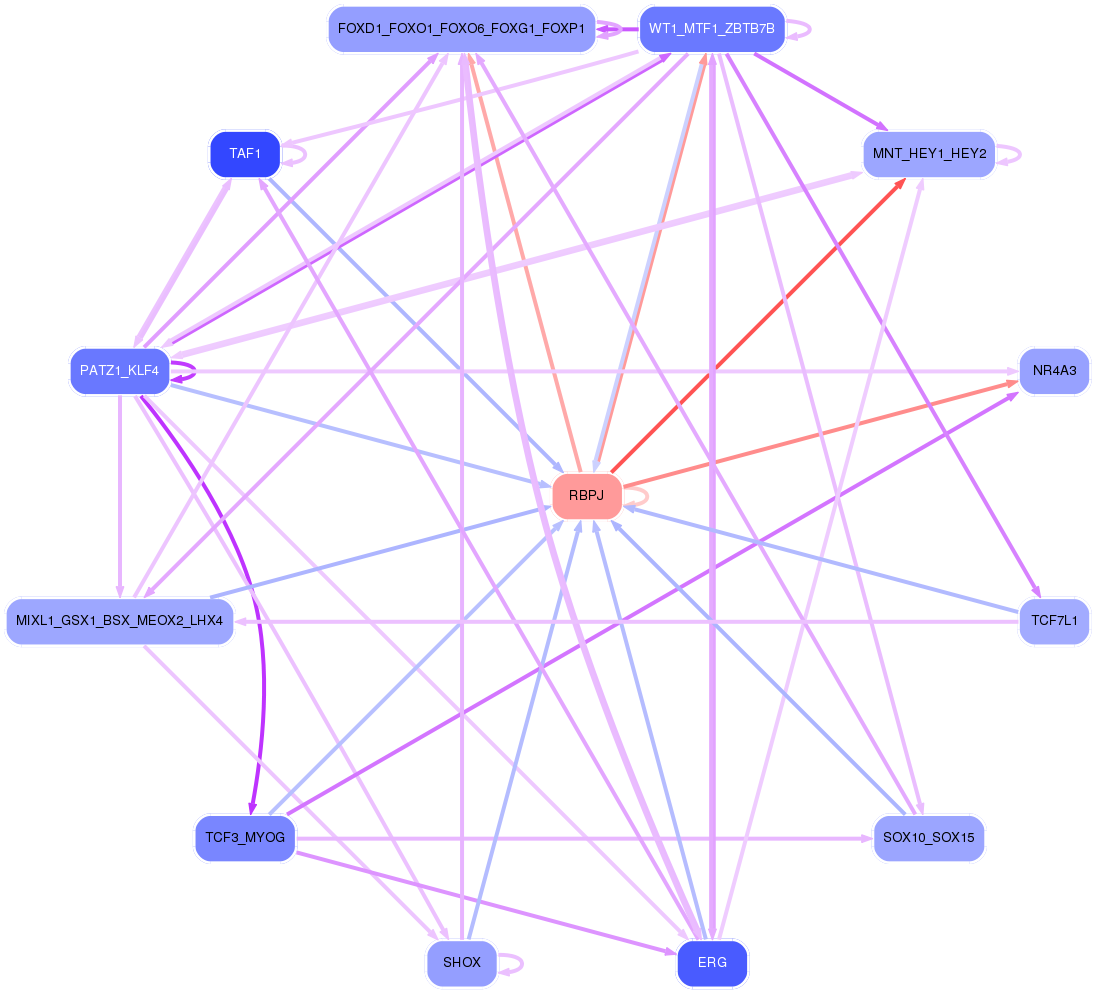
Network of associatons between targets according to the STRING database.

First level regulatory network of RBPJ
Gene Ontology Analysis
Gene overrepresentation in biological_process category:
| Log-likelihood per target | Total log-likelihood | Term | Description |
|---|---|---|---|
| 2.5 | 9.8 | GO:2000820 | negative regulation of transcription from RNA polymerase II promoter involved in smooth muscle cell differentiation(GO:2000820) |
| 1.4 | 4.2 | GO:0033058 | directional locomotion(GO:0033058) |
| 1.1 | 3.2 | GO:0032765 | positive regulation of mast cell cytokine production(GO:0032765) |
| 0.8 | 4.1 | GO:0030382 | sperm mitochondrion organization(GO:0030382) |
| 0.7 | 2.1 | GO:0061433 | cellular response to caloric restriction(GO:0061433) negative regulation of oligodendrocyte progenitor proliferation(GO:0070446) |
| 0.7 | 2.0 | GO:0021722 | superior olivary nucleus development(GO:0021718) superior olivary nucleus maturation(GO:0021722) |
| 0.6 | 2.5 | GO:0072299 | negative regulation of metanephric glomerulus development(GO:0072299) negative regulation of metanephric glomerular mesangial cell proliferation(GO:0072302) |
| 0.6 | 1.7 | GO:0006624 | vacuolar protein processing(GO:0006624) |
| 0.5 | 7.4 | GO:2000324 | positive regulation of glucocorticoid receptor signaling pathway(GO:2000324) |
| 0.5 | 2.5 | GO:0061552 | vestibulocochlear nerve structural organization(GO:0021649) positive regulation of cytokine activity(GO:0060301) ganglion morphogenesis(GO:0061552) VEGF-activated neuropilin signaling pathway involved in axon guidance(GO:1902378) dorsal root ganglion morphogenesis(GO:1904835) otic placode development(GO:1905040) |
| 0.5 | 1.5 | GO:2000824 | negative regulation of androgen receptor activity(GO:2000824) |
| 0.5 | 1.8 | GO:0043006 | activation of phospholipase A2 activity by calcium-mediated signaling(GO:0043006) |
| 0.4 | 1.6 | GO:0018277 | protein deamination(GO:0018277) |
| 0.4 | 1.9 | GO:0060648 | mammary gland bud morphogenesis(GO:0060648) |
| 0.4 | 5.3 | GO:0043152 | induction of bacterial agglutination(GO:0043152) |
| 0.4 | 2.9 | GO:0007197 | adenylate cyclase-inhibiting G-protein coupled acetylcholine receptor signaling pathway(GO:0007197) |
| 0.3 | 1.4 | GO:1901842 | negative regulation of high voltage-gated calcium channel activity(GO:1901842) |
| 0.3 | 3.4 | GO:0045218 | zonula adherens maintenance(GO:0045218) |
| 0.3 | 2.4 | GO:0021590 | cerebellum maturation(GO:0021590) cerebellar cortex maturation(GO:0021699) |
| 0.3 | 5.4 | GO:0048755 | negative regulation of collateral sprouting(GO:0048671) branching morphogenesis of a nerve(GO:0048755) |
| 0.3 | 3.8 | GO:0007258 | JUN phosphorylation(GO:0007258) |
| 0.3 | 6.4 | GO:0006828 | manganese ion transport(GO:0006828) |
| 0.2 | 0.7 | GO:0042245 | RNA repair(GO:0042245) |
| 0.2 | 1.5 | GO:1901668 | regulation of superoxide dismutase activity(GO:1901668) |
| 0.2 | 0.8 | GO:0035625 | negative regulation of epinephrine secretion(GO:0032811) epidermal growth factor-activated receptor transactivation by G-protein coupled receptor signaling pathway(GO:0035625) |
| 0.2 | 3.8 | GO:0042118 | endothelial cell activation(GO:0042118) |
| 0.2 | 0.5 | GO:2000393 | negative regulation of lamellipodium morphogenesis(GO:2000393) |
| 0.2 | 0.7 | GO:0019046 | release from viral latency(GO:0019046) |
| 0.2 | 3.3 | GO:1904261 | regulation of basement membrane assembly involved in embryonic body morphogenesis(GO:1904259) positive regulation of basement membrane assembly involved in embryonic body morphogenesis(GO:1904261) basement membrane assembly involved in embryonic body morphogenesis(GO:2001197) |
| 0.1 | 1.3 | GO:0003383 | apical constriction(GO:0003383) |
| 0.1 | 2.3 | GO:0048670 | regulation of collateral sprouting(GO:0048670) |
| 0.1 | 1.5 | GO:0046959 | habituation(GO:0046959) |
| 0.1 | 1.4 | GO:0042415 | norepinephrine metabolic process(GO:0042415) |
| 0.1 | 5.0 | GO:0010842 | retina layer formation(GO:0010842) |
| 0.1 | 2.8 | GO:2001224 | positive regulation of neuron migration(GO:2001224) |
| 0.1 | 3.2 | GO:0051798 | positive regulation of hair follicle development(GO:0051798) |
| 0.1 | 4.2 | GO:0071625 | vocalization behavior(GO:0071625) |
| 0.1 | 1.2 | GO:0009414 | response to water deprivation(GO:0009414) |
| 0.1 | 1.7 | GO:0060539 | diaphragm development(GO:0060539) |
| 0.1 | 1.6 | GO:1904776 | regulation of protein localization to cell cortex(GO:1904776) positive regulation of protein localization to cell cortex(GO:1904778) |
| 0.1 | 2.6 | GO:0006123 | mitochondrial electron transport, cytochrome c to oxygen(GO:0006123) |
| 0.1 | 0.8 | GO:0072733 | response to staurosporine(GO:0072733) cellular response to staurosporine(GO:0072734) |
| 0.1 | 0.3 | GO:0051596 | methylglyoxal catabolic process to D-lactate via S-lactoyl-glutathione(GO:0019243) methylglyoxal catabolic process(GO:0051596) methylglyoxal catabolic process to lactate(GO:0061727) |
| 0.1 | 0.8 | GO:0045602 | negative regulation of endothelial cell differentiation(GO:0045602) |
| 0.1 | 1.4 | GO:0051895 | negative regulation of focal adhesion assembly(GO:0051895) |
| 0.1 | 1.7 | GO:2000480 | negative regulation of cAMP-dependent protein kinase activity(GO:2000480) |
| 0.1 | 2.2 | GO:0035589 | G-protein coupled purinergic nucleotide receptor signaling pathway(GO:0035589) |
| 0.1 | 0.6 | GO:0061511 | centriole elongation(GO:0061511) |
| 0.1 | 1.7 | GO:0019800 | peptide cross-linking via chondroitin 4-sulfate glycosaminoglycan(GO:0019800) |
| 0.1 | 0.8 | GO:0021914 | negative regulation of smoothened signaling pathway involved in ventral spinal cord patterning(GO:0021914) |
| 0.1 | 1.6 | GO:0097062 | dendritic spine maintenance(GO:0097062) |
| 0.1 | 3.1 | GO:0003298 | physiological muscle hypertrophy(GO:0003298) physiological cardiac muscle hypertrophy(GO:0003301) cell growth involved in cardiac muscle cell development(GO:0061049) |
| 0.1 | 2.4 | GO:0033622 | integrin activation(GO:0033622) |
| 0.1 | 0.9 | GO:0035721 | intraciliary retrograde transport(GO:0035721) |
| 0.1 | 0.6 | GO:0032534 | regulation of microvillus assembly(GO:0032534) |
| 0.1 | 1.6 | GO:0090331 | negative regulation of platelet aggregation(GO:0090331) |
| 0.1 | 2.3 | GO:0045725 | positive regulation of glycogen biosynthetic process(GO:0045725) |
| 0.1 | 0.2 | GO:0060133 | somatotropin secreting cell development(GO:0060133) |
| 0.1 | 0.8 | GO:2000601 | positive regulation of Arp2/3 complex-mediated actin nucleation(GO:2000601) |
| 0.1 | 3.0 | GO:0046710 | GDP metabolic process(GO:0046710) |
| 0.1 | 12.6 | GO:0010811 | positive regulation of cell-substrate adhesion(GO:0010811) |
| 0.1 | 1.4 | GO:0006853 | carnitine shuttle(GO:0006853) |
| 0.1 | 0.6 | GO:0009048 | dosage compensation by inactivation of X chromosome(GO:0009048) |
| 0.0 | 1.0 | GO:0043584 | nose development(GO:0043584) |
| 0.0 | 0.1 | GO:0035905 | ascending aorta development(GO:0035905) ascending aorta morphogenesis(GO:0035910) |
| 0.0 | 0.2 | GO:1900108 | negative regulation of nodal signaling pathway(GO:1900108) |
| 0.0 | 0.9 | GO:0006527 | arginine catabolic process(GO:0006527) negative regulation of cellular response to hypoxia(GO:1900038) |
| 0.0 | 0.8 | GO:0030213 | hyaluronan biosynthetic process(GO:0030213) |
| 0.0 | 1.7 | GO:0035428 | hexose transmembrane transport(GO:0035428) glucose transmembrane transport(GO:1904659) |
| 0.0 | 6.3 | GO:0060333 | interferon-gamma-mediated signaling pathway(GO:0060333) |
| 0.0 | 0.1 | GO:0046013 | regulation of T cell homeostatic proliferation(GO:0046013) |
| 0.0 | 2.2 | GO:0099601 | regulation of neurotransmitter receptor activity(GO:0099601) |
| 0.0 | 0.5 | GO:0050771 | negative regulation of axonogenesis(GO:0050771) |
| 0.0 | 0.5 | GO:0001867 | complement activation, lectin pathway(GO:0001867) |
| 0.0 | 2.9 | GO:0030049 | muscle filament sliding(GO:0030049) actin-myosin filament sliding(GO:0033275) |
| 0.0 | 1.6 | GO:0097178 | ruffle assembly(GO:0097178) |
| 0.0 | 2.2 | GO:1902475 | L-alpha-amino acid transmembrane transport(GO:1902475) |
| 0.0 | 0.3 | GO:0097623 | potassium ion export across plasma membrane(GO:0097623) |
| 0.0 | 0.3 | GO:0061732 | mitochondrial acetyl-CoA biosynthetic process from pyruvate(GO:0061732) |
| 0.0 | 1.7 | GO:0050909 | sensory perception of taste(GO:0050909) |
| 0.0 | 0.6 | GO:0044872 | lipoprotein transport(GO:0042953) lipoprotein localization(GO:0044872) |
| 0.0 | 1.0 | GO:0045648 | positive regulation of erythrocyte differentiation(GO:0045648) |
| 0.0 | 0.6 | GO:0032012 | regulation of ARF protein signal transduction(GO:0032012) |
| 0.0 | 0.3 | GO:0060074 | synapse maturation(GO:0060074) |
| 0.0 | 0.8 | GO:0048488 | synaptic vesicle endocytosis(GO:0048488) |
| 0.0 | 0.1 | GO:0048539 | bone marrow development(GO:0048539) |
| 0.0 | 1.1 | GO:0070830 | bicellular tight junction assembly(GO:0070830) |
| 0.0 | 0.4 | GO:0010738 | regulation of protein kinase A signaling(GO:0010738) |
Gene overrepresentation in cellular_component category:
| Log-likelihood per target | Total log-likelihood | Term | Description |
|---|---|---|---|
| 0.7 | 4.2 | GO:0097513 | myosin II filament(GO:0097513) |
| 0.6 | 1.8 | GO:0097489 | multivesicular body, internal vesicle lumen(GO:0097489) |
| 0.6 | 2.9 | GO:0032279 | asymmetric synapse(GO:0032279) |
| 0.5 | 2.0 | GO:0016533 | cyclin-dependent protein kinase 5 holoenzyme complex(GO:0016533) |
| 0.5 | 15.8 | GO:0005614 | interstitial matrix(GO:0005614) |
| 0.3 | 2.3 | GO:0005899 | insulin receptor complex(GO:0005899) |
| 0.3 | 5.3 | GO:0042589 | zymogen granule membrane(GO:0042589) |
| 0.3 | 1.0 | GO:0005879 | axonemal microtubule(GO:0005879) |
| 0.2 | 1.7 | GO:1990130 | Iml1 complex(GO:1990130) |
| 0.2 | 1.7 | GO:0036021 | endolysosome lumen(GO:0036021) |
| 0.2 | 2.5 | GO:0097443 | sorting endosome(GO:0097443) |
| 0.2 | 1.7 | GO:1990635 | proximal dendrite(GO:1990635) |
| 0.2 | 4.1 | GO:0097227 | sperm annulus(GO:0097227) |
| 0.2 | 3.3 | GO:0045180 | basal cortex(GO:0045180) |
| 0.2 | 3.4 | GO:0005915 | zonula adherens(GO:0005915) |
| 0.2 | 4.0 | GO:0017146 | NMDA selective glutamate receptor complex(GO:0017146) |
| 0.1 | 2.1 | GO:0072687 | meiotic spindle(GO:0072687) |
| 0.1 | 3.0 | GO:0005862 | muscle thin filament tropomyosin(GO:0005862) |
| 0.1 | 2.6 | GO:0005751 | mitochondrial respiratory chain complex IV(GO:0005751) |
| 0.1 | 0.8 | GO:1990769 | proximal neuron projection(GO:1990769) |
| 0.1 | 0.6 | GO:0008275 | gamma-tubulin small complex(GO:0008275) |
| 0.1 | 2.8 | GO:0016580 | Sin3 complex(GO:0016580) |
| 0.1 | 1.6 | GO:0008091 | spectrin(GO:0008091) |
| 0.1 | 3.2 | GO:0042629 | mast cell granule(GO:0042629) |
| 0.1 | 2.6 | GO:0044224 | juxtaparanode region of axon(GO:0044224) |
| 0.1 | 2.4 | GO:0031258 | lamellipodium membrane(GO:0031258) |
| 0.1 | 1.5 | GO:0032045 | guanyl-nucleotide exchange factor complex(GO:0032045) |
| 0.1 | 1.4 | GO:0031588 | nucleotide-activated protein kinase complex(GO:0031588) |
| 0.0 | 1.7 | GO:0034706 | sodium channel complex(GO:0034706) |
| 0.0 | 0.8 | GO:0031209 | SCAR complex(GO:0031209) |
| 0.0 | 0.9 | GO:0070938 | contractile ring(GO:0070938) |
| 0.0 | 0.3 | GO:0031428 | box C/D snoRNP complex(GO:0031428) |
| 0.0 | 4.8 | GO:0031594 | neuromuscular junction(GO:0031594) |
| 0.0 | 0.2 | GO:0031417 | NatC complex(GO:0031417) |
| 0.0 | 6.1 | GO:0030863 | cortical cytoskeleton(GO:0030863) |
| 0.0 | 1.4 | GO:0030057 | desmosome(GO:0030057) |
| 0.0 | 0.6 | GO:0060077 | inhibitory synapse(GO:0060077) |
| 0.0 | 8.4 | GO:0031225 | anchored component of membrane(GO:0031225) |
| 0.0 | 0.4 | GO:0035686 | sperm fibrous sheath(GO:0035686) |
| 0.0 | 1.2 | GO:0031092 | platelet alpha granule membrane(GO:0031092) |
| 0.0 | 0.7 | GO:0005671 | Ada2/Gcn5/Ada3 transcription activator complex(GO:0005671) |
| 0.0 | 0.9 | GO:0005868 | cytoplasmic dynein complex(GO:0005868) |
| 0.0 | 0.3 | GO:0045254 | pyruvate dehydrogenase complex(GO:0045254) |
| 0.0 | 2.5 | GO:0043679 | axon terminus(GO:0043679) |
| 0.0 | 2.4 | GO:0005882 | intermediate filament(GO:0005882) |
| 0.0 | 0.6 | GO:0017053 | transcriptional repressor complex(GO:0017053) |
| 0.0 | 2.8 | GO:0030018 | Z disc(GO:0030018) |
| 0.0 | 2.6 | GO:0043296 | apical junction complex(GO:0043296) |
| 0.0 | 0.4 | GO:0030687 | preribosome, large subunit precursor(GO:0030687) |
| 0.0 | 0.7 | GO:0031201 | SNARE complex(GO:0031201) |
| 0.0 | 1.6 | GO:0001669 | acrosomal vesicle(GO:0001669) |
Gene overrepresentation in molecular_function category:
| Log-likelihood per target | Total log-likelihood | Term | Description |
|---|---|---|---|
| 2.8 | 11.3 | GO:0035939 | microsatellite binding(GO:0035939) |
| 0.7 | 2.1 | GO:0046970 | NAD-dependent histone deacetylase activity (H4-K16 specific)(GO:0046970) |
| 0.7 | 2.0 | GO:0016534 | cyclin-dependent protein kinase 5 activator activity(GO:0016534) |
| 0.6 | 2.5 | GO:0030550 | acetylcholine receptor inhibitor activity(GO:0030550) |
| 0.5 | 5.4 | GO:0008046 | axon guidance receptor activity(GO:0008046) |
| 0.5 | 2.5 | GO:0044729 | hemi-methylated DNA-binding(GO:0044729) |
| 0.4 | 3.2 | GO:0042289 | MHC class II protein binding(GO:0042289) |
| 0.4 | 2.9 | GO:0016907 | G-protein coupled acetylcholine receptor activity(GO:0016907) |
| 0.4 | 1.8 | GO:0005006 | epidermal growth factor-activated receptor activity(GO:0005006) |
| 0.3 | 1.0 | GO:0031862 | prostanoid receptor binding(GO:0031862) |
| 0.3 | 6.4 | GO:0015279 | store-operated calcium channel activity(GO:0015279) |
| 0.3 | 3.8 | GO:0016909 | JUN kinase activity(GO:0004705) SAP kinase activity(GO:0016909) |
| 0.3 | 4.0 | GO:0004972 | NMDA glutamate receptor activity(GO:0004972) |
| 0.3 | 0.8 | GO:0004938 | alpha2-adrenergic receptor activity(GO:0004938) |
| 0.2 | 1.9 | GO:0098821 | BMP receptor activity(GO:0098821) |
| 0.2 | 2.2 | GO:0045029 | UDP-activated nucleotide receptor activity(GO:0045029) |
| 0.2 | 2.3 | GO:0070915 | lysophosphatidic acid receptor activity(GO:0070915) |
| 0.2 | 2.5 | GO:0038085 | vascular endothelial growth factor binding(GO:0038085) |
| 0.2 | 4.2 | GO:0030898 | actin-dependent ATPase activity(GO:0030898) |
| 0.2 | 0.7 | GO:0035514 | DNA demethylase activity(GO:0035514) |
| 0.2 | 0.7 | GO:0005483 | soluble NSF attachment protein activity(GO:0005483) |
| 0.2 | 4.1 | GO:0042813 | Wnt-activated receptor activity(GO:0042813) |
| 0.1 | 5.3 | GO:0038187 | signaling pattern recognition receptor activity(GO:0008329) pattern recognition receptor activity(GO:0038187) |
| 0.1 | 1.6 | GO:0042731 | PH domain binding(GO:0042731) |
| 0.1 | 0.9 | GO:0016403 | dimethylargininase activity(GO:0016403) |
| 0.1 | 3.7 | GO:0008569 | ATP-dependent microtubule motor activity, minus-end-directed(GO:0008569) |
| 0.1 | 3.0 | GO:0035259 | glucocorticoid receptor binding(GO:0035259) |
| 0.1 | 0.3 | GO:0004416 | hydroxyacylglutathione hydrolase activity(GO:0004416) |
| 0.1 | 1.7 | GO:0015280 | ligand-gated sodium channel activity(GO:0015280) |
| 0.1 | 0.2 | GO:0045485 | omega-6 fatty acid desaturase activity(GO:0045485) |
| 0.1 | 3.6 | GO:0008093 | cytoskeletal adaptor activity(GO:0008093) |
| 0.1 | 0.6 | GO:0042954 | lipoprotein transporter activity(GO:0042954) |
| 0.1 | 11.2 | GO:0005518 | collagen binding(GO:0005518) |
| 0.1 | 1.4 | GO:0017034 | Rap guanyl-nucleotide exchange factor activity(GO:0017034) |
| 0.1 | 1.7 | GO:0055056 | D-glucose transmembrane transporter activity(GO:0055056) |
| 0.1 | 2.6 | GO:0015002 | cytochrome-c oxidase activity(GO:0004129) heme-copper terminal oxidase activity(GO:0015002) oxidoreductase activity, acting on a heme group of donors, oxygen as acceptor(GO:0016676) |
| 0.1 | 1.4 | GO:0004679 | AMP-activated protein kinase activity(GO:0004679) |
| 0.1 | 1.7 | GO:0004862 | cAMP-dependent protein kinase inhibitor activity(GO:0004862) |
| 0.1 | 0.3 | GO:0004739 | pyruvate dehydrogenase (acetyl-transferring) activity(GO:0004739) |
| 0.1 | 1.7 | GO:0070402 | NADPH binding(GO:0070402) |
| 0.1 | 1.6 | GO:0016641 | oxidoreductase activity, acting on the CH-NH2 group of donors, oxygen as acceptor(GO:0016641) |
| 0.1 | 1.5 | GO:0004143 | diacylglycerol kinase activity(GO:0004143) |
| 0.1 | 3.0 | GO:0004385 | guanylate kinase activity(GO:0004385) |
| 0.1 | 0.6 | GO:0070290 | N-acylphosphatidylethanolamine-specific phospholipase D activity(GO:0070290) |
| 0.1 | 6.3 | GO:0001618 | virus receptor activity(GO:0001618) |
| 0.0 | 0.7 | GO:0043995 | histone acetyltransferase activity (H4-K5 specific)(GO:0043995) histone acetyltransferase activity (H4-K8 specific)(GO:0043996) histone acetyltransferase activity (H4-K16 specific)(GO:0046972) |
| 0.0 | 0.8 | GO:0043225 | anion transmembrane-transporting ATPase activity(GO:0043225) |
| 0.0 | 2.1 | GO:0031624 | ubiquitin conjugating enzyme binding(GO:0031624) |
| 0.0 | 2.4 | GO:0005547 | phosphatidylinositol-3,4,5-trisphosphate binding(GO:0005547) |
| 0.0 | 2.3 | GO:0005158 | insulin receptor binding(GO:0005158) |
| 0.0 | 0.3 | GO:0005250 | A-type (transient outward) potassium channel activity(GO:0005250) |
| 0.0 | 0.7 | GO:0051011 | microtubule minus-end binding(GO:0051011) |
| 0.0 | 0.9 | GO:0017166 | vinculin binding(GO:0017166) |
| 0.0 | 1.1 | GO:0005545 | 1-phosphatidylinositol binding(GO:0005545) |
| 0.0 | 0.3 | GO:0031386 | protein tag(GO:0031386) |
| 0.0 | 0.5 | GO:0005537 | mannose binding(GO:0005537) |
| 0.0 | 2.5 | GO:0005546 | phosphatidylinositol-4,5-bisphosphate binding(GO:0005546) |
| 0.0 | 0.9 | GO:0005251 | delayed rectifier potassium channel activity(GO:0005251) |
| 0.0 | 3.0 | GO:0008307 | structural constituent of muscle(GO:0008307) |
| 0.0 | 0.3 | GO:1990226 | histone methyltransferase binding(GO:1990226) |
| 0.0 | 0.8 | GO:0097200 | cysteine-type endopeptidase activity involved in execution phase of apoptosis(GO:0097200) |
| 0.0 | 2.2 | GO:0015179 | L-amino acid transmembrane transporter activity(GO:0015179) |
| 0.0 | 0.6 | GO:0005086 | ARF guanyl-nucleotide exchange factor activity(GO:0005086) |
| 0.0 | 0.2 | GO:0036122 | BMP binding(GO:0036122) |
| 0.0 | 0.3 | GO:0001011 | transcription factor activity, sequence-specific DNA binding, RNA polymerase recruiting(GO:0001011) transcription factor activity, TFIIB-class binding(GO:0001087) |
| 0.0 | 1.7 | GO:0004197 | cysteine-type endopeptidase activity(GO:0004197) |
| 0.0 | 0.8 | GO:0070888 | E-box binding(GO:0070888) |
| 0.0 | 1.0 | GO:0001540 | beta-amyloid binding(GO:0001540) |
| 0.0 | 0.6 | GO:0017091 | AU-rich element binding(GO:0017091) |
| 0.0 | 0.1 | GO:0030621 | U4 snRNA binding(GO:0030621) |
| 0.0 | 0.2 | GO:0004596 | peptide alpha-N-acetyltransferase activity(GO:0004596) |
| 0.0 | 4.2 | GO:0000287 | magnesium ion binding(GO:0000287) |
Gene overrepresentation in curated gene sets: canonical pathways category:
| Log-likelihood per target | Total log-likelihood | Term | Description |
|---|---|---|---|
| 0.1 | 2.5 | PID VEGF VEGFR PATHWAY | VEGF and VEGFR signaling network |
| 0.1 | 8.7 | PID HES HEY PATHWAY | Notch-mediated HES/HEY network |
| 0.1 | 5.4 | PID EPHA FWDPATHWAY | EPHA forward signaling |
| 0.1 | 5.6 | ST ADRENERGIC | Adrenergic Pathway |
| 0.1 | 3.8 | ST GA12 PATHWAY | G alpha 12 Pathway |
| 0.1 | 3.3 | PID REELIN PATHWAY | Reelin signaling pathway |
| 0.1 | 20.2 | NABA ECM GLYCOPROTEINS | Genes encoding structural ECM glycoproteins |
| 0.1 | 2.0 | PID LIS1 PATHWAY | Lissencephaly gene (LIS1) in neuronal migration and development |
| 0.0 | 2.1 | PID HDAC CLASSIII PATHWAY | Signaling events mediated by HDAC Class III |
| 0.0 | 1.0 | PID NEPHRIN NEPH1 PATHWAY | Nephrin/Neph1 signaling in the kidney podocyte |
| 0.0 | 2.3 | PID INSULIN PATHWAY | Insulin Pathway |
| 0.0 | 3.4 | PID ECADHERIN STABILIZATION PATHWAY | Stabilization and expansion of the E-cadherin adherens junction |
| 0.0 | 2.0 | PID A6B1 A6B4 INTEGRIN PATHWAY | a6b1 and a6b4 Integrin signaling |
| 0.0 | 3.4 | PID FGF PATHWAY | FGF signaling pathway |
| 0.0 | 2.7 | PID LYSOPHOSPHOLIPID PATHWAY | LPA receptor mediated events |
| 0.0 | 2.3 | PID REG GR PATHWAY | Glucocorticoid receptor regulatory network |
| 0.0 | 2.3 | PID TELOMERASE PATHWAY | Regulation of Telomerase |
| 0.0 | 1.5 | PID BMP PATHWAY | BMP receptor signaling |
| 0.0 | 0.3 | PID ERB GENOMIC PATHWAY | Validated nuclear estrogen receptor beta network |
| 0.0 | 1.4 | PID RHOA REG PATHWAY | Regulation of RhoA activity |
| 0.0 | 3.4 | NABA ECM AFFILIATED | Genes encoding proteins affiliated structurally or functionally to extracellular matrix proteins |
| 0.0 | 0.8 | PID RAC1 PATHWAY | RAC1 signaling pathway |
Gene overrepresentation in curated gene sets: REACTOME pathways category:
| Log-likelihood per target | Total log-likelihood | Term | Description |
|---|---|---|---|
| 0.2 | 2.9 | REACTOME REGULATION OF INSULIN SECRETION BY ACETYLCHOLINE | Genes involved in Regulation of Insulin Secretion by Acetylcholine |
| 0.2 | 3.4 | REACTOME ROLE OF SECOND MESSENGERS IN NETRIN1 SIGNALING | Genes involved in Role of second messengers in netrin-1 signaling |
| 0.1 | 10.6 | REACTOME SIGNAL TRANSDUCTION BY L1 | Genes involved in Signal transduction by L1 |
| 0.1 | 3.8 | REACTOME ACTIVATION OF THE AP1 FAMILY OF TRANSCRIPTION FACTORS | Genes involved in Activation of the AP-1 family of transcription factors |
| 0.1 | 1.7 | REACTOME TRAFFICKING AND PROCESSING OF ENDOSOMAL TLR | Genes involved in Trafficking and processing of endosomal TLR |
| 0.1 | 4.0 | REACTOME RAS ACTIVATION UOPN CA2 INFUX THROUGH NMDA RECEPTOR | Genes involved in Ras activation uopn Ca2+ infux through NMDA receptor |
| 0.1 | 4.0 | REACTOME SEMA4D INDUCED CELL MIGRATION AND GROWTH CONE COLLAPSE | Genes involved in Sema4D induced cell migration and growth-cone collapse |
| 0.1 | 2.8 | REACTOME OTHER SEMAPHORIN INTERACTIONS | Genes involved in Other semaphorin interactions |
| 0.1 | 2.2 | REACTOME P2Y RECEPTORS | Genes involved in P2Y receptors |
| 0.1 | 0.9 | REACTOME RAP1 SIGNALLING | Genes involved in Rap1 signalling |
| 0.1 | 5.3 | REACTOME SMOOTH MUSCLE CONTRACTION | Genes involved in Smooth Muscle Contraction |
| 0.1 | 1.7 | REACTOME FACILITATIVE NA INDEPENDENT GLUCOSE TRANSPORTERS | Genes involved in Facilitative Na+-independent glucose transporters |
| 0.1 | 1.4 | REACTOME REGULATION OF RHEB GTPASE ACTIVITY BY AMPK | Genes involved in Regulation of Rheb GTPase activity by AMPK |
| 0.1 | 3.0 | REACTOME ASSOCIATION OF TRIC CCT WITH TARGET PROTEINS DURING BIOSYNTHESIS | Genes involved in Association of TriC/CCT with target proteins during biosynthesis |
| 0.0 | 5.2 | REACTOME NOTCH1 INTRACELLULAR DOMAIN REGULATES TRANSCRIPTION | Genes involved in NOTCH1 Intracellular Domain Regulates Transcription |
| 0.0 | 2.9 | REACTOME VOLTAGE GATED POTASSIUM CHANNELS | Genes involved in Voltage gated Potassium channels |
| 0.0 | 1.2 | REACTOME CELL EXTRACELLULAR MATRIX INTERACTIONS | Genes involved in Cell-extracellular matrix interactions |
| 0.0 | 0.8 | REACTOME HYALURONAN METABOLISM | Genes involved in Hyaluronan metabolism |
| 0.0 | 0.8 | REACTOME CASPASE MEDIATED CLEAVAGE OF CYTOSKELETAL PROTEINS | Genes involved in Caspase-mediated cleavage of cytoskeletal proteins |
| 0.0 | 0.8 | REACTOME INHIBITION OF INSULIN SECRETION BY ADRENALINE NORADRENALINE | Genes involved in Inhibition of Insulin Secretion by Adrenaline/Noradrenaline |
| 0.0 | 0.6 | REACTOME SYNTHESIS OF PA | Genes involved in Synthesis of PA |
| 0.0 | 0.3 | REACTOME REGULATION OF PYRUVATE DEHYDROGENASE PDH COMPLEX | Genes involved in Regulation of pyruvate dehydrogenase (PDH) complex |
| 0.0 | 0.6 | REACTOME STEROID HORMONES | Genes involved in Steroid hormones |