Project
Illumina Body Map 2
Navigation
Downloads
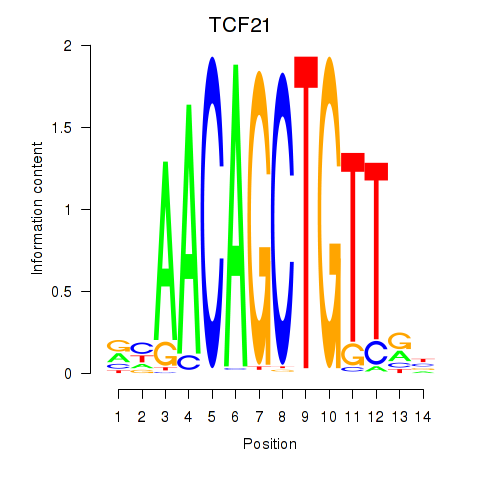
Results for TCF21
Z-value: 1.37
Motif logo
Transcription factors associated with TCF21
| Gene Symbol | Gene ID | Gene Info |
|---|---|---|
|
TCF21
|
ENSG00000118526.6 | transcription factor 21 |
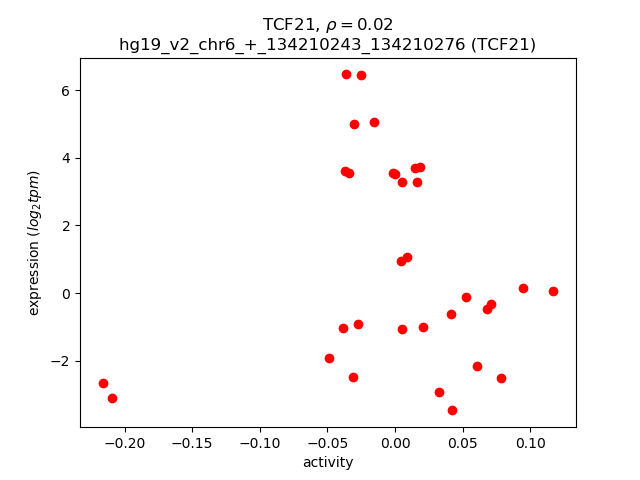
Activity-expression correlation:
| Gene | Promoter | Pearson corr. coef. | P-value | Plot |
|---|---|---|---|---|
| TCF21 | hg19_v2_chr6_+_134210243_134210276 | 0.02 | 9.2e-01 | Click! |
Activity profile of TCF21 motif
Sorted Z-values of TCF21 motif
| Promoter | Log-likelihood | Transcript | Gene | Gene Info |
|---|---|---|---|---|
| chr19_-_45826125 | 5.92 |
ENST00000221476.3
|
CKM
|
creatine kinase, muscle |
| chr11_+_1944054 | 4.65 |
ENST00000397301.1
ENST00000397304.2 ENST00000446240.1 |
TNNT3
|
troponin T type 3 (skeletal, fast) |
| chr17_+_45286387 | 3.72 |
ENST00000572316.1
ENST00000354968.1 ENST00000576874.1 ENST00000536623.2 |
MYL4
|
myosin, light chain 4, alkali; atrial, embryonic |
| chr1_+_171154347 | 3.47 |
ENST00000209929.7
ENST00000441535.1 |
FMO2
|
flavin containing monooxygenase 2 (non-functional) |
| chr16_-_31439735 | 3.16 |
ENST00000287490.4
|
COX6A2
|
cytochrome c oxidase subunit VIa polypeptide 2 |
| chr3_+_8775466 | 2.94 |
ENST00000343849.2
ENST00000397368.2 |
CAV3
|
caveolin 3 |
| chr17_+_4487294 | 2.81 |
ENST00000338859.4
|
SMTNL2
|
smoothelin-like 2 |
| chr3_+_148583043 | 2.73 |
ENST00000296046.3
|
CPA3
|
carboxypeptidase A3 (mast cell) |
| chr8_+_86351056 | 2.63 |
ENST00000285381.2
|
CA3
|
carbonic anhydrase III, muscle specific |
| chr2_-_152590946 | 2.63 |
ENST00000172853.10
|
NEB
|
nebulin |
| chr1_+_78354330 | 2.61 |
ENST00000440324.1
|
NEXN
|
nexilin (F actin binding protein) |
| chr1_+_167063282 | 2.57 |
ENST00000361200.2
|
DUSP27
|
dual specificity phosphatase 27 (putative) |
| chr1_+_78354297 | 2.57 |
ENST00000334785.7
|
NEXN
|
nexilin (F actin binding protein) |
| chr1_+_78354175 | 2.54 |
ENST00000401035.3
ENST00000457030.1 ENST00000330010.8 |
NEXN
|
nexilin (F actin binding protein) |
| chr17_+_45286706 | 2.46 |
ENST00000393450.1
ENST00000572303.1 |
MYL4
|
myosin, light chain 4, alkali; atrial, embryonic |
| chr15_+_57891609 | 2.39 |
ENST00000569089.1
|
MYZAP
|
myocardial zonula adherens protein |
| chr16_+_55522536 | 2.31 |
ENST00000570283.1
|
MMP2
|
matrix metallopeptidase 2 (gelatinase A, 72kDa gelatinase, 72kDa type IV collagenase) |
| chr1_+_78354243 | 2.24 |
ENST00000294624.8
|
NEXN
|
nexilin (F actin binding protein) |
| chr6_-_139613269 | 2.16 |
ENST00000358430.3
|
TXLNB
|
taxilin beta |
| chr19_+_11651942 | 2.15 |
ENST00000587087.1
|
CNN1
|
calponin 1, basic, smooth muscle |
| chrX_+_128872998 | 2.08 |
ENST00000371106.3
|
XPNPEP2
|
X-prolyl aminopeptidase (aminopeptidase P) 2, membrane-bound |
| chr10_-_97200772 | 2.01 |
ENST00000371241.1
ENST00000354106.3 ENST00000371239.1 ENST00000361941.3 ENST00000277982.5 ENST00000371245.3 |
SORBS1
|
sorbin and SH3 domain containing 1 |
| chr19_+_48216600 | 2.01 |
ENST00000263277.3
ENST00000538399.1 |
EHD2
|
EH-domain containing 2 |
| chrX_+_128872918 | 2.00 |
ENST00000371105.3
|
XPNPEP2
|
X-prolyl aminopeptidase (aminopeptidase P) 2, membrane-bound |
| chr10_-_29923893 | 2.00 |
ENST00000355867.4
|
SVIL
|
supervillin |
| chr14_-_106830057 | 1.97 |
ENST00000390616.2
|
IGHV4-34
|
immunoglobulin heavy variable 4-34 |
| chr19_-_4535233 | 1.95 |
ENST00000381848.3
ENST00000588887.1 ENST00000586133.1 |
PLIN5
|
perilipin 5 |
| chr9_-_89562104 | 1.95 |
ENST00000298743.7
|
GAS1
|
growth arrest-specific 1 |
| chr1_+_171217677 | 1.93 |
ENST00000402921.2
|
FMO1
|
flavin containing monooxygenase 1 |
| chr7_-_44105158 | 1.84 |
ENST00000297283.3
|
PGAM2
|
phosphoglycerate mutase 2 (muscle) |
| chr20_-_3687775 | 1.79 |
ENST00000344754.4
ENST00000202578.4 |
SIGLEC1
|
sialic acid binding Ig-like lectin 1, sialoadhesin |
| chr16_+_83932684 | 1.79 |
ENST00000262430.4
|
MLYCD
|
malonyl-CoA decarboxylase |
| chr17_+_41003166 | 1.78 |
ENST00000308423.2
|
AOC3
|
amine oxidase, copper containing 3 |
| chr10_-_7661623 | 1.77 |
ENST00000298441.6
|
ITIH5
|
inter-alpha-trypsin inhibitor heavy chain family, member 5 |
| chr2_-_42160486 | 1.73 |
ENST00000427054.1
|
AC104654.2
|
AC104654.2 |
| chr8_-_41522719 | 1.67 |
ENST00000335651.6
|
ANK1
|
ankyrin 1, erythrocytic |
| chr4_+_169633310 | 1.66 |
ENST00000510998.1
|
PALLD
|
palladin, cytoskeletal associated protein |
| chr20_-_3662866 | 1.65 |
ENST00000356518.2
ENST00000379861.4 |
ADAM33
|
ADAM metallopeptidase domain 33 |
| chr6_+_53948221 | 1.61 |
ENST00000460844.2
|
MLIP
|
muscular LMNA-interacting protein |
| chr6_+_53948328 | 1.61 |
ENST00000370876.2
|
MLIP
|
muscular LMNA-interacting protein |
| chr6_+_116832789 | 1.61 |
ENST00000368599.3
|
FAM26E
|
family with sequence similarity 26, member E |
| chr12_-_10875831 | 1.60 |
ENST00000279550.7
ENST00000228251.4 |
YBX3
|
Y box binding protein 3 |
| chr15_+_63340775 | 1.50 |
ENST00000559281.1
ENST00000317516.7 |
TPM1
|
tropomyosin 1 (alpha) |
| chr7_+_120716625 | 1.50 |
ENST00000443817.1
|
CPED1
|
cadherin-like and PC-esterase domain containing 1 |
| chr3_-_81792780 | 1.50 |
ENST00000489715.1
|
GBE1
|
glucan (1,4-alpha-), branching enzyme 1 |
| chr9_+_133285948 | 1.49 |
ENST00000428715.1
|
HMCN2
|
hemicentin 2 |
| chr1_+_186265399 | 1.46 |
ENST00000367486.3
ENST00000367484.3 ENST00000533951.1 ENST00000367482.4 ENST00000367483.4 ENST00000367485.4 ENST00000445192.2 |
PRG4
|
proteoglycan 4 |
| chr3_-_105587879 | 1.41 |
ENST00000264122.4
ENST00000403724.1 ENST00000405772.1 |
CBLB
|
Cbl proto-oncogene B, E3 ubiquitin protein ligase |
| chr15_+_63340858 | 1.39 |
ENST00000560615.1
|
TPM1
|
tropomyosin 1 (alpha) |
| chr17_+_77030267 | 1.38 |
ENST00000581774.1
|
C1QTNF1
|
C1q and tumor necrosis factor related protein 1 |
| chr2_+_137523086 | 1.36 |
ENST00000409968.1
|
THSD7B
|
thrombospondin, type I, domain containing 7B |
| chr2_-_3595547 | 1.34 |
ENST00000438485.1
|
RP13-512J5.1
|
Uncharacterized protein |
| chr1_+_172422026 | 1.33 |
ENST00000367725.4
|
C1orf105
|
chromosome 1 open reading frame 105 |
| chr1_+_153600869 | 1.32 |
ENST00000292169.1
ENST00000368696.3 ENST00000436839.1 |
S100A1
|
S100 calcium binding protein A1 |
| chr22_+_44427230 | 1.32 |
ENST00000444029.1
|
PARVB
|
parvin, beta |
| chr11_+_47270475 | 1.31 |
ENST00000481889.2
ENST00000436778.1 ENST00000531660.1 ENST00000407404.1 |
NR1H3
|
nuclear receptor subfamily 1, group H, member 3 |
| chr1_+_171217622 | 1.30 |
ENST00000433267.1
ENST00000367750.3 |
FMO1
|
flavin containing monooxygenase 1 |
| chr11_+_47270436 | 1.29 |
ENST00000395397.3
ENST00000405576.1 |
NR1H3
|
nuclear receptor subfamily 1, group H, member 3 |
| chr17_-_53809473 | 1.27 |
ENST00000575734.1
|
TMEM100
|
transmembrane protein 100 |
| chr22_+_38071615 | 1.27 |
ENST00000215909.5
|
LGALS1
|
lectin, galactoside-binding, soluble, 1 |
| chr11_+_827553 | 1.25 |
ENST00000528542.2
ENST00000450448.1 |
EFCAB4A
|
EF-hand calcium binding domain 4A |
| chr2_-_128400788 | 1.24 |
ENST00000409286.1
|
LIMS2
|
LIM and senescent cell antigen-like domains 2 |
| chr17_-_46657473 | 1.24 |
ENST00000332503.5
|
HOXB4
|
homeobox B4 |
| chr11_-_75921780 | 1.23 |
ENST00000529461.1
|
WNT11
|
wingless-type MMTV integration site family, member 11 |
| chr3_-_168864315 | 1.22 |
ENST00000475754.1
ENST00000484519.1 |
MECOM
|
MDS1 and EVI1 complex locus |
| chr19_+_50191921 | 1.18 |
ENST00000420022.3
|
ADM5
|
adrenomedullin 5 (putative) |
| chr15_-_79103757 | 1.16 |
ENST00000388820.4
|
ADAMTS7
|
ADAM metallopeptidase with thrombospondin type 1 motif, 7 |
| chr3_-_52868931 | 1.16 |
ENST00000486659.1
|
MUSTN1
|
musculoskeletal, embryonic nuclear protein 1 |
| chrX_-_33357558 | 1.15 |
ENST00000288447.4
|
DMD
|
dystrophin |
| chr9_+_112852477 | 1.14 |
ENST00000480388.1
|
AKAP2
|
A kinase (PRKA) anchor protein 2 |
| chr1_+_22963158 | 1.13 |
ENST00000438241.1
|
C1QA
|
complement component 1, q subcomponent, A chain |
| chr2_+_220299547 | 1.11 |
ENST00000312358.7
|
SPEG
|
SPEG complex locus |
| chr1_-_161993422 | 1.10 |
ENST00000367940.2
|
OLFML2B
|
olfactomedin-like 2B |
| chr12_-_66035968 | 1.10 |
ENST00000537250.1
|
RP11-230G5.2
|
RP11-230G5.2 |
| chr15_+_63340734 | 1.09 |
ENST00000560959.1
|
TPM1
|
tropomyosin 1 (alpha) |
| chr3_+_157261035 | 1.08 |
ENST00000312275.5
|
C3orf55
|
chromosome 3 open reading frame 55 |
| chr3_+_145782358 | 1.07 |
ENST00000422482.1
|
AC107021.1
|
HCG1786590; PRO2533; Uncharacterized protein |
| chr20_-_52210368 | 1.07 |
ENST00000371471.2
|
ZNF217
|
zinc finger protein 217 |
| chr8_+_144295067 | 1.07 |
ENST00000330824.2
|
GPIHBP1
|
glycosylphosphatidylinositol anchored high density lipoprotein binding protein 1 |
| chr7_-_47578840 | 1.06 |
ENST00000450444.1
|
TNS3
|
tensin 3 |
| chr18_+_3448455 | 1.05 |
ENST00000549780.1
|
TGIF1
|
TGFB-induced factor homeobox 1 |
| chr8_-_41522779 | 1.04 |
ENST00000522231.1
ENST00000314214.8 ENST00000348036.4 ENST00000457297.1 ENST00000522543.1 |
ANK1
|
ankyrin 1, erythrocytic |
| chr3_+_14862939 | 1.03 |
ENST00000457774.1
|
FGD5
|
FYVE, RhoGEF and PH domain containing 5 |
| chr6_-_39197226 | 1.03 |
ENST00000359534.3
|
KCNK5
|
potassium channel, subfamily K, member 5 |
| chr9_+_27109133 | 1.03 |
ENST00000519097.1
ENST00000380036.4 |
TEK
|
TEK tyrosine kinase, endothelial |
| chr2_-_106054952 | 1.02 |
ENST00000336660.5
ENST00000393352.3 ENST00000607522.1 |
FHL2
|
four and a half LIM domains 2 |
| chr9_+_27109392 | 1.02 |
ENST00000406359.4
|
TEK
|
TEK tyrosine kinase, endothelial |
| chr6_-_72130472 | 1.02 |
ENST00000426635.2
|
LINC00472
|
long intergenic non-protein coding RNA 472 |
| chr19_+_46801639 | 1.01 |
ENST00000244303.6
ENST00000339613.2 ENST00000533145.1 ENST00000472815.1 |
HIF3A
|
hypoxia inducible factor 3, alpha subunit |
| chr6_+_44184653 | 1.00 |
ENST00000573382.2
ENST00000576476.1 |
RP1-302G2.5
|
RP1-302G2.5 |
| chr5_+_135364584 | 1.00 |
ENST00000442011.2
ENST00000305126.8 |
TGFBI
|
transforming growth factor, beta-induced, 68kDa |
| chr15_+_63354769 | 0.99 |
ENST00000558910.1
|
TPM1
|
tropomyosin 1 (alpha) |
| chr12_-_92821922 | 0.98 |
ENST00000538965.1
ENST00000378487.2 |
CLLU1OS
|
chronic lymphocytic leukemia up-regulated 1 opposite strand |
| chr9_-_104357277 | 0.97 |
ENST00000374806.1
|
PPP3R2
|
protein phosphatase 3, regulatory subunit B, beta |
| chr2_+_56411131 | 0.97 |
ENST00000407595.2
|
CCDC85A
|
coiled-coil domain containing 85A |
| chr11_-_16419067 | 0.97 |
ENST00000533411.1
|
SOX6
|
SRY (sex determining region Y)-box 6 |
| chr18_+_3247779 | 0.96 |
ENST00000578611.1
ENST00000583449.1 |
MYL12A
|
myosin, light chain 12A, regulatory, non-sarcomeric |
| chr3_-_52869205 | 0.96 |
ENST00000446157.2
|
MUSTN1
|
musculoskeletal, embryonic nuclear protein 1 |
| chr16_+_30383613 | 0.96 |
ENST00000568749.1
|
MYLPF
|
myosin light chain, phosphorylatable, fast skeletal muscle |
| chr11_-_59633951 | 0.94 |
ENST00000257264.3
|
TCN1
|
transcobalamin I (vitamin B12 binding protein, R binder family) |
| chr13_-_78492955 | 0.93 |
ENST00000446573.1
|
EDNRB
|
endothelin receptor type B |
| chr2_+_102721023 | 0.92 |
ENST00000409589.1
ENST00000409329.1 |
IL1R1
|
interleukin 1 receptor, type I |
| chr18_+_21529811 | 0.92 |
ENST00000588004.1
|
LAMA3
|
laminin, alpha 3 |
| chr7_-_47988088 | 0.91 |
ENST00000289672.2
|
PKD1L1
|
polycystic kidney disease 1 like 1 |
| chr22_+_39052632 | 0.91 |
ENST00000411557.1
ENST00000396811.2 ENST00000216029.3 ENST00000416285.1 |
CBY1
|
chibby homolog 1 (Drosophila) |
| chr12_-_50677255 | 0.91 |
ENST00000551691.1
ENST00000394943.3 ENST00000341247.4 |
LIMA1
|
LIM domain and actin binding 1 |
| chr11_-_10920714 | 0.91 |
ENST00000533941.1
|
CTD-2003C8.2
|
CTD-2003C8.2 |
| chr6_-_3912207 | 0.90 |
ENST00000566733.1
|
RP1-140K8.5
|
RP1-140K8.5 |
| chr2_+_177001685 | 0.90 |
ENST00000432796.2
|
HOXD3
|
homeobox D3 |
| chr11_+_72975524 | 0.90 |
ENST00000540342.1
ENST00000542092.1 |
P2RY6
|
pyrimidinergic receptor P2Y, G-protein coupled, 6 |
| chr8_-_123706338 | 0.90 |
ENST00000521608.1
|
RP11-973F15.1
|
long intergenic non-protein coding RNA 1151 |
| chr7_-_42276612 | 0.89 |
ENST00000395925.3
ENST00000437480.1 |
GLI3
|
GLI family zinc finger 3 |
| chr19_-_40324767 | 0.89 |
ENST00000601972.1
ENST00000430012.2 ENST00000323039.5 ENST00000348817.3 |
DYRK1B
|
dual-specificity tyrosine-(Y)-phosphorylation regulated kinase 1B |
| chr1_+_22962948 | 0.88 |
ENST00000374642.3
|
C1QA
|
complement component 1, q subcomponent, A chain |
| chr7_+_20687017 | 0.87 |
ENST00000258738.6
|
ABCB5
|
ATP-binding cassette, sub-family B (MDR/TAP), member 5 |
| chr3_+_32433154 | 0.87 |
ENST00000334983.5
ENST00000349718.4 |
CMTM7
|
CKLF-like MARVEL transmembrane domain containing 7 |
| chr12_-_52912901 | 0.86 |
ENST00000551188.1
|
KRT5
|
keratin 5 |
| chr7_-_122342988 | 0.86 |
ENST00000434824.1
|
RNF148
|
ring finger protein 148 |
| chr15_-_99548775 | 0.86 |
ENST00000378919.6
|
PGPEP1L
|
pyroglutamyl-peptidase I-like |
| chr1_-_160681593 | 0.86 |
ENST00000368045.3
ENST00000368046.3 |
CD48
|
CD48 molecule |
| chr3_+_32433363 | 0.86 |
ENST00000465248.1
|
CMTM7
|
CKLF-like MARVEL transmembrane domain containing 7 |
| chr4_+_106816592 | 0.84 |
ENST00000379987.2
ENST00000453617.2 ENST00000427316.2 ENST00000514622.1 ENST00000305572.8 |
NPNT
|
nephronectin |
| chr4_+_106816644 | 0.84 |
ENST00000506666.1
ENST00000503451.1 |
NPNT
|
nephronectin |
| chr22_+_23264766 | 0.84 |
ENST00000390331.2
|
IGLC7
|
immunoglobulin lambda constant 7 |
| chr7_-_132766818 | 0.84 |
ENST00000262570.5
|
CHCHD3
|
coiled-coil-helix-coiled-coil-helix domain containing 3 |
| chr8_-_55014415 | 0.84 |
ENST00000522007.1
ENST00000521898.1 ENST00000518546.1 ENST00000316963.3 |
LYPLA1
|
lysophospholipase I |
| chr12_+_8850471 | 0.83 |
ENST00000535829.1
ENST00000357529.3 |
RIMKLB
|
ribosomal modification protein rimK-like family member B |
| chr12_-_104443890 | 0.83 |
ENST00000547583.1
ENST00000360814.4 ENST00000546851.1 |
GLT8D2
|
glycosyltransferase 8 domain containing 2 |
| chr7_-_128415844 | 0.82 |
ENST00000249389.2
|
OPN1SW
|
opsin 1 (cone pigments), short-wave-sensitive |
| chr19_-_1650666 | 0.81 |
ENST00000588136.1
|
TCF3
|
transcription factor 3 |
| chr3_-_105588231 | 0.81 |
ENST00000545639.1
ENST00000394027.3 ENST00000438603.1 ENST00000447441.1 ENST00000443752.1 |
CBLB
|
Cbl proto-oncogene B, E3 ubiquitin protein ligase |
| chr11_-_31531121 | 0.81 |
ENST00000532287.1
ENST00000526776.1 ENST00000534812.1 ENST00000529749.1 ENST00000278200.1 ENST00000530023.1 ENST00000533642.1 |
IMMP1L
|
IMP1 inner mitochondrial membrane peptidase-like (S. cerevisiae) |
| chr17_-_7297833 | 0.81 |
ENST00000571802.1
ENST00000576201.1 ENST00000573213.1 ENST00000324822.11 |
TMEM256-PLSCR3
|
TMEM256-PLSCR3 readthrough (NMD candidate) |
| chr11_+_1892102 | 0.80 |
ENST00000417766.1
|
LSP1
|
lymphocyte-specific protein 1 |
| chr9_+_27109440 | 0.80 |
ENST00000519080.1
|
TEK
|
TEK tyrosine kinase, endothelial |
| chr15_+_63340647 | 0.79 |
ENST00000404484.4
|
TPM1
|
tropomyosin 1 (alpha) |
| chrX_-_106960285 | 0.79 |
ENST00000503515.1
ENST00000372397.2 |
TSC22D3
|
TSC22 domain family, member 3 |
| chr19_-_7764960 | 0.78 |
ENST00000593418.1
|
FCER2
|
Fc fragment of IgE, low affinity II, receptor for (CD23) |
| chr17_-_79805146 | 0.77 |
ENST00000415593.1
|
P4HB
|
prolyl 4-hydroxylase, beta polypeptide |
| chr3_-_189839467 | 0.77 |
ENST00000426003.1
|
LEPREL1
|
leprecan-like 1 |
| chrX_+_150884539 | 0.77 |
ENST00000417321.1
|
FATE1
|
fetal and adult testis expressed 1 |
| chr14_-_93214915 | 0.76 |
ENST00000553918.1
ENST00000555699.1 ENST00000553802.1 ENST00000554397.1 ENST00000554919.1 ENST00000554080.1 ENST00000553371.1 |
LGMN
|
legumain |
| chr3_-_176915215 | 0.75 |
ENST00000457928.2
ENST00000422442.1 |
TBL1XR1
|
transducin (beta)-like 1 X-linked receptor 1 |
| chr17_-_7193711 | 0.74 |
ENST00000571464.1
|
YBX2
|
Y box binding protein 2 |
| chr20_-_23030296 | 0.74 |
ENST00000377103.2
|
THBD
|
thrombomodulin |
| chr7_-_132766800 | 0.74 |
ENST00000542753.1
ENST00000448878.1 |
CHCHD3
|
coiled-coil-helix-coiled-coil-helix domain containing 3 |
| chr6_-_30658745 | 0.72 |
ENST00000376420.5
ENST00000376421.5 |
NRM
|
nurim (nuclear envelope membrane protein) |
| chr7_+_150413645 | 0.72 |
ENST00000307194.5
|
GIMAP1
|
GTPase, IMAP family member 1 |
| chr17_+_71229346 | 0.71 |
ENST00000535032.2
ENST00000582793.1 |
C17orf80
|
chromosome 17 open reading frame 80 |
| chr11_+_64002292 | 0.71 |
ENST00000426086.2
|
VEGFB
|
vascular endothelial growth factor B |
| chr1_-_45476944 | 0.71 |
ENST00000372172.4
|
HECTD3
|
HECT domain containing E3 ubiquitin protein ligase 3 |
| chr2_+_219264466 | 0.70 |
ENST00000273062.2
|
CTDSP1
|
CTD (carboxy-terminal domain, RNA polymerase II, polypeptide A) small phosphatase 1 |
| chr2_-_25100893 | 0.70 |
ENST00000433852.1
|
ADCY3
|
adenylate cyclase 3 |
| chr6_-_41673552 | 0.70 |
ENST00000419574.1
ENST00000445214.1 |
TFEB
|
transcription factor EB |
| chr2_+_159825143 | 0.70 |
ENST00000454300.1
ENST00000263635.6 |
TANC1
|
tetratricopeptide repeat, ankyrin repeat and coiled-coil containing 1 |
| chr17_+_39261584 | 0.70 |
ENST00000391415.1
|
KRTAP4-9
|
keratin associated protein 4-9 |
| chr3_-_112013071 | 0.70 |
ENST00000487372.1
ENST00000486574.1 ENST00000305815.5 |
SLC9C1
|
solute carrier family 9, subfamily C (Na+-transporting carboxylic acid decarboxylase), member 1 |
| chr12_+_16500571 | 0.70 |
ENST00000543076.1
ENST00000396210.3 |
MGST1
|
microsomal glutathione S-transferase 1 |
| chr11_-_74660065 | 0.69 |
ENST00000525407.1
ENST00000528219.1 ENST00000531852.1 |
XRRA1
|
X-ray radiation resistance associated 1 |
| chr1_+_212738676 | 0.69 |
ENST00000366981.4
ENST00000366987.2 |
ATF3
|
activating transcription factor 3 |
| chr11_+_72975578 | 0.68 |
ENST00000393592.2
|
P2RY6
|
pyrimidinergic receptor P2Y, G-protein coupled, 6 |
| chr22_+_40742512 | 0.68 |
ENST00000454266.2
ENST00000342312.6 |
ADSL
|
adenylosuccinate lyase |
| chr11_-_82746587 | 0.68 |
ENST00000528379.1
ENST00000534103.1 |
RAB30
|
RAB30, member RAS oncogene family |
| chr15_-_42749711 | 0.67 |
ENST00000565611.1
ENST00000263805.4 ENST00000565948.1 |
ZNF106
|
zinc finger protein 106 |
| chr19_-_49828438 | 0.67 |
ENST00000454748.3
ENST00000598828.1 ENST00000335875.4 |
SLC6A16
|
solute carrier family 6, member 16 |
| chr2_-_90538397 | 0.66 |
ENST00000443397.3
|
RP11-685N3.1
|
Uncharacterized protein |
| chr11_+_72975559 | 0.66 |
ENST00000349767.2
|
P2RY6
|
pyrimidinergic receptor P2Y, G-protein coupled, 6 |
| chr2_+_192110199 | 0.66 |
ENST00000304164.4
|
MYO1B
|
myosin IB |
| chr4_+_123844225 | 0.66 |
ENST00000274008.4
|
SPATA5
|
spermatogenesis associated 5 |
| chr13_-_78492927 | 0.66 |
ENST00000334286.5
|
EDNRB
|
endothelin receptor type B |
| chr22_+_31460091 | 0.65 |
ENST00000432777.1
ENST00000422839.1 |
SMTN
|
smoothelin |
| chr17_-_46671323 | 0.65 |
ENST00000239151.5
|
HOXB5
|
homeobox B5 |
| chrX_-_11445856 | 0.65 |
ENST00000380736.1
|
ARHGAP6
|
Rho GTPase activating protein 6 |
| chr11_-_62457371 | 0.64 |
ENST00000317449.4
|
LRRN4CL
|
LRRN4 C-terminal like |
| chr6_-_31697255 | 0.64 |
ENST00000436437.1
|
DDAH2
|
dimethylarginine dimethylaminohydrolase 2 |
| chr12_-_52845910 | 0.63 |
ENST00000252252.3
|
KRT6B
|
keratin 6B |
| chr4_+_114214125 | 0.63 |
ENST00000509550.1
|
ANK2
|
ankyrin 2, neuronal |
| chr21_-_31933633 | 0.63 |
ENST00000334849.2
|
KRTAP19-7
|
keratin associated protein 19-7 |
| chr2_+_90273679 | 0.62 |
ENST00000423080.2
|
IGKV3D-7
|
immunoglobulin kappa variable 3D-7 |
| chr18_-_6929797 | 0.61 |
ENST00000581725.1
ENST00000583316.1 |
LINC00668
|
long intergenic non-protein coding RNA 668 |
| chr19_+_50016610 | 0.61 |
ENST00000596975.1
|
FCGRT
|
Fc fragment of IgG, receptor, transporter, alpha |
| chr21_+_17791648 | 0.61 |
ENST00000602892.1
ENST00000418813.2 ENST00000435697.1 |
LINC00478
|
long intergenic non-protein coding RNA 478 |
| chr15_+_63340553 | 0.61 |
ENST00000334895.5
|
TPM1
|
tropomyosin 1 (alpha) |
| chr11_+_117103333 | 0.60 |
ENST00000534428.1
|
RNF214
|
ring finger protein 214 |
| chr22_+_44351301 | 0.60 |
ENST00000350028.4
|
SAMM50
|
SAMM50 sorting and assembly machinery component |
| chr11_-_64512469 | 0.59 |
ENST00000377485.1
|
RASGRP2
|
RAS guanyl releasing protein 2 (calcium and DAG-regulated) |
| chr11_+_1874200 | 0.59 |
ENST00000311604.3
|
LSP1
|
lymphocyte-specific protein 1 |
| chr12_+_16500599 | 0.58 |
ENST00000535309.1
ENST00000540056.1 ENST00000396209.1 ENST00000540126.1 |
MGST1
|
microsomal glutathione S-transferase 1 |
| chr1_+_92414952 | 0.58 |
ENST00000449584.1
ENST00000427104.1 ENST00000355011.3 ENST00000448194.1 ENST00000426141.1 ENST00000450792.1 ENST00000548992.1 ENST00000552654.1 ENST00000457265.1 |
BRDT
|
bromodomain, testis-specific |
| chr5_-_98262240 | 0.58 |
ENST00000284049.3
|
CHD1
|
chromodomain helicase DNA binding protein 1 |
| chr6_-_31697563 | 0.57 |
ENST00000375789.2
ENST00000416410.1 |
DDAH2
|
dimethylarginine dimethylaminohydrolase 2 |
| chr7_-_128045984 | 0.56 |
ENST00000470772.1
ENST00000480861.1 ENST00000496200.1 |
IMPDH1
|
IMP (inosine 5'-monophosphate) dehydrogenase 1 |
| chr6_+_30585486 | 0.56 |
ENST00000259873.4
ENST00000506373.2 |
MRPS18B
|
mitochondrial ribosomal protein S18B |
| chr12_+_113659234 | 0.56 |
ENST00000551096.1
ENST00000551099.1 ENST00000335509.6 ENST00000552897.1 ENST00000550785.1 ENST00000549279.1 |
TPCN1
|
two pore segment channel 1 |
| chr8_+_134029937 | 0.56 |
ENST00000518108.1
|
TG
|
thyroglobulin |
| chr21_+_17791838 | 0.56 |
ENST00000453910.1
|
LINC00478
|
long intergenic non-protein coding RNA 478 |
| chr9_-_33447584 | 0.55 |
ENST00000297991.4
|
AQP3
|
aquaporin 3 (Gill blood group) |
| chr4_-_8430152 | 0.55 |
ENST00000514423.1
ENST00000503233.1 |
ACOX3
|
acyl-CoA oxidase 3, pristanoyl |
| chr11_-_74660159 | 0.54 |
ENST00000527087.1
ENST00000321448.8 ENST00000340360.6 |
XRRA1
|
X-ray radiation resistance associated 1 |
| chr2_-_228028829 | 0.53 |
ENST00000396625.3
ENST00000329662.7 |
COL4A4
|
collagen, type IV, alpha 4 |
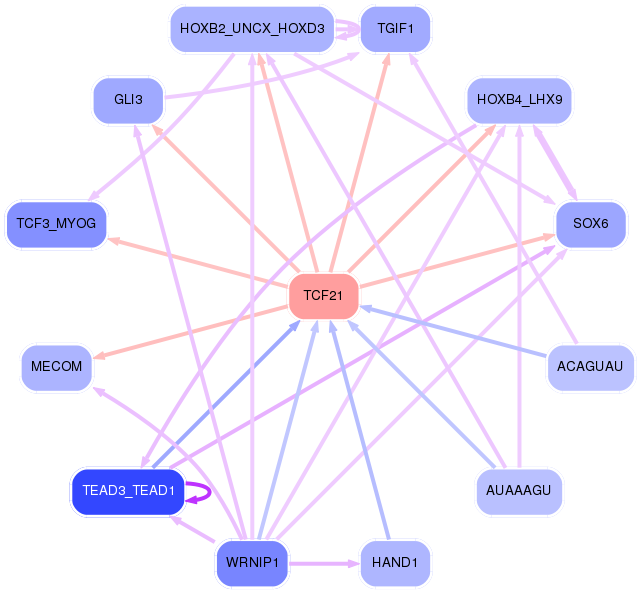
Network of associatons between targets according to the STRING database.

First level regulatory network of TCF21
Gene Ontology Analysis
Gene overrepresentation in biological_process category:
| Log-likelihood per target | Total log-likelihood | Term | Description |
|---|---|---|---|
| 0.8 | 6.4 | GO:0003065 | positive regulation of heart rate by epinephrine(GO:0003065) |
| 0.7 | 6.7 | GO:0070995 | NADPH oxidation(GO:0070995) |
| 0.7 | 2.0 | GO:0035359 | negative regulation of peroxisome proliferator activated receptor signaling pathway(GO:0035359) |
| 0.6 | 1.8 | GO:1902283 | negative regulation of primary amine oxidase activity(GO:1902283) |
| 0.6 | 1.7 | GO:0002337 | B-1a B cell differentiation(GO:0002337) |
| 0.5 | 1.6 | GO:0007497 | posterior midgut development(GO:0007497) endothelin receptor signaling pathway(GO:0086100) |
| 0.5 | 2.6 | GO:0007525 | somatic muscle development(GO:0007525) |
| 0.5 | 2.6 | GO:0090341 | negative regulation of secretion of lysosomal enzymes(GO:0090341) |
| 0.5 | 1.8 | GO:0043456 | regulation of pentose-phosphate shunt(GO:0043456) |
| 0.4 | 3.1 | GO:2001288 | positive regulation of caveolin-mediated endocytosis(GO:2001288) |
| 0.4 | 1.3 | GO:0071449 | cellular response to lipid hydroperoxide(GO:0071449) |
| 0.4 | 1.7 | GO:0097195 | pilomotor reflex(GO:0097195) |
| 0.4 | 10.0 | GO:0048739 | cardiac muscle fiber development(GO:0048739) |
| 0.4 | 0.4 | GO:0043449 | cellular alkene metabolic process(GO:0043449) |
| 0.4 | 1.8 | GO:0036115 | fatty-acyl-CoA catabolic process(GO:0036115) |
| 0.4 | 2.8 | GO:0048014 | Tie signaling pathway(GO:0048014) |
| 0.3 | 5.9 | GO:0006600 | creatine metabolic process(GO:0006600) |
| 0.3 | 1.2 | GO:0032915 | positive regulation of transforming growth factor beta2 production(GO:0032915) |
| 0.3 | 0.9 | GO:0021776 | smoothened signaling pathway involved in ventral spinal cord interneuron specification(GO:0021775) smoothened signaling pathway involved in spinal cord motor neuron cell fate specification(GO:0021776) |
| 0.3 | 1.6 | GO:0002317 | plasma cell differentiation(GO:0002317) |
| 0.3 | 0.8 | GO:0006624 | vacuolar protein processing(GO:0006624) |
| 0.3 | 2.0 | GO:2001137 | positive regulation of endocytic recycling(GO:2001137) |
| 0.2 | 1.2 | GO:0051562 | negative regulation of mitochondrial calcium ion concentration(GO:0051562) |
| 0.2 | 2.3 | GO:0036072 | intramembranous ossification(GO:0001957) direct ossification(GO:0036072) |
| 0.2 | 0.7 | GO:0061394 | regulation of transcription from RNA polymerase II promoter in response to arsenic-containing substance(GO:0061394) |
| 0.2 | 0.9 | GO:0009726 | detection of endogenous stimulus(GO:0009726) |
| 0.2 | 0.6 | GO:0002416 | IgG immunoglobulin transcytosis in epithelial cells mediated by FcRn immunoglobulin receptor(GO:0002416) |
| 0.2 | 0.6 | GO:0051039 | histone displacement(GO:0001207) positive regulation of transcription involved in meiotic cell cycle(GO:0051039) |
| 0.2 | 0.7 | GO:0009386 | translational attenuation(GO:0009386) |
| 0.2 | 0.9 | GO:0048749 | compound eye development(GO:0048749) |
| 0.2 | 0.7 | GO:0008355 | olfactory learning(GO:0008355) |
| 0.2 | 1.4 | GO:2000860 | positive regulation of mineralocorticoid secretion(GO:2000857) positive regulation of aldosterone secretion(GO:2000860) |
| 0.2 | 12.5 | GO:0030049 | muscle filament sliding(GO:0030049) actin-myosin filament sliding(GO:0033275) |
| 0.2 | 0.5 | GO:1904761 | negative regulation of myofibroblast differentiation(GO:1904761) |
| 0.2 | 1.0 | GO:0021779 | oligodendrocyte cell fate specification(GO:0021778) oligodendrocyte cell fate commitment(GO:0021779) glial cell fate specification(GO:0021780) |
| 0.2 | 1.0 | GO:0035407 | histone H3-T11 phosphorylation(GO:0035407) |
| 0.2 | 0.9 | GO:0098907 | regulation of SA node cell action potential(GO:0098907) |
| 0.2 | 1.2 | GO:0048539 | bone marrow development(GO:0048539) |
| 0.2 | 0.9 | GO:2000661 | positive regulation of interleukin-1-mediated signaling pathway(GO:2000661) |
| 0.2 | 1.1 | GO:0071503 | positive regulation of lipoprotein particle clearance(GO:0010986) response to heparin(GO:0071503) |
| 0.1 | 1.6 | GO:2000767 | positive regulation of cytoplasmic translation(GO:2000767) |
| 0.1 | 0.4 | GO:0015670 | carbon dioxide transport(GO:0015670) |
| 0.1 | 3.8 | GO:0006123 | mitochondrial electron transport, cytochrome c to oxygen(GO:0006123) |
| 0.1 | 0.7 | GO:0044208 | 'de novo' AMP biosynthetic process(GO:0044208) |
| 0.1 | 1.3 | GO:0071963 | establishment or maintenance of cell polarity regulating cell shape(GO:0071963) |
| 0.1 | 0.8 | GO:0002925 | positive regulation of humoral immune response mediated by circulating immunoglobulin(GO:0002925) |
| 0.1 | 2.1 | GO:0060628 | regulation of ER to Golgi vesicle-mediated transport(GO:0060628) |
| 0.1 | 0.4 | GO:0007057 | spindle assembly involved in female meiosis I(GO:0007057) |
| 0.1 | 0.4 | GO:1901656 | glycoside transport(GO:1901656) |
| 0.1 | 0.7 | GO:0060754 | positive regulation of mast cell chemotaxis(GO:0060754) |
| 0.1 | 2.7 | GO:0035090 | maintenance of apical/basal cell polarity(GO:0035090) maintenance of epithelial cell apical/basal polarity(GO:0045199) |
| 0.1 | 0.4 | GO:0006258 | UDP-glucose catabolic process(GO:0006258) |
| 0.1 | 1.0 | GO:0055011 | atrial cardiac muscle cell differentiation(GO:0055011) atrial cardiac muscle cell development(GO:0055014) |
| 0.1 | 1.9 | GO:1904706 | negative regulation of vascular smooth muscle cell proliferation(GO:1904706) |
| 0.1 | 0.5 | GO:0007228 | positive regulation of hh target transcription factor activity(GO:0007228) |
| 0.1 | 0.3 | GO:0046901 | tetrahydrofolylpolyglutamate biosynthetic process(GO:0046901) |
| 0.1 | 0.4 | GO:0000711 | meiotic DNA repair synthesis(GO:0000711) |
| 0.1 | 0.8 | GO:0002326 | B cell lineage commitment(GO:0002326) immunoglobulin V(D)J recombination(GO:0033152) |
| 0.1 | 1.3 | GO:1901387 | positive regulation of voltage-gated calcium channel activity(GO:1901387) |
| 0.1 | 1.1 | GO:0045040 | protein import into mitochondrial outer membrane(GO:0045040) |
| 0.1 | 2.2 | GO:0002003 | angiotensin maturation(GO:0002003) |
| 0.1 | 1.4 | GO:0060842 | arterial endothelial cell differentiation(GO:0060842) |
| 0.1 | 2.2 | GO:0007175 | negative regulation of epidermal growth factor-activated receptor activity(GO:0007175) |
| 0.1 | 0.5 | GO:0006121 | mitochondrial electron transport, succinate to ubiquinone(GO:0006121) |
| 0.1 | 1.5 | GO:0030321 | transepithelial chloride transport(GO:0030321) |
| 0.1 | 0.7 | GO:1902044 | regulation of Fas signaling pathway(GO:1902044) |
| 0.1 | 0.6 | GO:0090649 | renal water absorption(GO:0070295) response to oxygen-glucose deprivation(GO:0090649) cellular response to oxygen-glucose deprivation(GO:0090650) |
| 0.1 | 0.8 | GO:0006627 | protein processing involved in protein targeting to mitochondrion(GO:0006627) |
| 0.1 | 0.8 | GO:0070236 | negative regulation of activation-induced cell death of T cells(GO:0070236) |
| 0.1 | 0.5 | GO:0016476 | regulation of embryonic cell shape(GO:0016476) |
| 0.1 | 0.3 | GO:0060152 | peroxisome localization(GO:0060151) microtubule-based peroxisome localization(GO:0060152) |
| 0.1 | 0.8 | GO:0042997 | negative regulation of Golgi to plasma membrane protein transport(GO:0042997) |
| 0.1 | 1.2 | GO:0036066 | protein O-linked fucosylation(GO:0036066) |
| 0.1 | 0.9 | GO:0021615 | glossopharyngeal nerve morphogenesis(GO:0021615) |
| 0.1 | 0.6 | GO:0006177 | GMP biosynthetic process(GO:0006177) |
| 0.1 | 0.6 | GO:0016557 | peroxisome membrane biogenesis(GO:0016557) |
| 0.1 | 0.9 | GO:0015889 | cobalt ion transport(GO:0006824) cobalamin transport(GO:0015889) |
| 0.1 | 0.4 | GO:0036378 | calcitriol biosynthetic process from calciol(GO:0036378) |
| 0.1 | 0.5 | GO:0051697 | protein delipidation(GO:0051697) |
| 0.1 | 0.9 | GO:0001731 | formation of translation preinitiation complex(GO:0001731) |
| 0.1 | 0.4 | GO:0060800 | regulation of cell differentiation involved in embryonic placenta development(GO:0060800) |
| 0.1 | 0.3 | GO:0070173 | regulation of enamel mineralization(GO:0070173) |
| 0.1 | 0.3 | GO:0021650 | vestibulocochlear nerve formation(GO:0021650) |
| 0.1 | 0.8 | GO:0046598 | positive regulation of viral entry into host cell(GO:0046598) |
| 0.1 | 0.8 | GO:0051918 | negative regulation of fibrinolysis(GO:0051918) |
| 0.1 | 0.1 | GO:0036112 | medium-chain fatty-acyl-CoA metabolic process(GO:0036112) |
| 0.1 | 0.3 | GO:0090156 | cellular sphingolipid homeostasis(GO:0090156) |
| 0.1 | 1.2 | GO:0006527 | arginine catabolic process(GO:0006527) |
| 0.1 | 0.2 | GO:0034476 | U1 snRNA 3'-end processing(GO:0034473) U5 snRNA 3'-end processing(GO:0034476) |
| 0.1 | 2.0 | GO:0008053 | mitochondrial fusion(GO:0008053) |
| 0.1 | 1.5 | GO:0003334 | keratinocyte development(GO:0003334) |
| 0.1 | 0.2 | GO:0045047 | protein targeting to ER(GO:0045047) establishment of protein localization to endoplasmic reticulum(GO:0072599) |
| 0.1 | 2.0 | GO:0045725 | positive regulation of glycogen biosynthetic process(GO:0045725) |
| 0.1 | 0.3 | GO:0070212 | protein poly-ADP-ribosylation(GO:0070212) |
| 0.1 | 0.8 | GO:0060613 | fat pad development(GO:0060613) |
| 0.0 | 1.8 | GO:0031581 | hemidesmosome assembly(GO:0031581) |
| 0.0 | 0.4 | GO:0048630 | skeletal muscle tissue growth(GO:0048630) |
| 0.0 | 0.4 | GO:0036438 | maintenance of lens transparency(GO:0036438) |
| 0.0 | 0.7 | GO:0006108 | malate metabolic process(GO:0006108) |
| 0.0 | 0.8 | GO:0018298 | protein-chromophore linkage(GO:0018298) |
| 0.0 | 0.5 | GO:0046886 | positive regulation of hormone biosynthetic process(GO:0046886) |
| 0.0 | 0.2 | GO:0090076 | relaxation of skeletal muscle(GO:0090076) |
| 0.0 | 0.1 | GO:0021773 | striatal medium spiny neuron differentiation(GO:0021773) negative regulation of B cell differentiation(GO:0045578) positive regulation of ovulation(GO:0060279) |
| 0.0 | 0.3 | GO:0035610 | protein side chain deglutamylation(GO:0035610) |
| 0.0 | 0.1 | GO:0035038 | female pronucleus assembly(GO:0035038) |
| 0.0 | 0.4 | GO:1903265 | positive regulation of tumor necrosis factor-mediated signaling pathway(GO:1903265) |
| 0.0 | 0.4 | GO:0061732 | mitochondrial acetyl-CoA biosynthetic process from pyruvate(GO:0061732) |
| 0.0 | 1.2 | GO:2001046 | positive regulation of integrin-mediated signaling pathway(GO:2001046) |
| 0.0 | 0.2 | GO:0002949 | tRNA threonylcarbamoyladenosine modification(GO:0002949) |
| 0.0 | 0.8 | GO:2000096 | positive regulation of Wnt signaling pathway, planar cell polarity pathway(GO:2000096) |
| 0.0 | 0.5 | GO:0042090 | interleukin-12 biosynthetic process(GO:0042090) regulation of interleukin-12 biosynthetic process(GO:0045075) |
| 0.0 | 0.6 | GO:0015705 | iodide transport(GO:0015705) |
| 0.0 | 0.2 | GO:0072312 | metanephric glomerular epithelium development(GO:0072244) metanephric glomerular visceral epithelial cell differentiation(GO:0072248) metanephric glomerular visceral epithelial cell development(GO:0072249) metanephric glomerular epithelial cell differentiation(GO:0072312) metanephric glomerular epithelial cell development(GO:0072313) |
| 0.0 | 0.2 | GO:0006574 | valine catabolic process(GO:0006574) |
| 0.0 | 0.5 | GO:0002051 | osteoblast fate commitment(GO:0002051) |
| 0.0 | 0.5 | GO:0042737 | drug catabolic process(GO:0042737) |
| 0.0 | 1.1 | GO:0035988 | chondrocyte proliferation(GO:0035988) |
| 0.0 | 0.1 | GO:1990637 | response to prolactin(GO:1990637) |
| 0.0 | 0.3 | GO:0086024 | adrenergic receptor signaling pathway involved in positive regulation of heart rate(GO:0086024) |
| 0.0 | 0.7 | GO:0098719 | sodium ion import across plasma membrane(GO:0098719) sodium ion import into cell(GO:1990118) |
| 0.0 | 2.0 | GO:0032467 | positive regulation of cytokinesis(GO:0032467) |
| 0.0 | 0.4 | GO:0030259 | lipid glycosylation(GO:0030259) |
| 0.0 | 0.4 | GO:0048194 | Golgi vesicle budding(GO:0048194) |
| 0.0 | 2.3 | GO:0015701 | bicarbonate transport(GO:0015701) |
| 0.0 | 0.5 | GO:0043402 | glucocorticoid mediated signaling pathway(GO:0043402) |
| 0.0 | 1.2 | GO:0071425 | hematopoietic stem cell proliferation(GO:0071425) |
| 0.0 | 0.3 | GO:0071169 | establishment of protein localization to chromatin(GO:0071169) |
| 0.0 | 0.1 | GO:0034124 | regulation of MyD88-dependent toll-like receptor signaling pathway(GO:0034124) |
| 0.0 | 0.1 | GO:0006613 | cotranslational protein targeting to membrane(GO:0006613) |
| 0.0 | 0.4 | GO:0016255 | attachment of GPI anchor to protein(GO:0016255) |
| 0.0 | 0.4 | GO:0032328 | alanine transport(GO:0032328) D-amino acid transport(GO:0042940) |
| 0.0 | 0.7 | GO:0043923 | positive regulation by host of viral transcription(GO:0043923) |
| 0.0 | 0.2 | GO:0061086 | negative regulation of histone H3-K27 methylation(GO:0061086) chromatin maintenance(GO:0070827) |
| 0.0 | 0.8 | GO:0006895 | Golgi to endosome transport(GO:0006895) |
| 0.0 | 0.2 | GO:0000821 | regulation of arginine metabolic process(GO:0000821) |
| 0.0 | 0.7 | GO:0097062 | dendritic spine maintenance(GO:0097062) |
| 0.0 | 1.8 | GO:0030212 | hyaluronan metabolic process(GO:0030212) |
| 0.0 | 0.8 | GO:0033540 | fatty acid beta-oxidation using acyl-CoA oxidase(GO:0033540) |
| 0.0 | 4.0 | GO:0030449 | regulation of complement activation(GO:0030449) |
| 0.0 | 2.4 | GO:0000271 | polysaccharide biosynthetic process(GO:0000271) |
| 0.0 | 0.2 | GO:0006552 | leucine catabolic process(GO:0006552) |
| 0.0 | 0.4 | GO:0072321 | chaperone-mediated protein transport(GO:0072321) |
| 0.0 | 0.5 | GO:0051775 | response to redox state(GO:0051775) |
| 0.0 | 1.7 | GO:0048384 | retinoic acid receptor signaling pathway(GO:0048384) |
| 0.0 | 2.7 | GO:0006501 | C-terminal protein lipidation(GO:0006501) |
| 0.0 | 0.7 | GO:0008286 | insulin receptor signaling pathway(GO:0008286) |
| 0.0 | 0.1 | GO:1990086 | lens fiber cell apoptotic process(GO:1990086) |
| 0.0 | 0.5 | GO:0043153 | entrainment of circadian clock by photoperiod(GO:0043153) |
| 0.0 | 1.2 | GO:0010165 | response to X-ray(GO:0010165) |
| 0.0 | 1.2 | GO:0043252 | sodium-independent organic anion transport(GO:0043252) |
| 0.0 | 0.3 | GO:0006878 | cellular copper ion homeostasis(GO:0006878) |
| 0.0 | 0.6 | GO:0045880 | positive regulation of smoothened signaling pathway(GO:0045880) |
| 0.0 | 0.2 | GO:0060056 | mammary gland involution(GO:0060056) |
| 0.0 | 0.1 | GO:1904720 | regulation of mRNA cleavage(GO:0031437) negative regulation of mRNA cleavage(GO:0031438) regulation of mRNA endonucleolytic cleavage involved in unfolded protein response(GO:1904720) negative regulation of mRNA endonucleolytic cleavage involved in unfolded protein response(GO:1904721) |
| 0.0 | 0.3 | GO:1902916 | positive regulation of protein polyubiquitination(GO:1902916) |
| 0.0 | 0.2 | GO:0006621 | protein retention in ER lumen(GO:0006621) |
| 0.0 | 0.2 | GO:0032057 | negative regulation of translational initiation in response to stress(GO:0032057) |
| 0.0 | 0.3 | GO:0044387 | negative regulation of protein kinase activity by regulation of protein phosphorylation(GO:0044387) |
| 0.0 | 0.3 | GO:0010745 | negative regulation of macrophage derived foam cell differentiation(GO:0010745) |
| 0.0 | 0.3 | GO:0000722 | telomere maintenance via recombination(GO:0000722) |
| 0.0 | 0.2 | GO:0006268 | DNA unwinding involved in DNA replication(GO:0006268) |
| 0.0 | 0.4 | GO:1903069 | regulation of ER-associated ubiquitin-dependent protein catabolic process(GO:1903069) |
| 0.0 | 0.1 | GO:0042369 | vitamin D catabolic process(GO:0042369) |
| 0.0 | 0.1 | GO:1903232 | melanosome assembly(GO:1903232) |
| 0.0 | 0.5 | GO:0090083 | regulation of inclusion body assembly(GO:0090083) |
| 0.0 | 0.0 | GO:0070781 | response to biotin(GO:0070781) |
| 0.0 | 0.6 | GO:0007398 | ectoderm development(GO:0007398) |
| 0.0 | 0.8 | GO:0048286 | lung alveolus development(GO:0048286) |
| 0.0 | 0.5 | GO:0045898 | regulation of RNA polymerase II transcriptional preinitiation complex assembly(GO:0045898) |
| 0.0 | 0.5 | GO:0016486 | peptide hormone processing(GO:0016486) |
| 0.0 | 0.1 | GO:0060022 | hard palate development(GO:0060022) |
| 0.0 | 1.0 | GO:0007588 | excretion(GO:0007588) |
| 0.0 | 0.2 | GO:0002097 | tRNA wobble base modification(GO:0002097) |
| 0.0 | 0.9 | GO:0031529 | ruffle organization(GO:0031529) |
| 0.0 | 0.5 | GO:0001934 | positive regulation of protein phosphorylation(GO:0001934) |
| 0.0 | 0.4 | GO:0032060 | bleb assembly(GO:0032060) |
| 0.0 | 0.2 | GO:0032836 | glomerular basement membrane development(GO:0032836) |
| 0.0 | 0.1 | GO:1902261 | positive regulation of delayed rectifier potassium channel activity(GO:1902261) |
| 0.0 | 0.4 | GO:1902857 | positive regulation of nonmotile primary cilium assembly(GO:1902857) |
| 0.0 | 0.3 | GO:0050860 | negative regulation of T cell receptor signaling pathway(GO:0050860) |
| 0.0 | 0.5 | GO:0061641 | CENP-A containing nucleosome assembly(GO:0034080) CENP-A containing chromatin organization(GO:0061641) |
| 0.0 | 0.2 | GO:0070828 | heterochromatin organization(GO:0070828) |
| 0.0 | 1.6 | GO:0006939 | smooth muscle contraction(GO:0006939) |
| 0.0 | 1.0 | GO:0006968 | cellular defense response(GO:0006968) |
| 0.0 | 2.4 | GO:0031424 | keratinization(GO:0031424) |
| 0.0 | 0.3 | GO:0045589 | regulation of regulatory T cell differentiation(GO:0045589) |
| 0.0 | 0.6 | GO:0060612 | adipose tissue development(GO:0060612) |
| 0.0 | 0.3 | GO:0045332 | phospholipid translocation(GO:0045332) |
| 0.0 | 0.3 | GO:0032354 | response to follicle-stimulating hormone(GO:0032354) |
Gene overrepresentation in cellular_component category:
| Log-likelihood per target | Total log-likelihood | Term | Description |
|---|---|---|---|
| 0.4 | 2.0 | GO:0005602 | complement component C1 complex(GO:0005602) |
| 0.3 | 6.9 | GO:0005862 | muscle thin filament tropomyosin(GO:0005862) |
| 0.3 | 2.0 | GO:0005899 | insulin receptor complex(GO:0005899) |
| 0.3 | 1.7 | GO:0034678 | smooth muscle contractile fiber(GO:0030485) integrin alpha8-beta1 complex(GO:0034678) |
| 0.3 | 0.8 | GO:0042720 | mitochondrial inner membrane peptidase complex(GO:0042720) |
| 0.2 | 0.7 | GO:1990622 | CHOP-ATF3 complex(GO:1990622) |
| 0.2 | 3.6 | GO:0005751 | mitochondrial respiratory chain complex IV(GO:0005751) |
| 0.2 | 1.6 | GO:0061617 | MICOS complex(GO:0061617) |
| 0.2 | 4.6 | GO:0005861 | troponin complex(GO:0005861) |
| 0.2 | 0.8 | GO:0016222 | procollagen-proline 4-dioxygenase complex(GO:0016222) |
| 0.2 | 0.7 | GO:0045277 | respiratory chain complex IV(GO:0045277) |
| 0.1 | 0.5 | GO:0045273 | mitochondrial respiratory chain complex II, succinate dehydrogenase complex (ubiquinone)(GO:0005749) succinate dehydrogenase complex (ubiquinone)(GO:0045257) respiratory chain complex II(GO:0045273) succinate dehydrogenase complex(GO:0045281) fumarate reductase complex(GO:0045283) |
| 0.1 | 2.0 | GO:0036449 | microtubule minus-end(GO:0036449) |
| 0.1 | 12.3 | GO:0031672 | A band(GO:0031672) |
| 0.1 | 0.8 | GO:0036021 | endolysosome lumen(GO:0036021) |
| 0.1 | 0.4 | GO:0042585 | germinal vesicle(GO:0042585) |
| 0.1 | 1.1 | GO:0016013 | syntrophin complex(GO:0016013) |
| 0.1 | 1.5 | GO:0098799 | outer mitochondrial membrane protein complex(GO:0098799) |
| 0.1 | 0.8 | GO:0000138 | Golgi trans cisterna(GO:0000138) |
| 0.1 | 19.5 | GO:0030018 | Z disc(GO:0030018) |
| 0.1 | 0.9 | GO:0005610 | laminin-5 complex(GO:0005610) |
| 0.1 | 0.4 | GO:0042765 | GPI-anchor transamidase complex(GO:0042765) |
| 0.1 | 1.3 | GO:0044233 | ER-mitochondrion membrane contact site(GO:0044233) |
| 0.1 | 0.5 | GO:0000235 | astral microtubule(GO:0000235) aster(GO:0005818) |
| 0.1 | 0.5 | GO:0005587 | collagen type IV trimer(GO:0005587) |
| 0.1 | 0.3 | GO:1990037 | Lewy body core(GO:1990037) |
| 0.1 | 0.7 | GO:0030870 | Mre11 complex(GO:0030870) |
| 0.1 | 1.0 | GO:0005859 | muscle myosin complex(GO:0005859) |
| 0.1 | 2.7 | GO:0009925 | basal plasma membrane(GO:0009925) |
| 0.1 | 0.3 | GO:0035339 | SPOTS complex(GO:0035339) |
| 0.1 | 3.0 | GO:0046658 | anchored component of plasma membrane(GO:0046658) |
| 0.1 | 0.2 | GO:0000408 | EKC/KEOPS complex(GO:0000408) |
| 0.0 | 0.4 | GO:0097169 | AIM2 inflammasome complex(GO:0097169) |
| 0.0 | 0.4 | GO:0042719 | mitochondrial intermembrane space protein transporter complex(GO:0042719) |
| 0.0 | 0.1 | GO:0043511 | inhibin complex(GO:0043511) inhibin A complex(GO:0043512) |
| 0.0 | 0.3 | GO:0005947 | mitochondrial alpha-ketoglutarate dehydrogenase complex(GO:0005947) |
| 0.0 | 0.2 | GO:1905202 | 3-methylcrotonyl-CoA carboxylase complex, mitochondrial(GO:0002169) methylcrotonoyl-CoA carboxylase complex(GO:1905202) |
| 0.0 | 2.3 | GO:0030017 | sarcomere(GO:0030017) |
| 0.0 | 0.2 | GO:0034388 | Pwp2p-containing subcomplex of 90S preribosome(GO:0034388) |
| 0.0 | 0.4 | GO:0033588 | Elongator holoenzyme complex(GO:0033588) |
| 0.0 | 0.3 | GO:0032311 | angiogenin-PRI complex(GO:0032311) |
| 0.0 | 0.3 | GO:0035061 | interchromatin granule(GO:0035061) |
| 0.0 | 0.4 | GO:0045254 | pyruvate dehydrogenase complex(GO:0045254) |
| 0.0 | 3.2 | GO:0045095 | keratin filament(GO:0045095) |
| 0.0 | 2.6 | GO:0031907 | peroxisomal matrix(GO:0005782) microbody lumen(GO:0031907) |
| 0.0 | 0.9 | GO:0005779 | integral component of peroxisomal membrane(GO:0005779) intrinsic component of peroxisomal membrane(GO:0031231) |
| 0.0 | 0.7 | GO:0016327 | apicolateral plasma membrane(GO:0016327) |
| 0.0 | 0.9 | GO:0043218 | compact myelin(GO:0043218) |
| 0.0 | 0.4 | GO:0070652 | HAUS complex(GO:0070652) |
| 0.0 | 0.4 | GO:0016281 | eukaryotic translation initiation factor 4F complex(GO:0016281) |
| 0.0 | 0.7 | GO:0048471 | perinuclear region of cytoplasm(GO:0048471) |
| 0.0 | 0.3 | GO:0032777 | Piccolo NuA4 histone acetyltransferase complex(GO:0032777) |
| 0.0 | 0.8 | GO:0097381 | photoreceptor disc membrane(GO:0097381) |
| 0.0 | 2.0 | GO:0055038 | recycling endosome membrane(GO:0055038) |
| 0.0 | 2.4 | GO:0032154 | cleavage furrow(GO:0032154) cell surface furrow(GO:0097610) |
| 0.0 | 0.7 | GO:0008074 | guanylate cyclase complex, soluble(GO:0008074) |
| 0.0 | 0.2 | GO:0005851 | eukaryotic translation initiation factor 2B complex(GO:0005851) |
| 0.0 | 0.5 | GO:0071141 | SMAD protein complex(GO:0071141) |
| 0.0 | 1.2 | GO:0016459 | myosin complex(GO:0016459) |
| 0.0 | 1.3 | GO:0005778 | peroxisomal membrane(GO:0005778) microbody membrane(GO:0031903) |
| 0.0 | 1.5 | GO:0005844 | polysome(GO:0005844) |
| 0.0 | 2.8 | GO:0000118 | histone deacetylase complex(GO:0000118) |
| 0.0 | 2.7 | GO:0016605 | PML body(GO:0016605) |
| 0.0 | 0.9 | GO:0016592 | mediator complex(GO:0016592) |
| 0.0 | 0.6 | GO:0000314 | organellar small ribosomal subunit(GO:0000314) mitochondrial small ribosomal subunit(GO:0005763) |
| 0.0 | 3.8 | GO:0090575 | RNA polymerase II transcription factor complex(GO:0090575) |
| 0.0 | 0.9 | GO:0022627 | cytosolic small ribosomal subunit(GO:0022627) |
| 0.0 | 0.4 | GO:0031105 | septin complex(GO:0031105) |
| 0.0 | 0.5 | GO:0044447 | axoneme part(GO:0044447) |
| 0.0 | 0.9 | GO:0016235 | aggresome(GO:0016235) |
| 0.0 | 0.2 | GO:0036056 | filtration diaphragm(GO:0036056) slit diaphragm(GO:0036057) |
| 0.0 | 0.4 | GO:0005892 | acetylcholine-gated channel complex(GO:0005892) |
| 0.0 | 0.2 | GO:0032426 | stereocilium tip(GO:0032426) |
| 0.0 | 0.1 | GO:0014701 | junctional sarcoplasmic reticulum membrane(GO:0014701) |
| 0.0 | 1.4 | GO:0005902 | microvillus(GO:0005902) |
| 0.0 | 1.3 | GO:0005811 | lipid particle(GO:0005811) |
| 0.0 | 0.2 | GO:0070938 | contractile ring(GO:0070938) |
| 0.0 | 0.8 | GO:0005801 | cis-Golgi network(GO:0005801) |
| 0.0 | 0.9 | GO:1904724 | tertiary granule lumen(GO:1904724) |
| 0.0 | 0.1 | GO:0005662 | DNA replication factor A complex(GO:0005662) |
| 0.0 | 2.0 | GO:0031225 | anchored component of membrane(GO:0031225) |
| 0.0 | 0.3 | GO:0032420 | stereocilium(GO:0032420) |
| 0.0 | 0.9 | GO:0060170 | ciliary membrane(GO:0060170) |
Gene overrepresentation in molecular_function category:
| Log-likelihood per target | Total log-likelihood | Term | Description |
|---|---|---|---|
| 1.2 | 6.2 | GO:0032038 | myosin II heavy chain binding(GO:0032038) |
| 1.2 | 4.6 | GO:0030899 | calcium-dependent ATPase activity(GO:0030899) |
| 0.8 | 7.2 | GO:0004499 | N,N-dimethylaniline monooxygenase activity(GO:0004499) |
| 0.6 | 5.9 | GO:0004111 | creatine kinase activity(GO:0004111) |
| 0.5 | 1.6 | GO:0004962 | endothelin receptor activity(GO:0004962) |
| 0.5 | 1.8 | GO:0046538 | bisphosphoglycerate mutase activity(GO:0004082) phosphoglycerate mutase activity(GO:0004619) 2,3-bisphosphoglycerate-dependent phosphoglycerate mutase activity(GO:0046538) |
| 0.4 | 1.8 | GO:0052594 | tryptamine:oxygen oxidoreductase (deaminating) activity(GO:0052593) aminoacetone:oxygen oxidoreductase(deaminating) activity(GO:0052594) aliphatic-amine oxidase activity(GO:0052595) phenethylamine:oxygen oxidoreductase (deaminating) activity(GO:0052596) |
| 0.4 | 1.3 | GO:0030395 | lactose binding(GO:0030395) |
| 0.4 | 3.0 | GO:0035473 | lipase binding(GO:0035473) |
| 0.3 | 2.6 | GO:0032810 | sterol response element binding(GO:0032810) |
| 0.3 | 0.8 | GO:0072591 | citrate-L-glutamate ligase activity(GO:0072591) |
| 0.2 | 2.9 | GO:0071253 | connexin binding(GO:0071253) |
| 0.2 | 2.2 | GO:0045029 | UDP-activated nucleotide receptor activity(GO:0045029) |
| 0.2 | 0.4 | GO:0004886 | 9-cis retinoic acid receptor activity(GO:0004886) |
| 0.2 | 0.7 | GO:0047860 | diiodophenylpyruvate reductase activity(GO:0047860) |
| 0.2 | 1.2 | GO:0016403 | dimethylargininase activity(GO:0016403) |
| 0.2 | 22.2 | GO:0008307 | structural constituent of muscle(GO:0008307) |
| 0.2 | 1.0 | GO:0035402 | histone kinase activity (H3-T11 specific)(GO:0035402) |
| 0.2 | 0.5 | GO:0008177 | succinate dehydrogenase (ubiquinone) activity(GO:0008177) |
| 0.1 | 0.4 | GO:0070576 | vitamin D 24-hydroxylase activity(GO:0070576) |
| 0.1 | 0.8 | GO:0070644 | vitamin D response element binding(GO:0070644) |
| 0.1 | 4.1 | GO:0070006 | metalloaminopeptidase activity(GO:0070006) |
| 0.1 | 0.9 | GO:0004909 | interleukin-1, Type I, activating receptor activity(GO:0004909) |
| 0.1 | 0.6 | GO:0019770 | IgG receptor activity(GO:0019770) |
| 0.1 | 4.2 | GO:0004129 | cytochrome-c oxidase activity(GO:0004129) heme-copper terminal oxidase activity(GO:0015002) oxidoreductase activity, acting on a heme group of donors, oxygen as acceptor(GO:0016676) |
| 0.1 | 0.7 | GO:0043183 | vascular endothelial growth factor receptor 1 binding(GO:0043183) |
| 0.1 | 0.5 | GO:0004874 | aryl hydrocarbon receptor activity(GO:0004874) |
| 0.1 | 2.7 | GO:0008093 | cytoskeletal adaptor activity(GO:0008093) |
| 0.1 | 0.6 | GO:0003938 | IMP dehydrogenase activity(GO:0003938) |
| 0.1 | 0.6 | GO:0015254 | glycerol channel activity(GO:0015254) |
| 0.1 | 0.9 | GO:0015562 | efflux transmembrane transporter activity(GO:0015562) |
| 0.1 | 0.3 | GO:0048763 | calcium-induced calcium release activity(GO:0048763) |
| 0.1 | 0.3 | GO:0004326 | tetrahydrofolylpolyglutamate synthase activity(GO:0004326) dihydrofolate synthase activity(GO:0008841) |
| 0.1 | 1.7 | GO:0051371 | muscle alpha-actinin binding(GO:0051371) |
| 0.1 | 1.7 | GO:0004089 | carbonate dehydratase activity(GO:0004089) |
| 0.1 | 0.6 | GO:0072345 | NAADP-sensitive calcium-release channel activity(GO:0072345) |
| 0.1 | 0.4 | GO:0070643 | vitamin D3 25-hydroxylase activity(GO:0030343) vitamin D 25-hydroxylase activity(GO:0070643) |
| 0.1 | 0.8 | GO:0043426 | MRF binding(GO:0043426) |
| 0.1 | 0.8 | GO:0019798 | procollagen-proline 4-dioxygenase activity(GO:0004656) procollagen-proline dioxygenase activity(GO:0019798) |
| 0.1 | 0.7 | GO:0070087 | chromo shadow domain binding(GO:0070087) |
| 0.1 | 0.2 | GO:0045155 | electron transporter, transferring electrons from CoQH2-cytochrome c reductase complex and cytochrome c oxidase complex activity(GO:0045155) |
| 0.1 | 3.2 | GO:0004181 | metallocarboxypeptidase activity(GO:0004181) |
| 0.1 | 0.8 | GO:0019863 | IgE binding(GO:0019863) |
| 0.1 | 0.5 | GO:0016402 | pristanoyl-CoA oxidase activity(GO:0016402) |
| 0.1 | 0.4 | GO:0003923 | GPI-anchor transamidase activity(GO:0003923) |
| 0.1 | 0.9 | GO:0031419 | cobalamin binding(GO:0031419) |
| 0.1 | 0.7 | GO:0016842 | amidine-lyase activity(GO:0016842) |
| 0.1 | 1.3 | GO:0008140 | cAMP response element binding protein binding(GO:0008140) |
| 0.1 | 1.3 | GO:0043295 | glutathione binding(GO:0043295) oligopeptide binding(GO:1900750) |
| 0.1 | 0.8 | GO:0098599 | palmitoyl-(protein) hydrolase activity(GO:0008474) palmitoyl hydrolase activity(GO:0098599) |
| 0.1 | 0.8 | GO:0008020 | G-protein coupled photoreceptor activity(GO:0008020) |
| 0.1 | 0.2 | GO:0005046 | KDEL sequence binding(GO:0005046) |
| 0.1 | 0.7 | GO:0008420 | CTD phosphatase activity(GO:0008420) |
| 0.1 | 0.3 | GO:0004165 | dodecenoyl-CoA delta-isomerase activity(GO:0004165) |
| 0.1 | 0.5 | GO:0038051 | glucocorticoid receptor activity(GO:0004883) glucocorticoid-activated RNA polymerase II transcription factor binding transcription factor activity(GO:0038051) |
| 0.1 | 0.2 | GO:0061711 | N(6)-L-threonylcarbamoyladenine synthase(GO:0061711) |
| 0.0 | 1.5 | GO:0001871 | pattern binding(GO:0001871) polysaccharide binding(GO:0030247) |
| 0.0 | 0.1 | GO:0003870 | 5-aminolevulinate synthase activity(GO:0003870) N-succinyltransferase activity(GO:0016749) |
| 0.0 | 1.3 | GO:0044548 | S100 protein binding(GO:0044548) |
| 0.0 | 0.7 | GO:0015386 | potassium:proton antiporter activity(GO:0015386) |
| 0.0 | 0.4 | GO:0034604 | pyruvate dehydrogenase activity(GO:0004738) pyruvate dehydrogenase [NAD(P)+] activity(GO:0034603) pyruvate dehydrogenase (NAD+) activity(GO:0034604) |
| 0.0 | 0.4 | GO:0035174 | histone serine kinase activity(GO:0035174) |
| 0.0 | 0.6 | GO:0015252 | hydrogen ion channel activity(GO:0015252) |
| 0.0 | 1.2 | GO:0015125 | bile acid transmembrane transporter activity(GO:0015125) |
| 0.0 | 0.2 | GO:0004485 | methylcrotonoyl-CoA carboxylase activity(GO:0004485) |
| 0.0 | 0.4 | GO:0008109 | N-acetyllactosaminide beta-1,6-N-acetylglucosaminyltransferase activity(GO:0008109) |
| 0.0 | 1.5 | GO:0070410 | co-SMAD binding(GO:0070410) |
| 0.0 | 0.4 | GO:0008607 | phosphorylase kinase regulator activity(GO:0008607) |
| 0.0 | 0.1 | GO:0071987 | WD40-repeat domain binding(GO:0071987) |
| 0.0 | 2.6 | GO:0008138 | protein tyrosine/serine/threonine phosphatase activity(GO:0008138) |
| 0.0 | 0.4 | GO:0015250 | water channel activity(GO:0015250) |
| 0.0 | 0.4 | GO:0030274 | LIM domain binding(GO:0030274) |
| 0.0 | 2.0 | GO:0005158 | insulin receptor binding(GO:0005158) |
| 0.0 | 0.4 | GO:0008428 | ribonuclease inhibitor activity(GO:0008428) |
| 0.0 | 5.2 | GO:0004222 | metalloendopeptidase activity(GO:0004222) |
| 0.0 | 0.1 | GO:0035651 | AP-1 adaptor complex binding(GO:0035650) AP-3 adaptor complex binding(GO:0035651) |
| 0.0 | 0.3 | GO:0004645 | phosphorylase activity(GO:0004645) |
| 0.0 | 0.1 | GO:0008193 | RNA guanylyltransferase activity(GO:0008192) tRNA guanylyltransferase activity(GO:0008193) |
| 0.0 | 2.2 | GO:0030971 | receptor tyrosine kinase binding(GO:0030971) |
| 0.0 | 0.3 | GO:1901612 | cardiolipin binding(GO:1901612) |
| 0.0 | 0.2 | GO:0034597 | phosphatidylinositol-4,5-bisphosphate 4-phosphatase activity(GO:0034597) |
| 0.0 | 1.8 | GO:0016831 | carboxy-lyase activity(GO:0016831) |
| 0.0 | 1.2 | GO:0005109 | frizzled binding(GO:0005109) |
| 0.0 | 0.4 | GO:0005049 | nuclear export signal receptor activity(GO:0005049) |
| 0.0 | 0.7 | GO:0005328 | neurotransmitter:sodium symporter activity(GO:0005328) |
| 0.0 | 0.1 | GO:0070699 | type II activin receptor binding(GO:0070699) |
| 0.0 | 0.4 | GO:0070569 | uridylyltransferase activity(GO:0070569) |
| 0.0 | 0.2 | GO:0031752 | D5 dopamine receptor binding(GO:0031752) |
| 0.0 | 0.7 | GO:0004383 | guanylate cyclase activity(GO:0004383) |
| 0.0 | 0.4 | GO:0022889 | L-serine transmembrane transporter activity(GO:0015194) serine transmembrane transporter activity(GO:0022889) |
| 0.0 | 0.4 | GO:0015197 | peptide transporter activity(GO:0015197) |
| 0.0 | 0.4 | GO:0050700 | CARD domain binding(GO:0050700) |
| 0.0 | 0.3 | GO:0033192 | calmodulin-dependent protein phosphatase activity(GO:0033192) |
| 0.0 | 0.2 | GO:0000990 | transcription factor activity, core RNA polymerase binding(GO:0000990) |
| 0.0 | 0.4 | GO:0030898 | actin-dependent ATPase activity(GO:0030898) |
| 0.0 | 0.7 | GO:0035035 | histone acetyltransferase binding(GO:0035035) |
| 0.0 | 0.9 | GO:0003785 | actin monomer binding(GO:0003785) |
| 0.0 | 0.4 | GO:0070403 | NAD+ binding(GO:0070403) |
| 0.0 | 5.2 | GO:0004252 | serine-type endopeptidase activity(GO:0004252) |
| 0.0 | 1.5 | GO:0003743 | translation initiation factor activity(GO:0003743) |
| 0.0 | 0.3 | GO:0031698 | beta-2 adrenergic receptor binding(GO:0031698) |
| 0.0 | 0.4 | GO:0022848 | acetylcholine-gated cation channel activity(GO:0022848) |
| 0.0 | 2.7 | GO:0005178 | integrin binding(GO:0005178) |
| 0.0 | 2.0 | GO:0004197 | cysteine-type endopeptidase activity(GO:0004197) |
| 0.0 | 0.2 | GO:0004321 | fatty-acyl-CoA synthase activity(GO:0004321) |
| 0.0 | 0.2 | GO:0016289 | CoA hydrolase activity(GO:0016289) |
| 0.0 | 0.0 | GO:0016421 | CoA carboxylase activity(GO:0016421) |
| 0.0 | 0.3 | GO:0008320 | protein transmembrane transporter activity(GO:0008320) |
| 0.0 | 0.2 | GO:0004000 | adenosine deaminase activity(GO:0004000) |
| 0.0 | 0.2 | GO:0019870 | potassium channel inhibitor activity(GO:0019870) |
| 0.0 | 0.9 | GO:0018024 | histone-lysine N-methyltransferase activity(GO:0018024) |
| 0.0 | 0.2 | GO:0004993 | G-protein coupled serotonin receptor activity(GO:0004993) |
| 0.0 | 0.6 | GO:0030507 | spectrin binding(GO:0030507) |
| 0.0 | 0.6 | GO:0004003 | ATP-dependent DNA helicase activity(GO:0004003) |
| 0.0 | 0.4 | GO:0070273 | phosphatidylinositol-4-phosphate binding(GO:0070273) |
| 0.0 | 0.1 | GO:0015038 | glutathione disulfide oxidoreductase activity(GO:0015038) |
| 0.0 | 1.6 | GO:0017048 | Rho GTPase binding(GO:0017048) |
| 0.0 | 0.3 | GO:0004012 | phospholipid-translocating ATPase activity(GO:0004012) |
| 0.0 | 1.1 | GO:0032947 | protein complex scaffold(GO:0032947) |
Gene overrepresentation in curated gene sets: canonical pathways category:
| Log-likelihood per target | Total log-likelihood | Term | Description |
|---|---|---|---|
| 0.1 | 1.0 | SA G2 AND M PHASES | Cdc25 activates the cdc2/cyclin B complex to induce the G2/M transition. |
| 0.1 | 2.9 | ST MYOCYTE AD PATHWAY | Myocyte Adrenergic Pathway is a specific case of the generalized Adrenergic Pathway. |
| 0.0 | 3.0 | PID RXR VDR PATHWAY | RXR and RAR heterodimerization with other nuclear receptor |
| 0.0 | 5.6 | PID RB 1PATHWAY | Regulation of retinoblastoma protein |
| 0.0 | 3.8 | PID FOXM1 PATHWAY | FOXM1 transcription factor network |
| 0.0 | 3.1 | NABA BASEMENT MEMBRANES | Genes encoding structural components of basement membranes |
| 0.0 | 2.2 | PID P38 MK2 PATHWAY | p38 signaling mediated by MAPKAP kinases |
| 0.0 | 3.1 | PID NFAT TFPATHWAY | Calcineurin-regulated NFAT-dependent transcription in lymphocytes |
| 0.0 | 0.2 | PID S1P S1P4 PATHWAY | S1P4 pathway |
| 0.0 | 0.4 | PID ERBB2 ERBB3 PATHWAY | ErbB2/ErbB3 signaling events |
| 0.0 | 0.7 | PID VEGF VEGFR PATHWAY | VEGF and VEGFR signaling network |
| 0.0 | 0.5 | SA B CELL RECEPTOR COMPLEXES | Antigen binding to B cell receptors activates protein tyrosine kinases, such as the Src family, which ultimate activate MAP kinases. |
| 0.0 | 2.8 | PID ANGIOPOIETIN RECEPTOR PATHWAY | Angiopoietin receptor Tie2-mediated signaling |
| 0.0 | 1.5 | PID HIF1A PATHWAY | Hypoxic and oxygen homeostasis regulation of HIF-1-alpha |
| 0.0 | 2.5 | PID ILK PATHWAY | Integrin-linked kinase signaling |
| 0.0 | 1.7 | ST WNT BETA CATENIN PATHWAY | Wnt/beta-catenin Pathway |
| 0.0 | 2.3 | PID ENDOTHELIN PATHWAY | Endothelins |
| 0.0 | 3.8 | PID AR PATHWAY | Coregulation of Androgen receptor activity |
| 0.0 | 2.0 | SIG INSULIN RECEPTOR PATHWAY IN CARDIAC MYOCYTES | Genes related to the insulin receptor pathway |
| 0.0 | 1.9 | PID ECADHERIN STABILIZATION PATHWAY | Stabilization and expansion of the E-cadherin adherens junction |
| 0.0 | 1.5 | NABA PROTEOGLYCANS | Genes encoding proteoglycans |
| 0.0 | 0.5 | PID ALK2 PATHWAY | ALK2 signaling events |
| 0.0 | 1.3 | PID HEDGEHOG GLI PATHWAY | Hedgehog signaling events mediated by Gli proteins |
| 0.0 | 0.5 | PID CIRCADIAN PATHWAY | Circadian rhythm pathway |
| 0.0 | 0.2 | PID NEPHRIN NEPH1 PATHWAY | Nephrin/Neph1 signaling in the kidney podocyte |
| 0.0 | 0.5 | PID FRA PATHWAY | Validated transcriptional targets of AP1 family members Fra1 and Fra2 |
| 0.0 | 0.9 | PID AP1 PATHWAY | AP-1 transcription factor network |
| 0.0 | 1.0 | PID INTEGRIN2 PATHWAY | Beta2 integrin cell surface interactions |
| 0.0 | 0.3 | PID CD8 TCR DOWNSTREAM PATHWAY | Downstream signaling in naïve CD8+ T cells |
| 0.0 | 1.2 | WNT SIGNALING | Genes related to Wnt-mediated signal transduction |
| 0.0 | 0.8 | PID IL4 2PATHWAY | IL4-mediated signaling events |
| 0.0 | 0.5 | PID ALPHA SYNUCLEIN PATHWAY | Alpha-synuclein signaling |
Gene overrepresentation in curated gene sets: REACTOME pathways category:
| Log-likelihood per target | Total log-likelihood | Term | Description |
|---|---|---|---|
| 0.2 | 16.8 | REACTOME STRIATED MUSCLE CONTRACTION | Genes involved in Striated Muscle Contraction |
| 0.1 | 2.0 | REACTOME CREATION OF C4 AND C2 ACTIVATORS | Genes involved in Creation of C4 and C2 activators |
| 0.1 | 1.7 | REACTOME REVERSIBLE HYDRATION OF CARBON DIOXIDE | Genes involved in Reversible Hydration of Carbon Dioxide |
| 0.1 | 2.8 | REACTOME REGULATION OF INSULIN LIKE GROWTH FACTOR IGF ACTIVITY BY INSULIN LIKE GROWTH FACTOR BINDING PROTEINS IGFBPS | Genes involved in Regulation of Insulin-like Growth Factor (IGF) Activity by Insulin-like Growth Factor Binding Proteins (IGFBPs) |
| 0.1 | 2.2 | REACTOME P2Y RECEPTORS | Genes involved in P2Y receptors |
| 0.1 | 1.0 | REACTOME PASSIVE TRANSPORT BY AQUAPORINS | Genes involved in Passive Transport by Aquaporins |
| 0.1 | 2.8 | REACTOME TIE2 SIGNALING | Genes involved in Tie2 Signaling |
| 0.1 | 7.2 | REACTOME PHASE1 FUNCTIONALIZATION OF COMPOUNDS | Genes involved in Phase 1 - Functionalization of compounds |
| 0.1 | 0.8 | REACTOME OPSINS | Genes involved in Opsins |
| 0.1 | 1.2 | REACTOME PURINE RIBONUCLEOSIDE MONOPHOSPHATE BIOSYNTHESIS | Genes involved in Purine ribonucleoside monophosphate biosynthesis |
| 0.1 | 0.8 | REACTOME TRAFFICKING AND PROCESSING OF ENDOSOMAL TLR | Genes involved in Trafficking and processing of endosomal TLR |
| 0.0 | 1.2 | REACTOME TRANSPORT OF ORGANIC ANIONS | Genes involved in Transport of organic anions |
| 0.0 | 2.0 | REACTOME SMOOTH MUSCLE CONTRACTION | Genes involved in Smooth Muscle Contraction |
| 0.0 | 2.2 | REACTOME ANTIGEN ACTIVATES B CELL RECEPTOR LEADING TO GENERATION OF SECOND MESSENGERS | Genes involved in Antigen Activates B Cell Receptor Leading to Generation of Second Messengers |
| 0.0 | 0.7 | REACTOME COMMON PATHWAY | Genes involved in Common Pathway |
| 0.0 | 0.7 | REACTOME VEGF LIGAND RECEPTOR INTERACTIONS | Genes involved in VEGF ligand-receptor interactions |
| 0.0 | 1.1 | REACTOME CIRCADIAN REPRESSION OF EXPRESSION BY REV ERBA | Genes involved in Circadian Repression of Expression by REV-ERBA |
| 0.0 | 1.8 | REACTOME REGULATION OF HYPOXIA INDUCIBLE FACTOR HIF BY OXYGEN | Genes involved in Regulation of Hypoxia-inducible Factor (HIF) by Oxygen |
| 0.0 | 1.3 | REACTOME CELL EXTRACELLULAR MATRIX INTERACTIONS | Genes involved in Cell-extracellular matrix interactions |
| 0.0 | 2.6 | REACTOME GLUCONEOGENESIS | Genes involved in Gluconeogenesis |
| 0.0 | 0.7 | REACTOME ADENYLATE CYCLASE ACTIVATING PATHWAY | Genes involved in Adenylate cyclase activating pathway |
| 0.0 | 3.5 | REACTOME NUCLEAR RECEPTOR TRANSCRIPTION PATHWAY | Genes involved in Nuclear Receptor transcription pathway |
| 0.0 | 1.1 | REACTOME ACTIVATION OF GENES BY ATF4 | Genes involved in Activation of Genes by ATF4 |
| 0.0 | 0.8 | REACTOME ENOS ACTIVATION AND REGULATION | Genes involved in eNOS activation and regulation |
| 0.0 | 1.5 | REACTOME ABC FAMILY PROTEINS MEDIATED TRANSPORT | Genes involved in ABC-family proteins mediated transport |
| 0.0 | 1.5 | REACTOME GLUCOSE METABOLISM | Genes involved in Glucose metabolism |
| 0.0 | 0.5 | REACTOME G2 M DNA DAMAGE CHECKPOINT | Genes involved in G2/M DNA damage checkpoint |
| 0.0 | 0.5 | REACTOME CITRIC ACID CYCLE TCA CYCLE | Genes involved in Citric acid cycle (TCA cycle) |
| 0.0 | 0.4 | REACTOME REGULATION OF PYRUVATE DEHYDROGENASE PDH COMPLEX | Genes involved in Regulation of pyruvate dehydrogenase (PDH) complex |
| 0.0 | 1.0 | REACTOME GLUTATHIONE CONJUGATION | Genes involved in Glutathione conjugation |
| 0.0 | 0.4 | REACTOME PRESYNAPTIC NICOTINIC ACETYLCHOLINE RECEPTORS | Genes involved in Presynaptic nicotinic acetylcholine receptors |
| 0.0 | 1.5 | REACTOME MITOCHONDRIAL PROTEIN IMPORT | Genes involved in Mitochondrial Protein Import |
| 0.0 | 1.1 | REACTOME INTERACTION BETWEEN L1 AND ANKYRINS | Genes involved in Interaction between L1 and Ankyrins |
| 0.0 | 1.0 | REACTOME EFFECTS OF PIP2 HYDROLYSIS | Genes involved in Effects of PIP2 hydrolysis |
| 0.0 | 0.2 | REACTOME THROMBOXANE SIGNALLING THROUGH TP RECEPTOR | Genes involved in Thromboxane signalling through TP receptor |
| 0.0 | 1.0 | REACTOME SMAD2 SMAD3 SMAD4 HETEROTRIMER REGULATES TRANSCRIPTION | Genes involved in SMAD2/SMAD3:SMAD4 heterotrimer regulates transcription |
| 0.0 | 0.5 | REACTOME BRANCHED CHAIN AMINO ACID CATABOLISM | Genes involved in Branched-chain amino acid catabolism |
| 0.0 | 0.3 | REACTOME APOPTOSIS INDUCED DNA FRAGMENTATION | Genes involved in Apoptosis induced DNA fragmentation |
| 0.0 | 0.1 | REACTOME TRAF6 MEDIATED IRF7 ACTIVATION IN TLR7 8 OR 9 SIGNALING | Genes involved in TRAF6 mediated IRF7 activation in TLR7/8 or 9 signaling |
| 0.0 | 0.5 | REACTOME PEROXISOMAL LIPID METABOLISM | Genes involved in Peroxisomal lipid metabolism |
| 0.0 | 1.2 | REACTOME COLLAGEN FORMATION | Genes involved in Collagen formation |
| 0.0 | 0.5 | REACTOME DEPOSITION OF NEW CENPA CONTAINING NUCLEOSOMES AT THE CENTROMERE | Genes involved in Deposition of New CENPA-containing Nucleosomes at the Centromere |
| 0.0 | 3.6 | REACTOME METABOLISM OF AMINO ACIDS AND DERIVATIVES | Genes involved in Metabolism of amino acids and derivatives |
| 0.0 | 1.2 | REACTOME AMYLOIDS | Genes involved in Amyloids |
| 0.0 | 0.4 | REACTOME SIGNALING BY HIPPO | Genes involved in Signaling by Hippo |
| 0.0 | 0.6 | REACTOME ION TRANSPORT BY P TYPE ATPASES | Genes involved in Ion transport by P-type ATPases |
| 0.0 | 1.2 | REACTOME CELL SURFACE INTERACTIONS AT THE VASCULAR WALL | Genes involved in Cell surface interactions at the vascular wall |
| 0.0 | 0.1 | REACTOME IRAK2 MEDIATED ACTIVATION OF TAK1 COMPLEX UPON TLR7 8 OR 9 STIMULATION | Genes involved in IRAK2 mediated activation of TAK1 complex upon TLR7/8 or 9 stimulation |