|
chr7_+_116166346
|
45.913
|
NM_001172896
NM_001172897
|
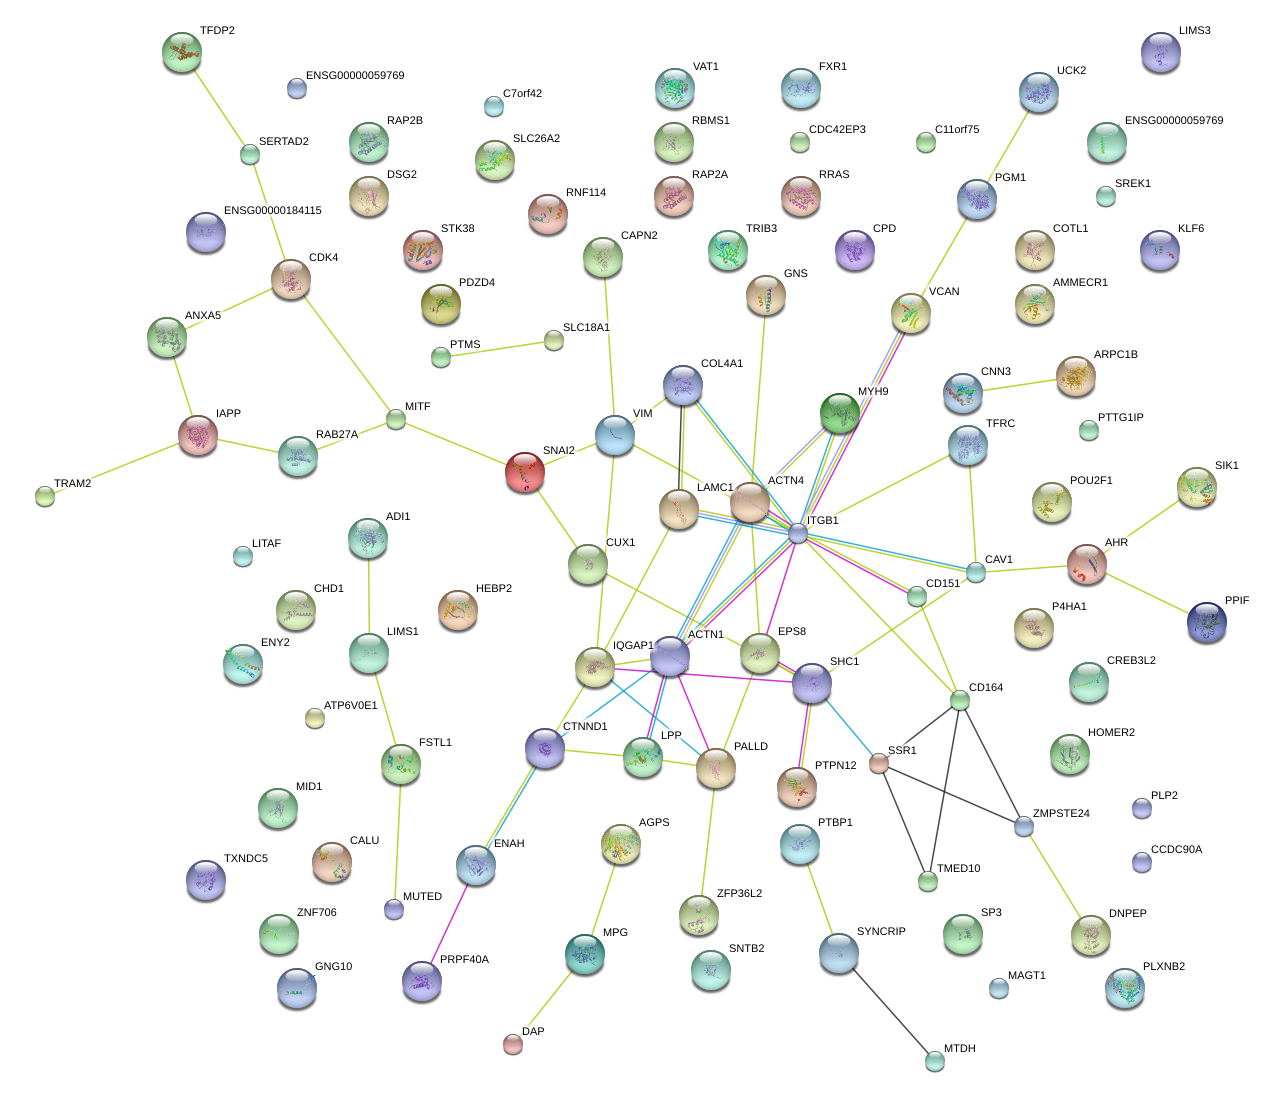
CAV1
|
caveolin 1, caveolae protein, 22kDa
|
|
chr7_+_116164838
|
45.687
|
NM_001753
|
CAV1
|
caveolin 1, caveolae protein, 22kDa
|
|
chr7_+_116165043
|
45.010
|
NM_001172895
|
CAV1
|
caveolin 1, caveolae protein, 22kDa
|
|
chr10_-_33246786
|
43.579
|
NM_133376
|
ITGB1
|
integrin, beta 1 (fibronectin receptor, beta polypeptide, antigen CD29 includes MDF2, MSK12)
|
|
chrX_+_49028183
|
37.095
|
NM_002668
|
PLP2
|
proteolipid protein 2 (colonic epithelium-enriched)
|
|
chr6_+_138725314
|
36.678
|
NM_014320
|
HEBP2
|
heme binding protein 2
|
|
chr10_-_33247178
|
35.638
|
NM_002211
|
ITGB1
|
integrin, beta 1 (fibronectin receptor, beta polypeptide, antigen CD29 includes MDF2, MSK12)
|
|
chr10_+_17270257
|
35.281
|
NM_003380
|
VIM
|
vimentin
|
|
chr1_+_182992329
|
35.086
|
NM_002293
|
LAMC1
|
laminin, gamma 1 (formerly LAMB2)
|
|
chr2_-_161350304
|
34.150
|
NM_002897
NM_016836
|
RBMS1
|
RNA binding motif, single stranded interacting protein 1
|
|
chr19_-_50143350
|
32.748
|
NM_006270
|
RRAS
|
related RAS viral (r-ras) oncogene homolog
|
|
chr2_+_109204904
|
32.080
|
NM_001193488
|
LIMS1
|
LIM and senescent cell antigen-like domains 1
|
|
chr22_-_50746000
|
29.468
|
NM_012401
|
PLXNB2
|
plexin B2
|
|
chr2_+_109204745
|
28.824
|
NM_004987
|
LIMS1
|
LIM and senescent cell antigen-like domains 1
|
|
chr3_-_120169493
|
28.805
|
NM_007085
|
FSTL1
|
follistatin-like 1
|
|
chr16_-_11680146
|
28.625
|
NM_004862
|
LITAF
|
lipopolysaccharide-induced TNF factor
|
|
chr2_-_64881040
|
28.622
|
NM_014755
|
SERTAD2
|
SERTA domain containing 2
|
|
chr5_+_172410762
|
28.491
|
NM_003945
|
ATP6V0E1
|
ATPase, H+ transporting, lysosomal 9kDa, V0 subunit e1
|
|
chr7_+_98972281
|
28.180
|
NM_005720
|
ARPC1B
|
actin related protein 2/3 complex, subunit 1B, 41kDa
|
|
chr1_+_223900061
|
27.587
|
NM_001748
|
CAPN2
|
calpain 2, (m/II) large subunit
|
|
chr2_+_109223600
|
27.523
|
NM_001193482
|
LIMS1
|
LIM and senescent cell antigen-like domains 1
|
|
chr2_+_109271267
|
26.704
|
NM_001193485
|
LIMS1
|
LIM and senescent cell antigen-like domains 1
|
|
chr6_-_13814546
|
26.676
|
NM_001031713
|
CCDC90A
|
coiled-coil domain containing 90A
|
|
chr7_-_137686814
|
26.308
|
NM_001253775
NM_194071
|
CREB3L2
|
cAMP responsive element binding protein 3-like 2
|
|
chr1_+_64088886
|
26.054
|
NM_001172818
|
PGM1
|
phosphoglucomutase 1
|
|
chr15_-_55562483
|
25.632
|
NM_183234
NM_004580
|
RAB27A
|
RAB27A, member RAS oncogene family
|
|
chr1_-_154943001
|
25.411
|
NM_001130040
NM_183001
|
SHC1
|
SHC (Src homology 2 domain containing) transforming protein 1
|
|
chr21_-_46293609
|
24.873
|
NM_004339
|
PTTG1IP
|
pituitary tumor-transforming 1 interacting protein
|
|
chr16_-_11680756
|
24.866
|
NM_001136472
NM_001136473
|
LITAF
|
lipopolysaccharide-induced TNF factor
|
|
chr2_+_109237679
|
24.836
|
NM_001193484
|
LIMS1
|
LIM and senescent cell antigen-like domains 1
|
|
chr4_-_122618140
|
24.502
|
NM_001154
|
ANXA5
|
annexin A5
|
|
chr3_-_195808958
|
24.162
|
NM_003234
|
TFRC
|
transferrin receptor (p90, CD71)
|
|
chr21_-_44846927
|
24.143
|
NM_173354
|
SIK1
|
salt-inducible kinase 1
|
|
chr1_+_165796652
|
23.965
|
NM_012474
|
UCK2
|
uridine-cytidine kinase 2
|
|
chr3_+_187943192
|
23.921
|
NM_001167671
|
LPP
|
LIM domain containing preferred translocation partner in lipoma
|
|
chr3_-_195808997
|
23.842
|
NM_001128148
|
TFRC
|
transferrin receptor (p90, CD71)
|
|
chr2_-_37899227
|
23.683
|
NM_006449
|
CDC42EP3
|
CDC42 effector protein (Rho GTPase binding) 3
|
|
chr12_-_65153189
|
23.306
|
NM_002076
|
GNS
|
glucosamine (N-acetyl)-6-sulfatase
|
|
chr12_-_15942350
|
23.278
|
NM_004447
|
EPS8
|
epidermal growth factor receptor pathway substrate 8
|
|
chr1_+_223889253
|
23.190
|
NM_001146068
|
CAPN2
|
calpain 2, (m/II) large subunit
|
|
chr6_-_7910716
|
23.167
|
NM_030810
|
TXNDC5
|
thioredoxin domain containing 5 (endoplasmic reticulum)
|
|
chr2_+_178257371
|
22.936
|
NM_003659
|
AGPS
|
alkylglycerone phosphate synthase
|
|
chr11_+_832909
|
22.572
|
NM_001039490
NM_004357
NM_139029
NM_139030
|
CD151
|
CD151 molecule (Raph blood group)
|
|
chr6_-_52441815
|
22.442
|
NM_012288
|
TRAM2
|
translocation associated membrane protein 2
|
|
chr16_-_84651639
|
22.350
|
NM_021149
|
COTL1
|
coactosin-like 1 (Dictyostelium)
|
|
chr2_+_109150807
|
22.341
|
NM_001193483
|
LIMS1
|
LIM and senescent cell antigen-like domains 1
|
|
chr13_-_110959441
|
22.193
|
NM_001845
|
COL4A1
|
collagen, type IV, alpha 1
|
|
chr3_+_69812620
|
22.112
|
NM_001184967
|
MITF
|
microphthalmia-associated transcription factor
|
|
chr11_+_57529233
|
22.055
|
NM_001085458
NM_001085459
NM_001085460
NM_001085461
NM_001085462
NM_001085463
NM_001085464
NM_001085465
NM_001085466
NM_001085467
NM_001085468
NM_001085469
NM_001206883
NM_001206884
NM_001206885
NM_001206886
NM_001206887
NM_001206888
NM_001206889
NM_001206890
NM_001206891
NM_001331
|
CTNND1
|
catenin (cadherin-associated protein), delta 1
|
|
chrX_-_109683457
|
21.988
|
NM_001171689
|
AMMECR1
|
Alport syndrome, mental retardation, midface hypoplasia and elliptocytosis chromosomal region gene 1
|
|
chr8_+_110346549
|
21.851
|
NM_001193557
NM_020189
|
ENY2
|
enhancer of yellow 2 homolog (Drosophila)
|
|
chr12_-_58146118
|
21.845
|
NM_000075
|
CDK4
|
cyclin-dependent kinase 4
|
|
chr7_+_101460881
|
21.686
|
NM_181552
|
CUX1
|
cut-like homeobox 1
|
|
chr20_+_361272
|
21.467
|
NM_021158
|
TRIB3
|
tribbles homolog 3 (Drosophila)
|
|
chr2_-_153573858
|
21.359
|
NM_017892
|
PRPF40A
|
PRP40 pre-mRNA processing factor 40 homolog A (S. cerevisiae)
|
|
chr7_+_77167351
|
21.227
|
NM_001131008
NM_001131009
|
PTPN12
|
protein tyrosine phosphatase, non-receptor type 12
|
|
chr6_-_86351156
|
21.107
|
NM_001159675
NM_001159676
|
SYNCRIP
|
synaptotagmin binding, cytoplasmic RNA interacting protein
|
|
chr1_+_64058891
|
21.094
|
NM_002633
|
PGM1
|
phosphoglucomutase 1
|
|
chr10_-_74856656
|
20.917
|
NM_000917
NM_001017962
NM_001142595
NM_001142596
|
P4HA1
|
prolyl 4-hydroxylase, alpha polypeptide I
|
|
chr15_+_90931470
|
20.685
|
NM_003870
|
IQGAP1
|
IQ motif containing GTPase activating protein 1
|
|
chr1_+_64059479
|
20.605
|
NM_001172819
|
PGM1
|
phosphoglucomutase 1
|
|
chr17_-_41174431
|
20.499
|
NM_006373
|
VAT1
|
vesicle amine transport protein 1 homolog (T. californica)
|
|
chr22_-_36784055
|
20.314
|
NM_002473
|
MYH9
|
myosin, heavy chain 9, non-muscle
|
|
chr10_-_3827418
|
20.297
|
NM_001160124
NM_001160125
NM_001300
|
KLF6
|
Kruppel-like factor 6
|
|
chr6_-_109703703
|
20.258
|
NM_001142401
NM_001142402
NM_001142403
NM_001142404
NM_006016
|
CD164
|
CD164 molecule, sialomucin
|
|
chr19_+_797390
|
20.233
|
NM_002819
NM_031990
NM_031991
NM_175847
|
PTBP1
|
polypyrimidine tract binding protein 1
|
|
chr3_+_69812961
|
20.128
|
NM_006722
|
MITF
|
microphthalmia-associated transcription factor
|
|
chr15_-_55563091
|
20.104
|
NM_183236
|
RAB27A
|
RAB27A, member RAS oncogene family
|
|
chr6_-_7910278
|
19.976
|
NM_001145549
|
TXNDC5
|
thioredoxin domain containing 5 (endoplasmic reticulum)
|
|
chr5_-_10761344
|
19.930
|
NM_004394
|
DAP
|
death-associated protein
|
|
chr18_+_29078026
|
19.684
|
NM_001943
|
DSG2
|
desmoglein 2
|
|
chr3_+_187871473
|
19.656
|
NM_001167672
|
LPP
|
LIM domain containing preferred translocation partner in lipoma
|
|
chr1_+_167298280
|
19.652
|
NM_001198783
|
POU2F1
|
POU class 2 homeobox 1
|
|
chr7_+_17338182
|
19.592
|
NM_001621
|
AHR
|
aryl hydrocarbon receptor
|
|
chr17_+_28707495
|
19.555
|
NM_001199775
|
CPD
|
carboxypeptidase D
|
|
chr11_-_93276513
|
19.254
|
NM_020179
|
C11orf75
|
chromosome 11 open reading frame 75
|
|
chr2_-_3523345
|
19.239
|
NM_018269
|
ADI1
|
acireductone dioxygenase 1
|
|
chr5_-_98262217
|
19.152
|
NM_001270
|
CHD1
|
chromodomain helicase DNA binding protein 1
|
|
chr9_+_114423849
|
18.821
|
NM_001017998
NM_001198664
|
GNG10
|
guanine nucleotide binding protein (G protein), gamma 10
|
|
chr1_-_225840660
|
18.758
|
NM_001008493
NM_018212
|
ENAH
|
enabled homolog (Drosophila)
|
|
chr7_+_66386129
|
18.718
|
NM_017994
|
C7orf42
|
chromosome 7 open reading frame 42
|
|
chr8_-_49833823
|
18.332
|
NM_003068
|
SNAI2
|
snail homolog 2 (Drosophila)
|
|
chr5_+_149340287
|
18.309
|
NM_000112
|
SLC26A2
|
solute carrier family 26 (sulfate transporter), member 2
|
|
chr16_+_69220940
|
18.254
|
NM_006750
|
SNTB2
|
syntrophin, beta 2 (dystrophin-associated protein A1, 59kDa, basic component 2)
|
|
chr5_+_82767492
|
18.224
|
NM_001126336
NM_001164097
NM_001164098
NM_004385
|
VCAN
|
versican
|
|
chr1_-_95392501
|
18.216
|
NM_001839
|
CNN3
|
calponin 3, acidic
|
|
chr19_+_39138265
|
17.831
|
NM_004924
|
ACTN4
|
actinin, alpha 4
|
|
chr15_-_55581969
|
17.714
|
NM_183235
|
RAB27A
|
RAB27A, member RAS oncogene family
|
|
chr17_+_28705922
|
17.696
|
NM_001304
|
CPD
|
carboxypeptidase D
|
|
chr10_+_81107219
|
17.639
|
NM_005729
|
PPIF
|
peptidylprolyl isomerase F
|
|
chr6_-_7313352
|
17.636
|
NM_003144
|
SSR1
|
signal sequence receptor, alpha
|
|
chr3_+_180630054
|
17.586
|
NM_001013438
NM_001013439
NM_005087
|
FXR1
|
fragile X mental retardation, autosomal homolog 1
|
|
chr6_-_36515245
|
17.559
|
NM_007271
|
STK38
|
serine/threonine kinase 38
|
|
chrX_-_77150907
|
17.226
|
NM_032121
|
MAGT1
|
magnesium transporter 1
|
|
chrX_-_109561314
|
17.187
|
NM_001025580
NM_015365
|
AMMECR1
|
Alport syndrome, mental retardation, midface hypoplasia and elliptocytosis chromosomal region gene 1
|
|
chr3_+_187930720
|
17.112
|
NM_005578
|
LPP
|
LIM domain containing preferred translocation partner in lipoma
|
|
chr3_+_69915374
|
17.004
|
NM_198177
|
MITF
|
microphthalmia-associated transcription factor
|
|
chr2_-_174828775
|
16.977
|
NM_001017371
|
SP3
|
Sp3 transcription factor
|
|
chr8_-_102217868
|
16.956
|
NM_001042511
|
ZNF706
|
zinc finger protein 706
|
|
chr7_+_128379345
|
16.739
|
NM_001130674
NM_001199671
NM_001199672
NM_001199673
NM_001199674
NM_001219
|
CALU
|
calumenin
|
|
chr20_+_48552902
|
16.623
|
NM_018683
|
RNF114
|
ring finger protein 114
|
|
chr14_-_75643335
|
16.427
|
NM_006827
|
TMED10
|
transmembrane emp24-like trafficking protein 10 (yeast)
|
|
chr8_-_102217907
|
16.421
|
NM_001042510
NM_016096
|
ZNF706
|
zinc finger protein 706
|
|
chr4_+_169418167
|
16.407
|
NM_001166108
NM_016081
|
PALLD
|
palladin, cytoskeletal associated protein
|
|
chr3_+_152880024
|
16.394
|
NM_002886
|
RAP2B
|
RAP2B, member of RAS oncogene family
|
|
chr1_+_40723730
|
16.293
|
NM_005857
|
ZMPSTE24
|
zinc metallopeptidase (STE24 homolog, S. cerevisiae)
|
|
chr2_-_43453737
|
16.231
|
NM_006887
|
ZFP36L2
|
zinc finger protein 36, C3H type-like 2
|
|
chr5_+_65440004
|
16.206
|
NM_001077199
|
SREK1
|
splicing regulatory glutamine/lysine-rich protein 1
|
|
chr3_+_69788562
|
16.199
|
NM_198159
|
MITF
|
microphthalmia-associated transcription factor
|
|
chr3_-_141747434
|
16.112
|
NM_001178141
NM_001178142
NM_006286
|
TFDP2
|
transcription factor Dp-2 (E2F dimerization partner 2)
|
|
chr8_+_98656329
|
15.998
|
NM_178812
|
MTDH
|
metadherin
|
|
chr5_+_65440662
|
15.994
|
NM_139168
|
SREK1
|
splicing regulatory glutamine/lysine-rich protein 1
|
|
chrX_-_10544852
|
15.950
|
NM_001193277
|
MID1
|
midline 1 (Opitz/BBB syndrome)
|
|
chr6_+_7107986
|
15.732
|
NM_001003698
NM_001003699
NM_001003700
|
RREB1
|
ras responsive element binding protein 1
|
|
chr1_-_154946859
|
15.594
|
NM_001130041
NM_001202859
NM_003029
|
SHC1
|
SHC (Src homology 2 domain containing) transforming protein 1
|
|
chr10_-_30024594
|
15.593
|
NM_003174
|
SVIL
|
supervillin
|
|
chr10_-_27443309
|
15.581
|
NM_001253866
NM_014263
NM_139312
|
YME1L1
|
YME1-like 1 (S. cerevisiae)
|
|
chrX_-_106243442
|
15.425
|
NM_001085354
NM_024657
|
MORC4
|
MORC family CW-type zinc finger 4
|
|
chr1_-_27816676
|
15.351
|
NM_001201404
NM_006990
|
WASF2
|
WAS protein family, member 2
|
|
chr5_+_102201526
|
15.348
|
NM_000919
NM_001177306
NM_138766
NM_138821
NM_138822
|
PAM
|
peptidylglycine alpha-amidating monooxygenase
|
|
chr5_-_133968463
|
15.225
|
NM_001033503
NM_016103
|
SAR1B
|
SAR1 homolog B (S. cerevisiae)
|
|
chr15_-_101792125
|
15.119
|
NM_014918
|
CHSY1
|
chondroitin sulfate synthase 1
|
|
chr8_-_37756971
|
15.080
|
NM_001002814
NM_025151
|
RAB11FIP1
|
RAB11 family interacting protein 1 (class I)
|
|
chr7_+_142960502
|
15.053
|
NM_001143679
NM_001143680
NM_001143681
NM_015917
|
GSTK1
|
glutathione S-transferase kappa 1
|
|
chr3_+_37903643
|
15.027
|
NM_001008392
NM_005808
|
CTDSPL
|
CTD (carboxy-terminal domain, RNA polymerase II, polypeptide A) small phosphatase-like
|
|
chr5_-_137878915
|
15.021
|
NM_004730
|
ETF1
|
eukaryotic translation termination factor 1
|
|
chr17_-_47439326
|
14.996
|
NM_001145365
NM_014897
|
ZNF652
|
zinc finger protein 652
|
|
chr4_-_185747183
|
14.996
|
NM_001995
|
ACSL1
|
acyl-CoA synthetase long-chain family member 1
|
|
chr20_-_43977023
|
14.859
|
NM_002999
|
SDC4
|
syndecan 4
|
|
chr10_+_51576284
|
14.835
|
NM_001145262
|
NCOA4
|
nuclear receptor coactivator 4
|
|
chr1_+_180123906
|
14.624
|
NM_001004128
NM_002826
|
QSOX1
|
quiescin Q6 sulfhydryl oxidase 1
|
|
chr2_+_69969105
|
14.579
|
NM_001153
|
ANXA4
|
annexin A4
|
|
chr1_+_7831326
|
14.511
|
NM_004781
|
VAMP3
|
vesicle-associated membrane protein 3 (cellubrevin)
|
|
chr1_+_116184573
|
14.445
|
NM_001172411
NM_138959
|
VANGL1
|
vang-like 1 (van gogh, Drosophila)
|
|
chr7_-_6523689
|
14.340
|
NM_001100603
NM_006854
|
KDELR2
|
KDEL (Lys-Asp-Glu-Leu) endoplasmic reticulum protein retention receptor 2
|
|
chr9_+_71819926
|
14.300
|
NM_001170415
NM_001170416
|
TJP2
|
tight junction protein 2 (zona occludens 2)
|
|
chr1_+_110091185
|
14.198
|
NM_006496
|
GNAI3
|
guanine nucleotide binding protein (G protein), alpha inhibiting activity polypeptide 3
|
|
chr22_+_21996541
|
14.157
|
NM_022044
|
SDF2L1
|
stromal cell-derived factor 2-like 1
|
|
chr20_+_61569358
|
14.108
|
NM_017896
|
C20orf11
|
chromosome 20 open reading frame 11
|
|
chr11_+_19734821
|
14.107
|
NM_001244963
NM_145117
NM_182964
|
NAV2
|
neuron navigator 2
|
|
chr1_-_55352920
|
14.005
|
NM_014762
|
DHCR24
|
24-dehydrocholesterol reductase
|
|
chr12_-_58240746
|
13.953
|
NM_005730
|
CTDSP2
|
CTD (carboxy-terminal domain, RNA polymerase II, polypeptide A) small phosphatase 2
|
|
chr17_+_52978022
|
13.905
|
NM_005486
|
TOM1L1
|
target of myb1 (chicken)-like 1
|
|
chr10_+_72575623
|
13.816
|
NM_003901
|
SGPL1
|
sphingosine-1-phosphate lyase 1
|
|
chr14_+_70078309
|
13.794
|
NM_014734
|
KIAA0247
|
KIAA0247
|
|
chr7_-_105752974
|
13.695
|
NM_006754
|
SYPL1
|
synaptophysin-like 1
|
|
chr4_-_54930771
|
13.667
|
NM_012110
|
CHIC2
|
cysteine-rich hydrophobic domain 2
|
|
chr10_+_51565107
|
13.632
|
NM_001145260
NM_001145261
NM_001145263
|
NCOA4
|
nuclear receptor coactivator 4
|
|
chr10_+_89419352
|
13.577
|
NM_001015880
NM_004670
|
PAPSS2
|
3'-phosphoadenosine 5'-phosphosulfate synthase 2
|
|
chr11_-_17191287
|
13.566
|
NM_002645
|
PIK3C2A
|
phosphoinositide-3-kinase, class 2, alpha polypeptide
|
|
chrX_-_10588458
|
13.562
|
NM_000381
NM_033289
|
MID1
|
midline 1 (Opitz/BBB syndrome)
|
|
chr6_-_134639195
|
13.544
|
NM_001143676
|
SGK1
|
serum/glucocorticoid regulated kinase 1
|
|
chr17_-_40540491
|
13.478
|
NM_003150
NM_139276
|
STAT3
|
signal transducer and activator of transcription 3 (acute-phase response factor)
|
|
chrX_-_73834460
|
13.386
|
NM_016120
NM_183353
|
RLIM
|
ring finger protein, LIM domain interacting
|
|
chr3_-_10362837
|
13.362
|
NM_183352
|
SEC13
|
SEC13 homolog (S. cerevisiae)
|
|
chr14_-_35099296
|
13.287
|
NM_021249
NM_152233
|
SNX6
|
sorting nexin 6
|
|
chr7_+_2394428
|
13.261
|
NM_001037283
NM_003751
|
EIF3B
|
eukaryotic translation initiation factor 3, subunit B
|
|
chr7_-_105752718
|
13.223
|
NM_182715
|
SYPL1
|
synaptophysin-like 1
|
|
chr1_-_86174088
|
13.165
|
NM_001170670
NM_017953
|
ZNHIT6
|
zinc finger, HIT-type containing 6
|
|
chr4_+_169753105
|
13.153
|
NM_001166110
|
PALLD
|
palladin, cytoskeletal associated protein
|
|
chr10_-_33224485
|
13.103
|
NM_033668
|
ITGB1
|
integrin, beta 1 (fibronectin receptor, beta polypeptide, antigen CD29 includes MDF2, MSK12)
|
|
chr6_+_35995453
|
13.087
|
NM_001315
NM_139012
NM_139013
NM_139014
|
MAPK14
|
mitogen-activated protein kinase 14
|
|
chrX_-_10645726
|
13.086
|
NM_001098624
|
MID1
|
midline 1 (Opitz/BBB syndrome)
|
|
chr1_+_16767166
|
13.068
|
NM_001145277
NM_001145278
NM_018090
|
NECAP2
|
NECAP endocytosis associated 2
|
|
chr6_+_143929316
|
13.068
|
NM_001100166
NM_014721
|
PHACTR2
|
phosphatase and actin regulator 2
|
|
chr7_-_105162551
|
12.913
|
NM_019042
|
PUS7
|
pseudouridylate synthase 7 homolog (S. cerevisiae)
|
|
chr8_-_145018904
|
12.854
|
NM_201381
|
PLEC
|
plectin
|
|
chr6_-_134498973
|
12.848
|
NM_001143677
|
SGK1
|
serum/glucocorticoid regulated kinase 1
|
|
chr16_-_85832900
|
12.841
|
NM_001142288
NM_006067
|
COX4NB
|
COX4 neighbor
|
|
chr17_+_7123149
|
12.825
|
NM_000018
NM_001033859
|
ACADVL
|
acyl-CoA dehydrogenase, very long chain
|
|
chr11_+_60681370
|
12.700
|
NM_024092
|
TMEM109
|
transmembrane protein 109
|
|
chr1_-_150947456
|
12.695
|
NM_022075
NM_181746
|
CERS2
|
ceramide synthase 2
|
|
chr10_-_14372807
|
12.688
|
NM_018027
|
FRMD4A
|
FERM domain containing 4A
|
|
chr3_-_10362724
|
12.643
|
NM_001136232
|
SEC13
|
SEC13 homolog (S. cerevisiae)
|
|
chr17_-_80376436
|
12.636
|
NM_024648
NM_175902
|
C17orf101
|
chromosome 17 open reading frame 101
|
|
chr7_+_77166750
|
12.494
|
NM_002835
|
PTPN12
|
protein tyrosine phosphatase, non-receptor type 12
|
|
chr1_+_116185249
|
12.481
|
NM_001172412
|
VANGL1
|
vang-like 1 (van gogh, Drosophila)
|
|
chr2_-_174830429
|
12.471
|
NM_001172712
NM_003111
|
SP3
|
Sp3 transcription factor
|
|
chr15_+_45315301
|
12.424
|
NM_003104
|
SORD
|
sorbitol dehydrogenase
|
|
chr17_-_40540359
|
12.298
|
NM_213662
|
STAT3
|
signal transducer and activator of transcription 3 (acute-phase response factor)
|
|
chrX_+_131157635
|
12.233
|
NM_001042452
|
MST4
|
serine/threonine protein kinase MST4
|
|
chr4_+_169552752
|
12.231
|
NM_001166109
|
PALLD
|
palladin, cytoskeletal associated protein
|
|
chr4_+_77870864
|
12.228
|
NM_018243
|
SEPT11
|
septin 11
|
|
chr20_+_62496580
|
12.192
|
NM_001243891
NM_001243892
NM_001243894
NM_001243895
NM_003288
NM_199359
NM_199360
NM_199361
NM_199362
NM_199363
|
TPD52L2
|
tumor protein D52-like 2
|
|
chr9_-_33167355
|
12.154
|
NM_001497
|
B4GALT1
|
UDP-Gal:betaGlcNAc beta 1,4- galactosyltransferase, polypeptide 1
|
|
chr5_-_142783975
|
12.120
|
NM_001018076
|
NR3C1
|
nuclear receptor subfamily 3, group C, member 1 (glucocorticoid receptor)
|
|
chr16_-_85045119
|
12.106
|
NM_001145548
NM_017740
|
ZDHHC7
|
zinc finger, DHHC-type containing 7
|
|
chr8_+_98881277
|
12.063
|
NM_002380
NM_030583
|
MATN2
|
matrilin 2
|
|
chr17_-_882905
|
11.908
|
NM_022463
|
NXN
|
nucleoredoxin
|
|
chr10_+_51572363
|
11.906
|
NM_005437
|
NCOA4
|
nuclear receptor coactivator 4
|
|
chr11_+_46403205
|
11.891
|
NM_002391
|
MDK
|
midkine (neurite growth-promoting factor 2)
|
|
chr17_-_79828691
|
11.887
|
NM_001185077
|
ARHGDIA
|
Rho GDP dissociation inhibitor (GDI) alpha
|
|
chr1_+_32645322
|
11.857
|
NM_175852
|
TXLNA
|
taxilin alpha
|
|
chr13_-_50367027
|
11.854
|
NM_002267
|
KPNA3
|
karyopherin alpha 3 (importin alpha 4)
|
|
chr6_+_20402040
|
11.849
|
NM_001949
|
E2F3
|
E2F transcription factor 3
|
|
chr6_-_86352982
|
11.822
|
NM_001159677
NM_006372
|
SYNCRIP
|
synaptotagmin binding, cytoplasmic RNA interacting protein
|
|
chr11_+_46403302
|
11.802
|
NM_001012333
|
MDK
|
midkine (neurite growth-promoting factor 2)
|
|
chr1_+_236958539
|
11.684
|
NM_000254
|
MTR
|
5-methyltetrahydrofolate-homocysteine methyltransferase
|
|
chr17_+_57970442
|
11.569
|
NM_003161
|
RPS6KB1
|
ribosomal protein S6 kinase, 70kDa, polypeptide 1
|
|
chr10_-_75173807
|
11.515
|
NM_001156
NM_004034
|
ANXA7
|
annexin A7
|