|
chr5_-_140013285
|
16.597
|
NM_001040021
NM_001174104
NM_001174105
|
CD14
|
CD14 molecule
|
|
chr5_-_140012730
|
16.479
|
|
CD14
|
CD14 molecule
|
|
chr3_+_186330859
|
16.077
|
|
AHSG
|
alpha-2-HS-glycoprotein
|
|
chr3_+_186330844
|
16.041
|
NM_001622
|
AHSG
|
alpha-2-HS-glycoprotein
|
|
chr3_+_186330711
|
13.985
|
|
AHSG
|
alpha-2-HS-glycoprotein
|
|
chr19_+_45452427
|
10.149
|
|
APOC2
|
apolipoprotein C-II
|
|
chr3_+_157154579
|
10.032
|
NM_002852
|
PTX3
|
pentraxin 3, long
|
|
chr2_-_216300770
|
9.897
|
NM_002026
NM_054034
NM_212474
NM_212476
NM_212478
NM_212482
|
FN1
|
fibronectin 1
|
|
chr17_-_64225496
|
9.490
|
NM_000042
|
APOH
|
apolipoprotein H (beta-2-glycoprotein I)
|
|
chr5_-_140013034
|
8.478
|
NM_000591
|
CD14
|
CD14 molecule
|
|
chr9_+_117085302
|
7.549
|
NM_000607
|
ORM1
|
orosomucoid 1
|
|
chr16_+_56966025
|
7.324
|
|
HERPUD1
|
homocysteine-inducible, endoplasmic reticulum stress-inducible, ubiquitin-like domain member 1
|
|
chr11_+_114167168
|
7.267
|
|
NNMT
|
nicotinamide N-methyltransferase
|
|
chrX_-_13835187
|
6.705
|
|
GPM6B
|
glycoprotein M6B
|
|
chr9_+_117092068
|
6.701
|
NM_000608
|
ORM2
|
orosomucoid 2
|
|
chr2_-_113594325
|
6.619
|
NM_000576
|
IL1B
|
interleukin 1, beta
|
|
chr11_-_33913835
|
6.492
|
NM_005574
|
LMO2
|
LIM domain only 2 (rhombotin-like 1)
|
|
chr11_+_114167197
|
6.041
|
|
NNMT
|
nicotinamide N-methyltransferase
|
|
chr17_-_34524054
|
6.011
|
NM_001001437
NM_021006
|
CCL3L3
CCL3
CCL3L1
|
chemokine (C-C motif) ligand 3-like 3
chemokine (C-C motif) ligand 3
chemokine (C-C motif) ligand 3-like 1
|
|
chr9_-_77502262
|
5.627
|
NM_001177311
|
TRPM6
|
transient receptor potential cation channel, subfamily M, member 6
|
|
chr12_-_122296619
|
5.382
|
NM_002150
|
HPD
|
4-hydroxyphenylpyruvate dioxygenase
|
|
chr16_-_70323343
|
5.246
|
|
AARS
|
alanyl-tRNA synthetase
|
|
chr16_-_70323407
|
5.153
|
NM_001605
|
AARS
|
alanyl-tRNA synthetase
|
|
chr9_-_77503009
|
5.051
|
NM_017662
|
TRPM6
|
transient receptor potential cation channel, subfamily M, member 6
|
|
chr1_+_111770280
|
4.966
|
NM_001025197
NM_004000
|
CHI3L2
|
chitinase 3-like 2
|
|
chr7_-_56101830
|
4.956
|
|
PSPH
|
phosphoserine phosphatase
|
|
chr6_+_31895401
|
4.927
|
|
C2
|
complement component 2
|
|
chr19_-_44174497
|
4.753
|
NM_001005376
NM_001005377
NM_002659
|
PLAUR
|
plasminogen activator, urokinase receptor
|
|
chr8_-_17743062
|
4.743
|
|
FGL1
|
fibrinogen-like 1
|
|
chr2_-_63815581
|
4.722
|
|
WDPCP
|
WD repeat containing planar cell polarity effector
|
|
chr8_-_27115935
|
4.678
|
|
STMN4
|
stathmin-like 4
|
|
chr15_+_41245635
|
4.589
|
NM_001142776
NM_024111
|
CHAC1
|
ChaC, cation transport regulator homolog 1 (E. coli)
|
|
chr6_+_31895201
|
4.478
|
NM_000063
NM_001145903
|
C2
|
complement component 2
|
|
chrX_-_13835213
|
4.326
|
|
GPM6B
|
glycoprotein M6B
|
|
chr17_+_1665281
|
4.293
|
|
SERPINF1
|
serpin peptidase inhibitor, clade F (alpha-2 antiplasmin, pigment epithelium derived factor), member 1
|
|
chr6_+_131894343
|
4.288
|
NM_000045
NM_001244438
|
ARG1
|
arginase, liver
|
|
chr16_+_75252882
|
4.141
|
NM_001906
|
CTRB1
|
chymotrypsinogen B1
|
|
chr12_-_113841654
|
4.086
|
NM_006843
|
SDS
|
serine dehydratase
|
|
chr4_-_10023094
|
3.900
|
NM_020041
|
SLC2A9
|
solute carrier family 2 (facilitated glucose transporter), member 9
|
|
chr4_-_71532341
|
3.899
|
NM_144646
|
IGJ
|
immunoglobulin J polypeptide, linker protein for immunoglobulin alpha and mu polypeptides
|
|
chr16_+_24266873
|
3.876
|
NM_006539
|
CACNG3
|
calcium channel, voltage-dependent, gamma subunit 3
|
|
chr5_-_24645084
|
3.825
|
NM_006727
|
CDH10
|
cadherin 10, type 2 (T2-cadherin)
|
|
chr1_-_230513390
|
3.765
|
NM_024554
|
PGBD5
|
piggyBac transposable element derived 5
|
|
chr17_+_1665306
|
3.722
|
|
SERPINF1
|
serpin peptidase inhibitor, clade F (alpha-2 antiplasmin, pigment epithelium derived factor), member 1
|
|
chr16_-_28550227
|
3.674
|
|
NUPR1
|
nuclear protein, transcriptional regulator, 1
|
|
chr9_+_125132823
|
3.560
|
|
PTGS1
|
prostaglandin-endoperoxide synthase 1 (prostaglandin G/H synthase and cyclooxygenase)
|
|
chr9_-_123812535
|
3.507
|
NM_001735
|
C5
|
complement component 5
|
|
chr11_+_59824129
|
3.505
|
|
MS4A3
|
membrane-spanning 4-domains, subfamily A, member 3 (hematopoietic cell-specific)
|
|
chr14_-_60337350
|
3.489
|
NM_021136
|
RTN1
|
reticulon 1
|
|
chr2_+_128175989
|
3.405
|
NM_000312
|
PROC
|
protein C (inactivator of coagulation factors Va and VIIIa)
|
|
chr9_+_80911990
|
3.382
|
NM_021154
NM_058179
|
PSAT1
|
phosphoserine aminotransferase 1
|
|
chr16_-_21663962
|
3.346
|
NM_005849
|
IGSF6
|
immunoglobulin superfamily, member 6
|
|
chr5_+_161275897
|
3.345
|
NM_001127646
|
GABRA1
|
gamma-aminobutyric acid (GABA) A receptor, alpha 1
|
|
chr17_+_1665342
|
3.274
|
|
SERPINF1
|
serpin peptidase inhibitor, clade F (alpha-2 antiplasmin, pigment epithelium derived factor), member 1
|
|
chr12_-_121736110
|
3.269
|
NM_006549
NM_153499
NM_153500
NM_172214
NM_172215
NM_172216
|
CAMKK2
|
calcium/calmodulin-dependent protein kinase kinase 2, beta
|
|
chr8_-_110657745
|
3.259
|
NM_001099751
NM_001099752
|
SYBU
|
syntabulin (syntaxin-interacting)
|
|
chr6_+_32605182
|
3.196
|
NM_002122
|
HLA-DQA1
|
major histocompatibility complex, class II, DQ alpha 1
|
|
chr22_+_23054862
|
3.122
|
|
IGLV3-21
IGLJ3
IGLC1
|
immunoglobulin lambda variable 3-21
immunoglobulin lambda joining 3
immunoglobulin lambda constant 1 (Mcg marker)
|
|
chr8_+_24151579
|
3.115
|
NM_014265
NM_021777
|
ADAM28
|
ADAM metallopeptidase domain 28
|
|
chr8_-_27115897
|
3.115
|
NM_030795
|
STMN4
|
stathmin-like 4
|
|
chr11_-_102668892
|
2.992
|
NM_001145938
NM_002421
|
MMP1
|
matrix metallopeptidase 1 (interstitial collagenase)
|
|
chr6_+_31913852
|
2.976
|
|
CFB
|
complement factor B
|
|
chr16_-_28550324
|
2.965
|
NM_001042483
NM_012385
|
NUPR1
|
nuclear protein, transcriptional regulator, 1
|
|
chr19_+_47813074
|
2.946
|
NM_001736
|
C5AR1
|
complement component 5a receptor 1
|
|
chr8_+_22019167
|
2.926
|
NM_001172357
NM_001172410
NM_003018
|
SFTPC
|
surfactant protein C
|
|
chr4_+_157997181
|
2.891
|
NM_000824
NM_001166061
NM_001166060
|
GLRB
|
glycine receptor, beta
|
|
chr1_+_196621007
|
2.879
|
NM_000186
NM_001014975
|
CFH
|
complement factor H
|
|
chr14_+_21359542
|
2.875
|
NM_002935
|
RNASE3
|
ribonuclease, RNase A family, 3
|
|
chr2_-_74542149
|
2.840
|
NM_021196
|
SLC4A5
|
solute carrier family 4, sodium bicarbonate cotransporter, member 5
|
|
chr17_+_56315786
|
2.830
|
NM_001160102
NM_006151
|
LPO
|
lactoperoxidase
|
|
chr17_+_1665233
|
2.820
|
NM_002615
|
SERPINF1
|
serpin peptidase inhibitor, clade F (alpha-2 antiplasmin, pigment epithelium derived factor), member 1
|
|
chr5_-_147211141
|
2.797
|
|
SPINK1
|
serine peptidase inhibitor, Kazal type 1
|
|
chr11_+_59824054
|
2.792
|
NM_001031666
NM_001031809
NM_006138
|
MS4A3
|
membrane-spanning 4-domains, subfamily A, member 3 (hematopoietic cell-specific)
|
|
chr1_-_151345156
|
2.760
|
NM_003944
|
SELENBP1
|
selenium binding protein 1
|
|
chr14_+_21423627
|
2.756
|
NM_002934
|
RNASE2
|
ribonuclease, RNase A family, 2 (liver, eosinophil-derived neurotoxin)
|
|
chr9_-_77502635
|
2.667
|
NM_001177310
|
TRPM6
|
transient receptor potential cation channel, subfamily M, member 6
|
|
chr1_-_31345361
|
2.558
|
|
SDC3
|
syndecan 3
|
|
chr8_-_110661007
|
2.558
|
NM_001099747
NM_001099748
NM_001099749
NM_001099750
NM_017786
|
SYBU
|
syntabulin (syntaxin-interacting)
|
|
chrX_+_144908927
|
2.393
|
NM_004709
|
CXorf1
|
chromosome X open reading frame 1
|
|
chr17_-_55980749
|
2.329
|
NM_017949
|
CUEDC1
|
CUE domain containing 1
|
|
chr3_-_46505077
|
2.328
|
NM_001199149
|
LTF
|
lactotransferrin
|
|
chr16_+_27438578
|
2.289
|
NM_021798
|
IL21R
|
interleukin 21 receptor
|
|
chr11_+_71846755
|
2.226
|
NM_000804
|
FOLR3
|
folate receptor 3 (gamma)
|
|
chr6_-_11779279
|
2.209
|
NM_001143948
NM_032744
|
C6orf105
|
chromosome 6 open reading frame 105
|
|
chr12_+_5153084
|
2.198
|
NM_002234
|
KCNA5
|
potassium voltage-gated channel, shaker-related subfamily, member 5
|
|
chr6_-_41254392
|
2.177
|
NM_001242589
NM_001242590
NM_018643
|
TREM1
|
triggering receptor expressed on myeloid cells 1
|
|
chr5_-_66492574
|
2.155
|
NM_005582
|
CD180
|
CD180 molecule
|
|
chr19_+_11350282
|
2.089
|
NM_018687
|
C19orf80
|
chromosome 19 open reading frame 80
|
|
chr19_+_41497182
|
2.080
|
NM_000767
|
CYP2B6
|
cytochrome P450, family 2, subfamily B, polypeptide 6
|
|
chrX_-_13835012
|
2.037
|
|
GPM6B
|
glycoprotein M6B
|
|
chr3_-_42305438
|
2.034
|
NM_001174138
|
CCK
|
cholecystokinin
|
|
chr1_-_173886401
|
2.019
|
|
SERPINC1
|
serpin peptidase inhibitor, clade C (antithrombin), member 1
|
|
chr12_-_52867521
|
2.008
|
NM_173086
|
KRT6C
|
keratin 6C
|
|
chr4_+_113739203
|
1.983
|
NM_001127493
|
ANK2
|
ankyrin 2, neuronal
|
|
chr12_-_52845862
|
1.926
|
NM_005555
|
KRT6B
|
keratin 6B
|
|
chr19_+_41430123
|
1.911
|
|
CYP2B7P1
|
cytochrome P450, family 2, subfamily B, polypeptide 7 pseudogene 1
|
|
chr17_-_34625628
|
1.892
|
NM_001001437
NM_021006
|
CCL3L3
CCL3
CCL3L1
|
chemokine (C-C motif) ligand 3-like 3
chemokine (C-C motif) ligand 3
chemokine (C-C motif) ligand 3-like 1
|
|
chr7_-_64023444
|
1.864
|
|
|
|
|
chr7_-_37024664
|
1.860
|
NM_001039459
|
ELMO1
|
engulfment and cell motility 1
|
|
chr17_-_15523017
|
1.852
|
NM_006382
|
CDRT1
|
CMT1A duplicated region transcript 1
|
|
chr7_-_83270746
|
1.836
|
NM_001178129
|
SEMA3E
|
sema domain, immunoglobulin domain (Ig), short basic domain, secreted, (semaphorin) 3E
|
|
chr6_+_36644236
|
1.792
|
NM_001220777
NM_078467
|
CDKN1A
|
cyclin-dependent kinase inhibitor 1A (p21, Cip1)
|
|
chr7_+_90339146
|
1.775
|
|
CDK14
|
cyclin-dependent kinase 14
|
|
chr12_-_25101993
|
1.769
|
|
BCAT1
|
branched chain amino-acid transaminase 1, cytosolic
|
|
chr12_-_15114495
|
1.750
|
NM_001175
|
ARHGDIB
|
Rho GDP dissociation inhibitor (GDI) beta
|
|
chr3_+_1134619
|
1.749
|
NM_014461
|
CNTN6
|
contactin 6
|
|
chrX_-_138724851
|
1.734
|
NM_001171877
NM_001171878
NM_001171879
NM_005369
|
MCF2
|
MCF.2 cell line derived transforming sequence
|
|
chr7_+_90338711
|
1.710
|
NM_012395
|
CDK14
|
cyclin-dependent kinase 14
|
|
chr1_+_153330329
|
1.692
|
NM_002965
|
S100A9
|
S100 calcium binding protein A9
|
|
chr12_-_25101923
|
1.691
|
|
BCAT1
|
branched chain amino-acid transaminase 1, cytosolic
|
|
chr12_-_57914287
|
1.686
|
NM_001195053
NM_001195054
NM_001195055
NM_001195056
NM_001195057
NM_004083
|
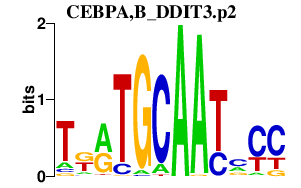
DDIT3
|
DNA-damage-inducible transcript 3
|
|
chr11_-_66675334
|
1.686
|
NM_022172
|
PC
|
pyruvate carboxylase
|
|
chr11_+_18287807
|
1.652
|
NM_000331
NM_001178006
NM_199161
|
SAA1
|
serum amyloid A1
|
|
chr1_+_196857143
|
1.641
|
NM_001201550
NM_001201551
NM_006684
|
CFHR4
|
complement factor H-related 4
|
|
chr12_+_54426831
|
1.620
|
NM_018953
|
HOXC5
|
homeobox C5
|
|
chr3_+_186435097
|
1.600
|
NM_000893
NM_001102416
NM_001166451
|
KNG1
|
kininogen 1
|
|
chr8_+_42552561
|
1.595
|
NM_000749
|
CHRNB3
|
cholinergic receptor, nicotinic, beta 3
|
|
chr19_-_18197632
|
1.584
|
NM_005535
NM_153701
|
IL12RB1
|
interleukin 12 receptor, beta 1
|
|
chr16_-_21663908
|
1.583
|
|
IGSF6
|
immunoglobulin superfamily, member 6
|
|
chr12_-_10151689
|
1.575
|
NM_001099431
NM_016509
|
CLEC1B
|
C-type lectin domain family 1, member B
|
|
chr17_+_73996986
|
1.565
|
NM_001258
|
CDK3
|
cyclin-dependent kinase 3
|
|
chr3_+_149192479
|
1.554
|
|
TM4SF4
|
transmembrane 4 L six family member 4
|
|
chrX_-_13835313
|
1.547
|
NM_001001995
NM_001001996
NM_005278
|
GPM6B
|
glycoprotein M6B
|
|
chr18_+_61637262
|
1.501
|
NM_001031848
NM_002640
NM_198833
|
SERPINB8
|
serpin peptidase inhibitor, clade B (ovalbumin), member 8
|
|
chr1_-_20250051
|
1.496
|
NM_014589
|
PLA2G2E
|
phospholipase A2, group IIE
|
|
chr14_-_70263871
|
1.478
|
NM_003049
|
SLC10A1
|
solute carrier family 10 (sodium/bile acid cotransporter family), member 1
|
|
chr9_-_125675571
|
1.433
|
NM_006626
|
ZBTB6
|
zinc finger and BTB domain containing 6
|
|
chr19_+_1450208
|
1.379
|
|
APC2
|
adenomatosis polyposis coli 2
|
|
chr11_-_102668822
|
1.308
|
|
MMP1
|
matrix metallopeptidase 1 (interstitial collagenase)
|
|
chr19_+_49078992
|
1.299
|
NM_004605
|
SULT2B1
|
sulfotransferase family, cytosolic, 2B, member 1
|
|
chr4_-_71532206
|
1.296
|
|
IGJ
|
immunoglobulin J polypeptide, linker protein for immunoglobulin alpha and mu polypeptides
|
|
chr5_-_94224601
|
1.287
|
|
MCTP1
|
multiple C2 domains, transmembrane 1
|
|
chr2_+_113816684
|
1.283
|
NM_012275
|
IL36RN
|
interleukin 36 receptor antagonist
|
|
chr18_-_55289014
|
1.276
|
|
NARS
|
asparaginyl-tRNA synthetase
|
|
chr3_+_186739643
|
1.253
|
NM_003032
|
ST6GAL1
|
ST6 beta-galactosamide alpha-2,6-sialyltranferase 1
|
|
chr6_+_31913920
|
1.249
|
|
CFB
|
complement factor B
|
|
chr5_-_151066445
|
1.247
|
|
SPARC
|
secreted protein, acidic, cysteine-rich (osteonectin)
|
|
chr11_+_71927818
|
1.240
|
NM_000803
NM_001113534
NM_001113535
NM_001113536
|
FOLR2
|
folate receptor 2 (fetal)
|
|
chr5_-_176836488
|
1.229
|
|
F12
|
coagulation factor XII (Hageman factor)
|
|
chr12_-_25102281
|
1.228
|
NM_001178091
NM_001178092
NM_005504
|
BCAT1
|
branched chain amino-acid transaminase 1, cytosolic
|
|
chr4_+_159131400
|
1.206
|
NM_018342
|
TMEM144
|
transmembrane protein 144
|
|
chr11_+_60260250
|
1.196
|
NM_001164470
NM_017716
|
MS4A12
|
membrane-spanning 4-domains, subfamily A, member 12
|
|
chrX_-_101112548
|
1.187
|
NM_032946
|
NXF5
|
nuclear RNA export factor 5
|
|
chr1_-_9129666
|
1.165
|
NM_001135585
NM_003039
|
SLC2A5
|
solute carrier family 2 (facilitated glucose/fructose transporter), member 5
|
|
chr3_-_129599220
|
1.160
|
NM_001017395
|
TMCC1
|
transmembrane and coiled-coil domain family 1
|
|
chr3_+_46395574
|
1.147
|
|
CCR2
|
chemokine (C-C motif) receptor 2
|
|
chr4_-_15940362
|
1.137
|
NM_005130
|
FGFBP1
|
fibroblast growth factor binding protein 1
|
|
chr1_-_144997110
|
1.130
|
NM_001195260
|
PDE4DIP
|
phosphodiesterase 4D interacting protein
|
|
chr2_+_237478379
|
1.130
|
NM_020311
|
CXCR7
|
chemokine (C-X-C motif) receptor 7
|
|
chr13_-_30169584
|
1.121
|
|
SLC7A1
|
solute carrier family 7 (cationic amino acid transporter, y+ system), member 1
|
|
chr1_+_161185061
|
1.120
|
|
FCER1G
|
Fc fragment of IgE, high affinity I, receptor for; gamma polypeptide
|
|
chr12_+_21679190
|
1.106
|
NM_030572
|
C12orf39
|
chromosome 12 open reading frame 39
|
|
chr2_+_236402948
|
1.099
|
|
AGAP1
|
ArfGAP with GTPase domain, ankyrin repeat and PH domain 1
|
|
chr16_+_3405888
|
1.086
|
NM_012368
|
OR2C1
|
olfactory receptor, family 2, subfamily C, member 1
|
|
chr15_+_58724174
|
1.069
|
NM_000236
|
LIPC
|
lipase, hepatic
|
|
chr5_+_140734767
|
1.069
|
NM_018917
NM_032053
|
PCDHGA4
|
protocadherin gamma subfamily A, 4
|
|
chr19_+_44084695
|
1.065
|
NM_001193622
|
LOC390940
|
uncharacterized protein ENSP00000244321
|
|
chr19_+_50015535
|
1.063
|
NM_001136019
|
FCGRT
|
Fc fragment of IgG, receptor, transporter, alpha
|
|
chr19_-_47128293
|
1.054
|
NM_000960
|
PTGIR
|
prostaglandin I2 (prostacyclin) receptor (IP)
|
|
chr1_-_161207879
|
1.050
|
NM_001077469
NM_001077470
NM_001077471
NM_001077472
NM_001077473
NM_001077474
NM_001077475
NM_001077476
NM_001077477
NM_001077478
NM_001077479
NM_001077480
NM_001077481
NM_001077482
NM_005122
|
NR1I3
|
nuclear receptor subfamily 1, group I, member 3
|
|
chr21_+_43619798
|
1.030
|
NM_207627
NM_207628
|
ABCG1
|
ATP-binding cassette, sub-family G (WHITE), member 1
|
|
chr4_-_70826712
|
1.017
|
NM_001891
|
CSN2
|
casein beta
|
|
chr12_-_16759531
|
1.009
|
NM_018640
|
LMO3
|
LIM domain only 3 (rhombotin-like 2)
|
|
chr19_-_48614013
|
0.997
|
NM_001159322
NM_001159323
NM_003706
|
PLA2G4C
|
phospholipase A2, group IVC (cytosolic, calcium-independent)
|
|
chr21_-_15918635
|
0.995
|
NM_022136
|
SAMSN1
|
SAM domain, SH3 domain and nuclear localization signals 1
|
|
chr16_-_90076528
|
0.985
|
NM_024043
|
DBNDD1
|
dysbindin (dystrobrevin binding protein 1) domain containing 1
|
|
chr12_-_63328857
|
0.982
|
|
PPM1H
|
protein phosphatase, Mg2+/Mn2+ dependent, 1H
|
|
chr12_-_13103317
|
0.980
|
NM_018654
|
GPRC5D
|
G protein-coupled receptor, family C, group 5, member D
|
|
chr7_+_143657019
|
0.971
|
NM_012369
|
OR2F1
|
olfactory receptor, family 2, subfamily F, member 1
|
|
chr7_+_28338939
|
0.947
|
NM_182899
|
CREB5
|
cAMP responsive element binding protein 5
|
|
chr14_-_106494166
|
0.944
|
|
IGHV4-31
IGHA1
|
immunoglobulin heavy variable 4-31
immunoglobulin heavy constant alpha 1
|
|
chr3_+_46395224
|
0.936
|
NM_001123041
NM_001123396
|
CCR2
|
chemokine (C-C motif) receptor 2
|
|
chr18_-_55288951
|
0.934
|
|
NARS
|
asparaginyl-tRNA synthetase
|
|
chr16_+_19467771
|
0.933
|
NM_024780
|
TMC5
|
transmembrane channel-like 5
|
|
chrX_-_13956644
|
0.918
|
NM_001001994
|
GPM6B
|
glycoprotein M6B
|
|
chr6_-_157744536
|
0.917
|
|
TMEM242
|
transmembrane protein 242
|
|
chrX_+_46940235
|
0.917
|
|
RGN
|
regucalcin (senescence marker protein-30)
|
|
chr10_-_47173917
|
0.913
|
NM_001040084
NM_001098845
|
ANXA8L2
ANXA8
ANXA8L1
|
annexin A8-like 2
annexin A8
annexin A8-like 1
|
|
chr17_+_32683470
|
0.909
|
NM_005408
|
CCL13
|
chemokine (C-C motif) ligand 13
|
|
chr9_+_135937364
|
0.897
|
NM_001807
|
CEL
|
carboxyl ester lipase (bile salt-stimulated lipase)
|
|
chr6_+_131958441
|
0.868
|
NM_005021
|
ENPP3
|
ectonucleotide pyrophosphatase/phosphodiesterase 3
|
|
chr4_-_176733413
|
0.868
|
|
GPM6A
|
glycoprotein M6A
|
|
chr5_+_125758818
|
0.866
|
NM_001146320
NM_001146321
NM_023927
|
GRAMD3
|
GRAM domain containing 3
|
|
chr11_+_22689653
|
0.861
|
NM_177553
|
GAS2
|
growth arrest-specific 2
|
|
chr7_-_97619350
|
0.850
|
NM_006188
|
OCM2
|
oncomodulin 2
|
|
chr5_-_151066492
|
0.850
|
NM_003118
|
SPARC
|
secreted protein, acidic, cysteine-rich (osteonectin)
|
|
chr3_+_32993065
|
0.848
|
NM_005508
|
CCR4
|
chemokine (C-C motif) receptor 4
|
|
chr14_-_89016806
|
0.833
|
|
PTPN21
|
protein tyrosine phosphatase, non-receptor type 21
|
|
chrX_-_40506666
|
0.826
|
|
CXorf38
|
chromosome X open reading frame 38
|
|
chr2_+_113816214
|
0.826
|
NM_173170
|
IL36RN
|
interleukin 36 receptor antagonist
|
|
chr7_-_44530178
|
0.826
|
NM_015332
|
NUDCD3
|
NudC domain containing 3
|
|
chr16_+_202853
|
0.817
|
NM_005332
|
HBZ
|
hemoglobin, zeta
|
|
chr16_-_84651519
|
0.802
|
|
COTL1
|
coactosin-like 1 (Dictyostelium)
|
|
chr19_+_6887576
|
0.797
|
NM_001974
|
EMR1
|
egf-like module containing, mucin-like, hormone receptor-like 1
|
|
chr2_-_211018294
|
0.790
|
|
C2orf67
|
chromosome 2 open reading frame 67
|
|
chr5_-_176836535
|
0.788
|
NM_000505
|
F12
|
coagulation factor XII (Hageman factor)
|
|
chr16_+_67381252
|
0.788
|
NM_001161575
|
LRRC36
|
leucine rich repeat containing 36
|
|
chr7_+_26400503
|
0.788
|
NM_001199837
|
SNX10
|
sorting nexin 10
|
|
chr12_-_49259549
|
0.786
|
NM_014470
|
RND1
|
Rho family GTPase 1
|
|
chr9_+_116342939
|
0.776
|
NM_021106
|
RGS3
|
regulator of G-protein signaling 3
|

