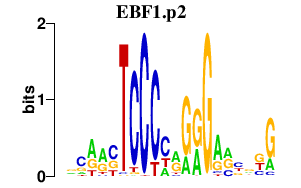
|
chr6_-_170102098
|
48.115
|
NM_001202550
NM_182552
|
WDR27
|
WD repeat domain 27
|
|
chr11_+_73359734
|
24.647
|
NM_001130036
|
PLEKHB1
|
pleckstrin homology domain containing, family B (evectins) member 1
|
|
chr11_-_117747331
|
24.072
|
|
FXYD6
|
FXYD domain containing ion transport regulator 6
|
|
chr11_-_117747618
|
20.071
|
NM_001204268
NM_001243598
NM_001164832
NM_001164836
NM_001164837
NM_022003
|
FXYD6-FXYD2
FXYD6
|
FXYD6-FXYD2 readthrough
FXYD domain containing ion transport regulator 6
|
|
chr8_-_22089517
|
19.836
|
|
PHYHIP
|
phytanoyl-CoA 2-hydroxylase interacting protein
|
|
chr2_+_17935379
|
18.749
|
NM_001130009
|
GEN1
|
Gen endonuclease homolog 1 (Drosophila)
|
|
chr8_-_22089850
|
18.419
|
NM_001099335
NM_014759
|
PHYHIP
|
phytanoyl-CoA 2-hydroxylase interacting protein
|
|
chr4_+_4388804
|
17.541
|
|
D4S234E
|
DNA segment on chromosome 4 (unique) 234 expressed sequence
|
|
chr16_+_22825481
|
17.361
|
|
HS3ST2
|
heparan sulfate (glucosamine) 3-O-sulfotransferase 2
|
|
chr4_+_128651518
|
17.324
|
NM_031291
|
SLC25A31
|
solute carrier family 25 (mitochondrial carrier; adenine nucleotide translocator), member 31
|
|
chr1_+_2005424
|
17.294
|
NM_001242874
|
PRKCZ
|
protein kinase C, zeta
|
|
chr4_+_4388717
|
17.212
|
|
D4S234E
|
DNA segment on chromosome 4 (unique) 234 expressed sequence
|
|
chr16_+_58498216
|
16.921
|
|
NDRG4
|
NDRG family member 4
|
|
chr14_+_92790151
|
16.597
|
NM_153646
|
SLC24A4
|
solute carrier family 24 (sodium/potassium/calcium exchanger), member 4
|
|
chr19_+_50936159
|
16.133
|
NM_004533
|
MYBPC2
|
myosin binding protein C, fast type
|
|
chr16_+_58534045
|
16.101
|
NM_001242833
NM_001242834
NM_001242835
NM_001242836
|
NDRG4
|
NDRG family member 4
|
|
chr13_-_30881556
|
14.715
|
NM_032116
|
KATNAL1
|
katanin p60 subunit A-like 1
|
|
chr1_+_152647770
|
14.586
|
NM_178429
|
LCE2C
|
late cornified envelope 2C
|
|
chr16_-_19896105
|
14.537
|
NM_016235
|
GPRC5B
|
G protein-coupled receptor, family C, group 5, member B
|
|
chr8_-_33424642
|
14.049
|
NM_024787
|
RNF122
|
ring finger protein 122
|
|
chr16_+_2039945
|
13.403
|
NM_004209
|
SYNGR3
|
synaptogyrin 3
|
|
chr11_+_69924407
|
13.382
|
NM_018043
|
ANO1
|
anoctamin 1, calcium activated chloride channel
|
|
chr13_+_113623496
|
13.146
|
NM_001112732
|
MCF2L
|
MCF.2 cell line derived transforming sequence-like
|
|
chr18_+_11981457
|
13.116
|
|
IMPA2
|
inositol(myo)-1(or 4)-monophosphatase 2
|
|
chr4_+_4387982
|
13.002
|
NM_001040101
NM_014392
|
D4S234E
|
DNA segment on chromosome 4 (unique) 234 expressed sequence
|
|
chr10_-_46970595
|
12.884
|
NM_031912
NM_181519
|
SYT15
|
synaptotagmin XV
|
|
chr22_+_21986968
|
12.850
|
NM_152612
|
CCDC116
|
coiled-coil domain containing 116
|
|
chr8_+_104152876
|
12.753
|
NM_001024372
NM_024812
|
BAALC
|
brain and acute leukemia, cytoplasmic
|
|
chr6_+_42531767
|
12.745
|
|
UBR2
|
ubiquitin protein ligase E3 component n-recognin 2
|
|
chr1_-_156217717
|
12.581
|
NM_198406
NM_024897
|
PAQR6
|
progestin and adipoQ receptor family member VI
|
|
chr2_+_17935124
|
12.575
|
NM_182625
|
GEN1
|
Gen endonuclease homolog 1 (Drosophila)
|
|
chr1_-_203154304
|
12.383
|
|
CHI3L1
|
chitinase 3-like 1 (cartilage glycoprotein-39)
|
|
chr3_-_49907304
|
12.184
|
NM_024046
|
CAMKV
|
CaM kinase-like vesicle-associated
|
|
chr17_-_10101854
|
12.149
|
NM_201433
|
GAS7
|
growth arrest-specific 7
|
|
chr19_-_38720312
|
11.936
|
NM_001135156
|
DPF1
|
D4, zinc and double PHD fingers family 1
|
|
chr19_-_5680910
|
11.727
|
NM_205767
|
C19orf70
|
chromosome 19 open reading frame 70
|
|
chr3_-_183543295
|
11.691
|
NM_024871
|
MAP6D1
|
MAP6 domain containing 1
|
|
chr7_-_994259
|
11.645
|
NM_006869
|
ADAP1
|
ArfGAP with dual PH domains 1
|
|
chr10_-_73848263
|
11.548
|
|
SPOCK2
|
sparc/osteonectin, cwcv and kazal-like domains proteoglycan (testican) 2
|
|
chr16_+_30418576
|
11.465
|
NM_001142305
NM_016643
|
ZNF771
|
zinc finger protein 771
|
|
chr16_+_22825806
|
11.346
|
NM_006043
|
HS3ST2
|
heparan sulfate (glucosamine) 3-O-sulfotransferase 2
|
|
chr3_+_93698959
|
11.186
|
NM_001174150
NM_001174151
NM_144996
NM_182896
|
ARL13B
|
ADP-ribosylation factor-like 13B
|
|
chr1_+_1550794
|
11.114
|
NM_001170686
NM_001170687
NM_001170688
NM_080875
|
MIB2
|
mindbomb homolog 2 (Drosophila)
|
|
chr8_-_99306563
|
11.084
|
NM_024759
|
NIPAL2
|
NIPA-like domain containing 2
|
|
chr6_+_71123147
|
11.030
|
|
FAM135A
|
family with sequence similarity 135, member A
|
|
chr4_-_657424
|
10.989
|
|
|
|
|
chr5_-_79286793
|
10.940
|
NM_001010891
NM_001167741
|
MTX3
|
metaxin 3
|
|
chr17_+_44068828
|
10.929
|
|
MAPT
|
microtubule-associated protein tau
|
|
chr16_-_3184858
|
10.848
|
|
|
|
|
chr17_-_8093346
|
10.842
|
|
C17orf59
|
chromosome 17 open reading frame 59
|
|
chr2_+_113816684
|
10.680
|
NM_012275
|
IL36RN
|
interleukin 36 receptor antagonist
|
|
chr1_-_1051458
|
10.383
|
|
C1orf159
|
chromosome 1 open reading frame 159
|
|
chr3_+_101443436
|
10.237
|
NM_024548
|
CEP97
|
centrosomal protein 97kDa
|
|
chr3_-_38071030
|
10.171
|
NM_006225
|
PLCD1
|
phospholipase C, delta 1
|
|
chr1_+_77747727
|
10.141
|
|
AK5
|
adenylate kinase 5
|
|
chr20_+_58515408
|
10.133
|
NM_001190827
NM_022106
|
C20orf177
|
chromosome 20 open reading frame 177
|
|
chr1_+_77747602
|
10.120
|
NM_174858
|
AK5
|
adenylate kinase 5
|
|
chr19_+_54024176
|
10.086
|
NM_018555
|
ZNF331
|
zinc finger protein 331
|
|
chr3_-_195306274
|
10.005
|
|
APOD
|
apolipoprotein D
|
|
chr19_-_6502224
|
9.974
|
NM_006087
|
TUBB4A
|
tubulin, beta 4A class IVa
|
|
chr1_+_154301219
|
9.805
|
|
ATP8B2
|
ATPase, class I, type 8B, member 2
|
|
chr8_+_42128821
|
9.741
|
|
IKBKB
|
inhibitor of kappa light polypeptide gene enhancer in B-cells, kinase beta
|
|
chr14_-_94844881
|
9.733
|
|
SERPINA1
|
serpin peptidase inhibitor, clade A (alpha-1 antiproteinase, antitrypsin), member 1
|
|
chr19_-_9731883
|
9.732
|
NM_152289
|
ZNF561
|
zinc finger protein 561
|
|
chr8_+_42128834
|
9.555
|
|
IKBKB
|
inhibitor of kappa light polypeptide gene enhancer in B-cells, kinase beta
|
|
chr15_+_75118950
|
9.554
|
NM_001030005
|
CPLX3
|
complexin 3
|
|
chr2_+_219724545
|
9.423
|
NM_006522
|
WNT6
|
wingless-type MMTV integration site family, member 6
|
|
chr1_-_182360400
|
9.367
|
NM_001033056
|
GLUL
|
glutamate-ammonia ligase
|
|
chr17_-_36956145
|
9.323
|
NM_003559
|
PIP4K2B
|
phosphatidylinositol-5-phosphate 4-kinase, type II, beta
|
|
chr6_-_46459010
|
9.197
|
NM_001251974
|
RCAN2
|
regulator of calcineurin 2
|
|
chr16_+_89724175
|
9.112
|
NM_153025
|
C16orf55
|
chromosome 16 open reading frame 55
|
|
chr1_-_113162215
|
9.045
|
|
ST7L
|
suppression of tumorigenicity 7 like
|
|
chr8_-_110620220
|
9.008
|
|
SYBU
|
syntabulin (syntaxin-interacting)
|
|
chr16_+_30418885
|
8.972
|
|
ZNF771
|
zinc finger protein 771
|
|
chr15_+_40886442
|
8.915
|
NM_144508
NM_170589
|
CASC5
|
cancer susceptibility candidate 5
|
|
chr1_-_85725315
|
8.909
|
NM_198077
|
C1orf52
|
chromosome 1 open reading frame 52
|
|
chr5_-_851100
|
8.716
|
NM_024786
|
ZDHHC11
|
zinc finger, DHHC-type containing 11
|
|
chr12_-_48152860
|
8.708
|
NM_001098531
|
RAPGEF3
|
Rap guanine nucleotide exchange factor (GEF) 3
|
|
chr16_+_58497548
|
8.703
|
NM_020465
|
NDRG4
|
NDRG family member 4
|
|
chr7_-_98467483
|
8.698
|
|
TMEM130
|
transmembrane protein 130
|
|
chr1_+_1981902
|
8.686
|
NM_002744
|
PRKCZ
|
protein kinase C, zeta
|
|
chr8_+_141521365
|
8.658
|
NM_017444
|
CHRAC1
|
chromatin accessibility complex 1
|
|
chr6_+_71123105
|
8.611
|
NM_001105531
NM_020819
|
FAM135A
|
family with sequence similarity 135, member A
|
|
chr8_+_1952875
|
8.491
|
|
KBTBD11
|
kelch repeat and BTB (POZ) domain containing 11
|
|
chr17_+_79609298
|
8.476
|
NM_031945
|
TSPAN10
|
tetraspanin 10
|
|
chr16_+_1386197
|
8.473
|
NM_001199096
|
BAIAP3
|
BAI1-associated protein 3
|
|
chr3_-_9834357
|
8.468
|
NM_006354
NM_133480
|
TADA3
|
transcriptional adaptor 3
|
|
chr12_+_119616594
|
8.403
|
NM_014365
|
HSPB8
|
heat shock 22kDa protein 8
|
|
chr7_-_124405029
|
8.379
|
|
GPR37
|
G protein-coupled receptor 37 (endothelin receptor type B-like)
|
|
chr6_-_32551993
|
8.373
|
|
HLA-DRB1
HLA-DRB4
HLA-DRB5
|
major histocompatibility complex, class II, DR beta 1
major histocompatibility complex, class II, DR beta 4
major histocompatibility complex, class II, DR beta 5
|
|
chr12_+_53443834
|
8.346
|
NM_170754
|
TENC1
|
tensin like C1 domain containing phosphatase (tensin 2)
|
|
chr19_-_2236648
|
8.322
|
|
PLEKHJ1
|
pleckstrin homology domain containing, family J member 1
|
|
chr1_-_49242406
|
8.318
|
NM_024603
|
BEND5
|
BEN domain containing 5
|
|
chr17_-_8093492
|
8.316
|
NM_017622
|
C17orf59
|
chromosome 17 open reading frame 59
|
|
chr16_+_58497628
|
8.309
|
|
NDRG4
|
NDRG family member 4
|
|
chr1_-_67390413
|
8.293
|
NM_024763
NM_207014
|
WDR78
|
WD repeat domain 78
|
|
chr2_-_97523626
|
8.191
|
NM_016466
|
ANKRD39
|
ankyrin repeat domain 39
|
|
chr1_-_42630386
|
8.165
|
NM_033553
|
GUCA2A
|
guanylate cyclase activator 2A (guanylin)
|
|
chr1_+_2005083
|
8.162
|
NM_001033581
|
PRKCZ
|
protein kinase C, zeta
|
|
chr19_+_49622480
|
8.133
|
NM_003660
|
PPFIA3
|
protein tyrosine phosphatase, receptor type, f polypeptide (PTPRF), interacting protein (liprin), alpha 3
|
|
chr1_+_36023389
|
8.103
|
NM_001014839
NM_001014841
NM_014284
|
NCDN
|
neurochondrin
|
|
chr8_+_11142314
|
8.102
|
|
MTMR9
|
myotubularin related protein 9
|
|
chr17_+_79633724
|
8.082
|
NM_199287
|
CCDC137
|
coiled-coil domain containing 137
|
|
chr8_+_142138684
|
7.983
|
NM_014957
|
DENND3
|
DENN/MADD domain containing 3
|
|
chr22_-_36013303
|
7.940
|
NM_005368
NM_203378
|
MB
|
myoglobin
|
|
chr15_+_32933869
|
7.889
|
NM_001144757
NM_003020
|
SCG5
|
secretogranin V (7B2 protein)
|
|
chr15_-_40987284
|
7.824
|
|
LOC100505648
|
uncharacterized LOC100505648
|
|
chr6_+_7590405
|
7.824
|
NM_152551
|
SNRNP48
|
small nuclear ribonucleoprotein 48kDa (U11/U12)
|
|
chr14_+_76127592
|
7.809
|
|
TTLL5
|
tubulin tyrosine ligase-like family, member 5
|
|
chr16_-_30546145
|
7.774
|
NM_023931
|
ZNF747
|
zinc finger protein 747
|
|
chr14_-_77787023
|
7.707
|
NM_013382
|
POMT2
|
protein-O-mannosyltransferase 2
|
|
chr11_-_62369097
|
7.702
|
|
MTA2
|
metastasis associated 1 family, member 2
|
|
chr19_+_48867650
|
7.692
|
NM_012451
|
SYNGR4
|
synaptogyrin 4
|
|
chr17_+_38119225
|
7.688
|
NM_178171
|
GSDMA
|
gasdermin A
|
|
chr15_-_45670955
|
7.582
|
NM_001482
|
GATM
|
glycine amidinotransferase (L-arginine:glycine amidinotransferase)
|
|
chr7_-_142583260
|
7.576
|
NM_018646
|
TRPV6
|
transient receptor potential cation channel, subfamily V, member 6
|
|
chr15_+_75639330
|
7.572
|
NM_024608
|
NEIL1
|
nei endonuclease VIII-like 1 (E. coli)
|
|
chr17_-_48207113
|
7.557
|
NM_174920
|
SAMD14
|
sterile alpha motif domain containing 14
|
|
chr18_+_51795848
|
7.514
|
NM_007195
|
POLI
|
polymerase (DNA directed) iota
|
|
chr7_-_994008
|
7.478
|
|
ADAP1
|
ArfGAP with dual PH domains 1
|
|
chr7_-_4923246
|
7.433
|
NM_018059
|
RADIL
|
Ras association and DIL domains
|
|
chr19_+_12949258
|
7.432
|
NM_014975
|
MAST1
|
microtubule associated serine/threonine kinase 1
|
|
chr1_-_182360889
|
7.429
|
|
GLUL
|
glutamate-ammonia ligase
|
|
chr1_+_156339002
|
7.418
|
NM_020407
|
RHBG
|
Rh family, B glycoprotein (gene/pseudogene)
|
|
chr22_-_18484183
|
7.396
|
|
MICAL3
|
microtubule associated monoxygenase, calponin and LIM domain containing 3
|
|
chr17_+_78194090
|
7.387
|
NM_001166347
NM_001166348
NM_001166349
NM_173626
|
SLC26A11
|
solute carrier family 26, member 11
|
|
chr3_+_9834201
|
7.373
|
NM_001198793
NM_005718
|
ARPC4-TTLL3
ARPC4
|
ARPC4-TTLL3 readthrough
actin related protein 2/3 complex, subunit 4, 20kDa
|
|
chr3_+_130745693
|
7.371
|
NM_001146003
NM_024800
NM_145910
|
NEK11
|
NIMA (never in mitosis gene a)- related kinase 11
|
|
chr19_-_51327003
|
7.366
|
NM_002257
|
KLK1
|
kallikrein 1
|
|
chr2_+_131674223
|
7.362
|
NM_015320
NM_032995
|
ARHGEF4
|
Rho guanine nucleotide exchange factor (GEF) 4
|
|
chr9_-_136150629
|
7.324
|
NM_020469
|
ABO
|
ABO blood group (transferase A, alpha 1-3-N-acetylgalactosaminyltransferase; transferase B, alpha 1-3-galactosyltransferase)
|
|
chr5_-_149792276
|
7.288
|
|
CD74
|
CD74 molecule, major histocompatibility complex, class II invariant chain
|
|
chr15_+_85144219
|
7.249
|
NM_001007072
NM_017894
NM_181877
|
ZSCAN2
|
zinc finger and SCAN domain containing 2
|
|
chr19_+_56652689
|
7.215
|
|
ZNF444
|
zinc finger protein 444
|
|
chr15_-_45670624
|
7.185
|
|
GATM
|
glycine amidinotransferase (L-arginine:glycine amidinotransferase)
|
|
chr22_-_39240016
|
7.110
|
NM_014293
|
NPTXR
|
neuronal pentraxin receptor
|
|
chr17_-_34890610
|
7.110
|
|
MYO19
|
myosin XIX
|
|
chr3_+_23987514
|
7.105
|
NM_001145425
|
NR1D2
|
nuclear receptor subfamily 1, group D, member 2
|
|
chr15_+_62682682
|
7.061
|
|
TLN2
|
talin 2
|
|
chr16_-_1525006
|
7.023
|
|
CLCN7
|
chloride channel 7
|
|
chr8_-_144241725
|
7.023
|
NM_001135655
|
LY6H
|
lymphocyte antigen 6 complex, locus H
|
|
chr17_+_8339135
|
7.007
|
NM_001025579
NM_030808
|
NDEL1
|
nudE nuclear distribution gene E homolog (A. nidulans)-like 1
|
|
chr8_-_144241456
|
7.004
|
NM_002347
|
LY6H
|
lymphocyte antigen 6 complex, locus H
|
|
chr2_-_9695827
|
6.985
|
|
ADAM17
|
ADAM metallopeptidase domain 17
|
|
chr9_-_101470836
|
6.941
|
NM_005458
|
GABBR2
|
gamma-aminobutyric acid (GABA) B receptor, 2
|
|
chr18_+_55711746
|
6.936
|
|
NEDD4L
|
neural precursor cell expressed, developmentally down-regulated 4-like
|
|
chr5_-_149792370
|
6.920
|
NM_001025158
NM_001025159
NM_004355
|
CD74
|
CD74 molecule, major histocompatibility complex, class II invariant chain
|
|
chr19_+_47524142
|
6.912
|
NM_002517
|
NPAS1
|
neuronal PAS domain protein 1
|
|
chr16_-_4588379
|
6.832
|
NM_001199054
|
C16orf5
|
chromosome 16 open reading frame 5
|
|
chr1_-_16345284
|
6.782
|
NM_014424
|
HSPB7
|
heat shock 27kDa protein family, member 7 (cardiovascular)
|
|
chr19_+_56652529
|
6.773
|
NM_001253792
NM_018337
|
ZNF444
|
zinc finger protein 444
|
|
chr17_-_79105747
|
6.745
|
NM_004920
|
AATK
|
apoptosis-associated tyrosine kinase
|
|
chr9_-_136150604
|
6.740
|
|
ABO
|
ABO blood group (transferase A, alpha 1-3-N-acetylgalactosaminyltransferase; transferase B, alpha 1-3-galactosyltransferase)
|
|
chr8_-_21966812
|
6.739
|
NM_024815
|
NUDT18
|
nudix (nucleoside diphosphate linked moiety X)-type motif 18
|
|
chr1_-_151118932
|
6.688
|
NM_001178061
NM_001178062
NM_030913
|
SEMA6C
|
sema domain, transmembrane domain (TM), and cytoplasmic domain, (semaphorin) 6C
|
|
chr5_-_141257943
|
6.676
|
NM_002587
NM_032420
|
PCDH1
|
protocadherin 1
|
|
chr11_+_118401873
|
6.628
|
|
TMEM25
|
transmembrane protein 25
|
|
chr1_-_182360181
|
6.620
|
|
GLUL
|
glutamate-ammonia ligase
|
|
chr11_-_62368921
|
6.612
|
|
MTA2
|
metastasis associated 1 family, member 2
|
|
chr1_-_113161724
|
6.597
|
NM_017744
NM_138727
NM_138728
NM_138729
|
ST7L
|
suppression of tumorigenicity 7 like
|
|
chr11_+_63993720
|
6.593
|
NM_001128612
NM_001128613
NM_032344
|
NUDT22
|
nudix (nucleoside diphosphate linked moiety X)-type motif 22
|
|
chr1_-_27998658
|
6.526
|
|
IFI6
|
interferon, alpha-inducible protein 6
|
|
chr12_+_79258588
|
6.457
|
|
SYT1
|
synaptotagmin I
|
|
chr15_-_64648359
|
6.441
|
NM_022048
|
CSNK1G1
|
casein kinase 1, gamma 1
|
|
chr19_-_57183122
|
6.431
|
NM_001005850
|
ZNF835
|
zinc finger protein 835
|
|
chr4_+_47033294
|
6.413
|
NM_000812
|
GABRB1
|
gamma-aminobutyric acid (GABA) A receptor, beta 1
|
|
chr21_+_27107322
|
6.400
|
NM_002040
|
GABPA
|
GA binding protein transcription factor, alpha subunit 60kDa
|
|
chr1_-_236445084
|
6.359
|
|
ERO1LB
|
ERO1-like beta (S. cerevisiae)
|
|
chr17_+_27055797
|
6.358
|
NM_178170
|
NEK8
|
NIMA (never in mitosis gene a)- related kinase 8
|
|
chr4_-_90758126
|
6.355
|
NM_001146054
NM_007308
NM_000345
|
SNCA
|
synuclein, alpha (non A4 component of amyloid precursor)
|
|
chr16_-_4588738
|
6.353
|
NM_001199055
NM_001199056
NM_013399
|
C16orf5
|
chromosome 16 open reading frame 5
|
|
chr19_-_14016908
|
6.341
|
NM_024323
|
C19orf57
|
chromosome 19 open reading frame 57
|
|
chr19_+_47813074
|
6.320
|
NM_001736
|
C5AR1
|
complement component 5a receptor 1
|
|
chrX_+_102470003
|
6.307
|
NM_001080425
NM_001127688
|
BEX4
|
brain expressed, X-linked 4
|
|
chr6_-_168197525
|
6.288
|
|
C6orf123
|
chromosome 6 open reading frame 123
|
|
chrY_-_15591799
|
6.286
|
|
UTY
|
ubiquitously transcribed tetratricopeptide repeat gene, Y-linked
|
|
chr7_+_154002194
|
6.269
|
NM_001936
|
DPP6
|
dipeptidyl-peptidase 6
|
|
chr3_+_186560462
|
6.258
|
NM_001177800
NM_004797
|
ADIPOQ
|
adiponectin, C1Q and collagen domain containing
|
|
chr2_+_120770602
|
6.251
|
NM_001184937
NM_001184939
NM_020909
|
EPB41L5
|
erythrocyte membrane protein band 4.1 like 5
|
|
chr1_-_161279724
|
6.229
|
NM_000530
|
MPZ
|
myelin protein zero
|
|
chrX_+_48660286
|
6.220
|
|
HDAC6
|
histone deacetylase 6
|
|
chr7_-_102715171
|
6.191
|
NM_001111038
|
FBXL13
|
F-box and leucine-rich repeat protein 13
|
|
chr13_+_113622758
|
6.187
|
|
MCF2L
|
MCF.2 cell line derived transforming sequence-like
|
|
chr17_+_34958018
|
6.160
|
NM_024864
|
MRM1
|
mitochondrial rRNA methyltransferase 1 homolog (S. cerevisiae)
|
|
chr5_-_32444729
|
6.152
|
|
ZFR
|
zinc finger RNA binding protein
|
|
chr17_+_79604196
|
6.141
|
|
TSPAN10
|
tetraspanin 10
|
|
chr13_-_37494370
|
6.141
|
NM_001127217
NM_005905
|
SMAD9
|
SMAD family member 9
|
|
chr19_-_6279797
|
6.131
|
|
|
|
|
chr17_-_42992852
|
6.129
|
NM_001131019
NM_001242376
NM_002055
|
GFAP
|
glial fibrillary acidic protein
|
|
chr19_-_39390168
|
6.123
|
NM_012237
NM_001193286
NM_030593
|
SIRT2
|
sirtuin 2
|
|
chr22_+_30752612
|
6.119
|
NM_001017437
|
CCDC157
|
coiled-coil domain containing 157
|
|
chr19_+_38042275
|
6.103
|
NM_152606
|
LOC100507433
ZNF540
|
uncharacterized LOC100507433
zinc finger protein 540
|
|
chr19_+_18794487
|
6.088
|
|
CRTC1
|
CREB regulated transcription coactivator 1
|
|
chr4_-_5890142
|
6.072
|
|
CRMP1
|
collapsin response mediator protein 1
|
|
chr9_-_114361904
|
6.071
|
|
PTGR1
|
prostaglandin reductase 1
|
|
chr22_+_23229959
|
6.071
|
NM_001178126
|
IGLL5
IGLC1
|
immunoglobulin lambda-like polypeptide 5
immunoglobulin lambda constant 1 (Mcg marker)
|
|
chr10_+_104678001
|
6.069
|
NM_017649
NM_199076
NM_199077
|
CNNM2
|
cyclin M2
|
|
chr20_+_44650260
|
6.026
|
NM_001134771
|
SLC12A5
|
solute carrier family 12 (potassium/chloride transporter), member 5
|
|
chr17_-_18585571
|
5.973
|
NM_001145045
|
ZNF286B
|
zinc finger protein 286B
|
|
chr3_-_69435429
|
5.972
|
NM_015123
|
FRMD4B
|
FERM domain containing 4B
|