|
chr12_-_54689536
|
44.749
|
NM_006163
|
NFE2
|
nuclear factor (erythroid-derived 2), 45kDa
|
|
chr10_-_99531712
|
44.371
|
NM_003015
|
SFRP5
|
secreted frizzled-related protein 5
|
|
chr16_+_31539202
|
44.307
|
NM_016633
|
AHSP
|
alpha hemoglobin stabilizing protein
|
|
chr7_-_142659397
|
41.601
|
|
KEL
|
Kell blood group, metallo-endopeptidase
|
|
chr7_-_142659412
|
41.216
|
NM_000420
|
KEL
|
Kell blood group, metallo-endopeptidase
|
|
chrX_-_55057408
|
40.059
|
NM_000032
NM_001037967
NM_001037968
|
ALAS2
|
aminolevulinate, delta-, synthase 2
|
|
chr16_+_202853
|
38.754
|
NM_005332
|
HBZ
|
hemoglobin, zeta
|
|
chr1_-_158656487
|
38.278
|
NM_003126
|
SPTA1
|
spectrin, alpha, erythrocytic 1 (elliptocytosis 2)
|
|
chr19_-_13213973
|
37.907
|
NM_005583
|
LYL1
|
lymphoblastic leukemia derived sequence 1
|
|
chr8_-_86290333
|
36.257
|
NM_001128829
NM_001128830
NM_001128831
NM_001738
|
CA1
|
carbonic anhydrase I
|
|
chr22_+_23229959
|
35.716
|
NM_001178126
|
IGLL5
IGLC1
|
immunoglobulin lambda-like polypeptide 5
immunoglobulin lambda constant 1 (Mcg marker)
|
|
chr11_+_92085261
|
34.388
|
NM_001008781
|
FAT3
|
FAT tumor suppressor homolog 3 (Drosophila)
|
|
chr19_-_12997956
|
34.143
|
NM_006563
|
KLF1
|
Kruppel-like factor 1 (erythroid)
|
|
chr6_-_33168448
|
32.923
|
|
RXRB
|
retinoid X receptor, beta
|
|
chr12_-_91576579
|
31.849
|
|
DCN
|
decorin
|
|
chr6_-_49604524
|
31.695
|
NM_000324
|
RHAG
|
Rh-associated glycoprotein
|
|
chr11_-_116708334
|
31.684
|
NM_000039
|
APOA1
|
apolipoprotein A-I
|
|
chr19_-_13213513
|
30.194
|
|
LYL1
|
lymphoblastic leukemia derived sequence 1
|
|
chr15_-_43513024
|
29.633
|
|
EPB42
|
erythrocyte membrane protein band 4.2
|
|
chr2_+_102927961
|
27.902
|
NM_016232
|
IL18R1
IL1RL1
|
interleukin 18 receptor 1
interleukin 1 receptor-like 1
|
|
chr6_+_41010236
|
27.060
|
NM_001010873
NM_001159726
|
TSPO2
|
translocator protein 2
|
|
chr12_+_69742130
|
27.054
|
NM_000239
|
LYZ
|
lysozyme
|
|
chr2_-_89442551
|
26.646
|
|
IGKC
IGK@
|
immunoglobulin kappa constant
immunoglobulin kappa locus
|
|
chr1_+_22303417
|
26.233
|
NM_007352
|
CELA3A
CELA3B
|
chymotrypsin-like elastase family, member 3A
chymotrypsin-like elastase family, member 3B
|
|
chr10_+_118305427
|
26.110
|
NM_000936
|
PNLIP
|
pancreatic lipase
|
|
chr12_-_114841702
|
25.999
|
NM_080718
|
TBX5
|
T-box 5
|
|
chr11_-_5255712
|
25.534
|
NM_000519
|
HBD
|
hemoglobin, delta
|
|
chr6_-_35765056
|
25.205
|
NM_001252597
NM_001252598
NM_001832
|
CLPS
|
colipase, pancreatic
|
|
chr12_-_120765555
|
24.777
|
NM_000928
|
PLA2G1B
|
phospholipase A2, group IB (pancreas)
|
|
chr4_-_144940439
|
24.512
|
NM_002100
|
GYPB
|
glycophorin B (MNS blood group)
|
|
chr7_+_130020289
|
23.533
|
NM_001868
|
CPA1
|
carboxypeptidase A1 (pancreatic)
|
|
chr7_-_100239136
|
23.103
|
NM_003227
|
TFR2
|
transferrin receptor 2
|
|
chr19_-_55668956
|
22.278
|
NM_000363
|
TNNI3
|
troponin I type 3 (cardiac)
|
|
chr11_+_71927818
|
21.797
|
NM_000803
NM_001113534
NM_001113535
NM_001113536
|
FOLR2
|
folate receptor 2 (fetal)
|
|
chr12_-_6233684
|
21.600
|
NM_000552
|
VWF
|
von Willebrand factor
|
|
chr15_-_43513234
|
21.413
|
NM_000119
NM_001114134
|
EPB42
|
erythrocyte membrane protein band 4.2
|
|
chr1_+_22328148
|
21.049
|
NM_005747
|
CELA3A
|
chymotrypsin-like elastase family, member 3A
|
|
chr9_-_117692874
|
20.684
|
NM_001244
NM_001252290
|
TNFSF8
|
tumor necrosis factor (ligand) superfamily, member 8
|
|
chr2_+_241808161
|
20.627
|
NM_000030
|
AGXT
|
alanine-glyoxylate aminotransferase
|
|
chr22_+_23213671
|
20.608
|
|
IGLV4-3
|
immunoglobulin lambda variable 4-3
|
|
chr21_-_39870303
|
20.529
|
NM_001136155
NM_182918
|
ERG
|
v-ets erythroblastosis virus E26 oncogene homolog (avian)
|
|
chr12_-_91573264
|
20.517
|
NM_133503
|
DCN
|
decorin
|
|
chr7_+_142457318
|
20.448
|
NM_002769
|
PRSS1
PRSS2
|
protease, serine, 1 (trypsin 1)
protease, serine, 2 (trypsin 2)
|
|
chr1_+_159175048
|
20.375
|
NM_001122951
|
DARC
|
Duffy blood group, chemokine receptor
|
|
chr9_-_97356007
|
19.890
|
NM_003837
|
FBP2
|
fructose-1,6-bisphosphatase 2
|
|
chr15_-_43513196
|
19.622
|
|
EPB42
|
erythrocyte membrane protein band 4.2
|
|
chr18_+_29171729
|
19.528
|
NM_000371
|
TTR
|
transthyretin
|
|
chr19_-_13213669
|
19.451
|
|
LYL1
|
lymphoblastic leukemia derived sequence 1
|
|
chr1_-_25747276
|
18.893
|
NM_020485
NM_138616
NM_138617
NM_138618
|
RHCE
RHD
|
Rh blood group, CcEe antigens
Rh blood group, D antigen
|
|
chr1_-_42630386
|
18.423
|
NM_033553
|
GUCA2A
|
guanylate cyclase activator 2A (guanylin)
|
|
chr16_-_20338808
|
18.372
|
NM_001007240
NM_001007241
NM_001007242
NM_001502
|
GP2
|
glycoprotein 2 (zymogen granule membrane)
|
|
chr4_+_100495972
|
17.911
|
|
MTTP
|
microsomal triglyceride transfer protein
|
|
chr2_-_44065888
|
17.584
|
NM_022436
|
ABCG5
|
ATP-binding cassette, sub-family G (WHITE), member 5
|
|
chr2_-_179672056
|
17.525
|
NM_003319
NM_133378
NM_133379
NM_133432
NM_133437
|
TTN
|
titin
|
|
chr14_-_21944826
|
17.504
|
NM_001163380
|
RAB2B
|
RAB2B, member RAS oncogene family
|
|
chr1_+_206317458
|
17.379
|
NM_001910
NM_148964
|
CTSE
|
cathepsin E
|
|
chr12_-_14996381
|
17.178
|
NM_021071
|
ART4
|
ADP-ribosyltransferase 4 (Dombrock blood group)
|
|
chr11_-_57158103
|
17.029
|
NM_001243245
NM_002728
|
PRG2
|
proteoglycan 2, bone marrow (natural killer cell activator, eosinophil granule major basic protein)
|
|
chr6_-_46889620
|
16.773
|
NM_001098518
|
GPR116
|
G protein-coupled receptor 116
|
|
chr6_-_30128688
|
16.299
|
NM_006778
NM_052828
|
TRIM10
|
tripartite motif containing 10
|
|
chr19_-_55549612
|
16.074
|
NM_001083899
NM_016363
|
GP6
|
glycoprotein VI (platelet)
|
|
chr19_-_11494882
|
16.018
|
NM_000121
|
EPOR
|
erythropoietin receptor
|
|
chr19_+_36132646
|
15.625
|
NM_014209
|
ETV2
|
ets variant 2
|
|
chr1_-_114429996
|
15.544
|
|
BCL2L15
|
BCL2-like 15
|
|
chr4_-_144826659
|
15.464
|
NM_002102
NM_198682
|
GYPE
|
glycophorin E (MNS blood group)
|
|
chr14_-_94849552
|
15.431
|
|
SERPINA1
|
serpin peptidase inhibitor, clade A (alpha-1 antiproteinase, antitrypsin), member 1
|
|
chr19_+_10397642
|
15.375
|
NM_001039132
NM_001544
NM_022377
|
ICAM4
|
intercellular adhesion molecule 4 (Landsteiner-Wiener blood group)
|
|
chr1_-_149858114
|
15.107
|
NM_003528
|
HIST2H2BE
|
histone cluster 2, H2be
|
|
chr1_+_119957553
|
14.916
|
NM_001166120
|
HSD3B2
|
hydroxy-delta-5-steroid dehydrogenase, 3 beta- and steroid delta-isomerase 2
|
|
chr6_-_46047978
|
14.686
|
NM_001114086
|
CLIC5
|
chloride intracellular channel 5
|
|
chr2_-_152830448
|
14.550
|
NM_001005747
|
CACNB4
|
calcium channel, voltage-dependent, beta 4 subunit
|
|
chr1_-_93399531
|
14.497
|
|
|
|
|
chr8_-_38008332
|
14.464
|
NM_000349
|
STAR
|
steroidogenic acute regulatory protein
|
|
chr18_-_28742744
|
14.256
|
NM_004948
NM_024421
|
DSC1
|
desmocollin 1
|
|
chr3_-_167191808
|
14.217
|
NM_006217
|
SERPINI2
|
serpin peptidase inhibitor, clade I (pancpin), member 2
|
|
chr16_+_71560022
|
14.120
|
NM_005769
NM_001166395
|
CHST4
|
carbohydrate (N-acetylglucosamine 6-O) sulfotransferase 4
|
|
chr18_-_64271215
|
13.695
|
NM_021153
|
CDH19
|
cadherin 19, type 2
|
|
chr5_-_63257959
|
13.655
|
|
HTR1A
|
5-hydroxytryptamine (serotonin) receptor 1A
|
|
chr1_+_43291230
|
13.415
|
NM_018538
|
ERMAP
|
erythroblast membrane-associated protein (Scianna blood group)
|
|
chr15_+_93443418
|
13.411
|
NM_001042572
NM_001271
|
CHD2
|
chromodomain helicase DNA binding protein 2
|
|
chr6_-_52710892
|
13.358
|
NM_153699
|
GSTA5
|
glutathione S-transferase alpha 5
|
|
chr10_-_104597079
|
13.256
|
NM_000102
|
CYP17A1
|
cytochrome P450, family 17, subfamily A, polypeptide 1
|
|
chr6_-_52668599
|
13.211
|
NM_145740
|
GSTA1
|
glutathione S-transferase alpha 1
|
|
chr3_-_137851123
|
13.177
|
NM_016161
|
A4GNT
|
alpha-1,4-N-acetylglucosaminyltransferase
|
|
chr2_+_189839113
|
13.145
|
|
COL3A1
|
collagen, type III, alpha 1
|
|
chr10_-_52645384
|
13.142
|
|
A1CF
|
APOBEC1 complementation factor
|
|
chr9_+_135937364
|
13.006
|
NM_001807
|
CEL
|
carboxyl ester lipase (bile salt-stimulated lipase)
|
|
chr22_+_51176623
|
12.996
|
NM_001097
|
ACR
|
acrosin
|
|
chr4_+_151503076
|
12.837
|
NM_006439
|
MAB21L2
|
mab-21-like 2 (C. elegans)
|
|
chr22_+_22723972
|
12.582
|
|
|
|
|
chr6_-_33168438
|
12.561
|
|
RXRB
|
retinoid X receptor, beta
|
|
chr3_+_186383770
|
12.161
|
NM_000412
|
HRG
|
histidine-rich glycoprotein
|
|
chr5_-_141338626
|
12.114
|
NM_016580
|
PCDH12
|
protocadherin 12
|
|
chr6_+_31674639
|
12.097
|
NM_001003693
|
LY6G6F
|
lymphocyte antigen 6 complex, locus G6F
|
|
chr2_+_189839132
|
12.071
|
|
COL3A1
|
collagen, type III, alpha 1
|
|
chr13_-_28543290
|
12.031
|
NM_001265
|
CDX2
|
caudal type homeobox 2
|
|
chr12_-_96390002
|
11.919
|
NM_002108
|
HAL
|
histidine ammonia-lyase
|
|
chr1_-_153044083
|
11.856
|
NM_001017418
|
SPRR2B
|
small proline-rich protein 2B
|
|
chr8_-_87755880
|
11.796
|
NM_019098
|
CNGB3
|
cyclic nucleotide gated channel beta 3
|
|
chr12_-_10542616
|
11.760
|
NM_007360
|
KLRK1
|
killer cell lectin-like receptor subfamily K, member 1
|
|
chrX_+_15525430
|
11.757
|
NM_001721
|
BMX
|
BMX non-receptor tyrosine kinase
|
|
chr11_-_1036654
|
11.757
|
NM_005961
|
MUC6
|
mucin 6, oligomeric mucus/gel-forming
|
|
chr2_+_189839078
|
11.698
|
NM_000090
|
COL3A1
|
collagen, type III, alpha 1
|
|
chr19_-_51523272
|
11.563
|
NM_002776
NM_001077500
|
KLK10
|
kallikrein-related peptidase 10
|
|
chr4_-_74853819
|
11.458
|
NM_002704
|
PPBP
|
pro-platelet basic protein (chemokine (C-X-C motif) ligand 7)
|
|
chr8_-_143961232
|
11.443
|
NM_000497
NM_001026213
|
CYP11B1
|
cytochrome P450, family 11, subfamily B, polypeptide 1
|
|
chr3_-_48040260
|
11.239
|
|
MAP4
|
microtubule-associated protein 4
|
|
chr3_-_52864687
|
11.233
|
NM_001166449
NM_002218
|
ITIH4
|
inter-alpha-trypsin inhibitor heavy chain family, member 4
|
|
chr18_-_44561967
|
11.214
|
NM_016427
|
TCEB3B
|
transcription elongation factor B polypeptide 3B (elongin A2)
|
|
chr8_-_93107442
|
11.176
|
NM_001198629
NM_001198630
NM_001198632
NM_175635
|
RUNX1T1
|
runt-related transcription factor 1; translocated to, 1 (cyclin D-related)
|
|
chr2_-_208994408
|
11.068
|
NM_020989
|
CRYGC
|
crystallin, gamma C
|
|
chr10_-_13749622
|
10.986
|
|
FRMD4A
|
FERM domain containing 4A
|
|
chr17_-_47841468
|
10.972
|
|
FAM117A
|
family with sequence similarity 117, member A
|
|
chr1_-_155271186
|
10.895
|
NM_000298
|
PKLR
|
pyruvate kinase, liver and RBC
|
|
chr8_-_20040612
|
10.842
|
NM_001135691
NM_001142324
NM_001142325
NM_003053
|
SLC18A1
|
solute carrier family 18 (vesicular monoamine), member 1
|
|
chr5_-_35118223
|
10.807
|
NM_001204314
NM_001204315
NM_001204316
NM_001204317
NM_001204318
|
PRLR
|
prolactin receptor
|
|
chr17_+_3100809
|
10.690
|
NM_012352
|
OR1A2
|
olfactory receptor, family 1, subfamily A, member 2
|
|
chr14_-_107013122
|
10.627
|
|
IGHV4-31
IGHG1
|
immunoglobulin heavy variable 4-31
immunoglobulin heavy constant gamma 1 (G1m marker)
|
|
chr16_-_11375094
|
10.612
|
NM_002761
|
PRM1
|
protamine 1
|
|
chr17_-_3819692
|
10.569
|
|
P2RX1
|
purinergic receptor P2X, ligand-gated ion channel, 1
|
|
chr6_-_42690308
|
10.426
|
NM_000322
|
PRPH2
|
peripherin 2 (retinal degeneration, slow)
|
|
chr9_+_33240165
|
10.422
|
NM_014471
|
SPINK4
|
serine peptidase inhibitor, Kazal type 4
|
|
chr8_+_70378858
|
10.393
|
NM_001128204
NM_015170
|
SULF1
|
sulfatase 1
|
|
chr5_-_135290521
|
10.393
|
NM_002302
|
LECT2
|
leukocyte cell-derived chemotaxin 2
|
|
chr4_-_120243257
|
10.342
|
NM_000134
|
FABP2
|
fatty acid binding protein 2, intestinal
|
|
chr12_+_53818864
|
10.332
|
|
AMHR2
|
anti-Mullerian hormone receptor, type II
|
|
chr2_+_220378891
|
10.299
|
NM_018674
NM_182847
|
ACCN4
|
amiloride-sensitive cation channel 4, pituitary
|
|
chr19_-_40919270
|
10.229
|
NM_020956
NM_181882
|
PRX
|
periaxin
|
|
chr6_-_49712055
|
10.143
|
NM_001190986
NM_006061
|
CRISP3
|
cysteine-rich secretory protein 3
|
|
chr10_-_52645430
|
9.860
|
NM_001198818
NM_001198819
NM_001198820
NM_014576
NM_138932
NM_138933
|
A1CF
|
APOBEC1 complementation factor
|
|
chr11_-_47374221
|
9.858
|
NM_000256
|
MYBPC3
|
myosin binding protein C, cardiac
|
|
chr17_-_62084282
|
9.828
|
NM_000873
|
ICAM2
|
intercellular adhesion molecule 2
|
|
chr11_-_125550674
|
9.821
|
NM_001612
NM_020069
NM_020107
NM_020108
|
ACRV1
|
acrosomal vesicle protein 1
|
|
chr9_-_21142143
|
9.811
|
NM_002177
|
IFNW1
|
interferon, omega 1
|
|
chr10_+_7745354
|
9.656
|
|
ITIH2
|
inter-alpha-trypsin inhibitor heavy chain 2
|
|
chr1_+_171217632
|
9.654
|
NM_002021
|
FMO1
|
flavin containing monooxygenase 1
|
|
chr8_+_105352050
|
9.539
|
NM_030788
|
TM7SF4
|
transmembrane 7 superfamily member 4
|
|
chr7_-_99332715
|
9.528
|
NM_000765
|
CYP3A7
CYP3A5
|
cytochrome P450, family 3, subfamily A, polypeptide 7
cytochrome P450, family 3, subfamily A, polypeptide 5
|
|
chr17_-_2966900
|
9.445
|
NM_014566
|
OR1D5
|
olfactory receptor, family 1, subfamily D, member 5
|
|
chr12_-_10562744
|
9.434
|
NM_001199805
|
KLRC4-KLRK1
|
KLRC4-KLRK1 readthrough
|
|
chr8_-_145701717
|
9.382
|
NM_003923
|
FOXH1
|
forkhead box H1
|
|
chr20_+_43935490
|
9.151
|
NM_014276
|
RBPJL
|
recombination signal binding protein for immunoglobulin kappa J region-like
|
|
chr5_-_160112266
|
9.102
|
|
ATP10B
|
ATPase, class V, type 10B
|
|
chr17_-_64225496
|
9.056
|
NM_000042
|
APOH
|
apolipoprotein H (beta-2-glycoprotein I)
|
|
chr5_+_155754172
|
9.041
|
|
SGCD
|
sarcoglycan, delta (35kDa dystrophin-associated glycoprotein)
|
|
chr2_-_219850273
|
8.937
|
NM_017521
|
FEV
|
FEV (ETS oncogene family)
|
|
chr6_+_160327972
|
8.903
|
NM_002377
|
MAS1
|
MAS1 oncogene
|
|
chr22_+_22735134
|
8.870
|
|
CYAT1
|
immunoglobulin lambda light chain-like
|
|
chr3_-_187009469
|
8.848
|
NM_001031849
NM_001879
NM_139125
|
MASP1
|
mannan-binding lectin serine peptidase 1 (C4/C2 activating component of Ra-reactive factor)
|
|
chr9_-_95244634
|
8.831
|
|
ASPN
|
asporin
|
|
chr10_+_7745284
|
8.831
|
|
ITIH2
|
inter-alpha-trypsin inhibitor heavy chain 2
|
|
chr3_+_88188261
|
8.798
|
NM_018293
|
ZNF654
|
zinc finger protein 654
|
|
chr14_+_88852065
|
8.786
|
|
SPATA7
|
spermatogenesis associated 7
|
|
chr18_+_43304143
|
8.774
|
|
SLC14A1
|
solute carrier family 14 (urea transporter), member 1 (Kidd blood group)
|
|
chr9_+_33795558
|
8.764
|
NM_002771
|
PRSS3
|
protease, serine, 3
|
|
chr10_+_7745229
|
8.729
|
NM_002216
|
ITIH2
|
inter-alpha-trypsin inhibitor heavy chain 2
|
|
chr10_+_98064084
|
8.679
|
NM_001017520
NM_004088
|
DNTT
|
deoxynucleotidyltransferase, terminal
|
|
chr8_+_124194751
|
8.557
|
NM_032899
NM_207006
|
FAM83A
|
family with sequence similarity 83, member A
|
|
chr5_-_154230212
|
8.483
|
NM_032385
|
C5orf4
|
chromosome 5 open reading frame 4
|
|
chr14_-_21270537
|
8.470
|
NM_198232
|
RNASE1
|
ribonuclease, RNase A family, 1 (pancreatic)
|
|
chr4_+_120056938
|
8.465
|
NM_016599
|
MYOZ2
|
myozenin 2
|
|
chr3_-_50649110
|
8.410
|
NM_013324
NM_145071
|
CISH
|
cytokine inducible SH2-containing protein
|
|
chr17_+_8213555
|
8.395
|
NM_173728
|
ARHGEF15
|
Rho guanine nucleotide exchange factor (GEF) 15
|
|
chr2_+_138721807
|
8.386
|
NM_001024074
NM_001024075
NM_006895
|
HNMT
|
histamine N-methyltransferase
|
|
chr9_+_125137600
|
8.374
|
|
PTGS1
|
prostaglandin-endoperoxide synthase 1 (prostaglandin G/H synthase and cyclooxygenase)
|
|
chr11_-_128712340
|
8.241
|
NM_000220
|
KCNJ1
|
potassium inwardly-rectifying channel, subfamily J, member 1
|
|
chr17_+_38171613
|
8.212
|
NM_000759
NM_001178147
NM_172219
NM_172220
|
CSF3
|
colony stimulating factor 3 (granulocyte)
|
|
chr13_-_30881141
|
8.157
|
NM_001014380
|
KATNAL1
|
katanin p60 subunit A-like 1
|
|
chr9_-_95244750
|
8.134
|
NM_001193335
NM_017680
|
ASPN
|
asporin
|
|
chr12_-_13248581
|
8.109
|
NM_001206843
NM_001206845
NM_031289
NM_153823
|
GSG1
|
germ cell associated 1
|
|
chr2_-_206950895
|
8.097
|
NM_017759
|
INO80D
|
INO80 complex subunit D
|
|
chr8_-_93107643
|
8.089
|
|
RUNX1T1
|
runt-related transcription factor 1; translocated to, 1 (cyclin D-related)
|
|
chr4_-_159094163
|
8.074
|
NM_001031700
NM_001128424
|
FAM198B
|
family with sequence similarity 198, member B
|
|
chr22_-_42526877
|
8.062
|
NM_000106
NM_001025161
|
CYP2D6
|
cytochrome P450, family 2, subfamily D, polypeptide 6
|
|
chr1_+_17248425
|
8.052
|
NM_014675
|
CROCC
|
ciliary rootlet coiled-coil, rootletin
|
|
chr9_+_125796845
|
8.009
|
NM_005294
|
GPR21
|
G protein-coupled receptor 21
|
|
chr1_+_199996729
|
7.972
|
NM_003822
NM_205860
|
NR5A2
|
nuclear receptor subfamily 5, group A, member 2
|
|
chr15_+_74466171
|
7.962
|
|
ISLR
|
immunoglobulin superfamily containing leucine-rich repeat
|
|
chr4_-_70626429
|
7.927
|
NM_014465
|
SULT1B1
|
sulfotransferase family, cytosolic, 1B, member 1
|
|
chr19_-_48389571
|
7.915
|
NM_003167
|
SULT2A1
|
sulfotransferase family, cytosolic, 2A, dehydroepiandrosterone (DHEA)-preferring, member 1
|
|
chr4_+_78432905
|
7.879
|
NM_006419
|
CXCL13
|
chemokine (C-X-C motif) ligand 13
|
|
chrX_+_38211735
|
7.840
|
NM_000531
|
OTC
|
ornithine carbamoyltransferase
|
|
chr22_+_22550159
|
7.835
|
|
IGLV6-57
|
immunoglobulin lambda variable 6-57
|
|
chr5_+_143191725
|
7.810
|
NM_021182
|
HMHB1
|
histocompatibility (minor) HB-1
|
|
chr11_-_57148602
|
7.803
|
NM_006093
|
PRG3
|
proteoglycan 3
|
|
chr3_-_15563160
|
7.774
|
NM_005677
NM_080539
|
COLQ
|
collagen-like tail subunit (single strand of homotrimer) of asymmetric acetylcholinesterase
|
|
chr18_+_19749403
|
7.772
|
NM_005257
|
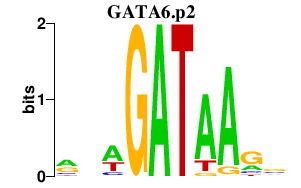
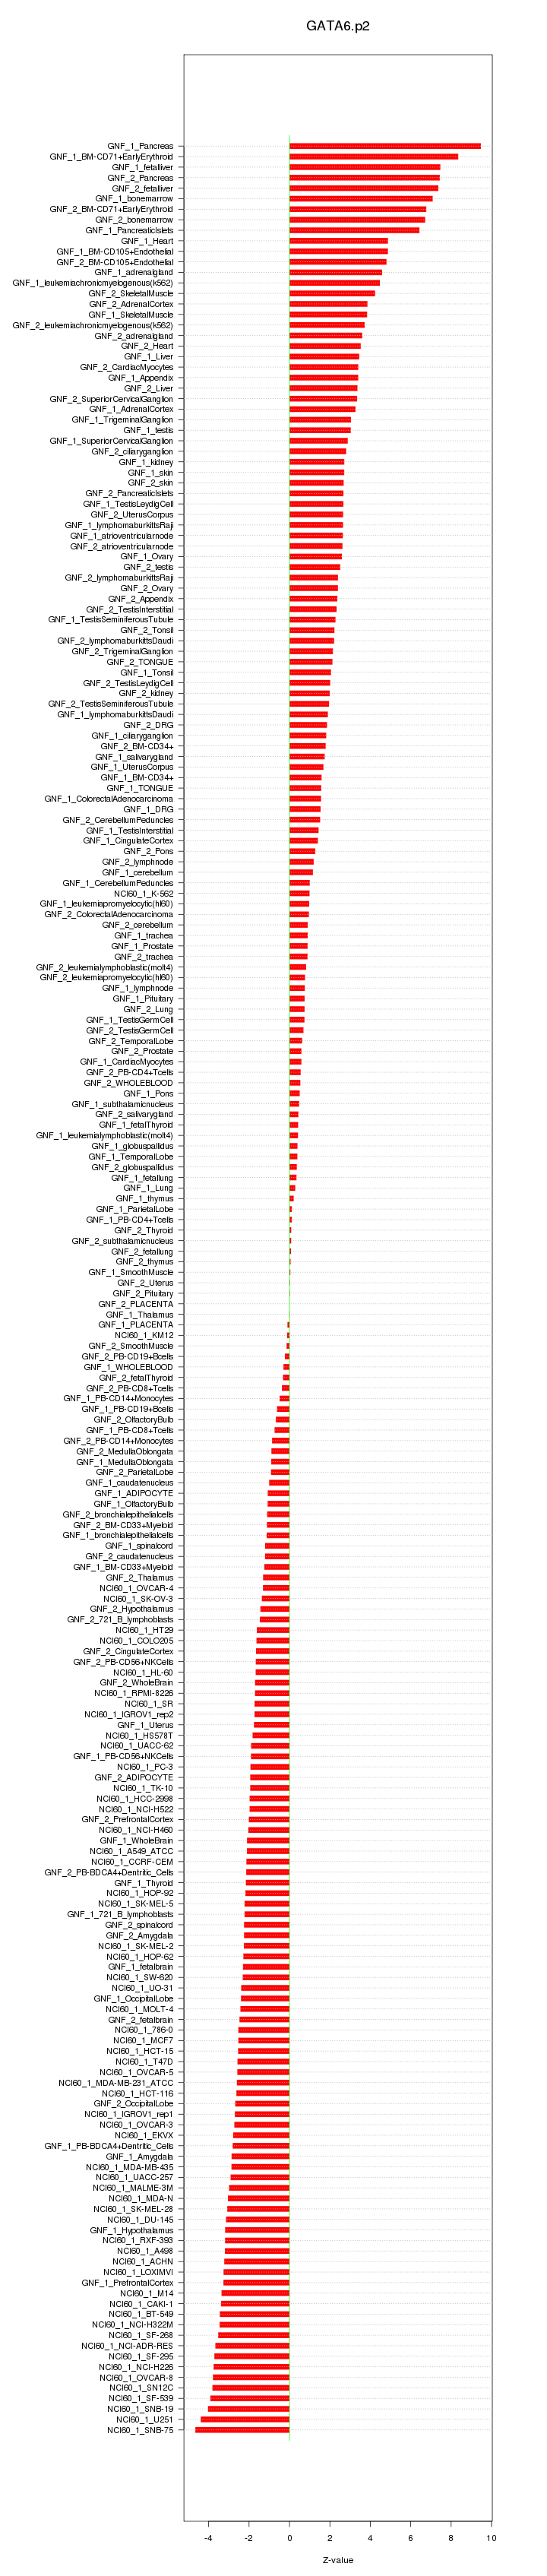
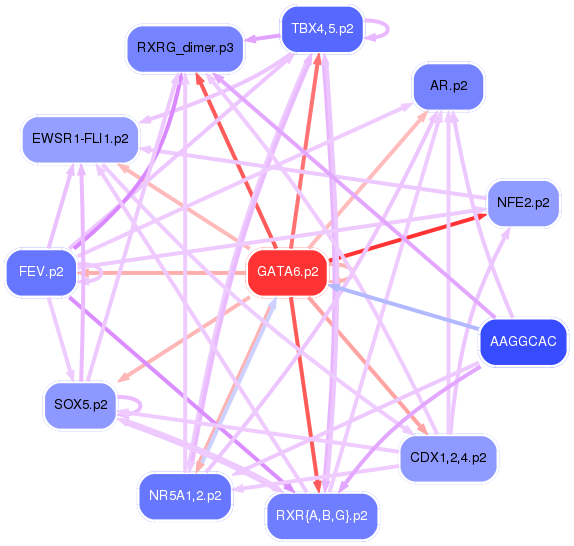
GATA6
|
GATA binding protein 6
|
|
chr2_+_169757749
|
7.749
|
NM_001081686
NM_021176
|
G6PC2
|
glucose-6-phosphatase, catalytic, 2
|
|
chrX_-_45060081
|
7.676
|
NM_024689
NM_176819
|
CXorf36
|
chromosome X open reading frame 36
|
|
chrX_+_99839789
|
7.650
|
NM_022144
|
TNMD
|
tenomodulin
|
|
chr3_-_101039403
|
7.618
|
NM_016247
|
IMPG2
|
interphotoreceptor matrix proteoglycan 2
|
|
chr8_-_93075190
|
7.486
|
NM_004349
|
RUNX1T1
|
runt-related transcription factor 1; translocated to, 1 (cyclin D-related)
|
|
chr12_-_6055397
|
7.464
|
NM_020373
|
ANO2
|
anoctamin 2
|
|
chr1_-_116311330
|
7.462
|
|
CASQ2
|
calsequestrin 2 (cardiac muscle)
|
|
chr8_-_41655139
|
7.447
|
NM_000037
NM_020475
NM_020476
NM_020477
|
ANK1
|
ankyrin 1, erythrocytic
|
|
chr19_-_48389514
|
7.382
|
|
SULT2A1
|
sulfotransferase family, cytosolic, 2A, dehydroepiandrosterone (DHEA)-preferring, member 1
|
|
chr19_-_48547180
|
7.337
|
NM_019855
|
CABP5
|
calcium binding protein 5
|
|
chr3_-_57234279
|
7.193
|
NM_003865
|
HESX1
|
HESX homeobox 1
|
|
chrX_-_78623006
|
7.183
|
NM_001171581
NM_004867
|
ITM2A
|
integral membrane protein 2A
|
|
chr1_-_11907741
|
7.154
|
NM_006172
|
NPPA
|
natriuretic peptide A
|
