|
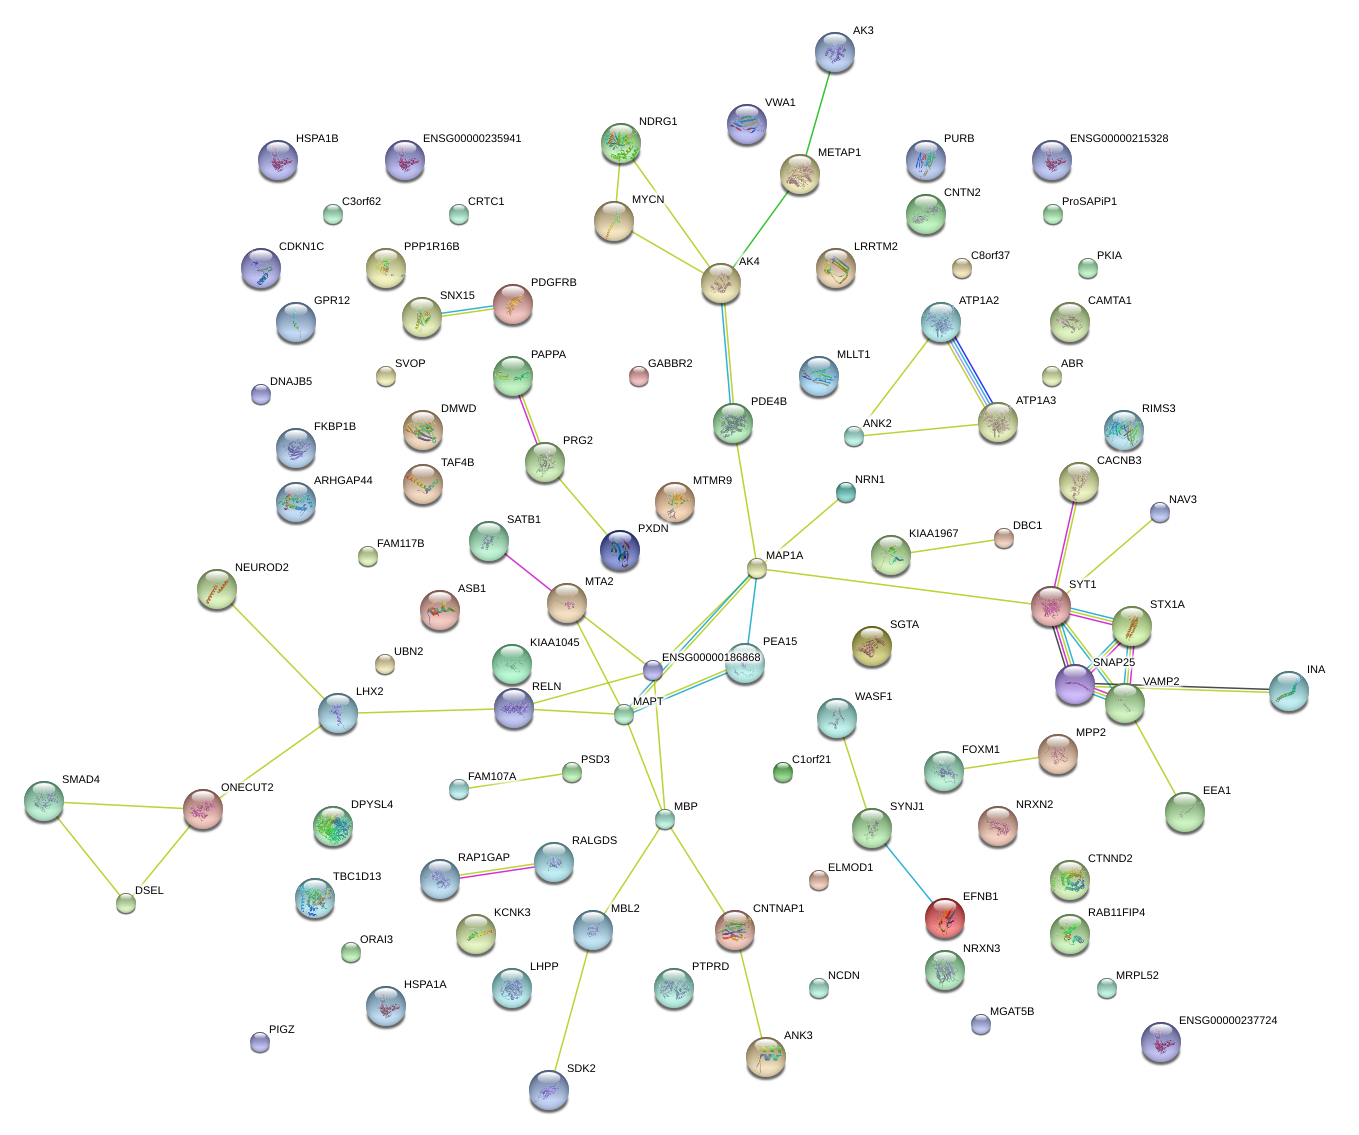
chr12_+_79257772
|
68.498
|
NM_001135805
|
SYT1
|
synaptotagmin I
|
|
chr12_+_79439432
|
62.348
|
NM_001135806
|
SYT1
|
synaptotagmin I
|
|
chr12_+_79258448
|
59.261
|
NM_005639
|
SYT1
|
synaptotagmin I
|
|
chr18_-_74729049
|
56.855
|
NM_001025081
NM_001025090
NM_001025092
NM_002385
|
MBP
|
myelin basic protein
|
|
chr10_+_105036783
|
51.361
|
NM_032727
|
INA
|
internexin neuronal intermediate filament protein, alpha
|
|
chr17_-_8066254
|
46.928
|
NM_014232
|
VAMP2
|
vesicle-associated membrane protein 2 (synaptobrevin 2)
|
|
chr20_+_10199455
|
39.828
|
NM_003081
NM_130811
|
SNAP25
|
synaptosomal-associated protein, 25kDa
|
|
chr3_-_58563490
|
38.723
|
NM_001076778
NM_007177
|
FAM107A
|
family with sequence similarity 107, member A
|
|
chr6_-_6007632
|
38.298
|
NM_016588
|
NRN1
|
neuritin 1
|
|
chr2_+_203499819
|
34.908
|
NM_173511
|
FAM117B
|
family with sequence similarity 117, member B
|
|
chr5_-_11903964
|
34.307
|
NM_001332
|
CTNND2
|
catenin (cadherin-associated protein), delta 2 (neural plakophilin-related arm-repeat protein)
|
|
chr10_-_62149487
|
33.394
|
NM_020987
|
ANK3
|
ankyrin 3, node of Ranvier (ankyrin G)
|
|
chr10_+_126150340
|
32.742
|
NM_001167880
NM_022126
|
LHPP
|
phospholysine phosphohistidine inorganic pyrophosphate phosphatase
|
|
chr17_+_40834571
|
32.021
|
NM_003632
|
CNTNAP1
|
contactin associated protein 1
|
|
chr14_+_23299083
|
31.598
|
NM_178336
NM_180982
NM_181304
NM_181305
NM_181306
NM_181307
|
MRPL52
|
mitochondrial ribosomal protein L52
|
|
chr20_+_37434294
|
30.597
|
NM_001172735
NM_015568
|
PPP1R16B
|
protein phosphatase 1, regulatory subunit 16B
|
|
chr10_-_62493282
|
30.519
|
NM_001204403
|
ANK3
|
ankyrin 3, node of Ranvier (ankyrin G)
|
|
chr7_-_73133917
|
30.477
|
NM_001165903
NM_004603
|
STX1A
|
syntaxin 1A (brain)
|
|
chr17_-_37764165
|
30.105
|
NM_006160
|
NEUROD2
|
neurogenic differentiation 2
|
|
chr17_+_43971655
|
29.876
|
NM_001123066
NM_001123067
NM_001203251
NM_001203252
NM_005910
NM_016834
NM_016835
NM_016841
|
MAPT
|
microtubule-associated protein tau
|
|
chr4_+_113739203
|
28.959
|
NM_001127493
|
ANK2
|
ankyrin 2, neuronal
|
|
chr9_-_101470836
|
28.550
|
NM_005458
|
GABBR2
|
gamma-aminobutyric acid (GABA) B receptor, 2
|
|
chr8_+_11141983
|
28.167
|
NM_015458
|
MTMR9
|
myotubularin related protein 9
|
|
chr11_-_64490654
|
27.993
|
NM_015080
NM_138732
|
NRXN2
|
neurexin 2
|
|
chr15_+_43809805
|
27.439
|
NM_002373
|
MAP1A
|
microtubule-associated protein 1A
|
|
chr3_-_18480203
|
27.427
|
NM_001131010
|
SATB1
|
SATB homeobox 1
|
|
chr5_-_138211054
|
27.281
|
NM_015564
|
LRRTM2
|
leucine rich repeat transmembrane neuronal 2
|
|
chr1_-_21995793
|
25.824
|
NM_001145657
NM_002885
|
RAP1GAP
|
RAP1 GTPase activating protein
|
|
chr9_-_122131579
|
24.980
|
NM_014618
|
DBC1
|
deleted in bladder cancer 1
|
|
chr3_-_18466759
|
24.467
|
NM_001195470
NM_002971
|
SATB1
|
SATB homeobox 1
|
|
chr9_+_34958171
|
24.449
|
NM_015297
|
KIAA1045
|
KIAA1045
|
|
chr9_-_135996287
|
24.128
|
NM_006266
|
RALGDS
|
ral guanine nucleotide dissociation stimulator
|
|
chr8_+_79428335
|
23.707
|
NM_006823
NM_181839
|
PKIA
|
protein kinase (cAMP-dependent, catalytic) inhibitor alpha
|
|
chr1_+_160085519
|
23.271
|
NM_000702
|
ATP1A2
|
ATPase, Na+/K+ transporting, alpha 2 polypeptide
|
|
chr10_-_62332666
|
23.202
|
NM_001204404
|
ANK3
|
ankyrin 3, node of Ranvier (ankyrin G)
|
|
chr20_-_3149070
|
22.310
|
NM_014731
|
ProSAPiP1
|
ProSAPiP1 protein
|
|
chr1_-_21978287
|
21.912
|
NM_001145658
|
RAP1GAP
|
RAP1 GTPase activating protein
|
|
chr6_-_110501164
|
21.779
|
NM_001024934
NM_001024935
NM_001024936
NM_003931
|
WASF1
|
WAS protein family, member 1
|
|
chr2_+_26915390
|
21.687
|
NM_002246
|
KCNK3
|
potassium channel, subfamily K, member 3
|
|
chr19_-_46295785
|
21.196
|
NM_004943
|
DMWD
|
dystrophia myotonica, WD repeat containing
|
|
chr9_-_4741267
|
21.017
|
NM_001199852
NM_016282
|
AK3
|
adenylate kinase 3
|
|
chr17_+_12692779
|
20.946
|
NM_014859
|
ARHGAP44
|
Rho GTPase activating protein 44
|
|
chr2_+_24272583
|
20.846
|
NM_004116
NM_054033
|
FKBP1B
|
FK506 binding protein 1B, 12.6 kDa
|
|
chr17_-_1012257
|
20.517
|
NM_001092
|
ABR
|
active BCR-related gene
|
|
chr3_-_49314281
|
20.214
|
NM_198562
|
C3orf62
|
chromosome 3 open reading frame 62
|
|
chr5_-_149535420
|
20.029
|
NM_002609
|
PDGFRB
|
platelet-derived growth factor receptor, beta polypeptide
|
|
chr1_+_160175114
|
20.001
|
NM_003768
|
PEA15
|
phosphoprotein enriched in astrocytes 15
|
|
chr21_-_34100316
|
19.948
|
NM_003895
NM_203446
|
SYNJ1
|
synaptojanin 1
|
|
chr4_+_113970784
|
19.899
|
NM_001148
NM_020977
|
ANK2
|
ankyrin 2, neuronal
|
|
chr12_+_78225068
|
19.609
|
NM_014903
|
NAV3
|
neuron navigator 3
|
|
chr1_+_6845381
|
19.540
|
NM_001195563
NM_001242701
NM_015215
|
CAMTA1
|
calmodulin binding transcription activator 1
|
|
chr17_-_41985112
|
19.395
|
NM_005374
|
MPP2
|
membrane protein, palmitoylated 2 (MAGUK p55 subfamily member 2)
|
|
chr2_+_16080639
|
19.151
|
NM_005378
|
MYCN
|
v-myc myelocytomatosis viral related oncogene, neuroblastoma derived (avian)
|
|
chr9_-_4741798
|
19.117
|
NM_001199855
|
AK3
|
adenylate kinase 3
|
|
chr13_-_27334777
|
19.075
|
NM_005288
|
GPR12
|
G protein-coupled receptor 12
|
|
chr19_+_18794391
|
19.052
|
NM_001098482
NM_015321
|
CRTC1
|
CREB regulated transcription coactivator 1
|
|
chr9_-_136024522
|
18.968
|
NM_001042368
|
RALGDS
|
ral guanine nucleotide dissociation stimulator
|
|
chr11_-_64410785
|
18.802
|
NM_138734
|
NRXN2
|
neurexin 2
|
|
chr19_-_2783332
|
18.593
|
NM_003021
|
SGTA
|
small glutamine-rich tetratricopeptide repeat (TPR)-containing, alpha
|
|
chr9_-_4726226
|
18.559
|
NM_001199856
|
AK3
|
adenylate kinase 3
|
|
chr6_+_31795395
|
18.361
|
NM_005346
|
HSPA1A
HSPA1B
|
heat shock 70kDa protein 1A
heat shock 70kDa protein 1B
|
|
chr11_-_2906960
|
18.109
|
NM_000076
NM_001122630
NM_001122631
|
CDKN1C
|
cyclin-dependent kinase inhibitor 1C (p57, Kip2)
|
|
chr21_-_34100228
|
18.088
|
NM_001160302
NM_001160306
|
SYNJ1
|
synaptojanin 1
|
|
chr8_-_134309448
|
18.056
|
NM_001135242
NM_006096
|
NDRG1
|
N-myc downstream regulated 1
|
|
chr9_-_10612722
|
17.665
|
NM_002839
|
PTPRD
|
protein tyrosine phosphatase, receptor type, D
|
|
chr1_+_205012329
|
17.598
|
NM_005076
|
CNTN2
|
contactin 2 (axonal)
|
|
chr18_+_23806385
|
17.584
|
NM_005640
|
TAF4B
|
TAF4b RNA polymerase II, TATA box binding protein (TBP)-associated factor, 105kDa
|
|
chr11_+_107461807
|
17.544
|
NM_001130037
NM_018712
|
ELMOD1
|
ELMO/CED-12 domain containing 1
|
|
chr9_+_126773851
|
17.523
|
NM_004789
|
LHX2
|
LIM homeobox 2
|
|
chr9_-_4741085
|
17.466
|
NM_001199854
|
AK3
|
adenylate kinase 3
|
|
chr7_+_138916230
|
17.309
|
NM_173569
|
UBN2
|
ubinuclein 2
|
|
chr18_+_55102777
|
17.072
|
NM_004852
|
ONECUT2
|
one cut homeobox 2
|
|
chr11_-_62369250
|
16.919
|
NM_004739
|
MTA2
|
metastasis associated 1 family, member 2
|
|
chr19_-_6279927
|
16.754
|
NM_005934
|
MLLT1
|
myeloid/lymphoid or mixed-lineage leukemia (trithorax homolog, Drosophila); translocated to, 1
|
|
chr2_+_239335567
|
16.691
|
NM_001040445
|
ASB1
|
ankyrin repeat and SOCS box containing 1
|
|
chr10_-_61900659
|
16.636
|
NM_001149
|
ANK3
|
ankyrin 3, node of Ranvier (ankyrin G)
|
|
chr11_+_64794879
|
16.530
|
NM_013306
NM_147777
|
SNX15
|
sorting nexin 15
|
|
chr18_-_65183922
|
16.355
|
NM_032160
|
DSEL
|
dermatan sulfate epimerase-like
|
|
chr7_-_103629962
|
16.128
|
NM_005045
NM_173054
|
RELN
|
reelin
|
|
chr1_-_41131323
|
16.112
|
NM_014747
|
RIMS3
|
regulating synaptic membrane exocytosis 3
|
|
chr9_+_131549509
|
15.523
|
NM_018201
|
TBC1D13
|
TBC1 domain family, member 13
|
|
chr3_-_196695608
|
15.452
|
NM_025163
|
PIGZ
|
phosphatidylinositol glycan anchor biosynthesis, class Z
|
|
chr1_+_1370902
|
15.329
|
NM_022834
NM_199121
|
VWA1
|
von Willebrand factor A domain containing 1
|
|
chr17_+_29718641
|
15.310
|
NM_032932
|
RAB11FIP4
|
RAB11 family interacting protein 4 (class II)
|
|
chr8_-_18871163
|
15.286
|
NM_015310
|
PSD3
|
pleckstrin and Sec7 domain containing 3
|
|
chr12_-_109458844
|
15.241
|
NM_018711
|
SVOP
|
SV2 related protein homolog (rat)
|
|
chrX_+_68048792
|
15.113
|
NM_004429
|
EFNB1
|
ephrin-B1
|
|
chr8_-_96281399
|
15.056
|
NM_177965
|
C8orf37
|
chromosome 8 open reading frame 37
|
|
chr1_+_66258855
|
15.004
|
NM_002600
|
PDE4B
|
phosphodiesterase 4B, cAMP-specific
|
|
chr7_-_44924946
|
14.945
|
NM_033224
|
PURB
|
purine-rich element binding protein B
|
|
chr10_+_134000335
|
14.841
|
NM_006426
|
DPYSL4
|
dihydropyrimidinase-like 4
|
|
chr16_+_30960377
|
14.801
|
NM_152288
|
ORAI3
|
ORAI calcium release-activated calcium modulator 3
|
|
chr17_-_71640226
|
14.676
|
NM_001144952
|
SDK2
|
sidekick cell adhesion molecule 2
|
|
chr12_+_49208214
|
14.606
|
NM_001206917
|
CACNB3
|
calcium channel, voltage-dependent, beta 3 subunit
|
|
chr1_+_184356128
|
14.601
|
NM_030806
|
C1orf21
|
chromosome 1 open reading frame 21
|
|
chr18_+_48556483
|
14.547
|
NM_005359
|
SMAD4
|
SMAD family member 4
|
|
chr12_-_93323088
|
14.519
|
NM_003566
|
EEA1
|
early endosome antigen 1
|
|
chr1_+_36023389
|
14.450
|
NM_001014839
NM_001014841
NM_014284
|
NCDN
|
neurochondrin
|
|
chr9_-_4742042
|
14.411
|
NM_001199853
|
AK3
|
adenylate kinase 3
|
|
chr17_+_74864427
|
14.298
|
NM_001199172
NM_144677
|
MGAT5B
|
mannosyl (alpha-1,6-)-glycoprotein beta-1,6-N-acetyl-glucosaminyltransferase, isozyme B
|
|
chr11_+_46368881
|
14.246
|
NM_001199266
NM_001199267
NM_001199268
NM_003646
|
DGKZ
|
diacylglycerol kinase, zeta
|
|
chr3_+_39851028
|
14.200
|
NM_015460
|
MYRIP
|
myosin VIIA and Rab interacting protein
|
|
chr8_+_42752019
|
14.148
|
NM_032410
|
HOOK3
|
hook homolog 3 (Drosophila)
|
|
chr11_-_46722115
|
13.843
|
NM_004308
|
ARHGAP1
|
Rho GTPase activating protein 1
|
|
chr20_+_42875905
|
13.815
|
NM_024034
|
GDAP1L1
|
ganglioside-induced differentiation-associated protein 1-like 1
|
|
chr7_-_143059696
|
13.797
|
NM_001031690
|
FAM131B
|
family with sequence similarity 131, member B
|
|
chr19_+_57862633
|
13.729
|
NM_020657
|
ZNF304
|
zinc finger protein 304
|
|
chrX_+_152990322
|
13.675
|
NM_000033
|
ABCD1
|
ATP-binding cassette, sub-family D (ALD), member 1
|
|
chr10_-_30348433
|
13.673
|
NM_020848
|
KIAA1462
|
KIAA1462
|
|
chr1_+_66258192
|
13.635
|
NM_001037341
|
PDE4B
|
phosphodiesterase 4B, cAMP-specific
|
|
chr1_+_155829259
|
13.625
|
NM_152280
|
SYT11
|
synaptotagmin XI
|
|
chr1_+_162332772
|
13.536
|
NM_001126060
|
NOS1AP
|
nitric oxide synthase 1 (neuronal) adaptor protein
|
|
chr7_-_143059144
|
13.448
|
NM_014690
|
FAM131B
|
family with sequence similarity 131, member B
|
|
chr11_-_9025531
|
13.434
|
NM_020645
|
NRIP3
|
nuclear receptor interacting protein 3
|
|
chr2_-_222436996
|
13.328
|
NM_004438
|
EPHA4
|
EPH receptor A4
|
|
chr22_+_35695792
|
13.169
|
NM_001135730
NM_001135732
NM_005488
|
TOM1
|
target of myb1 (chicken)
|
|
chr18_-_57026465
|
13.017
|
NM_005570
|
LMAN1
|
lectin, mannose-binding, 1
|
|
chr3_+_50712671
|
13.000
|
NM_004947
|
DOCK3
|
dedicator of cytokinesis 3
|
|
chr11_+_46354454
|
12.890
|
NM_201532
|
DGKZ
|
diacylglycerol kinase, zeta
|
|
chr12_+_49209300
|
12.779
|
NM_001206916
|
CACNB3
|
calcium channel, voltage-dependent, beta 3 subunit
|
|
chr10_+_95517565
|
12.758
|
NM_005097
|
LGI1
|
leucine-rich, glioma inactivated 1
|
|
chr7_-_137531585
|
12.677
|
NM_004717
|
DGKI
|
diacylglycerol kinase, iota
|
|
chr12_+_62860531
|
12.390
|
NM_015026
|
MON2
|
MON2 homolog (S. cerevisiae)
|
|
chr9_-_131534186
|
12.280
|
NM_006336
|
ZER1
|
zer-1 homolog (C. elegans)
|
|
chr8_-_18666295
|
12.276
|
NM_206909
|
PSD3
|
pleckstrin and Sec7 domain containing 3
|
|
chr3_-_57113292
|
12.266
|
NM_001128615
|
ARHGEF3
|
Rho guanine nucleotide exchange factor (GEF) 3
|
|
chr1_+_162039469
|
12.235
|
NM_001164757
NM_014697
|
NOS1AP
|
nitric oxide synthase 1 (neuronal) adaptor protein
|
|
chr17_-_1090562
|
12.126
|
NM_001159746
|
ABR
|
active BCR-related gene
|
|
chr11_+_66025070
|
11.881
|
NM_001134776
NM_001134774
NM_022822
|
KLC2
|
kinesin light chain 2
|
|
chr17_-_31620005
|
11.671
|
NM_183377
|
ACCN1
|
amiloride-sensitive cation channel 1, neuronal
|
|
chr1_+_53192021
|
11.653
|
NM_024646
|
ZYG11B
|
zyg-11 homolog B (C. elegans)
|
|
chr1_+_66797775
|
11.630
|
NM_001037339
|
PDE4B
|
phosphodiesterase 4B, cAMP-specific
|
|
chr12_+_113229548
|
11.616
|
NM_001143854
NM_014954
|
RPH3A
|
rabphilin 3A homolog (mouse)
|
|
chr6_+_96463844
|
11.612
|
NM_006581
|
FUT9
|
fucosyltransferase 9 (alpha (1,3) fucosyltransferase)
|
|
chr16_-_4588379
|
11.568
|
NM_001199054
|
C16orf5
|
chromosome 16 open reading frame 5
|
|
chr1_+_226736500
|
11.479
|
NM_001003665
|
C1orf95
|
chromosome 1 open reading frame 95
|
|
chr2_+_166150340
|
11.470
|
NM_021007
|
SCN2A
|
sodium channel, voltage-gated, type II, alpha subunit
|
|
chr2_-_166930130
|
11.449
|
NM_001165963
NM_001165964
NM_006920
|
SCN1A
|
sodium channel, voltage-gated, type I, alpha subunit
|
|
chr2_+_45169036
|
11.448
|
NM_005413
|
SIX3
|
SIX homeobox 3
|
|
chr12_-_58135853
|
11.308
|
NM_014770
|
AGAP2
|
ArfGAP with GTPase domain, ankyrin repeat and PH domain 2
|
|
chr7_+_128864740
|
11.283
|
NM_001130720
NM_015328
|
AHCYL2
|
adenosylhomocysteinase-like 2
|
|
chr14_+_29236171
|
11.217
|
NM_005249
|
FOXG1
|
forkhead box G1
|
|
chr4_-_109087876
|
11.199
|
NM_001166119
|
LEF1
|
lymphoid enhancer-binding factor 1
|
|
chr1_-_151688791
|
11.148
|
NM_001172648
NM_001172649
|
CELF3
|
CUGBP, Elav-like family member 3
|
|
chr17_-_78450247
|
11.124
|
NM_002522
|
NPTX1
|
neuronal pentraxin I
|
|
chr17_-_6544246
|
11.107
|
NM_014804
|
KIAA0753
|
KIAA0753
|
|
chr2_-_157189040
|
11.065
|
NM_006186
|
NR4A2
|
nuclear receptor subfamily 4, group A, member 2
|
|
chr16_+_56225250
|
11.040
|
NM_020988
NM_138736
|
GNAO1
|
guanine nucleotide binding protein (G protein), alpha activating activity polypeptide O
|
|
chr16_-_4588738
|
10.958
|
NM_001199055
NM_001199056
NM_013399
|
C16orf5
|
chromosome 16 open reading frame 5
|
|
chr1_+_3569098
|
10.940
|
NM_001204184
NM_001204185
NM_001204186
NM_001204187
NM_001204188
NM_005427
|
TP73
|
tumor protein p73
|
|
chr3_-_128879873
|
10.932
|
NM_001204890
NM_001199469
NM_020701
|
ISY1-RAB43
ISY1
|
ISY1-RAB43 readthrough
ISY1 splicing factor homolog (S. cerevisiae)
|
|
chr2_-_201936389
|
10.851
|
NM_173822
|
FAM126B
|
family with sequence similarity 126, member B
|
|
chr11_+_66024746
|
10.842
|
NM_001134775
|
KLC2
|
kinesin light chain 2
|
|
chr17_-_32483550
|
10.757
|
NM_001094
|
ACCN1
|
amiloride-sensitive cation channel 1, neuronal
|
|
chr19_-_36523540
|
10.639
|
NM_001199570
|
CLIP3
|
CAP-GLY domain containing linker protein 3
|
|
chr17_-_16472463
|
10.601
|
NM_020653
|
ZNF287
|
zinc finger protein 287
|
|
chr11_-_134281725
|
10.555
|
NM_018644
NM_054025
|
B3GAT1
|
beta-1,3-glucuronyltransferase 1 (glucuronosyltransferase P)
|
|
chr3_-_50540853
|
10.528
|
NM_001005505
NM_001174051
NM_006030
|
CACNA2D2
|
calcium channel, voltage-dependent, alpha 2/delta subunit 2
|
|
chr2_-_73496595
|
10.453
|
NM_001080410
|
FBXO41
|
F-box protein 41
|
|
chr7_-_17980102
|
10.341
|
NM_015132
|
SNX13
|
sorting nexin 13
|
|
chr1_-_112298418
|
10.178
|
NM_198926
|
FAM212B
|
family with sequence similarity 212, member B
|
|
chr7_-_44530178
|
10.067
|
NM_015332
|
NUDCD3
|
NudC domain containing 3
|
|
chr19_-_36523770
|
10.032
|
NM_015526
|
CLIP3
|
CAP-GLY domain containing linker protein 3
|
|
chr7_-_98467663
|
9.985
|
NM_001134450
NM_001134451
NM_152913
|
TMEM130
|
transmembrane protein 130
|
|
chr19_+_54372659
|
9.844
|
NM_001020821
NM_001020818
|
MYADM
|
myeloid-associated differentiation marker
|
|
chr11_+_64126616
|
9.777
|
NM_001006944
NM_003942
|
RPS6KA4
|
ribosomal protein S6 kinase, 90kDa, polypeptide 4
|
|
chr18_-_74844762
|
9.735
|
NM_001025100
NM_001025101
|
MBP
|
myelin basic protein
|
|
chr17_-_1083008
|
9.690
|
NM_021962
|
ABR
|
active BCR-related gene
|
|
chr17_+_7608413
|
9.645
|
NM_001406
|
EFNB3
|
ephrin-B3
|
|
chr15_+_68924326
|
9.620
|
NM_001190457
|
CORO2B
|
coronin, actin binding protein, 2B
|
|
chr4_-_2263706
|
9.585
|
NM_006454
|
MXD4
|
MAX dimerization protein 4
|
|
chr15_+_68871285
|
9.571
|
NM_006091
|
CORO2B
|
coronin, actin binding protein, 2B
|
|
chr1_+_28052467
|
9.568
|
NM_001143912
NM_001143913
NM_001143914
NM_001143915
NM_152660
|
FAM76A
|
family with sequence similarity 76, member A
|
|
chr5_-_149492934
|
9.544
|
NM_005211
|
CSF1R
|
colony stimulating factor 1 receptor
|
|
chr2_-_27485774
|
9.476
|
NM_003459
|
SLC30A3
|
solute carrier family 30 (zinc transporter), member 3
|
|
chr1_-_112281864
|
9.413
|
NM_019099
|
FAM212B
|
family with sequence similarity 212, member B
|
|
chr19_-_14316980
|
9.344
|
NM_001008701
NM_014921
|
LPHN1
|
latrophilin 1
|
|
chr1_-_21044202
|
9.284
|
NM_001122819
NM_020816
|
KIF17
|
kinesin family member 17
|
|
chr11_-_118047336
|
9.231
|
NM_004588
|
SCN2B
|
sodium channel, voltage-gated, type II, beta
|
|
chr5_-_132299263
|
9.209
|
NM_014423
|
AFF4
|
AF4/FMR2 family, member 4
|
|
chr3_+_11034419
|
9.186
|
NM_003042
|
SLC6A1
|
solute carrier family 6 (neurotransmitter transporter, GABA), member 1
|
|
chr11_+_46299161
|
9.147
|
NM_052854
|
CREB3L1
|
cAMP responsive element binding protein 3-like 1
|
|
chr14_+_24583979
|
9.101
|
NM_025230
|
DCAF11
|
DDB1 and CUL4 associated factor 11
|
|
chr19_+_54369610
|
9.096
|
NM_001020820
|
MYADM
|
myeloid-associated differentiation marker
|
|
chr11_-_62494785
|
9.095
|
NM_001079559
|
HNRNPUL2-BSCL2
HNRNPUL2
|
HNRNPUL2-BSCL2 readthrough
heterogeneous nuclear ribonucleoprotein U-like 2
|
|
chr9_+_130374466
|
9.086
|
NM_001032221
NM_003165
|
STXBP1
|
syntaxin binding protein 1
|
|
chr11_+_46366816
|
9.069
|
NM_201533
|
DGKZ
|
diacylglycerol kinase, zeta
|
|
chr22_-_44258210
|
8.980
|
NM_014351
|
SULT4A1
|
sulfotransferase family 4A, member 1
|
|
chrX_-_18372777
|
8.973
|
NM_006089
|
SCML2
|
sex comb on midleg-like 2 (Drosophila)
|
|
chr12_-_56615679
|
8.962
|
NM_005785
NM_194358
NM_194359
|
RNF41
|
ring finger protein 41
|
|
chr15_+_68908878
|
8.951
|
NM_001190456
|
CORO2B
|
coronin, actin binding protein, 2B
|
|
chr2_+_220144024
|
8.946
|
NM_001039550
NM_006736
|
DNAJB2
|
DnaJ (Hsp40) homolog, subfamily B, member 2
|
|
chr16_+_2039945
|
8.933
|
NM_004209
|
SYNGR3
|
synaptogyrin 3
|
|
chr8_+_104152876
|
8.729
|
NM_001024372
NM_024812
|
BAALC
|
brain and acute leukemia, cytoplasmic
|
|
chr2_-_99552677
|
8.593
|
NM_207362
|
C2orf55
|
chromosome 2 open reading frame 55
|
|
chr2_-_68479481
|
8.534
|
NM_000945
|
PPP3R1
|
protein phosphatase 3, regulatory subunit B, alpha
|
|
chr2_+_166152282
|
8.500
|
NM_001040143
|
SCN2A
|
sodium channel, voltage-gated, type II, alpha subunit
|
|
chrX_+_113818550
|
8.490
|
NM_000868
|
HTR2C
|
5-hydroxytryptamine (serotonin) receptor 2C
|
|
chr8_+_77593506
|
8.485
|
NM_024721
|
ZFHX4
|
zinc finger homeobox 4
|
|
chr3_-_36986535
|
8.463
|
NM_014831
|
TRANK1
|
tetratricopeptide repeat and ankyrin repeat containing 1
|
