|
chr19_+_38755238
|
78.185
|
|
SPINT2
|
serine peptidase inhibitor, Kunitz type, 2
|
|
chr19_+_38755422
|
75.620
|
|
SPINT2
|
serine peptidase inhibitor, Kunitz type, 2
|
|
chr19_+_38755097
|
71.974
|
NM_001166103
NM_021102
|
SPINT2
|
serine peptidase inhibitor, Kunitz type, 2
|
|
chr17_-_7165788
|
53.983
|
|
CLDN7
|
claudin 7
|
|
chr19_-_12886263
|
45.102
|
|
HOOK2
|
hook homolog 2 (Drosophila)
|
|
chr15_-_76030958
|
44.525
|
|
DNM1P35
|
DNM1 pseudogene 35
|
|
chr17_-_7166263
|
41.292
|
NM_001185023
NM_001307
|
CLDN7
|
claudin 7
|
|
chr11_-_68518910
|
39.760
|
|
MTL5
|
metallothionein-like 5, testis-specific (tesmin)
|
|
chr9_-_97401588
|
35.812
|
|
FBP1
|
fructose-1,6-bisphosphatase 1
|
|
chr14_-_61748510
|
34.501
|
NM_001017970
|
TMEM30B
|
transmembrane protein 30B
|
|
chr6_-_136871542
|
33.739
|
|
MAP7
|
microtubule-associated protein 7
|
|
chr9_-_97401746
|
33.062
|
|
FBP1
|
fructose-1,6-bisphosphatase 1
|
|
chr1_+_60280462
|
31.429
|
NM_015888
|
HOOK1
|
hook homolog 1 (Drosophila)
|
|
chr14_-_61747956
|
31.139
|
|
TMEM30B
|
transmembrane protein 30B
|
|
chr1_+_1981902
|
30.603
|
NM_002744
|
PRKCZ
|
protein kinase C, zeta
|
|
chr14_+_75745480
|
29.271
|
NM_005252
|
FOS
|
FBJ murine osteosarcoma viral oncogene homolog
|
|
chr22_+_22697538
|
28.768
|
|
|
|
|
chr19_-_12886421
|
28.672
|
NM_001100176
NM_013312
|
HOOK2
|
hook homolog 2 (Drosophila)
|
|
chr16_+_68771214
|
28.503
|
|
CDH1
|
cadherin 1, type 1, E-cadherin (epithelial)
|
|
chr16_+_68771192
|
27.885
|
NM_004360
|
CDH1
|
cadherin 1, type 1, E-cadherin (epithelial)
|
|
chr22_-_19511777
|
27.742
|
|
CLDN5
|
claudin 5
|
|
chr14_+_92788924
|
27.521
|
NM_153648
|
SLC24A4
|
solute carrier family 24 (sodium/potassium/calcium exchanger), member 4
|
|
chr6_+_31783530
|
27.465
|
|
HSPA1A
HSPA1B
|
heat shock 70kDa protein 1A
heat shock 70kDa protein 1B
|
|
chr9_-_97401833
|
27.380
|
NM_000507
|
FBP1
|
fructose-1,6-bisphosphatase 1
|
|
chr11_+_130029773
|
27.312
|
|
ST14
|
suppression of tumorigenicity 14 (colon carcinoma)
|
|
chr16_-_4987056
|
26.832
|
NM_002705
|
PPL
|
periplakin
|
|
chr15_+_44581045
|
26.390
|
|
CASC4
|
cancer susceptibility candidate 4
|
|
chr15_+_44580954
|
26.375
|
|
CASC4
|
cancer susceptibility candidate 4
|
|
chr1_-_111746917
|
25.245
|
|
DENND2D
|
DENN/MADD domain containing 2D
|
|
chr1_-_52831817
|
25.038
|
NM_032449
|
CC2D1B
|
coiled-coil and C2 domain containing 1B
|
|
chr6_+_31783314
|
24.361
|
|
HSPA1A
HSPA1B
|
heat shock 70kDa protein 1A
heat shock 70kDa protein 1B
|
|
chr19_+_14017038
|
24.213
|
|
CC2D1A
|
coiled-coil and C2 domain containing 1A
|
|
chrX_-_107018889
|
23.916
|
|
TSC22D3
|
TSC22 domain family, member 3
|
|
chr7_-_73184535
|
23.895
|
NM_001306
|
CLDN3
|
claudin 3
|
|
chr17_-_39942937
|
23.884
|
NM_002230
NM_021991
|
JUP
|
junction plakoglobin
|
|
chr7_-_8301767
|
23.640
|
NM_001136020
|
ICA1
|
islet cell autoantigen 1, 69kDa
|
|
chr11_+_121322848
|
23.102
|
NM_003105
|
SORL1
|
sortilin-related receptor, L(DLR class) A repeats containing
|
|
chr1_+_3371020
|
22.387
|
NM_014448
|
ARHGEF16
|
Rho guanine nucleotide exchange factor (GEF) 16
|
|
chr1_-_59042827
|
22.170
|
|
TACSTD2
|
tumor-associated calcium signal transducer 2
|
|
chr19_+_18794487
|
21.815
|
|
CRTC1
|
CREB regulated transcription coactivator 1
|
|
chr11_+_130029712
|
21.698
|
|
ST14
|
suppression of tumorigenicity 14 (colon carcinoma)
|
|
chr2_+_64751436
|
21.383
|
NM_001002243
NM_017657
NM_203437
|
AFTPH
|
aftiphilin
|
|
chr17_+_73521744
|
21.243
|
NM_001015002
NM_001031803
NM_004524
|
LLGL2
|
lethal giant larvae homolog 2 (Drosophila)
|
|
chr6_-_136871956
|
21.214
|
NM_001198616
NM_001198617
NM_003980
|
MAP7
|
microtubule-associated protein 7
|
|
chr1_+_156030965
|
21.094
|
NM_020387
|
RAB25
|
RAB25, member RAS oncogene family
|
|
chr15_+_50474357
|
20.994
|
NM_001159629
NM_003645
|
SLC27A2
|
solute carrier family 27 (fatty acid transporter), member 2
|
|
chr14_-_106539099
|
20.811
|
|
IGHA1
IGHG1
IGHG3
|
immunoglobulin heavy constant alpha 1
immunoglobulin heavy constant gamma 1 (G1m marker)
immunoglobulin heavy constant gamma 3 (G3m marker)
|
|
chr5_-_43412417
|
20.683
|
NM_148672
|
CCL28
|
chemokine (C-C motif) ligand 28
|
|
chr14_-_106208695
|
20.547
|
|
|
|
|
chr19_+_35739778
|
20.315
|
|
LSR
|
lipolysis stimulated lipoprotein receptor
|
|
chr17_+_72744802
|
20.290
|
|
SLC9A3R1
|
solute carrier family 9 (sodium/hydrogen exchanger), member 3 regulator 1
|
|
chr1_+_46646199
|
19.774
|
|
TSPAN1
|
tetraspanin 1
|
|
chr17_+_72744794
|
19.681
|
|
SLC9A3R1
|
solute carrier family 9 (sodium/hydrogen exchanger), member 3 regulator 1
|
|
chr8_+_102504836
|
19.660
|
|
GRHL2
|
grainyhead-like 2 (Drosophila)
|
|
chr12_+_51318743
|
19.571
|
|
METTL7A
|
methyltransferase like 7A
|
|
chr11_+_61129831
|
19.243
|
|
TMEM138
|
transmembrane protein 138
|
|
chr1_+_183155393
|
19.180
|
|
LAMC2
|
laminin, gamma 2
|
|
chr19_+_39899749
|
19.107
|
|
|
|
|
chr11_+_118401873
|
19.017
|
|
TMEM25
|
transmembrane protein 25
|
|
chr22_+_23165273
|
18.863
|
|
|
|
|
chr5_-_1295022
|
18.518
|
NM_001193376
NM_198253
|
TERT
|
telomerase reverse transcriptase
|
|
chr2_-_166650770
|
18.382
|
NM_004482
|
GALNT3
|
UDP-N-acetyl-alpha-D-galactosamine:polypeptide N-acetylgalactosaminyltransferase 3 (GalNAc-T3)
|
|
chr6_+_31795395
|
18.357
|
NM_005346
|
HSPA1A
HSPA1B
|
heat shock 70kDa protein 1A
heat shock 70kDa protein 1B
|
|
chr19_+_35739282
|
18.221
|
|
LSR
|
lipolysis stimulated lipoprotein receptor
|
|
chr19_+_35739519
|
18.096
|
NM_015925
NM_205834
NM_205835
|
LSR
|
lipolysis stimulated lipoprotein receptor
|
|
chr7_-_99680358
|
18.055
|
|
ZNF3
|
zinc finger protein 3
|
|
chr22_+_23010757
|
17.903
|
|
|
|
|
chrX_-_107019001
|
17.701
|
NM_198057
|
TSC22D3
|
TSC22 domain family, member 3
|
|
chr22_+_22735134
|
17.688
|
|
CYAT1
|
immunoglobulin lambda light chain-like
|
|
chr2_-_24583291
|
17.590
|
NM_006277
NM_019595
NM_147152
|
ITSN2
|
intersectin 2
|
|
chr17_+_72744746
|
17.578
|
NM_004252
|
SLC9A3R1
|
solute carrier family 9 (sodium/hydrogen exchanger), member 3 regulator 1
|
|
chr14_-_106208537
|
17.444
|
|
|
|
|
chr6_-_137113166
|
17.278
|
|
|
|
|
chr2_+_219283809
|
17.268
|
NM_007127
|
VIL1
|
villin 1
|
|
chr13_+_48877950
|
17.266
|
|
RB1
|
retinoblastoma 1
|
|
chr15_+_41136622
|
17.214
|
NM_001032367
|
SPINT1
|
serine peptidase inhibitor, Kunitz type 1
|
|
chr8_-_99306563
|
17.208
|
NM_024759
|
NIPAL2
|
NIPA-like domain containing 2
|
|
chr3_+_101395299
|
17.074
|
|
LOC100009676
|
uncharacterized LOC100009676
|
|
chr4_-_57522469
|
17.027
|
NM_001145459
NM_139211
|
HOPX
|
HOP homeobox
|
|
chr15_+_41136178
|
16.996
|
NM_003710
NM_181642
|
SPINT1
|
serine peptidase inhibitor, Kunitz type 1
|
|
chr22_+_38453478
|
16.953
|
|
PICK1
|
protein interacting with PRKCA 1
|
|
chr19_-_18632857
|
16.837
|
|
ELL
|
elongation factor RNA polymerase II
|
|
chr2_-_241835572
|
16.828
|
NM_001085437
|
C2orf54
|
chromosome 2 open reading frame 54
|
|
chr14_-_55369163
|
16.683
|
NM_000161
NM_001024024
NM_001024070
NM_001024071
|
GCH1
|
GTP cyclohydrolase 1
|
|
chr17_+_38119225
|
16.666
|
NM_178171
|
GSDMA
|
gasdermin A
|
|
chr10_-_21462987
|
16.392
|
|
NEBL
|
nebulette
|
|
chr4_-_657424
|
16.181
|
|
|
|
|
chr6_-_36355342
|
16.092
|
NM_001207038
NM_001207035
NM_001207036
NM_001207037
NM_001207039
NM_001207040
NM_001207041
NM_016135
|
ETV7
|
ets variant 7
|
|
chr17_+_5972425
|
16.074
|
|
WSCD1
|
WSC domain containing 1
|
|
chr17_-_31203889
|
15.604
|
NM_015194
|
MYO1D
|
myosin ID
|
|
chr22_+_22712091
|
15.534
|
|
IGLV1-44
IGL@
|
immunoglobulin lambda variable 1-44
immunoglobulin lambda locus
|
|
chr7_+_16793320
|
15.411
|
NM_014399
|
TSPAN13
|
tetraspanin 13
|
|
chr11_+_130029663
|
15.321
|
NM_021978
|
ST14
|
suppression of tumorigenicity 14 (colon carcinoma)
|
|
chr1_-_182361311
|
15.320
|
NM_001033044
NM_002065
|
GLUL
|
glutamate-ammonia ligase
|
|
chr1_-_201368434
|
15.270
|
|
LAD1
|
ladinin 1
|
|
chr12_-_6484904
|
15.224
|
NM_001038
|
SCNN1A
|
sodium channel, nonvoltage-gated 1 alpha
|
|
chr1_-_201368716
|
15.220
|
|
LAD1
|
ladinin 1
|
|
chr2_-_89513056
|
15.152
|
|
IGKC
|
immunoglobulin kappa constant
|
|
chr8_+_102504661
|
15.132
|
NM_024915
|
GRHL2
|
grainyhead-like 2 (Drosophila)
|
|
chr17_+_72744775
|
15.074
|
|
SLC9A3R1
|
solute carrier family 9 (sodium/hydrogen exchanger), member 3 regulator 1
|
|
chr11_-_64856541
|
14.969
|
NM_001242631
|
LOC100130348
LOC399904
|
uncharacterized LOC100130348
uncharacterized LOC399904
|
|
chr2_+_47596447
|
14.963
|
|
EPCAM
|
epithelial cell adhesion molecule
|
|
chr6_+_37137882
|
14.944
|
NM_001243186
NM_002648
|
PIM1
|
pim-1 oncogene
|
|
chr21_-_42219038
|
14.878
|
NM_001389
|
DSCAM
|
Down syndrome cell adhesion molecule
|
|
chr2_-_224702200
|
14.789
|
|
AP1S3
|
adaptor-related protein complex 1, sigma 3 subunit
|
|
chr11_+_44587212
|
14.721
|
|
CD82
|
CD82 molecule
|
|
chr19_-_14016908
|
14.703
|
NM_024323
|
C19orf57
|
chromosome 19 open reading frame 57
|
|
chr2_-_25467078
|
14.649
|
|
DNMT3A
|
DNA (cytosine-5-)-methyltransferase 3 alpha
|
|
chr8_+_95653272
|
14.637
|
|
ESRP1
|
epithelial splicing regulatory protein 1
|
|
chr7_-_8301681
|
14.611
|
NM_022307
|
ICA1
|
islet cell autoantigen 1, 69kDa
|
|
chr7_-_8302141
|
14.553
|
NM_004968
|
ICA1
|
islet cell autoantigen 1, 69kDa
|
|
chr19_-_18632886
|
14.537
|
NM_006532
|
ELL
|
elongation factor RNA polymerase II
|
|
chr12_-_33049664
|
14.490
|
NM_001005242
NM_004572
|
PKP2
|
plakophilin 2
|
|
chr6_-_62995852
|
14.477
|
NM_152688
|
KHDRBS2
|
KH domain containing, RNA binding, signal transduction associated 2
|
|
chr3_+_47021146
|
14.380
|
NM_015175
|
NBEAL2
|
neurobeachin-like 2
|
|
chrX_-_13956445
|
14.322
|
|
|
|
|
chr5_+_68788387
|
14.242
|
NM_001205254
|
OCLN
|
occludin
|
|
chr19_+_14017044
|
14.178
|
|
CC2D1A
|
coiled-coil and C2 domain containing 1A
|
|
chr16_+_1584161
|
14.169
|
NM_024600
|
TMEM204
|
transmembrane protein 204
|
|
chr11_+_73358593
|
14.165
|
NM_001130034
NM_001130035
|
PLEKHB1
|
pleckstrin homology domain containing, family B (evectins) member 1
|
|
chr9_-_110251308
|
14.140
|
|
KLF4
|
Kruppel-like factor 4 (gut)
|
|
chr11_+_44587140
|
14.121
|
NM_001024844
NM_002231
|
CD82
|
CD82 molecule
|
|
chr1_+_109656507
|
14.116
|
|
KIAA1324
|
KIAA1324
|
|
chr22_-_19512859
|
14.116
|
NM_001130861
NM_003277
|
CLDN5
|
claudin 5
|
|
chr5_+_156693051
|
14.062
|
NM_001037333
NM_001037332
|
CYFIP2
|
cytoplasmic FMR1 interacting protein 2
|
|
chr1_-_160990862
|
14.031
|
|
F11R
|
F11 receptor
|
|
chr10_-_21463019
|
14.013
|
NM_001173484
NM_213569
|
NEBL
|
nebulette
|
|
chr22_-_19512001
|
13.968
|
|
CLDN5
|
claudin 5
|
|
chr12_-_53448167
|
13.962
|
|
LOC283335
|
uncharacterized LOC283335
|
|
chr9_-_110251754
|
13.961
|
|
KLF4
|
Kruppel-like factor 4 (gut)
|
|
chr20_+_49348050
|
13.920
|
NM_032521
|
PARD6B
|
par-6 partitioning defective 6 homolog beta (C. elegans)
|
|
chr12_-_101603984
|
13.920
|
NM_145913
|
SLC5A8
|
solute carrier family 5 (iodide transporter), member 8
|
|
chr2_+_47596286
|
13.918
|
NM_002354
|
EPCAM
|
epithelial cell adhesion molecule
|
|
chr17_-_15902907
|
13.871
|
NM_001042697
NM_001042698
|
ZSWIM7
|
zinc finger, SWIM-type containing 7
|
|
chr15_+_44580870
|
13.759
|
NM_138423
NM_177974
|
CASC4
|
cancer susceptibility candidate 4
|
|
chr19_+_18794391
|
13.737
|
NM_001098482
NM_015321
|
CRTC1
|
CREB regulated transcription coactivator 1
|
|
chr16_-_74808699
|
13.700
|
NM_024306
|
FA2H
|
fatty acid 2-hydroxylase
|
|
chr2_+_17721806
|
13.598
|
NM_003385
|
VSNL1
|
visinin-like 1
|
|
chr11_+_130029699
|
13.541
|
|
ST14
|
suppression of tumorigenicity 14 (colon carcinoma)
|
|
chr14_-_24036532
|
13.522
|
|
AP1G2
|
adaptor-related protein complex 1, gamma 2 subunit
|
|
chr10_+_71211215
|
13.432
|
NM_012339
|
TSPAN15
|
tetraspanin 15
|
|
chr1_-_201368617
|
13.395
|
NM_005558
|
LAD1
|
ladinin 1
|
|
chr12_-_110434057
|
13.376
|
|
GIT2
|
G protein-coupled receptor kinase interacting ArfGAP 2
|
|
chr19_-_51537996
|
13.372
|
NM_019598
NM_145894
NM_145895
|
KLK12
|
kallikrein-related peptidase 12
|
|
chr19_-_36499583
|
13.330
|
NM_001039876
|
C19orf46
|
chromosome 19 open reading frame 46
|
|
chr12_+_7055753
|
13.314
|
|
PTPN6
|
protein tyrosine phosphatase, non-receptor type 6
|
|
chr11_-_417324
|
13.309
|
NM_001135053
NM_021805
|
SIGIRR
|
single immunoglobulin and toll-interleukin 1 receptor (TIR) domain
|
|
chr19_+_49055421
|
13.276
|
NM_177973
|
SULT2B1
|
sulfotransferase family, cytosolic, 2B, member 1
|
|
chr2_+_17721983
|
13.270
|
|
VSNL1
|
visinin-like 1
|
|
chr4_-_16085593
|
13.259
|
NM_001145847
NM_001145848
|
PROM1
|
prominin 1
|
|
chr19_-_6279797
|
13.158
|
|
|
|
|
chr14_-_107013474
|
13.133
|
|
IGHA1
IGHG1
|
immunoglobulin heavy constant alpha 1
immunoglobulin heavy constant gamma 1 (G1m marker)
|
|
chr20_+_44098392
|
13.113
|
NM_006103
|
WFDC2
|
WAP four-disulfide core domain 2
|
|
chr16_+_68679229
|
13.072
|
|
CDH3
|
cadherin 3, type 1, P-cadherin (placental)
|
|
chr17_-_7197811
|
13.028
|
|
YBX2
|
Y box binding protein 2
|
|
chr19_-_10341947
|
12.995
|
NM_004230
|
S1PR2
|
sphingosine-1-phosphate receptor 2
|
|
chr2_-_219925237
|
12.994
|
NM_002181
|
IHH
|
Indian hedgehog
|
|
chr15_-_48470453
|
12.990
|
NM_016132
|
MYEF2
|
myelin expression factor 2
|
|
chr17_-_39684499
|
12.961
|
|
KRT19
|
keratin 19
|
|
chr17_+_7452374
|
12.956
|
NM_172089
NM_003809
|
TNFSF12-TNFSF13
TNFSF12
|
TNFSF12-TNFSF13 readthrough
tumor necrosis factor (ligand) superfamily, member 12
|
|
chr17_-_79875995
|
12.884
|
|
SIRT7
|
sirtuin 7
|
|
chr16_-_68269948
|
12.869
|
NM_024939
|
ESRP2
|
epithelial splicing regulatory protein 2
|
|
chr4_-_36245893
|
12.828
|
NM_015230
|
ARAP2
|
ArfGAP with RhoGAP domain, ankyrin repeat and PH domain 2
|
|
chr2_-_241500167
|
12.772
|
|
ANKMY1
|
ankyrin repeat and MYND domain containing 1
|
|
chr8_+_27182995
|
12.746
|
NM_173176
|
PTK2B
|
PTK2B protein tyrosine kinase 2 beta
|
|
chr1_+_183155361
|
12.744
|
|
LAMC2
|
laminin, gamma 2
|
|
chr22_-_50312096
|
12.742
|
NM_024105
|
ALG12
|
asparagine-linked glycosylation 12, alpha-1,6-mannosyltransferase homolog (S. cerevisiae)
|
|
chr11_-_33890931
|
12.731
|
|
LMO2
|
LIM domain only 2 (rhombotin-like 1)
|
|
chr16_+_81812899
|
12.697
|
|
PLCG2
|
phospholipase C, gamma 2 (phosphatidylinositol-specific)
|
|
chr1_+_154975041
|
12.583
|
NM_001252405
NM_015872
|
ZBTB7B
|
zinc finger and BTB domain containing 7B
|
|
chr10_+_49514652
|
12.507
|
|
MAPK8
|
mitogen-activated protein kinase 8
|
|
chr7_-_97881436
|
12.465
|
NM_015395
|
TECPR1
|
tectonin beta-propeller repeat containing 1
|
|
chr19_+_18723666
|
12.448
|
NM_012109
|
TMEM59L
|
transmembrane protein 59-like
|
|
chr17_-_7197896
|
12.384
|
|
YBX2
|
Y box binding protein 2
|
|
chr16_+_68771304
|
12.320
|
|
CDH1
|
cadherin 1, type 1, E-cadherin (epithelial)
|
|
chr6_+_39016556
|
12.306
|
NM_002062
|
GLP1R
|
glucagon-like peptide 1 receptor
|
|
chr6_+_110012521
|
12.262
|
|
FIG4
|
FIG4 homolog, SAC1 lipid phosphatase domain containing (S. cerevisiae)
|
|
chr16_-_67753186
|
12.237
|
NM_001243650
NM_030819
|
GFOD2
|
glucose-fructose oxidoreductase domain containing 2
|
|
chr14_-_107131217
|
12.169
|
|
IGHA1
|
immunoglobulin heavy constant alpha 1
|
|
chr4_+_155665150
|
12.159
|
NM_004744
|
LRAT
|
lecithin retinol acyltransferase (phosphatidylcholine--retinol O-acyltransferase)
|
|
chr14_-_106111114
|
12.157
|
|
IGHG2
|
immunoglobulin heavy constant gamma 2 (G2m marker)
|
|
chr19_-_4535202
|
12.126
|
NM_001013706
|
PLIN5
|
perilipin 5
|
|
chr16_-_74808474
|
12.115
|
|
FA2H
|
fatty acid 2-hydroxylase
|
|
chr1_+_150255228
|
12.056
|
NM_144697
|
C1orf51
|
chromosome 1 open reading frame 51
|
|
chr16_+_69796237
|
12.041
|
NM_007014
NM_199423
|
WWP2
|
WW domain containing E3 ubiquitin protein ligase 2
|
|
chr15_-_45670955
|
11.912
|
NM_001482
|
GATM
|
glycine amidinotransferase (L-arginine:glycine amidinotransferase)
|
|
chr22_+_38453261
|
11.904
|
NM_001039583
NM_001039584
NM_012407
|
PICK1
|
protein interacting with PRKCA 1
|
|
chr11_+_61197574
|
11.893
|
NM_017841
|
SDHAF2
|
succinate dehydrogenase complex assembly factor 2
|
|
chr2_+_155555092
|
11.782
|
NM_002239
|
KCNJ3
|
potassium inwardly-rectifying channel, subfamily J, member 3
|
|
chr1_+_29213619
|
11.782
|
|
EPB41
|
erythrocyte membrane protein band 4.1 (elliptocytosis 1, RH-linked)
|
|
chr20_+_48599511
|
11.760
|
NM_005985
|
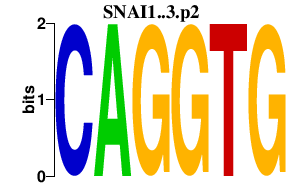
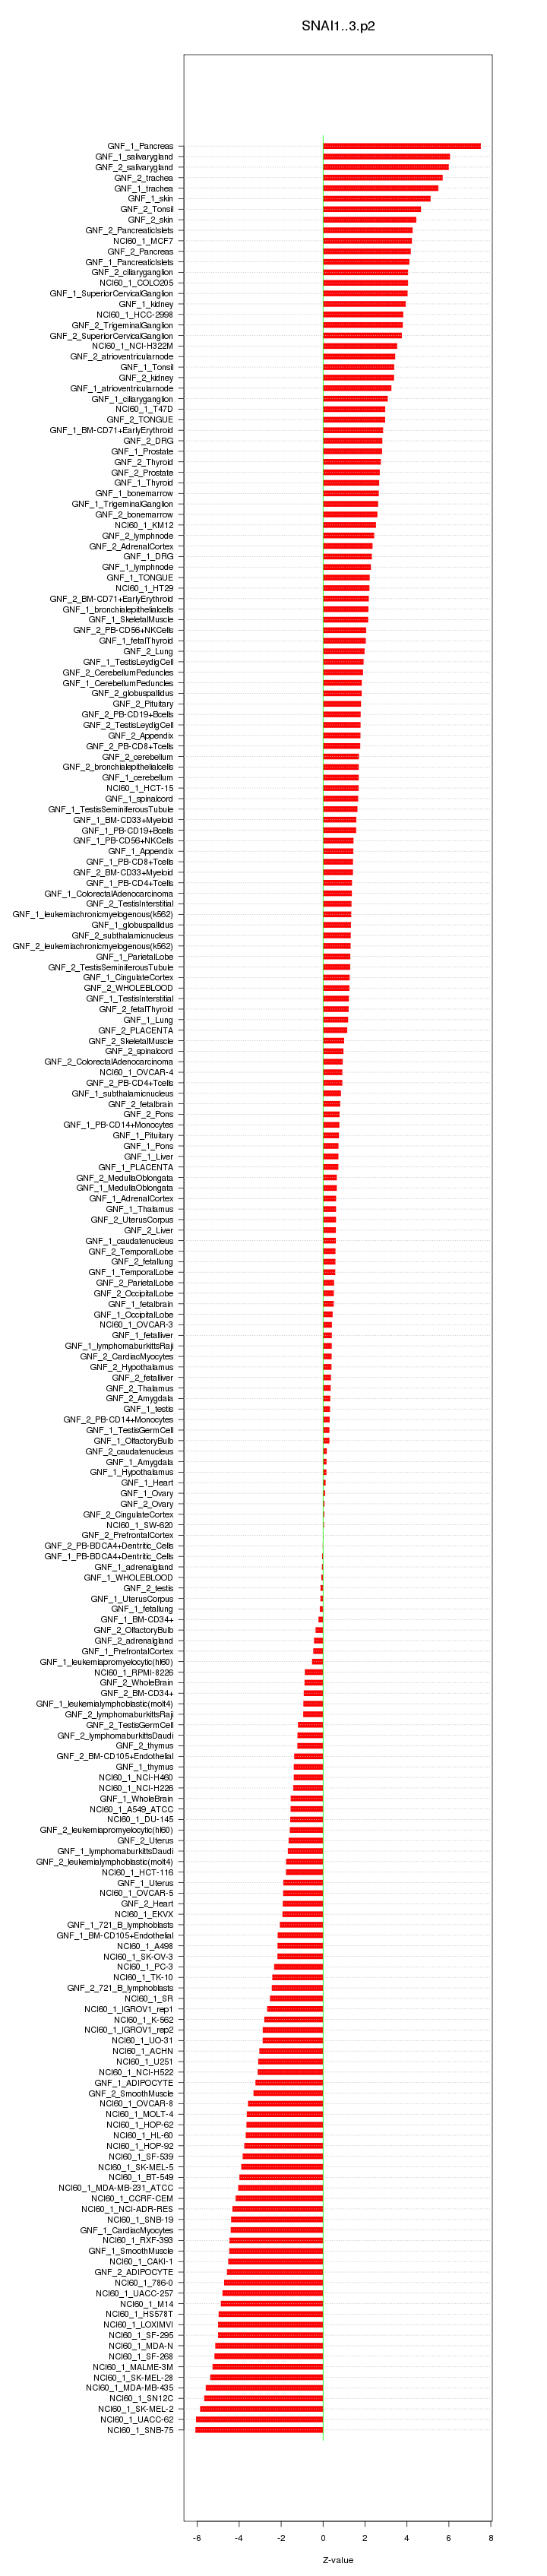
SNAI1
|
snail homolog 1 (Drosophila)
|
|
chr8_-_127570465
|
11.758
|
|
FAM84B
|
family with sequence similarity 84, member B
|
|
chr15_-_45670624
|
11.728
|
|
GATM
|
glycine amidinotransferase (L-arginine:glycine amidinotransferase)
|
|
chr2_+_242641310
|
11.641
|
NM_032329
|
ING5
|
inhibitor of growth family, member 5
|
|
chr14_-_106926393
|
11.624
|
|
IGHA1
IGHG1
|
immunoglobulin heavy constant alpha 1
immunoglobulin heavy constant gamma 1 (G1m marker)
|
|
chr19_+_35739838
|
11.622
|
|
LSR
|
lipolysis stimulated lipoprotein receptor
|
|
chr1_-_17445865
|
11.599
|
NM_007365
|
PADI2
|
peptidyl arginine deiminase, type II
|
|
chr19_+_35607218
|
11.588
|
|
FXYD3
|
FXYD domain containing ion transport regulator 3
|
|
chr8_-_110657025
|
11.584
|
NM_001099753
NM_001099754
NM_001099755
|
SYBU
|
syntabulin (syntaxin-interacting)
|
|
chr4_+_106473776
|
11.567
|
NM_001242729
NM_017700
|
ARHGEF38
|
Rho guanine nucleotide exchange factor (GEF) 38
|
