Project
averaged GNF SymAtlas + NCI-60 cancer cell lines, human (Su, 2004; Ross, 2000)
Navigation
Downloads
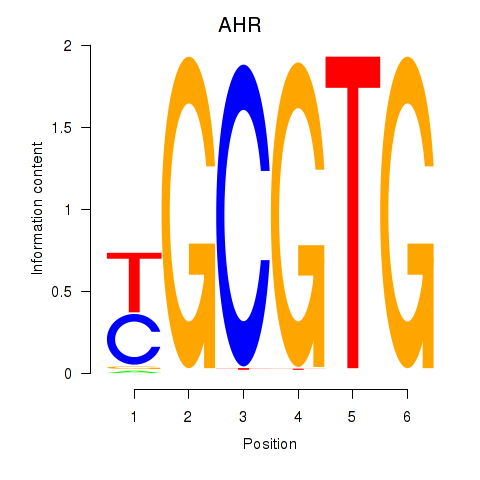
Results for AHR_ARNT2
Z-value: 1.92
Motif logo

Transcription factors associated with AHR_ARNT2
| Gene Symbol | Gene ID | Gene Info |
|---|---|---|
|
AHR
|
ENSG00000106546.8 | aryl hydrocarbon receptor |
|
ARNT2
|
ENSG00000172379.14 | aryl hydrocarbon receptor nuclear translocator 2 |
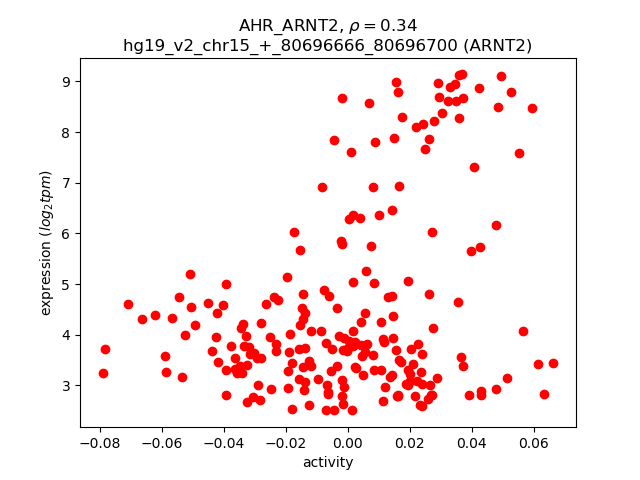
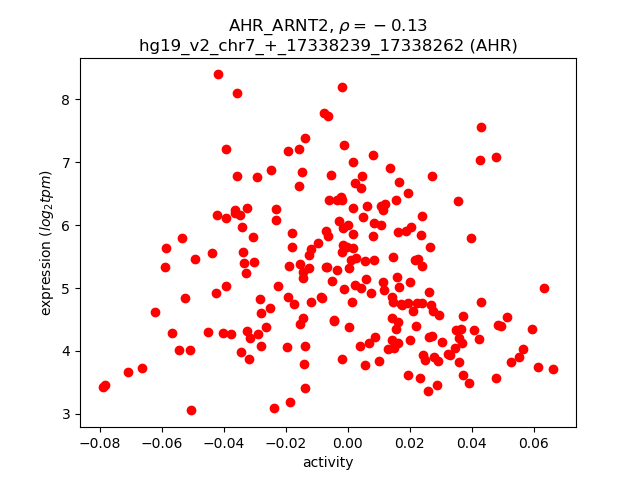
Activity-expression correlation:
| Gene | Promoter | Pearson corr. coef. | P-value | Plot |
|---|---|---|---|---|
| ARNT2 | hg19_v2_chr15_+_80696666_80696700, hg19_v2_chr15_+_80733570_80733659 | 0.34 | 2.9e-07 | Click! |
| AHR | hg19_v2_chr7_+_17338239_17338262 | -0.13 | 5.7e-02 | Click! |
Activity profile of AHR_ARNT2 motif
Sorted Z-values of AHR_ARNT2 motif
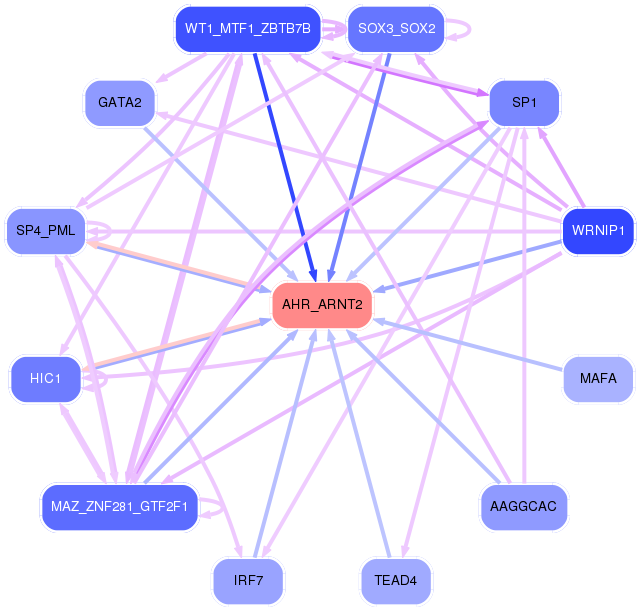
Network of associatons between targets according to the STRING database.

First level regulatory network of AHR_ARNT2
Gene Ontology Analysis
Gene overrepresentation in biological_process category:
| Log-likelihood per target | Total log-likelihood | Term | Description |
|---|---|---|---|
| 7.2 | 29.0 | GO:0070982 | L-asparagine biosynthetic process(GO:0070981) L-asparagine metabolic process(GO:0070982) |
| 6.0 | 6.0 | GO:1902669 | positive regulation of axon guidance(GO:1902669) |
| 6.0 | 18.0 | GO:0031630 | regulation of synaptic vesicle fusion to presynaptic membrane(GO:0031630) |
| 4.9 | 14.8 | GO:0019242 | methylglyoxal biosynthetic process(GO:0019242) |
| 4.2 | 16.9 | GO:0003172 | primary heart field specification(GO:0003138) sinoatrial valve development(GO:0003172) sinoatrial valve morphogenesis(GO:0003185) |
| 3.7 | 11.2 | GO:0035408 | histone H3-T6 phosphorylation(GO:0035408) |
| 3.5 | 10.6 | GO:0009183 | purine deoxyribonucleoside diphosphate biosynthetic process(GO:0009183) |
| 2.9 | 14.7 | GO:1904207 | regulation of chemokine (C-C motif) ligand 2 secretion(GO:1904207) positive regulation of chemokine (C-C motif) ligand 2 secretion(GO:1904209) |
| 2.9 | 8.7 | GO:2001245 | regulation of phosphatidylcholine biosynthetic process(GO:2001245) |
| 2.8 | 39.0 | GO:0070050 | neuron cellular homeostasis(GO:0070050) |
| 2.6 | 7.8 | GO:1904897 | regulation of hepatic stellate cell proliferation(GO:1904897) positive regulation of hepatic stellate cell proliferation(GO:1904899) hepatic stellate cell proliferation(GO:1990922) |
| 2.2 | 11.2 | GO:0007068 | negative regulation of transcription during mitosis(GO:0007068) negative regulation of transcription from RNA polymerase II promoter during mitosis(GO:0007070) |
| 2.2 | 8.8 | GO:0090370 | negative regulation of cholesterol efflux(GO:0090370) |
| 2.1 | 12.7 | GO:0042866 | pyruvate biosynthetic process(GO:0042866) |
| 2.0 | 6.0 | GO:2000854 | positive regulation of corticosterone secretion(GO:2000854) |
| 2.0 | 9.9 | GO:0090258 | negative regulation of mitochondrial fission(GO:0090258) |
| 1.9 | 5.8 | GO:1903179 | regulation of dopamine biosynthetic process(GO:1903179) positive regulation of dopamine biosynthetic process(GO:1903181) |
| 1.9 | 13.5 | GO:0010756 | positive regulation of plasminogen activation(GO:0010756) |
| 1.9 | 7.7 | GO:0043335 | protein unfolding(GO:0043335) |
| 1.9 | 5.6 | GO:0006597 | spermine biosynthetic process(GO:0006597) |
| 1.8 | 21.3 | GO:1900028 | negative regulation of ruffle assembly(GO:1900028) |
| 1.8 | 8.8 | GO:0031120 | snRNA pseudouridine synthesis(GO:0031120) |
| 1.7 | 6.9 | GO:0097010 | eukaryotic translation initiation factor 4F complex assembly(GO:0097010) |
| 1.7 | 5.1 | GO:0070407 | oxidation-dependent protein catabolic process(GO:0070407) |
| 1.7 | 3.4 | GO:0007206 | phospholipase C-activating G-protein coupled glutamate receptor signaling pathway(GO:0007206) |
| 1.7 | 10.1 | GO:2000324 | positive regulation of glucocorticoid receptor signaling pathway(GO:2000324) |
| 1.6 | 4.9 | GO:1905205 | positive regulation of connective tissue replacement(GO:1905205) |
| 1.6 | 4.8 | GO:0021718 | superior olivary nucleus development(GO:0021718) superior olivary nucleus maturation(GO:0021722) |
| 1.6 | 6.5 | GO:0071492 | cellular response to UV-A(GO:0071492) |
| 1.6 | 4.7 | GO:1903697 | negative regulation of microvillus assembly(GO:1903697) |
| 1.6 | 4.7 | GO:0035610 | protein side chain deglutamylation(GO:0035610) |
| 1.6 | 4.7 | GO:2000374 | cadmium ion homeostasis(GO:0055073) negative regulation of hydrogen peroxide catabolic process(GO:2000296) regulation of oxygen metabolic process(GO:2000374) |
| 1.5 | 1.5 | GO:0060699 | regulation of endoribonuclease activity(GO:0060699) |
| 1.5 | 12.3 | GO:0070995 | NADPH oxidation(GO:0070995) |
| 1.5 | 7.4 | GO:0042816 | vitamin B6 metabolic process(GO:0042816) |
| 1.5 | 10.2 | GO:0002175 | protein localization to paranode region of axon(GO:0002175) |
| 1.4 | 1.4 | GO:0002188 | translation reinitiation(GO:0002188) |
| 1.4 | 5.6 | GO:0006528 | asparagine metabolic process(GO:0006528) |
| 1.4 | 5.5 | GO:2000343 | positive regulation of chemokine (C-X-C motif) ligand 2 production(GO:2000343) |
| 1.4 | 4.1 | GO:1902309 | regulation of heart rate by hormone(GO:0003064) negative regulation of peptidyl-serine dephosphorylation(GO:1902309) |
| 1.4 | 1.4 | GO:0044208 | 'de novo' AMP biosynthetic process(GO:0044208) |
| 1.4 | 5.4 | GO:0001188 | RNA polymerase I transcriptional preinitiation complex assembly(GO:0001188) RNA polymerase I transcriptional preinitiation complex assembly at the promoter for the nuclear large rRNA transcript(GO:0001189) |
| 1.3 | 6.7 | GO:1904764 | negative regulation of fibril organization(GO:1902904) chaperone-mediated autophagy translocation complex disassembly(GO:1904764) |
| 1.3 | 5.3 | GO:1901895 | positive regulation of interferon-alpha biosynthetic process(GO:0045356) negative regulation of calcium-transporting ATPase activity(GO:1901895) |
| 1.3 | 4.0 | GO:0046098 | guanine metabolic process(GO:0046098) |
| 1.3 | 6.6 | GO:1905098 | negative regulation of guanyl-nucleotide exchange factor activity(GO:1905098) |
| 1.3 | 10.3 | GO:0046826 | negative regulation of protein export from nucleus(GO:0046826) |
| 1.3 | 7.7 | GO:0006540 | glutamate decarboxylation to succinate(GO:0006540) |
| 1.3 | 21.6 | GO:0090129 | positive regulation of synapse maturation(GO:0090129) |
| 1.3 | 3.8 | GO:1902938 | regulation of intracellular calcium activated chloride channel activity(GO:1902938) |
| 1.3 | 3.8 | GO:0090034 | regulation of chaperone-mediated protein complex assembly(GO:0090034) positive regulation of chaperone-mediated protein complex assembly(GO:0090035) |
| 1.3 | 15.1 | GO:0022417 | protein maturation by protein folding(GO:0022417) |
| 1.3 | 5.0 | GO:2001295 | malonyl-CoA biosynthetic process(GO:2001295) |
| 1.2 | 4.8 | GO:0050882 | voluntary musculoskeletal movement(GO:0050882) |
| 1.2 | 3.6 | GO:0001180 | transcription initiation from RNA polymerase I promoter for nuclear large rRNA transcript(GO:0001180) |
| 1.2 | 3.5 | GO:0033693 | neurofilament bundle assembly(GO:0033693) |
| 1.2 | 4.7 | GO:0008063 | Toll signaling pathway(GO:0008063) |
| 1.2 | 3.5 | GO:0036071 | N-glycan fucosylation(GO:0036071) |
| 1.2 | 10.4 | GO:0000395 | mRNA 5'-splice site recognition(GO:0000395) |
| 1.2 | 3.5 | GO:0070631 | spindle pole body duplication(GO:0030474) spindle pole body organization(GO:0051300) spindle pole body localization(GO:0070631) establishment of spindle pole body localization(GO:0070632) spindle pole body localization to nuclear envelope(GO:0071789) establishment of spindle pole body localization to nuclear envelope(GO:0071790) |
| 1.2 | 52.1 | GO:0035235 | ionotropic glutamate receptor signaling pathway(GO:0035235) |
| 1.1 | 10.2 | GO:0007008 | outer mitochondrial membrane organization(GO:0007008) |
| 1.1 | 3.4 | GO:1903939 | regulation of TORC2 signaling(GO:1903939) |
| 1.1 | 8.8 | GO:1902570 | protein localization to nucleolus(GO:1902570) |
| 1.1 | 10.7 | GO:0006189 | 'de novo' IMP biosynthetic process(GO:0006189) |
| 1.1 | 3.2 | GO:0006422 | aspartyl-tRNA aminoacylation(GO:0006422) |
| 1.1 | 2.1 | GO:0006106 | fumarate metabolic process(GO:0006106) |
| 1.1 | 6.3 | GO:0055059 | asymmetric neuroblast division(GO:0055059) |
| 1.1 | 1.1 | GO:0051885 | positive regulation of anagen(GO:0051885) |
| 1.0 | 7.3 | GO:0007256 | activation of JNKK activity(GO:0007256) |
| 1.0 | 2.1 | GO:1990523 | bone regeneration(GO:1990523) |
| 1.0 | 1.0 | GO:0008355 | olfactory learning(GO:0008355) |
| 1.0 | 1.0 | GO:0097324 | melanocyte migration(GO:0097324) |
| 1.0 | 4.0 | GO:0071894 | histone H2B conserved C-terminal lysine ubiquitination(GO:0071894) |
| 1.0 | 5.0 | GO:1903056 | regulation of melanosome organization(GO:1903056) |
| 1.0 | 5.0 | GO:1902075 | cellular response to salt(GO:1902075) |
| 1.0 | 6.0 | GO:0007023 | post-chaperonin tubulin folding pathway(GO:0007023) |
| 1.0 | 14.8 | GO:0090168 | Golgi reassembly(GO:0090168) |
| 1.0 | 4.9 | GO:2000769 | regulation of unidimensional cell growth(GO:0051510) negative regulation of unidimensional cell growth(GO:0051511) establishment of cell polarity regulating cell shape(GO:0071964) regulation of establishment or maintenance of cell polarity regulating cell shape(GO:2000769) positive regulation of establishment or maintenance of cell polarity regulating cell shape(GO:2000771) regulation of establishment of cell polarity regulating cell shape(GO:2000782) positive regulation of establishment of cell polarity regulating cell shape(GO:2000784) regulation of barbed-end actin filament capping(GO:2000812) positive regulation of barbed-end actin filament capping(GO:2000814) |
| 1.0 | 2.9 | GO:0033140 | negative regulation of peptidyl-serine phosphorylation of STAT protein(GO:0033140) |
| 1.0 | 2.0 | GO:1904351 | negative regulation of protein catabolic process in the vacuole(GO:1904351) negative regulation of lysosomal protein catabolic process(GO:1905166) |
| 1.0 | 5.8 | GO:0032328 | alanine transport(GO:0032328) |
| 1.0 | 2.9 | GO:0015883 | FAD transport(GO:0015883) FAD transmembrane transport(GO:0035350) |
| 1.0 | 1.0 | GO:0018171 | peptidyl-cysteine oxidation(GO:0018171) |
| 0.9 | 4.7 | GO:1902902 | negative regulation of autophagosome assembly(GO:1902902) |
| 0.9 | 2.8 | GO:0006428 | isoleucyl-tRNA aminoacylation(GO:0006428) |
| 0.9 | 2.8 | GO:0093001 | glycolysis from storage polysaccharide through glucose-1-phosphate(GO:0093001) |
| 0.9 | 8.1 | GO:0019509 | L-methionine biosynthetic process from methylthioadenosine(GO:0019509) |
| 0.9 | 3.6 | GO:0033563 | dorsal/ventral axon guidance(GO:0033563) |
| 0.9 | 1.8 | GO:0018312 | peptidyl-serine ADP-ribosylation(GO:0018312) |
| 0.9 | 2.6 | GO:1904530 | negative regulation of actin filament binding(GO:1904530) negative regulation of actin binding(GO:1904617) |
| 0.8 | 2.5 | GO:0035606 | peptidyl-cysteine S-trans-nitrosylation(GO:0035606) |
| 0.8 | 2.5 | GO:0043490 | malate-aspartate shuttle(GO:0043490) |
| 0.8 | 4.2 | GO:0032380 | regulation of intracellular lipid transport(GO:0032377) regulation of intracellular sterol transport(GO:0032380) regulation of intracellular cholesterol transport(GO:0032383) |
| 0.8 | 2.5 | GO:0090070 | positive regulation of ribosome biogenesis(GO:0090070) positive regulation of rRNA processing(GO:2000234) |
| 0.8 | 0.8 | GO:0021897 | forebrain astrocyte differentiation(GO:0021896) forebrain astrocyte development(GO:0021897) |
| 0.8 | 10.7 | GO:2001135 | regulation of endocytic recycling(GO:2001135) |
| 0.8 | 3.3 | GO:0000103 | sulfate assimilation(GO:0000103) |
| 0.8 | 25.4 | GO:0048268 | clathrin coat assembly(GO:0048268) |
| 0.8 | 3.3 | GO:0002572 | pro-T cell differentiation(GO:0002572) |
| 0.8 | 1.6 | GO:1990737 | response to manganese-induced endoplasmic reticulum stress(GO:1990737) |
| 0.8 | 14.5 | GO:0010510 | regulation of acetyl-CoA biosynthetic process from pyruvate(GO:0010510) |
| 0.8 | 3.2 | GO:0035425 | autocrine signaling(GO:0035425) |
| 0.8 | 17.6 | GO:0006851 | mitochondrial calcium ion transport(GO:0006851) |
| 0.8 | 9.6 | GO:0006108 | malate metabolic process(GO:0006108) |
| 0.8 | 2.4 | GO:2000173 | negative regulation of dendrite extension(GO:1903860) regulation of neuron remodeling(GO:1904799) negative regulation of neuron remodeling(GO:1904800) negative regulation of branching morphogenesis of a nerve(GO:2000173) |
| 0.8 | 2.4 | GO:0033341 | regulation of collagen binding(GO:0033341) |
| 0.8 | 4.0 | GO:0060718 | chorionic trophoblast cell differentiation(GO:0060718) |
| 0.8 | 6.2 | GO:1903690 | negative regulation of wound healing, spreading of epidermal cells(GO:1903690) |
| 0.8 | 2.3 | GO:0046294 | formaldehyde catabolic process(GO:0046294) |
| 0.8 | 2.3 | GO:1902951 | negative regulation of dendritic spine maintenance(GO:1902951) |
| 0.8 | 3.0 | GO:0010701 | positive regulation of norepinephrine secretion(GO:0010701) |
| 0.8 | 2.3 | GO:2000809 | positive regulation of synaptic vesicle clustering(GO:2000809) |
| 0.8 | 5.3 | GO:0007000 | nucleolus organization(GO:0007000) |
| 0.8 | 2.3 | GO:0032289 | central nervous system myelin formation(GO:0032289) |
| 0.8 | 5.3 | GO:0032097 | positive regulation of response to food(GO:0032097) positive regulation of appetite(GO:0032100) |
| 0.7 | 5.9 | GO:0070777 | D-aspartate transport(GO:0070777) D-aspartate import(GO:0070779) |
| 0.7 | 4.4 | GO:1902474 | positive regulation of protein localization to synapse(GO:1902474) |
| 0.7 | 7.2 | GO:0010265 | SCF complex assembly(GO:0010265) |
| 0.7 | 0.7 | GO:0033600 | negative regulation of mammary gland epithelial cell proliferation(GO:0033600) |
| 0.7 | 4.2 | GO:0006177 | GMP biosynthetic process(GO:0006177) |
| 0.7 | 2.1 | GO:0035927 | mitochondrial RNA 3'-end processing(GO:0000965) RNA import into mitochondrion(GO:0035927) rRNA import into mitochondrion(GO:0035928) |
| 0.7 | 7.6 | GO:0070389 | chaperone cofactor-dependent protein refolding(GO:0070389) |
| 0.7 | 8.3 | GO:0090084 | negative regulation of inclusion body assembly(GO:0090084) |
| 0.7 | 0.7 | GO:0009182 | purine deoxyribonucleoside diphosphate metabolic process(GO:0009182) dGDP metabolic process(GO:0046066) |
| 0.7 | 11.7 | GO:0042921 | glucocorticoid receptor signaling pathway(GO:0042921) |
| 0.7 | 2.7 | GO:1903978 | regulation of microglial cell activation(GO:1903978) |
| 0.7 | 2.7 | GO:0072675 | multinuclear osteoclast differentiation(GO:0072674) osteoclast fusion(GO:0072675) |
| 0.7 | 3.4 | GO:0019464 | glycine catabolic process(GO:0006546) glycine decarboxylation via glycine cleavage system(GO:0019464) |
| 0.7 | 2.7 | GO:2000437 | monocyte extravasation(GO:0035696) regulation of monocyte extravasation(GO:2000437) |
| 0.7 | 2.0 | GO:0035694 | mitochondrial protein catabolic process(GO:0035694) |
| 0.7 | 2.0 | GO:0051595 | response to methylglyoxal(GO:0051595) |
| 0.7 | 4.7 | GO:1904044 | response to aldosterone(GO:1904044) |
| 0.7 | 2.7 | GO:0019322 | pentose biosynthetic process(GO:0019322) |
| 0.7 | 2.0 | GO:0021530 | spinal cord oligodendrocyte cell differentiation(GO:0021529) spinal cord oligodendrocyte cell fate specification(GO:0021530) oligodendrocyte cell fate specification(GO:0021778) oligodendrocyte cell fate commitment(GO:0021779) glial cell fate specification(GO:0021780) |
| 0.7 | 2.0 | GO:1901624 | negative regulation of lymphocyte chemotaxis(GO:1901624) |
| 0.7 | 1.3 | GO:0008306 | associative learning(GO:0008306) |
| 0.6 | 6.5 | GO:1900038 | negative regulation of cellular response to hypoxia(GO:1900038) |
| 0.6 | 3.2 | GO:0072385 | minus-end-directed organelle transport along microtubule(GO:0072385) |
| 0.6 | 9.7 | GO:0034063 | stress granule assembly(GO:0034063) |
| 0.6 | 5.8 | GO:0010499 | proteasomal ubiquitin-independent protein catabolic process(GO:0010499) |
| 0.6 | 0.6 | GO:0090069 | regulation of ribosome biogenesis(GO:0090069) regulation of rRNA processing(GO:2000232) |
| 0.6 | 2.5 | GO:0001757 | somite specification(GO:0001757) |
| 0.6 | 7.0 | GO:0030150 | protein import into mitochondrial matrix(GO:0030150) |
| 0.6 | 5.7 | GO:0007196 | adenylate cyclase-inhibiting G-protein coupled glutamate receptor signaling pathway(GO:0007196) |
| 0.6 | 1.3 | GO:2000364 | regulation of STAT protein import into nucleus(GO:2000364) positive regulation of STAT protein import into nucleus(GO:2000366) |
| 0.6 | 2.5 | GO:0045541 | negative regulation of cholesterol biosynthetic process(GO:0045541) negative regulation of cholesterol metabolic process(GO:0090206) |
| 0.6 | 3.1 | GO:1903748 | negative regulation of establishment of protein localization to mitochondrion(GO:1903748) |
| 0.6 | 0.6 | GO:0071500 | cellular response to nitrosative stress(GO:0071500) |
| 0.6 | 5.0 | GO:0051388 | positive regulation of neurotrophin TRK receptor signaling pathway(GO:0051388) |
| 0.6 | 3.1 | GO:1900063 | regulation of peroxisome organization(GO:1900063) |
| 0.6 | 12.1 | GO:0032012 | regulation of ARF protein signal transduction(GO:0032012) |
| 0.6 | 4.8 | GO:0006933 | negative regulation of cell adhesion involved in substrate-bound cell migration(GO:0006933) |
| 0.6 | 3.0 | GO:0097338 | response to clozapine(GO:0097338) |
| 0.6 | 4.7 | GO:0072603 | interleukin-5 secretion(GO:0072603) regulation of interleukin-5 secretion(GO:2000662) |
| 0.6 | 1.2 | GO:0042776 | mitochondrial ATP synthesis coupled proton transport(GO:0042776) |
| 0.6 | 24.7 | GO:0007214 | gamma-aminobutyric acid signaling pathway(GO:0007214) |
| 0.6 | 6.4 | GO:0090232 | positive regulation of spindle checkpoint(GO:0090232) |
| 0.6 | 2.9 | GO:0045903 | positive regulation of translational fidelity(GO:0045903) |
| 0.6 | 1.7 | GO:0035948 | positive regulation of gluconeogenesis by positive regulation of transcription from RNA polymerase II promoter(GO:0035948) |
| 0.6 | 3.5 | GO:0015853 | adenine transport(GO:0015853) |
| 0.6 | 2.3 | GO:0051835 | positive regulation of synapse structural plasticity(GO:0051835) |
| 0.6 | 2.3 | GO:0015910 | peroxisomal long-chain fatty acid import(GO:0015910) |
| 0.6 | 5.6 | GO:0051096 | positive regulation of helicase activity(GO:0051096) |
| 0.6 | 4.4 | GO:0032482 | Rab protein signal transduction(GO:0032482) |
| 0.6 | 13.3 | GO:0007035 | vacuolar acidification(GO:0007035) |
| 0.5 | 2.7 | GO:0003219 | cardiac right ventricle formation(GO:0003219) |
| 0.5 | 2.2 | GO:0046122 | purine deoxyribonucleoside metabolic process(GO:0046122) |
| 0.5 | 1.6 | GO:1901301 | regulation of cargo loading into COPII-coated vesicle(GO:1901301) |
| 0.5 | 2.2 | GO:2000686 | regulation of rubidium ion transmembrane transporter activity(GO:2000686) |
| 0.5 | 2.2 | GO:0016259 | selenocysteine metabolic process(GO:0016259) |
| 0.5 | 2.7 | GO:0033314 | mitotic DNA replication checkpoint(GO:0033314) |
| 0.5 | 1.1 | GO:0070093 | negative regulation of glucagon secretion(GO:0070093) |
| 0.5 | 2.1 | GO:0090402 | oncogene-induced cell senescence(GO:0090402) |
| 0.5 | 2.1 | GO:0019918 | peptidyl-arginine methylation, to symmetrical-dimethyl arginine(GO:0019918) |
| 0.5 | 3.2 | GO:0006561 | proline biosynthetic process(GO:0006561) L-proline biosynthetic process(GO:0055129) |
| 0.5 | 3.1 | GO:0051085 | chaperone mediated protein folding requiring cofactor(GO:0051085) |
| 0.5 | 1.6 | GO:1903070 | negative regulation of ER-associated ubiquitin-dependent protein catabolic process(GO:1903070) |
| 0.5 | 2.1 | GO:0006556 | S-adenosylmethionine biosynthetic process(GO:0006556) |
| 0.5 | 2.6 | GO:0070131 | positive regulation of mitochondrial translation(GO:0070131) |
| 0.5 | 6.6 | GO:0006089 | lactate metabolic process(GO:0006089) |
| 0.5 | 3.0 | GO:2000821 | regulation of grooming behavior(GO:2000821) |
| 0.5 | 20.1 | GO:0006363 | termination of RNA polymerase I transcription(GO:0006363) |
| 0.5 | 3.0 | GO:0046940 | nucleoside monophosphate phosphorylation(GO:0046940) |
| 0.5 | 3.5 | GO:2000503 | regulation of natural killer cell chemotaxis(GO:2000501) positive regulation of natural killer cell chemotaxis(GO:2000503) |
| 0.5 | 2.5 | GO:0070966 | nuclear-transcribed mRNA catabolic process, no-go decay(GO:0070966) |
| 0.5 | 0.5 | GO:1901079 | positive regulation of relaxation of muscle(GO:1901079) |
| 0.5 | 1.5 | GO:1904924 | negative regulation of mitophagy in response to mitochondrial depolarization(GO:1904924) |
| 0.5 | 3.9 | GO:0032790 | ribosome disassembly(GO:0032790) |
| 0.5 | 1.5 | GO:0038098 | sequestering of BMP from receptor via BMP binding(GO:0038098) |
| 0.5 | 1.5 | GO:1900226 | positive regulation of oocyte maturation(GO:1900195) negative regulation of NLRP3 inflammasome complex assembly(GO:1900226) |
| 0.5 | 2.4 | GO:1903333 | negative regulation of protein folding(GO:1903333) |
| 0.5 | 6.2 | GO:1904871 | regulation of protein localization to Cajal body(GO:1904869) positive regulation of protein localization to Cajal body(GO:1904871) |
| 0.5 | 0.9 | GO:0036481 | intrinsic apoptotic signaling pathway in response to hydrogen peroxide(GO:0036481) regulation of intrinsic apoptotic signaling pathway in response to hydrogen peroxide(GO:1903750) negative regulation of intrinsic apoptotic signaling pathway in response to hydrogen peroxide(GO:1903751) |
| 0.5 | 1.4 | GO:1901297 | arterial endothelial cell fate commitment(GO:0060844) blood vessel lumenization(GO:0072554) positive regulation of ephrin receptor signaling pathway(GO:1901189) positive regulation of canonical Wnt signaling pathway involved in cardiac muscle cell fate commitment(GO:1901297) positive regulation of canonical Wnt signaling pathway involved in heart development(GO:1905068) |
| 0.5 | 6.1 | GO:0071257 | cellular response to electrical stimulus(GO:0071257) |
| 0.5 | 1.9 | GO:0071802 | negative regulation of podosome assembly(GO:0071802) |
| 0.5 | 4.2 | GO:0002098 | tRNA wobble uridine modification(GO:0002098) |
| 0.5 | 2.3 | GO:0048690 | regulation of sprouting of injured axon(GO:0048686) regulation of axon extension involved in regeneration(GO:0048690) |
| 0.5 | 32.6 | GO:0070125 | mitochondrial translational elongation(GO:0070125) mitochondrial translational termination(GO:0070126) |
| 0.5 | 1.4 | GO:0006421 | asparaginyl-tRNA aminoacylation(GO:0006421) |
| 0.4 | 3.1 | GO:0050915 | sensory perception of sour taste(GO:0050915) |
| 0.4 | 11.7 | GO:0031116 | positive regulation of microtubule polymerization(GO:0031116) |
| 0.4 | 1.8 | GO:0006432 | phenylalanyl-tRNA aminoacylation(GO:0006432) |
| 0.4 | 2.7 | GO:0018343 | protein farnesylation(GO:0018343) |
| 0.4 | 1.8 | GO:0006498 | N-terminal protein lipidation(GO:0006498) |
| 0.4 | 0.9 | GO:0000479 | endonucleolytic cleavage of tricistronic rRNA transcript (SSU-rRNA, 5.8S rRNA, LSU-rRNA)(GO:0000479) |
| 0.4 | 16.6 | GO:0009214 | cyclic nucleotide catabolic process(GO:0009214) |
| 0.4 | 1.7 | GO:0090038 | negative regulation of protein kinase C signaling(GO:0090038) |
| 0.4 | 2.5 | GO:0051012 | microtubule sliding(GO:0051012) |
| 0.4 | 0.8 | GO:0070213 | protein auto-ADP-ribosylation(GO:0070213) |
| 0.4 | 0.8 | GO:0021979 | hypothalamus cell differentiation(GO:0021979) |
| 0.4 | 13.1 | GO:0008045 | motor neuron axon guidance(GO:0008045) |
| 0.4 | 4.6 | GO:1904321 | response to forskolin(GO:1904321) cellular response to forskolin(GO:1904322) |
| 0.4 | 3.3 | GO:0006659 | phosphatidylserine biosynthetic process(GO:0006659) |
| 0.4 | 3.7 | GO:0045716 | positive regulation of low-density lipoprotein particle receptor biosynthetic process(GO:0045716) |
| 0.4 | 0.4 | GO:0070602 | regulation of centromeric sister chromatid cohesion(GO:0070602) |
| 0.4 | 2.8 | GO:0045007 | depurination(GO:0045007) |
| 0.4 | 6.9 | GO:0006750 | glutathione biosynthetic process(GO:0006750) |
| 0.4 | 0.8 | GO:0034036 | purine ribonucleoside bisphosphate biosynthetic process(GO:0034036) 3'-phosphoadenosine 5'-phosphosulfate biosynthetic process(GO:0050428) |
| 0.4 | 2.0 | GO:0033489 | cholesterol biosynthetic process via desmosterol(GO:0033489) cholesterol biosynthetic process via lathosterol(GO:0033490) |
| 0.4 | 21.5 | GO:0045540 | regulation of cholesterol biosynthetic process(GO:0045540) |
| 0.4 | 1.2 | GO:0006788 | heme oxidation(GO:0006788) |
| 0.4 | 1.2 | GO:0071816 | tail-anchored membrane protein insertion into ER membrane(GO:0071816) |
| 0.4 | 6.1 | GO:0090360 | platelet-derived growth factor production(GO:0090360) regulation of platelet-derived growth factor production(GO:0090361) |
| 0.4 | 3.5 | GO:0002911 | lymphocyte anergy(GO:0002249) regulation of T cell anergy(GO:0002667) T cell anergy(GO:0002870) regulation of lymphocyte anergy(GO:0002911) |
| 0.4 | 1.5 | GO:0031648 | protein destabilization(GO:0031648) |
| 0.4 | 3.1 | GO:0014052 | regulation of gamma-aminobutyric acid secretion(GO:0014052) |
| 0.4 | 0.4 | GO:0060300 | regulation of cytokine activity(GO:0060300) |
| 0.4 | 1.1 | GO:0009407 | toxin catabolic process(GO:0009407) secondary metabolite catabolic process(GO:0090487) |
| 0.4 | 4.9 | GO:0033182 | regulation of histone ubiquitination(GO:0033182) |
| 0.4 | 11.6 | GO:0006101 | citrate metabolic process(GO:0006101) |
| 0.4 | 6.6 | GO:1901897 | regulation of relaxation of cardiac muscle(GO:1901897) |
| 0.4 | 2.2 | GO:0060075 | regulation of resting membrane potential(GO:0060075) |
| 0.4 | 1.5 | GO:1900042 | positive regulation of interleukin-2 secretion(GO:1900042) |
| 0.4 | 2.9 | GO:0086036 | regulation of cardiac muscle cell membrane potential(GO:0086036) |
| 0.4 | 2.2 | GO:0010724 | regulation of definitive erythrocyte differentiation(GO:0010724) |
| 0.4 | 6.4 | GO:0009162 | deoxyribonucleoside monophosphate metabolic process(GO:0009162) |
| 0.4 | 1.1 | GO:0043461 | proton-transporting ATP synthase complex assembly(GO:0043461) proton-transporting ATP synthase complex biogenesis(GO:0070272) |
| 0.3 | 11.8 | GO:0042407 | cristae formation(GO:0042407) |
| 0.3 | 1.0 | GO:0097112 | gamma-aminobutyric acid receptor clustering(GO:0097112) |
| 0.3 | 0.7 | GO:1900040 | regulation of interleukin-2 secretion(GO:1900040) negative regulation of interleukin-2 secretion(GO:1900041) |
| 0.3 | 5.5 | GO:0099517 | anterograde synaptic vesicle transport(GO:0048490) synaptic vesicle cytoskeletal transport(GO:0099514) synaptic vesicle transport along microtubule(GO:0099517) |
| 0.3 | 3.4 | GO:0008216 | spermidine metabolic process(GO:0008216) |
| 0.3 | 0.7 | GO:0036337 | Fas signaling pathway(GO:0036337) |
| 0.3 | 6.8 | GO:0006123 | mitochondrial electron transport, cytochrome c to oxygen(GO:0006123) |
| 0.3 | 1.0 | GO:0014043 | negative regulation of neuron maturation(GO:0014043) |
| 0.3 | 1.7 | GO:0016080 | synaptic vesicle targeting(GO:0016080) |
| 0.3 | 0.7 | GO:0002904 | positive regulation of B cell apoptotic process(GO:0002904) |
| 0.3 | 2.3 | GO:0050859 | negative regulation of B cell receptor signaling pathway(GO:0050859) |
| 0.3 | 18.0 | GO:0000381 | regulation of alternative mRNA splicing, via spliceosome(GO:0000381) |
| 0.3 | 3.3 | GO:0019800 | peptide cross-linking via chondroitin 4-sulfate glycosaminoglycan(GO:0019800) |
| 0.3 | 4.5 | GO:0060907 | positive regulation of macrophage cytokine production(GO:0060907) |
| 0.3 | 2.9 | GO:0006987 | activation of signaling protein activity involved in unfolded protein response(GO:0006987) |
| 0.3 | 1.3 | GO:0060155 | platelet dense granule organization(GO:0060155) |
| 0.3 | 1.0 | GO:0021800 | cerebral cortex tangential migration(GO:0021800) |
| 0.3 | 1.0 | GO:0015920 | lipopolysaccharide transport(GO:0015920) |
| 0.3 | 2.5 | GO:2000172 | regulation of branching morphogenesis of a nerve(GO:2000172) |
| 0.3 | 1.6 | GO:0070127 | tRNA aminoacylation for mitochondrial protein translation(GO:0070127) |
| 0.3 | 8.2 | GO:0034204 | lipid translocation(GO:0034204) phospholipid translocation(GO:0045332) |
| 0.3 | 1.9 | GO:0006642 | triglyceride mobilization(GO:0006642) |
| 0.3 | 0.9 | GO:0043137 | DNA replication, removal of RNA primer(GO:0043137) |
| 0.3 | 1.2 | GO:1902035 | positive regulation of hematopoietic stem cell proliferation(GO:1902035) |
| 0.3 | 2.8 | GO:0002315 | marginal zone B cell differentiation(GO:0002315) |
| 0.3 | 1.5 | GO:1904816 | positive regulation of protein localization to chromosome, telomeric region(GO:1904816) |
| 0.3 | 0.6 | GO:0099622 | membrane repolarization during cardiac muscle cell action potential(GO:0086013) cardiac muscle cell membrane repolarization(GO:0099622) atrial cardiac muscle cell membrane repolarization(GO:0099624) |
| 0.3 | 1.8 | GO:0016198 | axon choice point recognition(GO:0016198) |
| 0.3 | 1.2 | GO:0019264 | glycine biosynthetic process from serine(GO:0019264) |
| 0.3 | 1.5 | GO:0006003 | fructose 2,6-bisphosphate metabolic process(GO:0006003) |
| 0.3 | 0.9 | GO:0008616 | queuosine biosynthetic process(GO:0008616) queuosine metabolic process(GO:0046116) |
| 0.3 | 1.5 | GO:0071233 | cellular response to leucine(GO:0071233) |
| 0.3 | 0.9 | GO:1903348 | positive regulation of bicellular tight junction assembly(GO:1903348) |
| 0.3 | 10.5 | GO:0000027 | ribosomal large subunit assembly(GO:0000027) |
| 0.3 | 0.9 | GO:0030327 | prenylated protein catabolic process(GO:0030327) |
| 0.3 | 6.2 | GO:0034389 | lipid particle organization(GO:0034389) |
| 0.3 | 1.2 | GO:2001288 | positive regulation of caveolin-mediated endocytosis(GO:2001288) |
| 0.3 | 3.8 | GO:0001921 | positive regulation of receptor recycling(GO:0001921) |
| 0.3 | 1.7 | GO:0030174 | regulation of DNA-dependent DNA replication initiation(GO:0030174) |
| 0.3 | 0.3 | GO:0031291 | Ran protein signal transduction(GO:0031291) |
| 0.3 | 3.1 | GO:2000580 | positive regulation of microtubule motor activity(GO:2000576) regulation of ATP-dependent microtubule motor activity, plus-end-directed(GO:2000580) positive regulation of ATP-dependent microtubule motor activity, plus-end-directed(GO:2000582) |
| 0.3 | 6.6 | GO:0006370 | 7-methylguanosine mRNA capping(GO:0006370) |
| 0.3 | 0.3 | GO:0010813 | neuropeptide catabolic process(GO:0010813) |
| 0.3 | 0.8 | GO:0014022 | neural plate elongation(GO:0014022) convergent extension involved in neural plate elongation(GO:0022007) |
| 0.3 | 0.6 | GO:0033590 | response to cobalamin(GO:0033590) |
| 0.3 | 6.8 | GO:0030208 | dermatan sulfate biosynthetic process(GO:0030208) |
| 0.3 | 0.8 | GO:0090646 | mitochondrial tRNA processing(GO:0090646) |
| 0.3 | 1.4 | GO:1904879 | positive regulation of calcium ion transmembrane transport via high voltage-gated calcium channel(GO:1904879) |
| 0.3 | 1.1 | GO:0006238 | CMP salvage(GO:0006238) CMP biosynthetic process(GO:0009224) CMP metabolic process(GO:0046035) |
| 0.3 | 0.8 | GO:2001206 | positive regulation of osteoclast development(GO:2001206) |
| 0.3 | 0.8 | GO:0006286 | base-excision repair, base-free sugar-phosphate removal(GO:0006286) |
| 0.3 | 6.4 | GO:0035067 | negative regulation of histone acetylation(GO:0035067) |
| 0.3 | 0.8 | GO:1990519 | pyrimidine nucleotide transport(GO:0006864) mitochondrial pyrimidine nucleotide import(GO:1990519) |
| 0.3 | 0.8 | GO:0032290 | peripheral nervous system myelin formation(GO:0032290) |
| 0.3 | 0.5 | GO:0070256 | negative regulation of circadian sleep/wake cycle, non-REM sleep(GO:0042323) negative regulation of mucus secretion(GO:0070256) |
| 0.3 | 0.3 | GO:0061034 | olfactory bulb mitral cell layer development(GO:0061034) |
| 0.3 | 1.8 | GO:2000300 | regulation of synaptic vesicle exocytosis(GO:2000300) |
| 0.3 | 4.4 | GO:0030277 | maintenance of gastrointestinal epithelium(GO:0030277) |
| 0.3 | 1.8 | GO:1903859 | regulation of dendrite extension(GO:1903859) positive regulation of dendrite extension(GO:1903861) |
| 0.3 | 1.8 | GO:1903679 | regulation of cap-independent translational initiation(GO:1903677) positive regulation of cap-independent translational initiation(GO:1903679) regulation of cytoplasmic translational initiation(GO:1904688) positive regulation of cytoplasmic translational initiation(GO:1904690) |
| 0.3 | 1.0 | GO:0001887 | selenium compound metabolic process(GO:0001887) |
| 0.3 | 4.1 | GO:0009154 | purine ribonucleotide catabolic process(GO:0009154) |
| 0.3 | 0.5 | GO:0009181 | purine nucleoside diphosphate catabolic process(GO:0009137) purine ribonucleoside diphosphate catabolic process(GO:0009181) |
| 0.3 | 2.8 | GO:0070262 | peptidyl-serine dephosphorylation(GO:0070262) |
| 0.3 | 3.0 | GO:0061339 | establishment of monopolar cell polarity(GO:0061162) establishment or maintenance of monopolar cell polarity(GO:0061339) |
| 0.3 | 1.0 | GO:1902037 | negative regulation of hematopoietic stem cell differentiation(GO:1902037) |
| 0.3 | 2.0 | GO:0045722 | positive regulation of gluconeogenesis(GO:0045722) |
| 0.3 | 0.8 | GO:0043012 | regulation of fusion of sperm to egg plasma membrane(GO:0043012) |
| 0.2 | 1.0 | GO:0035879 | plasma membrane lactate transport(GO:0035879) |
| 0.2 | 0.5 | GO:0006842 | tricarboxylic acid transport(GO:0006842) citrate transport(GO:0015746) |
| 0.2 | 0.7 | GO:0002097 | tRNA wobble base modification(GO:0002097) |
| 0.2 | 1.2 | GO:2001034 | positive regulation of double-strand break repair via nonhomologous end joining(GO:2001034) |
| 0.2 | 0.2 | GO:0035411 | catenin import into nucleus(GO:0035411) |
| 0.2 | 1.0 | GO:0019046 | release from viral latency(GO:0019046) gene conversion(GO:0035822) |
| 0.2 | 1.0 | GO:0044375 | regulation of peroxisome size(GO:0044375) |
| 0.2 | 1.2 | GO:0035234 | ectopic germ cell programmed cell death(GO:0035234) |
| 0.2 | 1.7 | GO:2000111 | positive regulation of macrophage apoptotic process(GO:2000111) |
| 0.2 | 1.7 | GO:2000049 | positive regulation of cell-cell adhesion mediated by cadherin(GO:2000049) |
| 0.2 | 0.7 | GO:0010025 | wax biosynthetic process(GO:0010025) wax metabolic process(GO:0010166) |
| 0.2 | 0.9 | GO:0051754 | meiotic sister chromatid cohesion, centromeric(GO:0051754) |
| 0.2 | 1.6 | GO:0035414 | negative regulation of catenin import into nucleus(GO:0035414) |
| 0.2 | 1.2 | GO:1990034 | calcium ion export from cell(GO:1990034) |
| 0.2 | 2.8 | GO:2000678 | negative regulation of transcription regulatory region DNA binding(GO:2000678) |
| 0.2 | 1.2 | GO:0032264 | IMP salvage(GO:0032264) |
| 0.2 | 2.1 | GO:0018916 | nitrobenzene metabolic process(GO:0018916) |
| 0.2 | 17.7 | GO:1900181 | negative regulation of protein localization to nucleus(GO:1900181) |
| 0.2 | 1.6 | GO:0042045 | epithelial fluid transport(GO:0042045) |
| 0.2 | 3.2 | GO:1904152 | regulation of retrograde protein transport, ER to cytosol(GO:1904152) |
| 0.2 | 4.5 | GO:0061157 | mRNA destabilization(GO:0061157) |
| 0.2 | 2.9 | GO:0070327 | thyroid hormone transport(GO:0070327) |
| 0.2 | 7.3 | GO:0050885 | neuromuscular process controlling balance(GO:0050885) |
| 0.2 | 2.2 | GO:0060137 | maternal process involved in parturition(GO:0060137) |
| 0.2 | 0.7 | GO:0030046 | parallel actin filament bundle assembly(GO:0030046) |
| 0.2 | 1.7 | GO:0090672 | RNA localization to Cajal body(GO:0090670) telomerase RNA localization to Cajal body(GO:0090671) telomerase RNA localization(GO:0090672) regulation of telomerase RNA localization to Cajal body(GO:1904872) |
| 0.2 | 5.9 | GO:0046034 | ATP metabolic process(GO:0046034) |
| 0.2 | 0.4 | GO:0046545 | female gonad development(GO:0008585) development of primary female sexual characteristics(GO:0046545) |
| 0.2 | 1.3 | GO:1901838 | positive regulation of transcription of nuclear large rRNA transcript from RNA polymerase I promoter(GO:1901838) |
| 0.2 | 1.1 | GO:0033031 | positive regulation of neutrophil apoptotic process(GO:0033031) |
| 0.2 | 0.7 | GO:0006269 | DNA replication, synthesis of RNA primer(GO:0006269) |
| 0.2 | 2.6 | GO:0045793 | positive regulation of cell size(GO:0045793) |
| 0.2 | 3.7 | GO:0007191 | adenylate cyclase-activating dopamine receptor signaling pathway(GO:0007191) |
| 0.2 | 3.0 | GO:0015991 | energy coupled proton transmembrane transport, against electrochemical gradient(GO:0015988) ATP hydrolysis coupled proton transport(GO:0015991) |
| 0.2 | 2.1 | GO:0030951 | establishment or maintenance of microtubule cytoskeleton polarity(GO:0030951) |
| 0.2 | 1.9 | GO:0045039 | protein import into mitochondrial inner membrane(GO:0045039) |
| 0.2 | 2.5 | GO:0071447 | cellular response to hydroperoxide(GO:0071447) |
| 0.2 | 1.3 | GO:0051643 | secretory granule localization(GO:0032252) endoplasmic reticulum localization(GO:0051643) |
| 0.2 | 1.3 | GO:0017196 | N-terminal peptidyl-methionine acetylation(GO:0017196) |
| 0.2 | 7.2 | GO:0042417 | dopamine metabolic process(GO:0042417) |
| 0.2 | 0.6 | GO:0072709 | cellular response to sorbitol(GO:0072709) |
| 0.2 | 0.4 | GO:0000055 | ribosomal large subunit export from nucleus(GO:0000055) |
| 0.2 | 4.5 | GO:0030488 | tRNA methylation(GO:0030488) |
| 0.2 | 0.8 | GO:1903278 | regulation of sodium ion export(GO:1903273) positive regulation of sodium ion export(GO:1903275) regulation of sodium ion export from cell(GO:1903276) positive regulation of sodium ion export from cell(GO:1903278) positive regulation of potassium ion import(GO:1903288) |
| 0.2 | 0.6 | GO:0060762 | regulation of branching involved in mammary gland duct morphogenesis(GO:0060762) |
| 0.2 | 0.4 | GO:0032688 | negative regulation of interferon-beta production(GO:0032688) |
| 0.2 | 0.6 | GO:0007379 | segment specification(GO:0007379) |
| 0.2 | 0.6 | GO:0032594 | protein transport within lipid bilayer(GO:0032594) protein transport into membrane raft(GO:0032596) |
| 0.2 | 0.8 | GO:0072114 | pronephros morphogenesis(GO:0072114) |
| 0.2 | 2.0 | GO:0032543 | mitochondrial translation(GO:0032543) |
| 0.2 | 0.2 | GO:0006273 | lagging strand elongation(GO:0006273) |
| 0.2 | 1.0 | GO:0055064 | chloride ion homeostasis(GO:0055064) |
| 0.2 | 1.0 | GO:0010956 | negative regulation of calcidiol 1-monooxygenase activity(GO:0010956) |
| 0.2 | 1.9 | GO:0034356 | NAD biosynthesis via nicotinamide riboside salvage pathway(GO:0034356) |
| 0.2 | 1.0 | GO:1900264 | regulation of DNA-directed DNA polymerase activity(GO:1900262) positive regulation of DNA-directed DNA polymerase activity(GO:1900264) |
| 0.2 | 0.6 | GO:0033133 | positive regulation of glucokinase activity(GO:0033133) regulation of gluconeogenesis involved in cellular glucose homeostasis(GO:0090526) positive regulation of hexokinase activity(GO:1903301) |
| 0.2 | 0.8 | GO:1990504 | dense core granule exocytosis(GO:1990504) |
| 0.2 | 0.8 | GO:0033132 | negative regulation of glucokinase activity(GO:0033132) negative regulation of hexokinase activity(GO:1903300) |
| 0.2 | 8.5 | GO:0010501 | RNA secondary structure unwinding(GO:0010501) |
| 0.2 | 1.3 | GO:0070459 | prolactin secretion(GO:0070459) |
| 0.2 | 1.5 | GO:0006013 | mannose metabolic process(GO:0006013) |
| 0.2 | 1.3 | GO:0031666 | positive regulation of lipopolysaccharide-mediated signaling pathway(GO:0031666) |
| 0.2 | 6.1 | GO:0008542 | visual learning(GO:0008542) |
| 0.2 | 0.4 | GO:0033567 | DNA replication, Okazaki fragment processing(GO:0033567) |
| 0.2 | 1.3 | GO:0032042 | mitochondrial DNA replication(GO:0006264) mitochondrial DNA metabolic process(GO:0032042) |
| 0.2 | 0.4 | GO:0009180 | purine nucleoside diphosphate biosynthetic process(GO:0009136) purine ribonucleoside diphosphate biosynthetic process(GO:0009180) ribonucleoside diphosphate biosynthetic process(GO:0009188) |
| 0.2 | 0.5 | GO:0070212 | protein poly-ADP-ribosylation(GO:0070212) |
| 0.2 | 3.2 | GO:0090005 | negative regulation of establishment of protein localization to plasma membrane(GO:0090005) |
| 0.2 | 0.5 | GO:0038193 | thromboxane A2 signaling pathway(GO:0038193) |
| 0.2 | 1.1 | GO:0016078 | tRNA catabolic process(GO:0016078) |
| 0.2 | 1.1 | GO:0015074 | DNA integration(GO:0015074) |
| 0.2 | 2.8 | GO:0006379 | mRNA cleavage(GO:0006379) |
| 0.2 | 3.0 | GO:0000028 | ribosomal small subunit assembly(GO:0000028) |
| 0.2 | 0.7 | GO:1902231 | positive regulation of intrinsic apoptotic signaling pathway in response to DNA damage(GO:1902231) |
| 0.2 | 0.7 | GO:0043392 | negative regulation of DNA binding(GO:0043392) |
| 0.2 | 1.4 | GO:0038007 | netrin-activated signaling pathway(GO:0038007) |
| 0.2 | 2.7 | GO:0045948 | positive regulation of translational initiation(GO:0045948) |
| 0.2 | 1.4 | GO:0032020 | ISG15-protein conjugation(GO:0032020) |
| 0.2 | 3.6 | GO:1900449 | regulation of glutamate receptor signaling pathway(GO:1900449) |
| 0.2 | 0.7 | GO:1903826 | arginine transmembrane transport(GO:1903826) |
| 0.2 | 0.7 | GO:0098706 | ferric iron import into cell(GO:0097461) ferric iron import across plasma membrane(GO:0098706) |
| 0.2 | 0.2 | GO:0001922 | B-1 B cell homeostasis(GO:0001922) |
| 0.2 | 3.2 | GO:0032211 | negative regulation of telomere maintenance via telomerase(GO:0032211) |
| 0.2 | 1.2 | GO:0060753 | regulation of mast cell chemotaxis(GO:0060753) |
| 0.2 | 0.5 | GO:0042350 | GDP-L-fucose biosynthetic process(GO:0042350) 'de novo' GDP-L-fucose biosynthetic process(GO:0042351) |
| 0.2 | 0.5 | GO:0022614 | membrane to membrane docking(GO:0022614) |
| 0.2 | 0.2 | GO:1902954 | regulation of early endosome to recycling endosome transport(GO:1902954) |
| 0.2 | 0.7 | GO:0046928 | regulation of neurotransmitter secretion(GO:0046928) |
| 0.2 | 1.8 | GO:0007084 | mitotic nuclear envelope reassembly(GO:0007084) |
| 0.2 | 0.8 | GO:0060339 | negative regulation of type I interferon-mediated signaling pathway(GO:0060339) |
| 0.2 | 6.9 | GO:0071431 | tRNA export from nucleus(GO:0006409) tRNA-containing ribonucleoprotein complex export from nucleus(GO:0071431) |
| 0.2 | 2.3 | GO:0006336 | DNA replication-independent nucleosome assembly(GO:0006336) DNA replication-independent nucleosome organization(GO:0034724) |
| 0.2 | 0.6 | GO:0072423 | response to cell cycle checkpoint signaling(GO:0072396) response to DNA integrity checkpoint signaling(GO:0072402) response to DNA damage checkpoint signaling(GO:0072423) |
| 0.2 | 0.6 | GO:0061469 | regulation of type B pancreatic cell proliferation(GO:0061469) |
| 0.2 | 1.9 | GO:0016446 | somatic diversification of immune receptors via somatic mutation(GO:0002566) somatic hypermutation of immunoglobulin genes(GO:0016446) |
| 0.2 | 1.1 | GO:0080182 | histone H3-K4 trimethylation(GO:0080182) |
| 0.2 | 1.1 | GO:0008090 | retrograde axonal transport(GO:0008090) |
| 0.2 | 2.7 | GO:0033234 | negative regulation of protein sumoylation(GO:0033234) |
| 0.2 | 1.1 | GO:0036155 | acylglycerol acyl-chain remodeling(GO:0036155) regulation of endocannabinoid signaling pathway(GO:2000124) |
| 0.2 | 1.4 | GO:0048096 | chromatin-mediated maintenance of transcription(GO:0048096) |
| 0.2 | 0.9 | GO:0006616 | SRP-dependent cotranslational protein targeting to membrane, translocation(GO:0006616) |
| 0.2 | 0.6 | GO:0035712 | T-helper 2 cell activation(GO:0035712) regulation of T-helper 2 cell activation(GO:2000569) positive regulation of T-helper 2 cell activation(GO:2000570) |
| 0.2 | 0.6 | GO:0048388 | endosomal lumen acidification(GO:0048388) |
| 0.2 | 1.4 | GO:0007616 | long-term memory(GO:0007616) |
| 0.2 | 1.2 | GO:1904776 | regulation of protein localization to cell cortex(GO:1904776) positive regulation of protein localization to cell cortex(GO:1904778) |
| 0.2 | 13.0 | GO:0050806 | positive regulation of synaptic transmission(GO:0050806) |
| 0.2 | 0.6 | GO:0002545 | chronic inflammatory response to non-antigenic stimulus(GO:0002545) positive regulation of chronic inflammatory response(GO:0002678) regulation of chronic inflammatory response to non-antigenic stimulus(GO:0002880) |
| 0.2 | 0.6 | GO:0034983 | peptidyl-lysine deacetylation(GO:0034983) |
| 0.2 | 5.5 | GO:0006735 | NADH regeneration(GO:0006735) canonical glycolysis(GO:0061621) glucose catabolic process to pyruvate(GO:0061718) |
| 0.1 | 2.2 | GO:0071625 | vocalization behavior(GO:0071625) |
| 0.1 | 1.3 | GO:0043578 | nuclear matrix organization(GO:0043578) nuclear matrix anchoring at nuclear membrane(GO:0090292) |
| 0.1 | 0.6 | GO:0045715 | negative regulation of low-density lipoprotein particle receptor biosynthetic process(GO:0045715) |
| 0.1 | 0.6 | GO:0038026 | reelin-mediated signaling pathway(GO:0038026) |
| 0.1 | 1.9 | GO:0034975 | protein folding in endoplasmic reticulum(GO:0034975) |
| 0.1 | 0.9 | GO:2000400 | positive regulation of T cell differentiation in thymus(GO:0033089) positive regulation of thymocyte aggregation(GO:2000400) |
| 0.1 | 2.2 | GO:0002430 | complement receptor mediated signaling pathway(GO:0002430) |
| 0.1 | 2.6 | GO:0006695 | cholesterol biosynthetic process(GO:0006695) |
| 0.1 | 6.8 | GO:0043486 | histone exchange(GO:0043486) |
| 0.1 | 3.3 | GO:0060261 | positive regulation of transcription initiation from RNA polymerase II promoter(GO:0060261) |
| 0.1 | 0.6 | GO:2000270 | negative regulation of fibroblast apoptotic process(GO:2000270) |
| 0.1 | 1.6 | GO:0032703 | negative regulation of interleukin-2 production(GO:0032703) |
| 0.1 | 0.4 | GO:1903238 | positive regulation of leukocyte tethering or rolling(GO:1903238) |
| 0.1 | 11.3 | GO:0030516 | regulation of axon extension(GO:0030516) |
| 0.1 | 1.5 | GO:0019885 | antigen processing and presentation of endogenous peptide antigen via MHC class I(GO:0019885) |
| 0.1 | 0.3 | GO:0007386 | compartment pattern specification(GO:0007386) |
| 0.1 | 4.0 | GO:0019433 | triglyceride catabolic process(GO:0019433) |
| 0.1 | 2.3 | GO:0070734 | histone H3-K27 methylation(GO:0070734) |
| 0.1 | 0.7 | GO:0070314 | G1 to G0 transition(GO:0070314) |
| 0.1 | 0.4 | GO:0031914 | negative regulation of synaptic plasticity(GO:0031914) |
| 0.1 | 5.1 | GO:0048791 | calcium ion-regulated exocytosis of neurotransmitter(GO:0048791) |
| 0.1 | 1.1 | GO:0032713 | negative regulation of interleukin-4 production(GO:0032713) |
| 0.1 | 1.7 | GO:0000729 | DNA double-strand break processing(GO:0000729) |
| 0.1 | 1.2 | GO:0006297 | nucleotide-excision repair, DNA gap filling(GO:0006297) |
| 0.1 | 0.4 | GO:1990910 | response to thapsigargin(GO:1904578) cellular response to thapsigargin(GO:1904579) response to hypobaric hypoxia(GO:1990910) |
| 0.1 | 4.4 | GO:0060999 | positive regulation of dendritic spine development(GO:0060999) |
| 0.1 | 0.6 | GO:0051792 | medium-chain fatty acid biosynthetic process(GO:0051792) |
| 0.1 | 0.5 | GO:0006668 | sphinganine-1-phosphate metabolic process(GO:0006668) |
| 0.1 | 1.3 | GO:0042373 | vitamin K metabolic process(GO:0042373) |
| 0.1 | 2.3 | GO:0048935 | peripheral nervous system neuron differentiation(GO:0048934) peripheral nervous system neuron development(GO:0048935) |
| 0.1 | 7.0 | GO:0006120 | mitochondrial electron transport, NADH to ubiquinone(GO:0006120) |
| 0.1 | 7.5 | GO:0038128 | ERBB2 signaling pathway(GO:0038128) |
| 0.1 | 0.2 | GO:0001923 | B-1 B cell differentiation(GO:0001923) |
| 0.1 | 3.4 | GO:2000785 | regulation of autophagosome assembly(GO:2000785) |
| 0.1 | 0.4 | GO:0048752 | semicircular canal morphogenesis(GO:0048752) |
| 0.1 | 1.3 | GO:2000210 | positive regulation of anoikis(GO:2000210) |
| 0.1 | 0.5 | GO:0071461 | cellular response to redox state(GO:0071461) |
| 0.1 | 2.5 | GO:0006833 | water transport(GO:0006833) |
| 0.1 | 0.5 | GO:0009155 | purine deoxyribonucleotide catabolic process(GO:0009155) |
| 0.1 | 1.1 | GO:0006552 | leucine catabolic process(GO:0006552) |
| 0.1 | 1.9 | GO:0001919 | regulation of receptor recycling(GO:0001919) |
| 0.1 | 0.5 | GO:0000076 | DNA replication checkpoint(GO:0000076) |
| 0.1 | 0.4 | GO:0044376 | RNA polymerase II complex import to nucleus(GO:0044376) RNA polymerase III complex localization to nucleus(GO:1990022) |
| 0.1 | 7.3 | GO:0008033 | tRNA processing(GO:0008033) |
| 0.1 | 0.2 | GO:0006298 | mismatch repair(GO:0006298) |
| 0.1 | 0.4 | GO:0007079 | mitotic chromosome movement towards spindle pole(GO:0007079) |
| 0.1 | 0.3 | GO:1904245 | regulation of polynucleotide adenylyltransferase activity(GO:1904245) |
| 0.1 | 0.8 | GO:0046951 | ketone body biosynthetic process(GO:0046951) |
| 0.1 | 0.3 | GO:0007113 | endomitotic cell cycle(GO:0007113) |
| 0.1 | 0.3 | GO:0001826 | inner cell mass cell differentiation(GO:0001826) |
| 0.1 | 0.4 | GO:0048172 | regulation of short-term neuronal synaptic plasticity(GO:0048172) |
| 0.1 | 0.3 | GO:0030432 | peristalsis(GO:0030432) |
| 0.1 | 0.4 | GO:0001881 | receptor recycling(GO:0001881) |
| 0.1 | 0.6 | GO:0038161 | prolactin signaling pathway(GO:0038161) |
| 0.1 | 0.6 | GO:1904781 | positive regulation of protein localization to centrosome(GO:1904781) |
| 0.1 | 0.3 | GO:0002361 | CD4-positive, CD25-positive, alpha-beta regulatory T cell differentiation(GO:0002361) leukocyte migration involved in immune response(GO:0002522) |
| 0.1 | 0.2 | GO:0034982 | mitochondrial protein processing(GO:0034982) |
| 0.1 | 1.2 | GO:0035878 | nail development(GO:0035878) |
| 0.1 | 1.4 | GO:0048025 | negative regulation of mRNA splicing, via spliceosome(GO:0048025) |
| 0.1 | 0.8 | GO:0018026 | peptidyl-lysine monomethylation(GO:0018026) |
| 0.1 | 1.4 | GO:0042473 | outer ear morphogenesis(GO:0042473) |
| 0.1 | 0.4 | GO:0090073 | positive regulation of protein homodimerization activity(GO:0090073) |
| 0.1 | 1.8 | GO:0008334 | histone mRNA metabolic process(GO:0008334) |
| 0.1 | 1.1 | GO:0031498 | chromatin disassembly(GO:0031498) |
| 0.1 | 0.1 | GO:0061502 | early endosome to recycling endosome transport(GO:0061502) |
| 0.1 | 0.6 | GO:0030263 | apoptotic chromosome condensation(GO:0030263) |
| 0.1 | 0.5 | GO:0036376 | sodium ion export from cell(GO:0036376) |
| 0.1 | 0.6 | GO:0042426 | choline catabolic process(GO:0042426) |
| 0.1 | 0.3 | GO:0035549 | type III interferon production(GO:0034343) regulation of type III interferon production(GO:0034344) positive regulation of interferon-beta secretion(GO:0035549) |
| 0.1 | 0.5 | GO:0048820 | hair follicle maturation(GO:0048820) |
| 0.1 | 1.5 | GO:0014046 | dopamine secretion(GO:0014046) regulation of dopamine secretion(GO:0014059) |
| 0.1 | 0.6 | GO:0002230 | positive regulation of defense response to virus by host(GO:0002230) |
| 0.1 | 0.3 | GO:0014889 | muscle atrophy(GO:0014889) |
| 0.1 | 0.4 | GO:0097150 | neuronal stem cell population maintenance(GO:0097150) |
| 0.1 | 0.2 | GO:0035751 | regulation of lysosomal lumen pH(GO:0035751) |
| 0.1 | 2.6 | GO:0042273 | ribosomal large subunit biogenesis(GO:0042273) |
| 0.1 | 1.9 | GO:0000460 | maturation of 5.8S rRNA(GO:0000460) |
| 0.1 | 0.4 | GO:2000781 | positive regulation of double-strand break repair(GO:2000781) |
| 0.1 | 0.3 | GO:2001224 | positive regulation of neuron migration(GO:2001224) |
| 0.1 | 0.2 | GO:0035811 | negative regulation of urine volume(GO:0035811) |
| 0.1 | 0.7 | GO:0043092 | L-amino acid import(GO:0043092) |
| 0.1 | 1.2 | GO:0042276 | error-prone translesion synthesis(GO:0042276) |
| 0.1 | 0.4 | GO:0000160 | phosphorelay signal transduction system(GO:0000160) |
| 0.1 | 1.7 | GO:0001771 | immunological synapse formation(GO:0001771) |
| 0.1 | 0.3 | GO:2000697 | negative regulation by virus of viral protein levels in host cell(GO:0046725) kidney mesenchymal cell proliferation(GO:0072135) metanephric mesenchymal cell proliferation involved in metanephros development(GO:0072136) negative regulation of nephron tubule epithelial cell differentiation(GO:0072183) negative regulation of metanephric nephron tubule epithelial cell differentiation(GO:0072308) negative regulation of epithelial cell differentiation involved in kidney development(GO:2000697) |
| 0.1 | 0.8 | GO:0006312 | mitotic recombination(GO:0006312) |
| 0.1 | 2.0 | GO:0014047 | glutamate secretion(GO:0014047) |
| 0.1 | 0.3 | GO:0000350 | generation of catalytic spliceosome for second transesterification step(GO:0000350) |
| 0.1 | 0.4 | GO:0071460 | cellular response to cell-matrix adhesion(GO:0071460) |
| 0.1 | 0.6 | GO:0018342 | protein prenylation(GO:0018342) protein geranylgeranylation(GO:0018344) prenylation(GO:0097354) |
| 0.1 | 0.2 | GO:0048073 | regulation of eye pigmentation(GO:0048073) positive regulation of eye pigmentation(GO:0048075) |
| 0.1 | 0.2 | GO:0021520 | spinal cord motor neuron cell fate specification(GO:0021520) |
| 0.1 | 0.3 | GO:0071502 | cellular response to temperature stimulus(GO:0071502) |
| 0.1 | 0.1 | GO:0002032 | desensitization of G-protein coupled receptor protein signaling pathway by arrestin(GO:0002032) |
| 0.1 | 0.6 | GO:0032008 | positive regulation of TOR signaling(GO:0032008) |
| 0.1 | 0.6 | GO:0032228 | regulation of synaptic transmission, GABAergic(GO:0032228) |
| 0.1 | 1.4 | GO:0046339 | diacylglycerol metabolic process(GO:0046339) |
| 0.1 | 0.3 | GO:2000676 | positive regulation of type B pancreatic cell apoptotic process(GO:2000676) |
| 0.1 | 0.5 | GO:0006564 | L-serine biosynthetic process(GO:0006564) |
| 0.1 | 2.1 | GO:0035428 | hexose transmembrane transport(GO:0035428) glucose transmembrane transport(GO:1904659) |
| 0.1 | 0.7 | GO:2001300 | lipoxin metabolic process(GO:2001300) |
| 0.1 | 0.3 | GO:0022027 | interkinetic nuclear migration(GO:0022027) |
| 0.1 | 0.5 | GO:0031915 | positive regulation of synaptic plasticity(GO:0031915) |
| 0.1 | 0.3 | GO:0060416 | response to growth hormone(GO:0060416) |
| 0.1 | 0.1 | GO:0031000 | response to caffeine(GO:0031000) |
| 0.1 | 0.1 | GO:0072054 | renal inner medulla development(GO:0072053) renal outer medulla development(GO:0072054) |
| 0.1 | 1.3 | GO:0051016 | barbed-end actin filament capping(GO:0051016) |
| 0.1 | 0.6 | GO:0009313 | oligosaccharide catabolic process(GO:0009313) |
| 0.1 | 1.3 | GO:0045954 | positive regulation of natural killer cell mediated cytotoxicity(GO:0045954) |
| 0.1 | 2.3 | GO:0005980 | glycogen catabolic process(GO:0005980) |
| 0.1 | 0.2 | GO:0002028 | regulation of sodium ion transport(GO:0002028) |
| 0.1 | 0.1 | GO:0071963 | establishment or maintenance of cell polarity regulating cell shape(GO:0071963) |
| 0.1 | 0.2 | GO:0097264 | self proteolysis(GO:0097264) |
| 0.1 | 0.7 | GO:0034058 | endosomal vesicle fusion(GO:0034058) |
| 0.1 | 0.1 | GO:0046947 | peptidyl-lysine hydroxylation(GO:0017185) hydroxylysine metabolic process(GO:0046946) hydroxylysine biosynthetic process(GO:0046947) |
| 0.1 | 4.8 | GO:0018410 | C-terminal protein amino acid modification(GO:0018410) |
| 0.1 | 0.4 | GO:0042636 | negative regulation of hair cycle(GO:0042636) |
| 0.1 | 0.8 | GO:0033572 | transferrin transport(GO:0033572) |
| 0.1 | 0.5 | GO:0002467 | germinal center formation(GO:0002467) |
| 0.1 | 0.5 | GO:0015693 | magnesium ion transport(GO:0015693) |
| 0.1 | 0.6 | GO:0032876 | negative regulation of DNA endoreduplication(GO:0032876) |
| 0.1 | 1.1 | GO:0010832 | negative regulation of myotube differentiation(GO:0010832) |
| 0.1 | 1.3 | GO:0007020 | microtubule nucleation(GO:0007020) |
| 0.1 | 0.1 | GO:0007185 | transmembrane receptor protein tyrosine phosphatase signaling pathway(GO:0007185) |
| 0.1 | 0.2 | GO:0043615 | astrocyte cell migration(GO:0043615) |
| 0.1 | 0.2 | GO:0014887 | muscle hypertrophy in response to stress(GO:0003299) cardiac muscle adaptation(GO:0014887) cardiac muscle hypertrophy in response to stress(GO:0014898) |
| 0.1 | 0.5 | GO:0046325 | negative regulation of glucose import(GO:0046325) |
| 0.1 | 0.2 | GO:0016139 | glycoside catabolic process(GO:0016139) |
| 0.1 | 1.6 | GO:0070423 | nucleotide-binding domain, leucine rich repeat containing receptor signaling pathway(GO:0035872) nucleotide-binding oligomerization domain containing signaling pathway(GO:0070423) |
| 0.1 | 0.1 | GO:0005997 | xylulose metabolic process(GO:0005997) |
| 0.1 | 0.3 | GO:0042756 | drinking behavior(GO:0042756) |
| 0.1 | 1.7 | GO:0050850 | positive regulation of calcium-mediated signaling(GO:0050850) |
| 0.1 | 1.8 | GO:0090218 | positive regulation of lipid kinase activity(GO:0090218) |
| 0.1 | 0.2 | GO:0090230 | regulation of centromere complex assembly(GO:0090230) regulation of kinetochore assembly(GO:0090234) |
| 0.1 | 0.4 | GO:0044341 | sodium-dependent phosphate transport(GO:0044341) |
| 0.1 | 1.6 | GO:0006406 | mRNA export from nucleus(GO:0006406) mRNA-containing ribonucleoprotein complex export from nucleus(GO:0071427) |
| 0.1 | 0.3 | GO:0019896 | axonal transport of mitochondrion(GO:0019896) |
| 0.1 | 0.3 | GO:0010643 | cell communication by chemical coupling(GO:0010643) |
| 0.1 | 0.3 | GO:1903830 | magnesium ion transmembrane transport(GO:1903830) |
| 0.1 | 0.5 | GO:0010457 | centriole-centriole cohesion(GO:0010457) |
| 0.1 | 0.9 | GO:0097120 | receptor localization to synapse(GO:0097120) |
| 0.1 | 0.6 | GO:0033617 | mitochondrial respiratory chain complex IV assembly(GO:0033617) mitochondrial respiratory chain complex IV biogenesis(GO:0097034) |
| 0.1 | 0.2 | GO:0060152 | peroxisome localization(GO:0060151) microtubule-based peroxisome localization(GO:0060152) |
| 0.1 | 0.9 | GO:0050901 | leukocyte tethering or rolling(GO:0050901) |
| 0.1 | 0.2 | GO:0035616 | histone H2B conserved C-terminal lysine deubiquitination(GO:0035616) |
| 0.1 | 0.4 | GO:0045086 | positive regulation of interleukin-2 biosynthetic process(GO:0045086) |
| 0.1 | 0.4 | GO:0015705 | iodide transport(GO:0015705) |
| 0.1 | 0.4 | GO:0009263 | deoxyribonucleotide biosynthetic process(GO:0009263) |
| 0.1 | 1.0 | GO:0090280 | positive regulation of calcium ion import(GO:0090280) |
| 0.1 | 0.3 | GO:0035331 | negative regulation of hippo signaling(GO:0035331) |
| 0.0 | 0.3 | GO:0070375 | ERK5 cascade(GO:0070375) |
| 0.0 | 0.3 | GO:0042492 | gamma-delta T cell differentiation(GO:0042492) |
| 0.0 | 1.1 | GO:0032007 | negative regulation of TOR signaling(GO:0032007) |
| 0.0 | 0.2 | GO:0014826 | vein smooth muscle contraction(GO:0014826) |
| 0.0 | 0.4 | GO:0000291 | nuclear-transcribed mRNA catabolic process, exonucleolytic(GO:0000291) exonucleolytic nuclear-transcribed mRNA catabolic process involved in deadenylation-dependent decay(GO:0043928) |
| 0.0 | 1.2 | GO:0042267 | natural killer cell mediated cytotoxicity(GO:0042267) |
| 0.0 | 0.2 | GO:0021523 | somatic motor neuron differentiation(GO:0021523) |
| 0.0 | 0.4 | GO:0043517 | positive regulation of DNA damage response, signal transduction by p53 class mediator(GO:0043517) |
| 0.0 | 0.1 | GO:0006883 | cellular sodium ion homeostasis(GO:0006883) |
| 0.0 | 0.4 | GO:0008053 | mitochondrial fusion(GO:0008053) |
| 0.0 | 0.5 | GO:0002021 | response to dietary excess(GO:0002021) |
| 0.0 | 0.1 | GO:0010615 | positive regulation of cardiac muscle adaptation(GO:0010615) positive regulation of cardiac muscle hypertrophy in response to stress(GO:1903244) |
| 0.0 | 0.1 | GO:0032026 | response to magnesium ion(GO:0032026) |
| 0.0 | 0.4 | GO:0070884 | regulation of calcineurin-NFAT signaling cascade(GO:0070884) |
| 0.0 | 3.2 | GO:0030183 | B cell differentiation(GO:0030183) |
| 0.0 | 0.1 | GO:0045110 | intermediate filament bundle assembly(GO:0045110) |
| 0.0 | 0.1 | GO:0018211 | protein C-linked glycosylation(GO:0018103) peptidyl-tryptophan modification(GO:0018211) protein C-linked glycosylation via tryptophan(GO:0018317) protein C-linked glycosylation via 2'-alpha-mannosyl-L-tryptophan(GO:0018406) |
| 0.0 | 5.0 | GO:0002433 | immune response-regulating cell surface receptor signaling pathway involved in phagocytosis(GO:0002433) Fc-gamma receptor signaling pathway involved in phagocytosis(GO:0038096) |
| 0.0 | 0.3 | GO:1901798 | positive regulation of signal transduction by p53 class mediator(GO:1901798) |
| 0.0 | 0.5 | GO:1902083 | negative regulation of peptidyl-cysteine S-nitrosylation(GO:1902083) |
| 0.0 | 0.1 | GO:1903377 | negative regulation of oxidative stress-induced neuron intrinsic apoptotic signaling pathway(GO:1903377) |
| 0.0 | 0.4 | GO:0035860 | glial cell-derived neurotrophic factor receptor signaling pathway(GO:0035860) |
| 0.0 | 0.5 | GO:0045762 | positive regulation of adenylate cyclase activity(GO:0045762) |
| 0.0 | 0.2 | GO:0035799 | ureter maturation(GO:0035799) |
| 0.0 | 0.3 | GO:0006216 | cytidine catabolic process(GO:0006216) cytidine deamination(GO:0009972) cytidine metabolic process(GO:0046087) |
| 0.0 | 0.2 | GO:0060017 | parathyroid gland development(GO:0060017) |
| 0.0 | 0.3 | GO:0060124 | positive regulation of growth hormone secretion(GO:0060124) |
| 0.0 | 0.3 | GO:1902455 | negative regulation of stem cell population maintenance(GO:1902455) |
| 0.0 | 0.2 | GO:0034472 | snRNA 3'-end processing(GO:0034472) ncRNA 3'-end processing(GO:0043628) |
| 0.0 | 0.1 | GO:0070317 | negative regulation of G0 to G1 transition(GO:0070317) |
| 0.0 | 0.5 | GO:0071157 | negative regulation of cell cycle arrest(GO:0071157) |
| 0.0 | 0.2 | GO:0001833 | inner cell mass cell proliferation(GO:0001833) |
| 0.0 | 0.1 | GO:0090140 | regulation of mitochondrial fission(GO:0090140) |
| 0.0 | 0.2 | GO:1902268 | negative regulation of polyamine transmembrane transport(GO:1902268) |
| 0.0 | 0.3 | GO:0014029 | neural crest formation(GO:0014029) |
| 0.0 | 0.1 | GO:0051083 | 'de novo' cotranslational protein folding(GO:0051083) |
| 0.0 | 0.1 | GO:0045955 | negative regulation of calcium ion-dependent exocytosis(GO:0045955) |
| 0.0 | 0.2 | GO:0045345 | positive regulation of MHC class I biosynthetic process(GO:0045345) |
| 0.0 | 0.1 | GO:0060492 | foregut regionalization(GO:0060423) lung field specification(GO:0060424) primary lung bud formation(GO:0060431) lung induction(GO:0060492) |
| 0.0 | 0.5 | GO:0046785 | microtubule polymerization(GO:0046785) |
| 0.0 | 0.2 | GO:0031086 | nuclear-transcribed mRNA catabolic process, deadenylation-independent decay(GO:0031086) deadenylation-independent decapping of nuclear-transcribed mRNA(GO:0031087) |
| 0.0 | 2.1 | GO:0046854 | phosphatidylinositol phosphorylation(GO:0046854) |
| 0.0 | 0.4 | GO:0070849 | response to epidermal growth factor(GO:0070849) cellular response to epidermal growth factor stimulus(GO:0071364) |
| 0.0 | 0.2 | GO:0033173 | calcineurin-NFAT signaling cascade(GO:0033173) |
| 0.0 | 0.2 | GO:0048873 | homeostasis of number of cells within a tissue(GO:0048873) |
| 0.0 | 1.0 | GO:0071349 | interleukin-12-mediated signaling pathway(GO:0035722) response to interleukin-12(GO:0070671) cellular response to interleukin-12(GO:0071349) |
| 0.0 | 1.0 | GO:0032508 | DNA duplex unwinding(GO:0032508) |
| 0.0 | 1.1 | GO:0006699 | bile acid biosynthetic process(GO:0006699) |
| 0.0 | 1.6 | GO:0000245 | spliceosomal complex assembly(GO:0000245) |
| 0.0 | 0.2 | GO:0006127 | glycerophosphate shuttle(GO:0006127) |
| 0.0 | 0.1 | GO:0001672 | regulation of chromatin assembly or disassembly(GO:0001672) |
| 0.0 | 0.1 | GO:0006307 | DNA dealkylation involved in DNA repair(GO:0006307) |
| 0.0 | 1.0 | GO:0035735 | intraciliary transport involved in cilium morphogenesis(GO:0035735) |
| 0.0 | 1.2 | GO:0046329 | negative regulation of JNK cascade(GO:0046329) |
| 0.0 | 3.9 | GO:0007156 | homophilic cell adhesion via plasma membrane adhesion molecules(GO:0007156) |
| 0.0 | 0.1 | GO:0007622 | rhythmic behavior(GO:0007622) circadian behavior(GO:0048512) |
| 0.0 | 0.3 | GO:0006471 | protein ADP-ribosylation(GO:0006471) |
| 0.0 | 0.2 | GO:0065002 | intracellular protein transmembrane transport(GO:0065002) |
| 0.0 | 0.4 | GO:0060765 | regulation of androgen receptor signaling pathway(GO:0060765) |
| 0.0 | 0.2 | GO:0006195 | purine nucleotide catabolic process(GO:0006195) |
| 0.0 | 0.2 | GO:0007635 | chemosensory behavior(GO:0007635) |
| 0.0 | 0.1 | GO:0036269 | swimming behavior(GO:0036269) |
| 0.0 | 0.3 | GO:0036092 | phosphatidylinositol-3-phosphate biosynthetic process(GO:0036092) |
| 0.0 | 1.9 | GO:0002377 | immunoglobulin production(GO:0002377) |
| 0.0 | 0.8 | GO:0036297 | interstrand cross-link repair(GO:0036297) |
| 0.0 | 0.1 | GO:0043666 | regulation of phosphoprotein phosphatase activity(GO:0043666) |
| 0.0 | 0.3 | GO:2000369 | regulation of clathrin-mediated endocytosis(GO:2000369) |
| 0.0 | 0.2 | GO:0006685 | sphingomyelin catabolic process(GO:0006685) |
| 0.0 | 0.1 | GO:0046626 | regulation of insulin receptor signaling pathway(GO:0046626) |
| 0.0 | 0.3 | GO:0006516 | glycoprotein catabolic process(GO:0006516) |
| 0.0 | 0.1 | GO:0070672 | response to interleukin-15(GO:0070672) |
| 0.0 | 0.1 | GO:1901409 | positive regulation of phosphorylation of RNA polymerase II C-terminal domain(GO:1901409) |
| 0.0 | 3.9 | GO:0042787 | protein ubiquitination involved in ubiquitin-dependent protein catabolic process(GO:0042787) |
| 0.0 | 0.5 | GO:0022400 | regulation of rhodopsin mediated signaling pathway(GO:0022400) |
| 0.0 | 0.4 | GO:0070911 | global genome nucleotide-excision repair(GO:0070911) |
| 0.0 | 0.1 | GO:0034656 | nucleobase-containing small molecule catabolic process(GO:0034656) |
| 0.0 | 0.2 | GO:0043651 | linoleic acid metabolic process(GO:0043651) |
| 0.0 | 0.2 | GO:0060117 | auditory receptor cell development(GO:0060117) |
| 0.0 | 0.3 | GO:1902475 | L-alpha-amino acid transmembrane transport(GO:1902475) |
| 0.0 | 0.6 | GO:0016486 | peptide hormone processing(GO:0016486) |
| 0.0 | 0.1 | GO:0046174 | polyol catabolic process(GO:0046174) |
| 0.0 | 0.2 | GO:0045824 | negative regulation of innate immune response(GO:0045824) |
| 0.0 | 0.3 | GO:0015949 | nucleobase-containing small molecule interconversion(GO:0015949) |
| 0.0 | 0.2 | GO:0070935 | 3'-UTR-mediated mRNA stabilization(GO:0070935) |
| 0.0 | 0.2 | GO:0006633 | fatty acid biosynthetic process(GO:0006633) |
| 0.0 | 0.2 | GO:0035176 | social behavior(GO:0035176) intraspecies interaction between organisms(GO:0051703) |
| 0.0 | 0.0 | GO:1901621 | negative regulation of smoothened signaling pathway involved in dorsal/ventral neural tube patterning(GO:1901621) |
| 0.0 | 0.4 | GO:0010107 | potassium ion import(GO:0010107) |
| 0.0 | 0.1 | GO:0098908 | regulation of neuronal action potential(GO:0098908) |
| 0.0 | 0.0 | GO:0006493 | protein O-linked glycosylation(GO:0006493) |
| 0.0 | 0.2 | GO:0042036 | negative regulation of cytokine biosynthetic process(GO:0042036) |
| 0.0 | 0.9 | GO:0006334 | nucleosome assembly(GO:0006334) |
| 0.0 | 0.1 | GO:0036438 | maintenance of lens transparency(GO:0036438) |
| 0.0 | 0.2 | GO:2000249 | regulation of actin cytoskeleton reorganization(GO:2000249) |
| 0.0 | 0.2 | GO:0016226 | iron-sulfur cluster assembly(GO:0016226) metallo-sulfur cluster assembly(GO:0031163) |
| 0.0 | 0.0 | GO:0007184 | SMAD protein import into nucleus(GO:0007184) |
| 0.0 | 0.1 | GO:2000288 | positive regulation of myoblast proliferation(GO:2000288) |
| 0.0 | 0.2 | GO:0051131 | chaperone-mediated protein complex assembly(GO:0051131) |
| 0.0 | 0.1 | GO:0010569 | regulation of double-strand break repair via homologous recombination(GO:0010569) |
| 0.0 | 0.1 | GO:0070973 | protein localization to endoplasmic reticulum exit site(GO:0070973) |
Gene overrepresentation in cellular_component category:
| Log-likelihood per target | Total log-likelihood | Term | Description |
|---|---|---|---|
| 10.5 | 52.6 | GO:0098843 | postsynaptic endocytic zone(GO:0098843) |
| 3.6 | 18.0 | GO:0060200 | clathrin-sculpted acetylcholine transport vesicle(GO:0060200) clathrin-sculpted acetylcholine transport vesicle membrane(GO:0060201) |
| 3.2 | 16.0 | GO:1990425 | ryanodine receptor complex(GO:1990425) |
| 3.1 | 12.3 | GO:1990031 | pinceau fiber(GO:1990031) |
| 3.0 | 8.9 | GO:0038039 | G-protein coupled receptor heterodimeric complex(GO:0038039) |
| 2.6 | 10.4 | GO:0032937 | SREBP-SCAP-Insig complex(GO:0032937) |
| 2.3 | 13.5 | GO:0000015 | phosphopyruvate hydratase complex(GO:0000015) |
| 2.1 | 14.7 | GO:0033269 | internode region of axon(GO:0033269) |
| 1.9 | 7.8 | GO:0016533 | cyclin-dependent protein kinase 5 holoenzyme complex(GO:0016533) |
| 1.9 | 9.7 | GO:0045298 | tubulin complex(GO:0045298) |
| 1.8 | 7.2 | GO:0097454 | Schwann cell microvillus(GO:0097454) |
| 1.5 | 8.8 | GO:0031429 | box H/ACA snoRNP complex(GO:0031429) box H/ACA RNP complex(GO:0072588) box H/ACA scaRNP complex(GO:0072589) box H/ACA telomerase RNP complex(GO:0090661) |
| 1.4 | 4.1 | GO:0031372 | UBC13-MMS2 complex(GO:0031372) |
| 1.3 | 14.4 | GO:0061202 | clathrin-sculpted gamma-aminobutyric acid transport vesicle(GO:0061200) clathrin-sculpted gamma-aminobutyric acid transport vesicle membrane(GO:0061202) |
| 1.3 | 23.4 | GO:0005736 | DNA-directed RNA polymerase I complex(GO:0005736) |
| 1.3 | 9.1 | GO:0005742 | mitochondrial outer membrane translocase complex(GO:0005742) |
| 1.2 | 2.5 | GO:0070044 | synaptobrevin 2-SNAP-25-syntaxin-1a-complexin I complex(GO:0070032) synaptobrevin 2-SNAP-25-syntaxin-1a complex(GO:0070044) |
| 1.2 | 3.5 | GO:0070762 | nuclear pore transmembrane ring(GO:0070762) |
| 1.1 | 3.4 | GO:0005960 | glycine cleavage complex(GO:0005960) |
| 1.1 | 7.9 | GO:0072669 | tRNA-splicing ligase complex(GO:0072669) |
| 1.1 | 5.5 | GO:0000408 | EKC/KEOPS complex(GO:0000408) |
| 1.1 | 13.0 | GO:0035749 | myelin sheath adaxonal region(GO:0035749) |
| 1.1 | 5.4 | GO:0034457 | Mpp10 complex(GO:0034457) |
| 1.0 | 10.3 | GO:0045254 | pyruvate dehydrogenase complex(GO:0045254) |
| 1.0 | 3.0 | GO:0030906 | retromer, cargo-selective complex(GO:0030906) |
| 1.0 | 4.0 | GO:0031417 | NatC complex(GO:0031417) |
| 1.0 | 2.9 | GO:0043291 | RAVE complex(GO:0043291) |
| 1.0 | 6.7 | GO:0061617 | MICOS complex(GO:0061617) |
| 0.9 | 3.7 | GO:0001405 | presequence translocase-associated import motor(GO:0001405) |
| 0.9 | 8.4 | GO:0005955 | calcineurin complex(GO:0005955) |
| 0.9 | 7.4 | GO:0098845 | postsynaptic endosome(GO:0098845) |
| 0.9 | 4.5 | GO:0000221 | vacuolar proton-transporting V-type ATPase, V1 domain(GO:0000221) |
| 0.9 | 2.7 | GO:0005953 | CAAX-protein geranylgeranyltransferase complex(GO:0005953) |
| 0.9 | 6.2 | GO:0070852 | cell body fiber(GO:0070852) |
| 0.8 | 4.2 | GO:0030673 | axolemma(GO:0030673) |
| 0.8 | 2.3 | GO:0072534 | perineuronal net(GO:0072534) |
| 0.8 | 5.3 | GO:0097449 | astrocyte projection(GO:0097449) |
| 0.7 | 17.1 | GO:0046930 | pore complex(GO:0046930) |
| 0.7 | 7.4 | GO:0005828 | kinetochore microtubule(GO:0005828) |
| 0.7 | 17.0 | GO:0071564 | npBAF complex(GO:0071564) |
| 0.7 | 3.5 | GO:0043190 | ATP-binding cassette (ABC) transporter complex(GO:0043190) |
| 0.7 | 2.1 | GO:0048269 | methionine adenosyltransferase complex(GO:0048269) |
| 0.7 | 9.2 | GO:0098563 | integral component of synaptic vesicle membrane(GO:0030285) intrinsic component of synaptic vesicle membrane(GO:0098563) |
| 0.6 | 5.1 | GO:0016012 | sarcoglycan complex(GO:0016012) |
| 0.6 | 2.5 | GO:0098799 | outer mitochondrial membrane protein complex(GO:0098799) |
| 0.6 | 1.9 | GO:0030689 | Noc complex(GO:0030689) |
| 0.6 | 3.0 | GO:0005945 | 6-phosphofructokinase complex(GO:0005945) |
| 0.6 | 4.9 | GO:0034715 | pICln-Sm protein complex(GO:0034715) |
| 0.6 | 1.8 | GO:0042788 | polysomal ribosome(GO:0042788) |
| 0.6 | 3.0 | GO:0001940 | male pronucleus(GO:0001940) |
| 0.6 | 4.1 | GO:0097452 | GAIT complex(GO:0097452) |
| 0.6 | 2.9 | GO:0020018 | ciliary pocket(GO:0020016) ciliary pocket membrane(GO:0020018) |
| 0.6 | 16.3 | GO:0042101 | T cell receptor complex(GO:0042101) |
| 0.6 | 5.0 | GO:0032009 | early phagosome(GO:0032009) |
| 0.6 | 14.9 | GO:0000314 | organellar small ribosomal subunit(GO:0000314) mitochondrial small ribosomal subunit(GO:0005763) |
| 0.5 | 3.3 | GO:0000322 | storage vacuole(GO:0000322) |
| 0.5 | 3.1 | GO:0070381 | endosome to plasma membrane transport vesicle(GO:0070381) |
| 0.5 | 5.5 | GO:0030123 | AP-3 adaptor complex(GO:0030123) |
| 0.5 | 5.5 | GO:0005666 | DNA-directed RNA polymerase III complex(GO:0005666) |
| 0.5 | 2.5 | GO:0071008 | U2-type post-mRNA release spliceosomal complex(GO:0071008) |
| 0.5 | 2.0 | GO:0031166 | integral component of vacuolar membrane(GO:0031166) |
| 0.5 | 1.4 | GO:0016938 | kinesin I complex(GO:0016938) |
| 0.5 | 5.1 | GO:0032045 | guanyl-nucleotide exchange factor complex(GO:0032045) |
| 0.5 | 4.1 | GO:0031467 | Cul7-RING ubiquitin ligase complex(GO:0031467) |
| 0.4 | 2.7 | GO:0033018 | sarcoplasmic reticulum lumen(GO:0033018) |
| 0.4 | 1.8 | GO:0031224 | intrinsic component of membrane(GO:0031224) |
| 0.4 | 3.5 | GO:0097418 | neurofibrillary tangle(GO:0097418) |
| 0.4 | 2.2 | GO:1902937 | inward rectifier potassium channel complex(GO:1902937) |
| 0.4 | 20.7 | GO:0033017 | sarcoplasmic reticulum membrane(GO:0033017) |
| 0.4 | 5.7 | GO:0033270 | paranode region of axon(GO:0033270) |
| 0.4 | 1.3 | GO:0034455 | t-UTP complex(GO:0034455) |
| 0.4 | 30.5 | GO:0005637 | nuclear inner membrane(GO:0005637) |
| 0.4 | 3.0 | GO:0098554 | cytoplasmic side of endoplasmic reticulum membrane(GO:0098554) |
| 0.4 | 5.5 | GO:0002199 | zona pellucida receptor complex(GO:0002199) |
| 0.4 | 2.1 | GO:0034992 | microtubule organizing center attachment site(GO:0034992) LINC complex(GO:0034993) |
| 0.4 | 3.7 | GO:0044327 | dendritic spine head(GO:0044327) |
| 0.4 | 5.8 | GO:0033179 | proton-transporting V-type ATPase, V0 domain(GO:0033179) |
| 0.4 | 1.6 | GO:0031673 | H zone(GO:0031673) |
| 0.4 | 89.6 | GO:0043209 | myelin sheath(GO:0043209) |
| 0.4 | 5.7 | GO:0035631 | CD40 receptor complex(GO:0035631) |
| 0.4 | 3.7 | GO:0031371 | ubiquitin conjugating enzyme complex(GO:0031371) |
| 0.4 | 17.9 | GO:0042645 | nucleoid(GO:0009295) mitochondrial nucleoid(GO:0042645) |
| 0.4 | 2.0 | GO:0045252 | oxoglutarate dehydrogenase complex(GO:0045252) |
| 0.4 | 1.1 | GO:0034657 | GID complex(GO:0034657) |
| 0.4 | 1.1 | GO:0035189 | Rb-E2F complex(GO:0035189) |
| 0.4 | 3.3 | GO:0033588 | Elongator holoenzyme complex(GO:0033588) |
| 0.4 | 2.5 | GO:0042719 | mitochondrial intermembrane space protein transporter complex(GO:0042719) |
| 0.4 | 6.5 | GO:0032156 | septin cytoskeleton(GO:0032156) |
| 0.4 | 1.1 | GO:0005588 | collagen type V trimer(GO:0005588) |
| 0.4 | 2.9 | GO:0070761 | pre-snoRNP complex(GO:0070761) |
| 0.4 | 1.8 | GO:0002193 | MAML1-RBP-Jkappa- ICN1 complex(GO:0002193) |
| 0.4 | 2.1 | GO:1990131 | EGO complex(GO:0034448) Gtr1-Gtr2 GTPase complex(GO:1990131) |
| 0.4 | 1.1 | GO:0044423 | virion(GO:0019012) virion part(GO:0044423) |
| 0.4 | 0.7 | GO:0033647 | host intracellular organelle(GO:0033647) host intracellular membrane-bounded organelle(GO:0033648) host cell nucleus(GO:0042025) host cell nuclear part(GO:0044094) |
| 0.4 | 3.5 | GO:0005751 | mitochondrial respiratory chain complex IV(GO:0005751) |
| 0.4 | 11.2 | GO:1902711 | GABA receptor complex(GO:1902710) GABA-A receptor complex(GO:1902711) |
| 0.3 | 3.8 | GO:0035985 | senescence-associated heterochromatin focus(GO:0035985) |
| 0.3 | 3.8 | GO:0042575 | DNA polymerase complex(GO:0042575) |
| 0.3 | 2.7 | GO:0044294 | dendritic growth cone(GO:0044294) |
| 0.3 | 10.1 | GO:0030687 | preribosome, large subunit precursor(GO:0030687) |
| 0.3 | 2.7 | GO:0005744 | mitochondrial inner membrane presequence translocase complex(GO:0005744) |
| 0.3 | 0.7 | GO:0005658 | alpha DNA polymerase:primase complex(GO:0005658) |
| 0.3 | 2.9 | GO:0032797 | SMN complex(GO:0032797) |
| 0.3 | 2.2 | GO:0000172 | ribonuclease MRP complex(GO:0000172) |
| 0.3 | 0.6 | GO:0032039 | integrator complex(GO:0032039) |
| 0.3 | 2.2 | GO:1990452 | Parkin-FBXW7-Cul1 ubiquitin ligase complex(GO:1990452) |
| 0.3 | 13.2 | GO:0000313 | organellar ribosome(GO:0000313) mitochondrial ribosome(GO:0005761) |
| 0.3 | 37.8 | GO:0043679 | axon terminus(GO:0043679) |
| 0.3 | 0.9 | GO:0036396 | MIS complex(GO:0036396) mRNA editing complex(GO:0045293) |
| 0.3 | 0.9 | GO:0033597 | mitotic checkpoint complex(GO:0033597) bub1-bub3 complex(GO:1990298) |
| 0.3 | 5.5 | GO:0035371 | microtubule plus-end(GO:0035371) |
| 0.3 | 3.7 | GO:0090543 | Flemming body(GO:0090543) |
| 0.3 | 7.9 | GO:0035327 | transcriptionally active chromatin(GO:0035327) |
| 0.3 | 2.0 | GO:0032593 | insulin-responsive compartment(GO:0032593) |
| 0.3 | 4.7 | GO:0005885 | Arp2/3 protein complex(GO:0005885) |
| 0.3 | 2.2 | GO:0000176 | nuclear exosome (RNase complex)(GO:0000176) |
| 0.3 | 2.2 | GO:0031595 | nuclear proteasome complex(GO:0031595) |
| 0.3 | 0.8 | GO:0090498 | extrinsic component of Golgi membrane(GO:0090498) |
| 0.3 | 5.1 | GO:0032591 | dendritic spine membrane(GO:0032591) |
| 0.3 | 1.6 | GO:1990037 | Lewy body core(GO:1990037) |
| 0.3 | 1.9 | GO:0016272 | prefoldin complex(GO:0016272) |
| 0.3 | 1.3 | GO:0031905 | early endosome lumen(GO:0031905) |
| 0.3 | 5.0 | GO:0030904 | retromer complex(GO:0030904) |
| 0.3 | 0.8 | GO:0031428 | box C/D snoRNP complex(GO:0031428) |
| 0.3 | 0.5 | GO:0005850 | eukaryotic translation initiation factor 2 complex(GO:0005850) |
| 0.3 | 6.4 | GO:0005697 | telomerase holoenzyme complex(GO:0005697) |
| 0.3 | 1.3 | GO:0060077 | inhibitory synapse(GO:0060077) |
| 0.3 | 0.8 | GO:0005873 | plus-end kinesin complex(GO:0005873) |
| 0.3 | 62.5 | GO:0099572 | postsynaptic density(GO:0014069) postsynaptic specialization(GO:0099572) |
| 0.3 | 14.3 | GO:0099501 | synaptic vesicle membrane(GO:0030672) exocytic vesicle membrane(GO:0099501) |
| 0.2 | 4.7 | GO:0005665 | DNA-directed RNA polymerase II, core complex(GO:0005665) |
| 0.2 | 8.2 | GO:0000159 | protein phosphatase type 2A complex(GO:0000159) |
| 0.2 | 4.7 | GO:0017101 | aminoacyl-tRNA synthetase multienzyme complex(GO:0017101) |
| 0.2 | 1.0 | GO:0005846 | nuclear cap binding complex(GO:0005846) |
| 0.2 | 1.3 | GO:0097208 | alveolar lamellar body(GO:0097208) |
| 0.2 | 8.9 | GO:0019005 | SCF ubiquitin ligase complex(GO:0019005) |
| 0.2 | 5.3 | GO:0005753 | mitochondrial proton-transporting ATP synthase complex(GO:0005753) |
| 0.2 | 2.9 | GO:0005664 | origin recognition complex(GO:0000808) nuclear origin of replication recognition complex(GO:0005664) |
| 0.2 | 2.1 | GO:0098574 | cytoplasmic side of lysosomal membrane(GO:0098574) |
| 0.2 | 1.9 | GO:0005869 | dynactin complex(GO:0005869) |
| 0.2 | 2.1 | GO:0000243 | commitment complex(GO:0000243) |
| 0.2 | 17.7 | GO:0016234 | inclusion body(GO:0016234) |
| 0.2 | 0.6 | GO:1990622 | CHOP-ATF3 complex(GO:1990622) |
| 0.2 | 1.0 | GO:0033391 | chromatoid body(GO:0033391) |
| 0.2 | 1.8 | GO:0033176 | proton-transporting V-type ATPase complex(GO:0033176) |
| 0.2 | 7.8 | GO:0030660 | Golgi-associated vesicle membrane(GO:0030660) |
| 0.2 | 1.6 | GO:1990111 | spermatoproteasome complex(GO:1990111) |
| 0.2 | 1.2 | GO:0005958 | DNA-dependent protein kinase-DNA ligase 4 complex(GO:0005958) |
| 0.2 | 1.8 | GO:0008274 | gamma-tubulin large complex(GO:0000931) gamma-tubulin ring complex(GO:0008274) |
| 0.2 | 0.6 | GO:0034685 | integrin alphav-beta6 complex(GO:0034685) integrin alphav-beta8 complex(GO:0034686) |
| 0.2 | 0.6 | GO:0035098 | ESC/E(Z) complex(GO:0035098) |
| 0.2 | 5.2 | GO:0005868 | cytoplasmic dynein complex(GO:0005868) |
| 0.2 | 1.7 | GO:0034709 | methylosome(GO:0034709) |
| 0.2 | 23.3 | GO:0048770 | melanosome(GO:0042470) pigment granule(GO:0048770) |
| 0.2 | 1.4 | GO:0000782 | telomere cap complex(GO:0000782) nuclear telomere cap complex(GO:0000783) |
| 0.2 | 0.3 | GO:0098592 | cytoplasmic side of apical plasma membrane(GO:0098592) |
| 0.2 | 9.8 | GO:0008021 | synaptic vesicle(GO:0008021) |
| 0.2 | 20.5 | GO:0031901 | early endosome membrane(GO:0031901) |
| 0.2 | 8.8 | GO:0005876 | spindle microtubule(GO:0005876) |
| 0.2 | 13.6 | GO:0005778 | peroxisomal membrane(GO:0005778) microbody membrane(GO:0031903) |
| 0.2 | 0.7 | GO:0070876 | SOSS complex(GO:0070876) |
| 0.2 | 0.8 | GO:0044295 | axonal growth cone(GO:0044295) |
| 0.2 | 0.7 | GO:0033263 | CORVET complex(GO:0033263) |
| 0.2 | 1.0 | GO:0009331 | glycerol-3-phosphate dehydrogenase complex(GO:0009331) |
| 0.2 | 0.7 | GO:0030915 | Smc5-Smc6 complex(GO:0030915) |
| 0.2 | 0.8 | GO:0034274 | Atg12-Atg5-Atg16 complex(GO:0034274) |
| 0.2 | 0.8 | GO:0036128 | CatSper complex(GO:0036128) |
| 0.2 | 1.0 | GO:0031390 | Ctf18 RFC-like complex(GO:0031390) |
| 0.2 | 8.9 | GO:0031463 | Cul3-RING ubiquitin ligase complex(GO:0031463) |
| 0.2 | 0.8 | GO:0030678 | mitochondrial ribonuclease P complex(GO:0030678) |
| 0.2 | 1.0 | GO:0097129 | cyclin D2-CDK4 complex(GO:0097129) |
| 0.2 | 0.9 | GO:0044615 | nuclear pore nuclear basket(GO:0044615) |
| 0.1 | 1.3 | GO:0008290 | F-actin capping protein complex(GO:0008290) |
| 0.1 | 3.0 | GO:0005952 | cAMP-dependent protein kinase complex(GO:0005952) |
| 0.1 | 42.7 | GO:0005874 | microtubule(GO:0005874) |
| 0.1 | 1.0 | GO:0061700 | GATOR2 complex(GO:0061700) |
| 0.1 | 0.7 | GO:0005594 | collagen type IX trimer(GO:0005594) |
| 0.1 | 1.1 | GO:0005610 | laminin-5 complex(GO:0005610) |
| 0.1 | 0.6 | GO:0005968 | Rab-protein geranylgeranyltransferase complex(GO:0005968) |
| 0.1 | 1.0 | GO:0000120 | RNA polymerase I transcription factor complex(GO:0000120) |
| 0.1 | 1.4 | GO:1990454 | L-type voltage-gated calcium channel complex(GO:1990454) |
| 0.1 | 27.4 | GO:0098794 | postsynapse(GO:0098794) |
| 0.1 | 0.6 | GO:0001741 | XY body(GO:0001741) |
| 0.1 | 2.7 | GO:0042734 | presynaptic membrane(GO:0042734) |
| 0.1 | 2.0 | GO:0033276 | transcription factor TFTC complex(GO:0033276) |
| 0.1 | 3.1 | GO:0048786 | presynaptic active zone(GO:0048786) |
| 0.1 | 8.5 | GO:0098800 | inner mitochondrial membrane protein complex(GO:0098800) |
| 0.1 | 0.1 | GO:0001939 | female pronucleus(GO:0001939) |
| 0.1 | 0.4 | GO:0031515 | tRNA (m1A) methyltransferase complex(GO:0031515) |
| 0.1 | 0.9 | GO:0005786 | signal recognition particle, endoplasmic reticulum targeting(GO:0005786) |
| 0.1 | 0.2 | GO:1990604 | IRE1-TRAF2-ASK1 complex(GO:1990604) |
| 0.1 | 1.6 | GO:0010369 | chromocenter(GO:0010369) |
| 0.1 | 0.8 | GO:0044232 | organelle membrane contact site(GO:0044232) |
| 0.1 | 2.1 | GO:0099738 | cell cortex region(GO:0099738) |
| 0.1 | 0.7 | GO:0016593 | Cdc73/Paf1 complex(GO:0016593) |
| 0.1 | 0.8 | GO:0005758 | mitochondrial intermembrane space(GO:0005758) |
| 0.1 | 0.3 | GO:0071020 | post-spliceosomal complex(GO:0071020) |
| 0.1 | 0.4 | GO:0031415 | NatA complex(GO:0031415) |
| 0.1 | 1.7 | GO:0030992 | intraciliary transport particle B(GO:0030992) |
| 0.1 | 0.2 | GO:0031906 | late endosome lumen(GO:0031906) |
| 0.1 | 0.9 | GO:0000109 | nucleotide-excision repair complex(GO:0000109) |
| 0.1 | 1.1 | GO:0017119 | Golgi transport complex(GO:0017119) |
| 0.1 | 0.4 | GO:0032301 | MutSalpha complex(GO:0032301) |
| 0.1 | 1.0 | GO:0032839 | dendrite cytoplasm(GO:0032839) |
| 0.1 | 3.8 | GO:0055037 | recycling endosome(GO:0055037) |
| 0.1 | 1.2 | GO:0033256 | I-kappaB/NF-kappaB complex(GO:0033256) |
| 0.1 | 0.7 | GO:0031464 | Cul4A-RING E3 ubiquitin ligase complex(GO:0031464) |
| 0.1 | 0.4 | GO:0045120 | pronucleus(GO:0045120) |
| 0.1 | 0.8 | GO:0032389 | MutLalpha complex(GO:0032389) |
| 0.1 | 0.5 | GO:0071817 | MMXD complex(GO:0071817) |
| 0.1 | 7.6 | GO:1904724 | tertiary granule lumen(GO:1904724) |
| 0.1 | 3.1 | GO:0002102 | podosome(GO:0002102) |
| 0.1 | 0.6 | GO:0001891 | phagocytic cup(GO:0001891) |
| 0.1 | 0.4 | GO:0071565 | nBAF complex(GO:0071565) |
| 0.1 | 1.0 | GO:0014704 | intercalated disc(GO:0014704) |
| 0.1 | 2.7 | GO:0030665 | clathrin-coated vesicle membrane(GO:0030665) |
| 0.1 | 0.8 | GO:0061574 | ASAP complex(GO:0061574) |
| 0.1 | 80.1 | GO:0005730 | nucleolus(GO:0005730) |
| 0.1 | 1.1 | GO:0000932 | cytoplasmic mRNA processing body(GO:0000932) |
| 0.1 | 0.2 | GO:0014802 | terminal cisterna(GO:0014802) |
| 0.1 | 0.5 | GO:0035102 | PRC1 complex(GO:0035102) |
| 0.1 | 0.3 | GO:0005971 | ribonucleoside-diphosphate reductase complex(GO:0005971) |
| 0.1 | 1.3 | GO:0035145 | exon-exon junction complex(GO:0035145) |
| 0.1 | 5.6 | GO:0005643 | nuclear pore(GO:0005643) |
| 0.1 | 2.2 | GO:0071013 | catalytic step 2 spliceosome(GO:0071013) |
| 0.1 | 0.8 | GO:0019773 | proteasome core complex, alpha-subunit complex(GO:0019773) |
| 0.1 | 1.1 | GO:0070469 | respiratory chain(GO:0070469) |
| 0.1 | 0.5 | GO:0005811 | lipid particle(GO:0005811) |
| 0.1 | 0.4 | GO:0035770 | ribonucleoprotein granule(GO:0035770) |
| 0.1 | 0.5 | GO:0005682 | U5 snRNP(GO:0005682) |
| 0.1 | 1.2 | GO:0000812 | Swr1 complex(GO:0000812) |
| 0.1 | 0.5 | GO:0031298 | replication fork protection complex(GO:0031298) |
| 0.1 | 0.1 | GO:0030867 | rough endoplasmic reticulum membrane(GO:0030867) |
| 0.1 | 0.8 | GO:0031235 | intrinsic component of the cytoplasmic side of the plasma membrane(GO:0031235) |
| 0.1 | 0.5 | GO:0071011 | precatalytic spliceosome(GO:0071011) |
| 0.1 | 2.4 | GO:0005834 | heterotrimeric G-protein complex(GO:0005834) |
| 0.1 | 4.1 | GO:0008076 | voltage-gated potassium channel complex(GO:0008076) potassium channel complex(GO:0034705) |
| 0.1 | 0.4 | GO:0005688 | U6 snRNP(GO:0005688) Lsm1-7-Pat1 complex(GO:1990726) |
| 0.1 | 0.2 | GO:0034663 | endoplasmic reticulum chaperone complex(GO:0034663) |
| 0.0 | 0.2 | GO:0043541 | UDP-N-acetylglucosamine transferase complex(GO:0043541) |
| 0.0 | 1.0 | GO:0031528 | microvillus membrane(GO:0031528) |
| 0.0 | 0.8 | GO:0031089 | platelet dense granule lumen(GO:0031089) |
| 0.0 | 0.7 | GO:0005686 | U2 snRNP(GO:0005686) |
| 0.0 | 0.5 | GO:0005890 | sodium:potassium-exchanging ATPase complex(GO:0005890) |
| 0.0 | 1.0 | GO:0005771 | multivesicular body(GO:0005771) |
| 0.0 | 0.2 | GO:0000835 | ER ubiquitin ligase complex(GO:0000835) |
| 0.0 | 0.1 | GO:1990316 | ATG1/ULK1 kinase complex(GO:1990316) |
| 0.0 | 2.0 | GO:0030136 | clathrin-coated vesicle(GO:0030136) |
| 0.0 | 0.9 | GO:0008074 | guanylate cyclase complex, soluble(GO:0008074) |
| 0.0 | 0.3 | GO:0030008 | TRAPP complex(GO:0030008) |
| 0.0 | 0.3 | GO:0072546 | ER membrane protein complex(GO:0072546) |
| 0.0 | 0.4 | GO:1990391 | DNA repair complex(GO:1990391) |
| 0.0 | 0.8 | GO:0034362 | low-density lipoprotein particle(GO:0034362) |
| 0.0 | 1.2 | GO:0000792 | heterochromatin(GO:0000792) |
| 0.0 | 5.8 | GO:0045202 | synapse(GO:0045202) |
| 0.0 | 0.2 | GO:0005787 | signal peptidase complex(GO:0005787) |
| 0.0 | 0.9 | GO:0035579 | specific granule membrane(GO:0035579) |
| 0.0 | 0.1 | GO:0036056 | filtration diaphragm(GO:0036056) slit diaphragm(GO:0036057) |
| 0.0 | 0.5 | GO:0030133 | transport vesicle(GO:0030133) |
| 0.0 | 0.8 | GO:0005741 | mitochondrial outer membrane(GO:0005741) |
| 0.0 | 0.2 | GO:0000242 | pericentriolar material(GO:0000242) |
| 0.0 | 0.8 | GO:0000777 | condensed chromosome kinetochore(GO:0000777) |
| 0.0 | 0.8 | GO:0030496 | midbody(GO:0030496) |
| 0.0 | 0.5 | GO:0001772 | immunological synapse(GO:0001772) |
| 0.0 | 0.3 | GO:0016580 | Sin3 complex(GO:0016580) |
| 0.0 | 0.1 | GO:1990124 | messenger ribonucleoprotein complex(GO:1990124) |
| 0.0 | 0.3 | GO:0005921 | gap junction(GO:0005921) |
| 0.0 | 0.5 | GO:0030426 | growth cone(GO:0030426) |
| 0.0 | 0.3 | GO:0005680 | anaphase-promoting complex(GO:0005680) |
| 0.0 | 0.5 | GO:0001533 | cornified envelope(GO:0001533) |
| 0.0 | 0.9 | GO:0031225 | anchored component of membrane(GO:0031225) |
| 0.0 | 0.1 | GO:0000800 | lateral element(GO:0000800) |
Gene overrepresentation in molecular_function category:
| Log-likelihood per target | Total log-likelihood | Term | Description |
|---|---|---|---|
| 9.2 | 27.5 | GO:0004157 | dihydropyrimidinase activity(GO:0004157) |
| 5.8 | 29.0 | GO:0004066 | asparagine synthase (glutamine-hydrolyzing) activity(GO:0004066) |
| 4.9 | 14.8 | GO:0004347 | glucose-6-phosphate isomerase activity(GO:0004347) |
| 4.4 | 52.3 | GO:0004971 | AMPA glutamate receptor activity(GO:0004971) |
| 3.7 | 11.2 | GO:0035403 | histone kinase activity (H3-T6 specific)(GO:0035403) |
| 3.2 | 12.7 | GO:0004743 | pyruvate kinase activity(GO:0004743) |
| 3.0 | 8.9 | GO:0004965 | G-protein coupled GABA receptor activity(GO:0004965) |
| 2.5 | 9.9 | GO:0099609 | microtubule lateral binding(GO:0099609) |
| 2.3 | 13.5 | GO:0004634 | phosphopyruvate hydratase activity(GO:0004634) |
| 2.1 | 19.2 | GO:0015288 | porin activity(GO:0015288) |
| 1.9 | 7.6 | GO:0050220 | prostaglandin-E synthase activity(GO:0050220) |
| 1.9 | 5.6 | GO:0032427 | GBD domain binding(GO:0032427) |
| 1.8 | 7.4 | GO:0004739 | pyruvate dehydrogenase (acetyl-transferring) activity(GO:0004739) |
| 1.8 | 12.7 | GO:0047134 | protein-disulfide reductase activity(GO:0047134) |
| 1.8 | 5.4 | GO:0004768 | stearoyl-CoA 9-desaturase activity(GO:0004768) acyl-CoA desaturase activity(GO:0016215) |
| 1.8 | 5.3 | GO:0045322 | unmethylated CpG binding(GO:0045322) |
| 1.7 | 6.9 | GO:0034057 | RNA strand-exchange activity(GO:0034057) |
| 1.7 | 15.4 | GO:0032051 | clathrin light chain binding(GO:0032051) |
| 1.7 | 5.1 | GO:0070364 | mitochondrial light strand promoter anti-sense binding(GO:0070361) mitochondrial heavy strand promoter anti-sense binding(GO:0070362) mitochondrial heavy strand promoter sense binding(GO:0070364) |
| 1.6 | 6.6 | GO:0004449 | isocitrate dehydrogenase (NAD+) activity(GO:0004449) |
| 1.6 | 4.8 | GO:0016534 | cyclin-dependent protein kinase 5 activator activity(GO:0016534) |
| 1.5 | 1.5 | GO:0003854 | 3-beta-hydroxy-delta5-steroid dehydrogenase activity(GO:0003854) |
| 1.5 | 4.5 | GO:0016418 | S-acetyltransferase activity(GO:0016418) |
| 1.5 | 8.8 | GO:0034513 | box H/ACA snoRNA binding(GO:0034513) |
| 1.5 | 7.3 | GO:0001641 | group II metabotropic glutamate receptor activity(GO:0001641) |
| 1.4 | 8.5 | GO:1903135 | cupric ion binding(GO:1903135) |
| 1.4 | 4.2 | GO:0045155 | electron transporter, transferring electrons from CoQH2-cytochrome c reductase complex and cytochrome c oxidase complex activity(GO:0045155) |
| 1.3 | 7.8 | GO:0004167 | dopachrome isomerase activity(GO:0004167) |
| 1.3 | 23.4 | GO:0001054 | RNA polymerase I activity(GO:0001054) |
| 1.3 | 6.5 | GO:0016403 | dimethylargininase activity(GO:0016403) |
| 1.3 | 5.0 | GO:0003989 | acetyl-CoA carboxylase activity(GO:0003989) |
| 1.2 | 12.4 | GO:0030911 | TPR domain binding(GO:0030911) |
| 1.2 | 14.7 | GO:0019911 | structural constituent of myelin sheath(GO:0019911) |
| 1.2 | 9.6 | GO:0004470 | malic enzyme activity(GO:0004470) |
| 1.2 | 13.2 | GO:0001042 | RNA polymerase I core binding(GO:0001042) |
| 1.2 | 18.0 | GO:0019855 | calcium channel inhibitor activity(GO:0019855) |
| 1.2 | 3.5 | GO:0046921 | glycoprotein 6-alpha-L-fucosyltransferase activity(GO:0008424) alpha-(1->6)-fucosyltransferase activity(GO:0046921) |
| 1.2 | 4.6 | GO:0003938 | IMP dehydrogenase activity(GO:0003938) |
| 1.1 | 11.2 | GO:1903136 | cuprous ion binding(GO:1903136) |
| 1.1 | 3.3 | GO:0004020 | adenylylsulfate kinase activity(GO:0004020) sulfate adenylyltransferase activity(GO:0004779) sulfate adenylyltransferase (ATP) activity(GO:0004781) |
| 1.1 | 18.5 | GO:0019206 | nucleoside kinase activity(GO:0019206) |
| 1.1 | 3.3 | GO:0016435 | rRNA (guanine) methyltransferase activity(GO:0016435) |
| 1.1 | 3.2 | GO:0102008 | cytosolic dipeptidase activity(GO:0102008) |
| 1.0 | 7.3 | GO:0004351 | glutamate decarboxylase activity(GO:0004351) |
| 1.0 | 3.1 | GO:0004492 | methylmalonyl-CoA decarboxylase activity(GO:0004492) |
| 1.0 | 3.1 | GO:0033149 | FFAT motif binding(GO:0033149) |
| 1.0 | 9.2 | GO:0016863 | intramolecular oxidoreductase activity, transposing C=C bonds(GO:0016863) |
| 1.0 | 3.0 | GO:0042134 | rRNA primary transcript binding(GO:0042134) |
| 1.0 | 2.9 | GO:0015230 | FAD transmembrane transporter activity(GO:0015230) |
| 1.0 | 12.5 | GO:0008503 | benzodiazepine receptor activity(GO:0008503) |
| 0.9 | 5.6 | GO:0099602 | acetylcholine receptor regulator activity(GO:0030548) neurotransmitter receptor regulator activity(GO:0099602) |
| 0.9 | 2.8 | GO:0004822 | isoleucine-tRNA ligase activity(GO:0004822) |
| 0.9 | 16.5 | GO:0001163 | RNA polymerase I regulatory region DNA binding(GO:0001013) RNA polymerase I regulatory region sequence-specific DNA binding(GO:0001163) RNA polymerase I CORE element sequence-specific DNA binding(GO:0001164) |
| 0.9 | 2.7 | GO:0004514 | nicotinate-nucleotide diphosphorylase (carboxylating) activity(GO:0004514) |
| 0.9 | 9.8 | GO:0055131 | C3HC4-type RING finger domain binding(GO:0055131) |
| 0.9 | 5.2 | GO:0050291 | sphingosine N-acyltransferase activity(GO:0050291) |
| 0.9 | 4.3 | GO:0070097 | delta-catenin binding(GO:0070097) |
| 0.9 | 2.6 | GO:0032184 | SUMO polymer binding(GO:0032184) |
| 0.8 | 18.7 | GO:0035198 | miRNA binding(GO:0035198) |
| 0.8 | 5.9 | GO:0015501 | glutamate:sodium symporter activity(GO:0015501) |
| 0.8 | 3.4 | GO:0004047 | aminomethyltransferase activity(GO:0004047) |
| 0.8 | 1.7 | GO:0004771 | sterol esterase activity(GO:0004771) |
| 0.8 | 4.2 | GO:0046912 | transferase activity, transferring acyl groups, acyl groups converted into alkyl on transfer(GO:0046912) |
| 0.8 | 8.3 | GO:0005094 | Rho GDP-dissociation inhibitor activity(GO:0005094) |
| 0.8 | 9.1 | GO:0001135 | transcription factor activity, RNA polymerase II transcription factor recruiting(GO:0001135) |
| 0.8 | 4.8 | GO:0003998 | acylphosphatase activity(GO:0003998) |
| 0.8 | 3.2 | GO:0004735 | pyrroline-5-carboxylate reductase activity(GO:0004735) |
| 0.8 | 5.4 | GO:1990226 | histone methyltransferase binding(GO:1990226) |
| 0.8 | 7.7 | GO:0015266 | protein channel activity(GO:0015266) |
| 0.8 | 2.3 | GO:0034038 | deoxyhypusine synthase activity(GO:0034038) |
| 0.8 | 1.5 | GO:0004528 | phosphodiesterase I activity(GO:0004528) |
| 0.7 | 2.8 | GO:0032406 | MutLbeta complex binding(GO:0032406) MutSbeta complex binding(GO:0032408) |
| 0.7 | 2.1 | GO:0080130 | L-phenylalanine aminotransferase activity(GO:0070546) L-phenylalanine:2-oxoglutarate aminotransferase activity(GO:0080130) |
| 0.7 | 18.2 | GO:0031489 | myosin V binding(GO:0031489) |
| 0.7 | 9.7 | GO:0004723 | calcium-dependent protein serine/threonine phosphatase activity(GO:0004723) |
| 0.7 | 4.1 | GO:0004741 | [pyruvate dehydrogenase (lipoamide)] phosphatase activity(GO:0004741) |
| 0.7 | 2.1 | GO:0004362 | glutathione-disulfide reductase activity(GO:0004362) |
| 0.7 | 4.7 | GO:0050815 | phosphoserine binding(GO:0050815) |
| 0.7 | 4.7 | GO:0004457 | lactate dehydrogenase activity(GO:0004457) L-lactate dehydrogenase activity(GO:0004459) |
| 0.7 | 6.6 | GO:0019869 | chloride channel inhibitor activity(GO:0019869) |
| 0.7 | 3.3 | GO:0052832 | inositol monophosphate 1-phosphatase activity(GO:0008934) inositol monophosphate 3-phosphatase activity(GO:0052832) inositol monophosphate 4-phosphatase activity(GO:0052833) inositol monophosphate phosphatase activity(GO:0052834) |
| 0.6 | 3.2 | GO:0004815 | aspartate-tRNA ligase activity(GO:0004815) |
| 0.6 | 2.5 | GO:0019828 | glyceraldehyde-3-phosphate dehydrogenase (NAD+) (phosphorylating) activity(GO:0004365) aspartic-type endopeptidase inhibitor activity(GO:0019828) glyceraldehyde-3-phosphate dehydrogenase (NAD(P)+) (phosphorylating) activity(GO:0043891) |
| 0.6 | 1.9 | GO:0008309 | double-stranded DNA exodeoxyribonuclease activity(GO:0008309) |
| 0.6 | 1.9 | GO:0004802 | transketolase activity(GO:0004802) |
| 0.6 | 3.1 | GO:0044736 | acid-sensing ion channel activity(GO:0044736) |
| 0.6 | 3.8 | GO:0044547 | DNA topoisomerase binding(GO:0044547) |
| 0.6 | 6.3 | GO:0043024 | ribosomal small subunit binding(GO:0043024) |
| 0.6 | 4.9 | GO:0008379 | thioredoxin peroxidase activity(GO:0008379) |
| 0.6 | 7.3 | GO:0097100 | supercoiled DNA binding(GO:0097100) |
| 0.6 | 1.8 | GO:0000253 | 3-keto sterol reductase activity(GO:0000253) |
| 0.6 | 1.8 | GO:1990404 | protein ADP-ribosylase activity(GO:1990404) |
| 0.6 | 1.8 | GO:0061752 | telomeric repeat-containing RNA binding(GO:0061752) |
| 0.6 | 3.5 | GO:0004383 | guanylate cyclase activity(GO:0004383) |
| 0.6 | 9.6 | GO:0005522 | profilin binding(GO:0005522) |
| 0.6 | 2.2 | GO:0047391 | alkylglycerophosphoethanolamine phosphodiesterase activity(GO:0047391) |
| 0.6 | 5.6 | GO:1990446 | U1 snRNP binding(GO:1990446) |
| 0.6 | 15.0 | GO:0051010 | microtubule plus-end binding(GO:0051010) |
| 0.5 | 2.7 | GO:0010340 | carboxyl-O-methyltransferase activity(GO:0010340) protein carboxyl O-methyltransferase activity(GO:0051998) |
| 0.5 | 3.2 | GO:0004677 | DNA-dependent protein kinase activity(GO:0004677) |
| 0.5 | 2.1 | GO:0008466 | glycogenin glucosyltransferase activity(GO:0008466) |
| 0.5 | 2.1 | GO:0035243 | protein-arginine omega-N symmetric methyltransferase activity(GO:0035243) |
| 0.5 | 3.0 | GO:0003872 | 6-phosphofructokinase activity(GO:0003872) |
| 0.5 | 14.1 | GO:0046961 | proton-transporting ATPase activity, rotational mechanism(GO:0046961) |
| 0.5 | 2.5 | GO:0015183 | L-aspartate transmembrane transporter activity(GO:0015183) |
| 0.5 | 1.5 | GO:0034739 | histone deacetylase activity (H4-K16 specific)(GO:0034739) |
| 0.5 | 1.0 | GO:0035529 | NADH pyrophosphatase activity(GO:0035529) |
| 0.5 | 1.4 | GO:0004766 | spermidine synthase activity(GO:0004766) |
| 0.5 | 1.4 | GO:0000150 | recombinase activity(GO:0000150) |
| 0.5 | 12.1 | GO:0005086 | ARF guanyl-nucleotide exchange factor activity(GO:0005086) |
| 0.5 | 4.6 | GO:0016018 | cyclosporin A binding(GO:0016018) |
| 0.5 | 1.4 | GO:0046573 | lactonohydrolase activity(GO:0046573) acyl-L-homoserine-lactone lactonohydrolase activity(GO:0102007) |
| 0.5 | 2.3 | GO:0031697 | beta-1 adrenergic receptor binding(GO:0031697) |
| 0.4 | 4.0 | GO:0070883 | pre-miRNA binding(GO:0070883) |
| 0.4 | 1.8 | GO:0004826 | phenylalanine-tRNA ligase activity(GO:0004826) |
| 0.4 | 0.9 | GO:1904315 | neurotransmitter receptor activity involved in regulation of postsynaptic membrane potential(GO:0099529) transmitter-gated ion channel activity involved in regulation of postsynaptic membrane potential(GO:1904315) |
| 0.4 | 4.0 | GO:0001056 | RNA polymerase III activity(GO:0001056) |
| 0.4 | 0.9 | GO:0035240 | dopamine binding(GO:0035240) |
| 0.4 | 1.3 | GO:0004090 | carbonyl reductase (NADPH) activity(GO:0004090) |
| 0.4 | 5.5 | GO:0097109 | neuroligin family protein binding(GO:0097109) |
| 0.4 | 1.2 | GO:0008321 | Ral guanyl-nucleotide exchange factor activity(GO:0008321) |
| 0.4 | 4.1 | GO:0001055 | RNA polymerase II activity(GO:0001055) |
| 0.4 | 2.4 | GO:0050811 | GABA receptor binding(GO:0050811) |
| 0.4 | 2.0 | GO:0004668 | protein-arginine deiminase activity(GO:0004668) |
| 0.4 | 2.0 | GO:0004591 | oxoglutarate dehydrogenase (succinyl-transferring) activity(GO:0004591) |
| 0.4 | 3.2 | GO:0001849 | complement component C1q binding(GO:0001849) |
| 0.4 | 2.3 | GO:0030346 | protein phosphatase 2B binding(GO:0030346) |
| 0.4 | 2.0 | GO:0008525 | phosphatidylcholine transporter activity(GO:0008525) |
| 0.4 | 4.3 | GO:0016755 | transferase activity, transferring amino-acyl groups(GO:0016755) |
| 0.4 | 7.0 | GO:0102391 | decanoate--CoA ligase activity(GO:0102391) |
| 0.4 | 1.2 | GO:0004392 | heme oxygenase (decyclizing) activity(GO:0004392) |
| 0.4 | 20.4 | GO:0017080 | sodium channel regulator activity(GO:0017080) |
| 0.4 | 2.3 | GO:0042610 | type 5 metabotropic glutamate receptor binding(GO:0031802) CD8 receptor binding(GO:0042610) |
| 0.4 | 1.1 | GO:0008192 | RNA guanylyltransferase activity(GO:0008192) |
| 0.4 | 1.1 | GO:0045174 | oxidoreductase activity, acting on a sulfur group of donors, quinone or similar compound as acceptor(GO:0016672) glutathione dehydrogenase (ascorbate) activity(GO:0045174) methylarsonate reductase activity(GO:0050610) |
| 0.4 | 1.8 | GO:0008479 | queuine tRNA-ribosyltransferase activity(GO:0008479) |
| 0.4 | 1.1 | GO:0004756 | selenide, water dikinase activity(GO:0004756) phosphotransferase activity, paired acceptors(GO:0016781) |
| 0.4 | 1.1 | GO:0043422 | protein kinase B binding(GO:0043422) |
| 0.4 | 2.9 | GO:0015349 | thyroid hormone transmembrane transporter activity(GO:0015349) |
| 0.4 | 4.7 | GO:0015245 | fatty acid transporter activity(GO:0015245) |
| 0.4 | 1.1 | GO:0004828 | serine-tRNA ligase activity(GO:0004828) |
| 0.4 | 1.4 | GO:0015207 | ATP:ADP antiporter activity(GO:0005471) adenine transmembrane transporter activity(GO:0015207) |
| 0.4 | 0.7 | GO:0015924 | mannosyl-oligosaccharide mannosidase activity(GO:0015924) |
| 0.3 | 1.7 | GO:0030620 | U2 snRNA binding(GO:0030620) |
| 0.3 | 3.4 | GO:0022851 | GABA-gated chloride ion channel activity(GO:0022851) |
| 0.3 | 7.1 | GO:0019843 | rRNA binding(GO:0019843) |
| 0.3 | 1.0 | GO:0004962 | endothelin receptor activity(GO:0004962) |
| 0.3 | 8.5 | GO:0005184 | neuropeptide hormone activity(GO:0005184) |
| 0.3 | 13.9 | GO:0004683 | calmodulin-dependent protein kinase activity(GO:0004683) |
| 0.3 | 1.3 | GO:0032795 | heterotrimeric G-protein binding(GO:0032795) |
| 0.3 | 1.7 | GO:0038051 | glucocorticoid receptor activity(GO:0004883) glucocorticoid-activated RNA polymerase II transcription factor binding transcription factor activity(GO:0038051) |
| 0.3 | 3.0 | GO:0016884 | carbon-nitrogen ligase activity, with glutamine as amido-N-donor(GO:0016884) |
| 0.3 | 1.0 | GO:0004170 | dUTP diphosphatase activity(GO:0004170) |
| 0.3 | 5.6 | GO:0008483 | transaminase activity(GO:0008483) |
| 0.3 | 8.2 | GO:0004012 | phospholipid-translocating ATPase activity(GO:0004012) |
| 0.3 | 1.3 | GO:0035651 | AP-1 adaptor complex binding(GO:0035650) AP-3 adaptor complex binding(GO:0035651) |
| 0.3 | 1.0 | GO:0034186 | apolipoprotein A-I binding(GO:0034186) |
| 0.3 | 1.3 | GO:0015232 | heme transporter activity(GO:0015232) |
| 0.3 | 0.6 | GO:0010484 | H3 histone acetyltransferase activity(GO:0010484) |
| 0.3 | 0.9 | GO:0004523 | RNA-DNA hybrid ribonuclease activity(GO:0004523) |
| 0.3 | 2.2 | GO:0031821 | G-protein coupled serotonin receptor binding(GO:0031821) |
| 0.3 | 8.3 | GO:0043015 | gamma-tubulin binding(GO:0043015) |
| 0.3 | 6.8 | GO:0004707 | MAP kinase activity(GO:0004707) |
| 0.3 | 2.4 | GO:0048273 | mitogen-activated protein kinase p38 binding(GO:0048273) |
| 0.3 | 1.8 | GO:0034511 | U3 snoRNA binding(GO:0034511) |
| 0.3 | 6.2 | GO:0005545 | 1-phosphatidylinositol binding(GO:0005545) |
| 0.3 | 1.5 | GO:0048365 | Rac GTPase binding(GO:0048365) |
| 0.3 | 1.4 | GO:0008174 | mRNA methyltransferase activity(GO:0008174) |
| 0.3 | 1.7 | GO:0035612 | AP-2 adaptor complex binding(GO:0035612) |
| 0.3 | 13.1 | GO:0016763 | transferase activity, transferring pentosyl groups(GO:0016763) |
| 0.3 | 15.8 | GO:0004112 | cyclic-nucleotide phosphodiesterase activity(GO:0004112) |
| 0.3 | 3.9 | GO:0031996 | thioesterase binding(GO:0031996) |
| 0.3 | 0.8 | GO:0015616 | DNA translocase activity(GO:0015616) |
| 0.3 | 1.1 | GO:0004046 | aminoacylase activity(GO:0004046) |
| 0.3 | 9.6 | GO:0071855 | neuropeptide receptor binding(GO:0071855) |
| 0.3 | 1.9 | GO:0016308 | 1-phosphatidylinositol-4-phosphate 5-kinase activity(GO:0016308) |
| 0.3 | 1.9 | GO:0035256 | G-protein coupled glutamate receptor binding(GO:0035256) |
| 0.3 | 9.4 | GO:0030159 | receptor signaling complex scaffold activity(GO:0030159) |
| 0.3 | 0.5 | GO:0070538 | oleic acid binding(GO:0070538) |
| 0.3 | 0.3 | GO:0016769 | transferase activity, transferring nitrogenous groups(GO:0016769) |
| 0.3 | 0.8 | GO:0015218 | pyrimidine nucleotide transmembrane transporter activity(GO:0015218) |
| 0.3 | 10.9 | GO:0000049 | tRNA binding(GO:0000049) |
| 0.3 | 0.8 | GO:0003858 | 3-hydroxybutyrate dehydrogenase activity(GO:0003858) |
| 0.3 | 6.3 | GO:0016505 | peptidase activator activity involved in apoptotic process(GO:0016505) |
| 0.3 | 1.0 | GO:0008940 | nitrate reductase activity(GO:0008940) |
| 0.3 | 2.6 | GO:0008607 | phosphorylase kinase regulator activity(GO:0008607) |
| 0.3 | 6.2 | GO:0017075 | syntaxin-1 binding(GO:0017075) |
| 0.3 | 0.8 | GO:0004616 | phosphogluconate dehydrogenase (decarboxylating) activity(GO:0004616) |
| 0.3 | 0.8 | GO:0010698 | acetyltransferase activator activity(GO:0010698) |
| 0.3 | 2.3 | GO:0016176 | superoxide-generating NADPH oxidase activator activity(GO:0016176) |
| 0.3 | 1.5 | GO:0004331 | 6-phosphofructo-2-kinase activity(GO:0003873) fructose-2,6-bisphosphate 2-phosphatase activity(GO:0004331) |
| 0.3 | 3.8 | GO:0043295 | glutathione binding(GO:0043295) |
| 0.2 | 2.0 | GO:0000340 | RNA 7-methylguanosine cap binding(GO:0000340) |
| 0.2 | 2.0 | GO:0001162 | RNA polymerase II intronic transcription regulatory region sequence-specific DNA binding(GO:0001162) |
| 0.2 | 4.5 | GO:0008349 | MAP kinase kinase kinase kinase activity(GO:0008349) |
| 0.2 | 1.5 | GO:0005087 | Ran guanyl-nucleotide exchange factor activity(GO:0005087) |
| 0.2 | 0.7 | GO:0071987 | WD40-repeat domain binding(GO:0071987) |
| 0.2 | 1.7 | GO:0015277 | kainate selective glutamate receptor activity(GO:0015277) |
| 0.2 | 0.7 | GO:0080019 | fatty-acyl-CoA reductase (alcohol-forming) activity(GO:0080019) |
| 0.2 | 0.7 | GO:0004464 | leukotriene-C4 synthase activity(GO:0004464) |
| 0.2 | 0.2 | GO:0001025 | RNA polymerase III transcription factor binding(GO:0001025) |
| 0.2 | 2.8 | GO:0086080 | protein binding involved in heterotypic cell-cell adhesion(GO:0086080) |
| 0.2 | 3.3 | GO:0000993 | RNA polymerase II core binding(GO:0000993) |
| 0.2 | 1.4 | GO:0042296 | ISG15 transferase activity(GO:0042296) |
| 0.2 | 1.6 | GO:0032138 | single base insertion or deletion binding(GO:0032138) |
| 0.2 | 0.9 | GO:0008184 | glycogen phosphorylase activity(GO:0008184) |
| 0.2 | 4.4 | GO:0003924 | GTPase activity(GO:0003924) |
| 0.2 | 3.5 | GO:0016917 | GABA-A receptor activity(GO:0004890) GABA receptor activity(GO:0016917) |
| 0.2 | 2.0 | GO:0046976 | histone methyltransferase activity (H3-K27 specific)(GO:0046976) |
| 0.2 | 0.6 | GO:0048256 | flap endonuclease activity(GO:0048256) |
| 0.2 | 1.3 | GO:0016802 | adenosylhomocysteinase activity(GO:0004013) trialkylsulfonium hydrolase activity(GO:0016802) |
| 0.2 | 0.9 | GO:0042608 | T cell receptor binding(GO:0042608) |
| 0.2 | 2.7 | GO:0038132 | neuregulin binding(GO:0038132) |
| 0.2 | 0.8 | GO:0016427 | tRNA (cytosine) methyltransferase activity(GO:0016427) |
| 0.2 | 2.7 | GO:0008641 | small protein activating enzyme activity(GO:0008641) |
| 0.2 | 21.3 | GO:0003697 | single-stranded DNA binding(GO:0003697) |
| 0.2 | 0.6 | GO:0003978 | UDP-N-acetylglucosamine 4-epimerase activity(GO:0003974) UDP-glucose 4-epimerase activity(GO:0003978) |
| 0.2 | 3.8 | GO:0097602 | cullin family protein binding(GO:0097602) |
| 0.2 | 3.0 | GO:0016174 | NAD(P)H oxidase activity(GO:0016174) |
| 0.2 | 8.8 | GO:0003785 | actin monomer binding(GO:0003785) |
| 0.2 | 2.7 | GO:0030515 | snoRNA binding(GO:0030515) |
| 0.2 | 1.4 | GO:0030229 | very-low-density lipoprotein particle receptor activity(GO:0030229) |
| 0.2 | 0.6 | GO:0017150 | tRNA dihydrouridine synthase activity(GO:0017150) |
| 0.2 | 1.2 | GO:0008467 | [heparan sulfate]-glucosamine 3-sulfotransferase 1 activity(GO:0008467) |
| 0.2 | 0.8 | GO:0016813 | hydrolase activity, acting on carbon-nitrogen (but not peptide) bonds, in linear amidines(GO:0016813) |
| 0.2 | 0.8 | GO:0016230 | sphingomyelin phosphodiesterase activator activity(GO:0016230) |
| 0.2 | 0.4 | GO:0051920 | peroxiredoxin activity(GO:0051920) |
| 0.2 | 0.6 | GO:0004663 | Rab geranylgeranyltransferase activity(GO:0004663) |
| 0.2 | 2.8 | GO:0008179 | adenylate cyclase binding(GO:0008179) |
| 0.2 | 9.8 | GO:0050136 | NADH dehydrogenase (ubiquinone) activity(GO:0008137) NADH dehydrogenase (quinone) activity(GO:0050136) |
| 0.2 | 0.6 | GO:0047192 | 1-alkylglycerophosphocholine O-acetyltransferase activity(GO:0047192) |
| 0.2 | 0.7 | GO:0017040 | ceramidase activity(GO:0017040) |
| 0.2 | 0.5 | GO:0004961 | thromboxane receptor activity(GO:0004960) thromboxane A2 receptor activity(GO:0004961) |
| 0.2 | 5.1 | GO:0015149 | hexose transmembrane transporter activity(GO:0015149) |
| 0.2 | 0.4 | GO:0043515 | kinetochore binding(GO:0043515) |
| 0.2 | 1.6 | GO:0004032 | alditol:NADP+ 1-oxidoreductase activity(GO:0004032) |
| 0.2 | 6.4 | GO:0051721 | protein phosphatase 2A binding(GO:0051721) |
| 0.2 | 1.2 | GO:0004372 | glycine hydroxymethyltransferase activity(GO:0004372) threonine aldolase activity(GO:0004793) L-allo-threonine aldolase activity(GO:0008732) |
| 0.2 | 0.7 | GO:0004886 | 9-cis retinoic acid receptor activity(GO:0004886) |
| 0.2 | 1.4 | GO:0086056 | voltage-gated calcium channel activity involved in AV node cell action potential(GO:0086056) |
| 0.2 | 0.7 | GO:0015181 | arginine transmembrane transporter activity(GO:0015181) |
| 0.2 | 1.5 | GO:0016886 | ligase activity, forming phosphoric ester bonds(GO:0016886) |
| 0.2 | 17.9 | GO:0005249 | voltage-gated potassium channel activity(GO:0005249) |
| 0.2 | 3.4 | GO:0070628 | proteasome binding(GO:0070628) |
| 0.2 | 0.7 | GO:0008823 | cupric reductase activity(GO:0008823) ferric-chelate reductase (NADPH) activity(GO:0052851) |
| 0.2 | 2.5 | GO:0015250 | water channel activity(GO:0015250) |
| 0.2 | 6.6 | GO:0016709 | oxidoreductase activity, acting on paired donors, with incorporation or reduction of molecular oxygen, NAD(P)H as one donor, and incorporation of one atom of oxygen(GO:0016709) |
| 0.2 | 0.7 | GO:0042030 | ATPase inhibitor activity(GO:0042030) |
| 0.2 | 0.5 | GO:0004829 | threonine-tRNA ligase activity(GO:0004829) |
| 0.2 | 1.0 | GO:0043142 | single-stranded DNA-dependent ATPase activity(GO:0043142) |
| 0.2 | 0.3 | GO:0004711 | ribosomal protein S6 kinase activity(GO:0004711) |
| 0.2 | 0.8 | GO:0000014 | single-stranded DNA endodeoxyribonuclease activity(GO:0000014) |
| 0.2 | 0.6 | GO:0004706 | JUN kinase kinase kinase activity(GO:0004706) |
| 0.2 | 4.7 | GO:0004181 | metallocarboxypeptidase activity(GO:0004181) |
| 0.2 | 2.2 | GO:0004875 | complement receptor activity(GO:0004875) |
| 0.2 | 4.5 | GO:0008574 | ATP-dependent microtubule motor activity, plus-end-directed(GO:0008574) |
| 0.2 | 3.3 | GO:0044769 | ATPase activity, coupled to transmembrane movement of ions, rotational mechanism(GO:0044769) |
| 0.2 | 1.1 | GO:0035005 | 1-phosphatidylinositol-4-phosphate 3-kinase activity(GO:0035005) |
| 0.2 | 0.6 | GO:0005078 | MAP-kinase scaffold activity(GO:0005078) |
| 0.2 | 3.2 | GO:0031005 | filamin binding(GO:0031005) |
| 0.2 | 1.4 | GO:0008432 | JUN kinase binding(GO:0008432) |
| 0.2 | 1.1 | GO:0004300 | enoyl-CoA hydratase activity(GO:0004300) |
| 0.2 | 6.9 | GO:0019212 | phosphatase inhibitor activity(GO:0019212) |
| 0.1 | 2.1 | GO:0034979 | NAD-dependent protein deacetylase activity(GO:0034979) |
| 0.1 | 0.9 | GO:0015923 | mannosidase activity(GO:0015923) |
| 0.1 | 0.7 | GO:0071535 | RING-like zinc finger domain binding(GO:0071535) |
| 0.1 | 2.4 | GO:0017056 | structural constituent of nuclear pore(GO:0017056) |
| 0.1 | 2.5 | GO:0005095 | GTPase inhibitor activity(GO:0005095) |
| 0.1 | 5.5 | GO:0008139 | nuclear localization sequence binding(GO:0008139) |
| 0.1 | 1.4 | GO:0070061 | fructose binding(GO:0070061) |
| 0.1 | 2.1 | GO:0004862 | cAMP-dependent protein kinase inhibitor activity(GO:0004862) |
| 0.1 | 2.5 | GO:0005385 | zinc ion transmembrane transporter activity(GO:0005385) |
| 0.1 | 0.8 | GO:0019776 | Atg8 ligase activity(GO:0019776) |
| 0.1 | 0.4 | GO:0001069 | regulatory region RNA binding(GO:0001069) |
| 0.1 | 0.4 | GO:0015180 | L-alanine transmembrane transporter activity(GO:0015180) alanine transmembrane transporter activity(GO:0022858) |
| 0.1 | 1.4 | GO:0004716 | receptor signaling protein tyrosine kinase activity(GO:0004716) |
| 0.1 | 0.7 | GO:0043120 | tumor necrosis factor binding(GO:0043120) |
| 0.1 | 9.4 | GO:0008186 | RNA-dependent ATPase activity(GO:0008186) |
| 0.1 | 2.3 | GO:0004143 | diacylglycerol kinase activity(GO:0004143) |
| 0.1 | 2.3 | GO:0043274 | phospholipase binding(GO:0043274) |
| 0.1 | 1.5 | GO:1990247 | N6-methyladenosine-containing RNA binding(GO:1990247) |
| 0.1 | 0.4 | GO:0010861 | thyroid hormone receptor activator activity(GO:0010861) thyroid hormone receptor coactivator activity(GO:0030375) |
| 0.1 | 2.1 | GO:0004691 | cAMP-dependent protein kinase activity(GO:0004691) |
| 0.1 | 1.1 | GO:0048495 | Roundabout binding(GO:0048495) |
| 0.1 | 1.8 | GO:0070034 | telomerase RNA binding(GO:0070034) |
| 0.1 | 0.7 | GO:0001132 | RNA polymerase II transcription factor activity, TBP-class protein binding, involved in preinitiation complex assembly(GO:0001129) RNA polymerase II transcription factor activity, TBP-class protein binding(GO:0001132) |
| 0.1 | 0.8 | GO:0019531 | oxalate transmembrane transporter activity(GO:0019531) |
| 0.1 | 1.8 | GO:0015095 | magnesium ion transmembrane transporter activity(GO:0015095) |
| 0.1 | 3.3 | GO:0008191 | metalloendopeptidase inhibitor activity(GO:0008191) |
| 0.1 | 0.4 | GO:0098626 | methylselenol reductase activity(GO:0098625) methylseleninic acid reductase activity(GO:0098626) |
| 0.1 | 2.1 | GO:0050780 | dopamine receptor binding(GO:0050780) |
| 0.1 | 2.8 | GO:0008239 | dipeptidyl-peptidase activity(GO:0008239) |
| 0.1 | 0.9 | GO:0061575 | cyclin-dependent protein serine/threonine kinase activator activity(GO:0061575) |
| 0.1 | 0.5 | GO:0046899 | nucleoside triphosphate adenylate kinase activity(GO:0046899) |
| 0.1 | 1.2 | GO:0042731 | PH domain binding(GO:0042731) |
| 0.1 | 0.6 | GO:0016286 | small conductance calcium-activated potassium channel activity(GO:0016286) |
| 0.1 | 0.4 | GO:0005171 | hepatocyte growth factor receptor binding(GO:0005171) |
| 0.1 | 0.2 | GO:0070326 | very-low-density lipoprotein particle receptor binding(GO:0070326) |
| 0.1 | 0.4 | GO:0016426 | tRNA (adenine) methyltransferase activity(GO:0016426) tRNA (adenine-N1-)-methyltransferase activity(GO:0016429) |
| 0.1 | 25.9 | GO:0003735 | structural constituent of ribosome(GO:0003735) |
| 0.1 | 1.3 | GO:0003899 | DNA-directed RNA polymerase activity(GO:0003899) |
| 0.1 | 1.1 | GO:0060002 | plus-end directed microfilament motor activity(GO:0060002) |
| 0.1 | 1.4 | GO:0031386 | protein tag(GO:0031386) |
| 0.1 | 0.8 | GO:0070891 | lipoteichoic acid binding(GO:0070891) |
| 0.1 | 0.6 | GO:1990460 | leptin receptor binding(GO:1990460) |
| 0.1 | 3.6 | GO:0000287 | magnesium ion binding(GO:0000287) |
| 0.1 | 1.5 | GO:0036122 | BMP binding(GO:0036122) |
| 0.1 | 3.2 | GO:0015248 | sterol transporter activity(GO:0015248) |
| 0.1 | 0.1 | GO:0005544 | calcium-dependent phospholipid binding(GO:0005544) |
| 0.1 | 0.1 | GO:0047631 | ADP-ribose diphosphatase activity(GO:0047631) |
| 0.1 | 1.0 | GO:0047623 | AMP deaminase activity(GO:0003876) adenosine-phosphate deaminase activity(GO:0047623) |
| 0.1 | 1.0 | GO:0005005 | transmembrane-ephrin receptor activity(GO:0005005) |
| 0.1 | 0.5 | GO:0004647 | phosphoserine phosphatase activity(GO:0004647) |
| 0.1 | 0.9 | GO:0003906 | DNA-(apurinic or apyrimidinic site) lyase activity(GO:0003906) |
| 0.1 | 0.6 | GO:0051425 | PTB domain binding(GO:0051425) |
| 0.1 | 0.4 | GO:0097157 | pre-mRNA intronic binding(GO:0097157) |
| 0.1 | 0.4 | GO:0015111 | iodide transmembrane transporter activity(GO:0015111) |
| 0.1 | 0.6 | GO:0072320 | volume-sensitive chloride channel activity(GO:0072320) |
| 0.1 | 1.1 | GO:0034450 | ubiquitin-ubiquitin ligase activity(GO:0034450) |
| 0.1 | 2.7 | GO:0005080 | protein kinase C binding(GO:0005080) |
| 0.1 | 2.7 | GO:0005035 | tumor necrosis factor-activated receptor activity(GO:0005031) death receptor activity(GO:0005035) |
| 0.1 | 0.3 | GO:0005219 | ryanodine-sensitive calcium-release channel activity(GO:0005219) calcium-induced calcium release activity(GO:0048763) |
| 0.1 | 3.5 | GO:0030544 | Hsp70 protein binding(GO:0030544) |
| 0.1 | 0.5 | GO:0017153 | sodium:dicarboxylate symporter activity(GO:0017153) |
| 0.1 | 0.4 | GO:0015319 | sodium:inorganic phosphate symporter activity(GO:0015319) |
| 0.1 | 0.4 | GO:0001609 | G-protein coupled adenosine receptor activity(GO:0001609) |
| 0.1 | 0.3 | GO:0050429 | calcium-dependent phospholipase C activity(GO:0050429) |
| 0.1 | 35.2 | GO:0005525 | GTP binding(GO:0005525) |
| 0.1 | 1.2 | GO:0004596 | peptide alpha-N-acetyltransferase activity(GO:0004596) |
| 0.1 | 2.3 | GO:0005521 | lamin binding(GO:0005521) |
| 0.1 | 3.1 | GO:0004715 | non-membrane spanning protein tyrosine kinase activity(GO:0004715) |
| 0.1 | 2.7 | GO:0004298 | threonine-type endopeptidase activity(GO:0004298) threonine-type peptidase activity(GO:0070003) |
| 0.1 | 0.5 | GO:0015252 | hydrogen ion channel activity(GO:0015252) |
| 0.1 | 1.8 | GO:0030676 | Rac guanyl-nucleotide exchange factor activity(GO:0030676) |
| 0.1 | 0.4 | GO:0001965 | G-protein alpha-subunit binding(GO:0001965) |
| 0.1 | 0.4 | GO:0004991 | parathyroid hormone receptor activity(GO:0004991) |
| 0.1 | 0.3 | GO:0061676 | importin-alpha family protein binding(GO:0061676) |
| 0.1 | 2.6 | GO:0048487 | beta-tubulin binding(GO:0048487) |
| 0.1 | 2.7 | GO:0060590 | ATPase regulator activity(GO:0060590) |
| 0.1 | 1.3 | GO:0016881 | acid-amino acid ligase activity(GO:0016881) |
| 0.1 | 0.7 | GO:0008175 | tRNA methyltransferase activity(GO:0008175) |
| 0.1 | 1.1 | GO:0019992 | diacylglycerol binding(GO:0019992) |
| 0.1 | 1.1 | GO:0042043 | neurexin family protein binding(GO:0042043) |
| 0.1 | 0.4 | GO:0008440 | inositol-1,4,5-trisphosphate 3-kinase activity(GO:0008440) |
| 0.1 | 0.3 | GO:0004748 | ribonucleoside-diphosphate reductase activity, thioredoxin disulfide as acceptor(GO:0004748) oxidoreductase activity, acting on CH or CH2 groups, disulfide as acceptor(GO:0016728) ribonucleoside-diphosphate reductase activity(GO:0061731) |
| 0.1 | 2.0 | GO:0051059 | NF-kappaB binding(GO:0051059) |
| 0.1 | 0.3 | GO:0035251 | UDP-glucosyltransferase activity(GO:0035251) |
| 0.1 | 1.0 | GO:0001083 | transcription factor activity, sequence-specific DNA binding, RNA polymerase recruiting(GO:0001011) transcription factor activity, RNA polymerase II basal transcription factor binding(GO:0001083) transcription factor activity, TFIIB-class binding(GO:0001087) |
| 0.1 | 0.3 | GO:0003886 | DNA (cytosine-5-)-methyltransferase activity(GO:0003886) |
| 0.1 | 1.7 | GO:0004062 | aryl sulfotransferase activity(GO:0004062) |
| 0.1 | 0.3 | GO:0008821 | crossover junction endodeoxyribonuclease activity(GO:0008821) |
| 0.1 | 4.5 | GO:0001540 | beta-amyloid binding(GO:0001540) |
| 0.1 | 0.5 | GO:0035174 | histone serine kinase activity(GO:0035174) |
| 0.1 | 3.9 | GO:0017112 | Rab guanyl-nucleotide exchange factor activity(GO:0017112) |
| 0.1 | 0.4 | GO:0008597 | calcium-dependent protein serine/threonine phosphatase regulator activity(GO:0008597) |
| 0.1 | 12.5 | GO:0008017 | microtubule binding(GO:0008017) |
| 0.1 | 2.8 | GO:0005504 | fatty acid binding(GO:0005504) |
| 0.1 | 0.7 | GO:0004312 | fatty acid synthase activity(GO:0004312) |
| 0.1 | 0.1 | GO:0051538 | 3 iron, 4 sulfur cluster binding(GO:0051538) |
| 0.1 | 0.3 | GO:0043559 | insulin binding(GO:0043559) |
| 0.1 | 0.1 | GO:0030983 | mismatched DNA binding(GO:0030983) |
| 0.1 | 0.7 | GO:0017034 | Rap guanyl-nucleotide exchange factor activity(GO:0017034) |
| 0.1 | 4.2 | GO:0016765 | transferase activity, transferring alkyl or aryl (other than methyl) groups(GO:0016765) |
| 0.1 | 0.5 | GO:0050700 | CARD domain binding(GO:0050700) |
| 0.1 | 3.6 | GO:0035064 | methylated histone binding(GO:0035064) |
| 0.1 | 1.9 | GO:0001106 | RNA polymerase II transcription corepressor activity(GO:0001106) |
| 0.1 | 1.2 | GO:0070530 | K63-linked polyubiquitin binding(GO:0070530) |
| 0.1 | 0.9 | GO:0015269 | calcium-activated potassium channel activity(GO:0015269) |
| 0.1 | 6.0 | GO:0051082 | unfolded protein binding(GO:0051082) |
| 0.1 | 1.1 | GO:0019894 | kinesin binding(GO:0019894) |
| 0.1 | 1.4 | GO:0022843 | voltage-gated cation channel activity(GO:0022843) |
| 0.1 | 0.6 | GO:0005007 | fibroblast growth factor-activated receptor activity(GO:0005007) |
| 0.1 | 1.1 | GO:0005112 | Notch binding(GO:0005112) |
| 0.1 | 3.8 | GO:0016811 | hydrolase activity, acting on carbon-nitrogen (but not peptide) bonds, in linear amides(GO:0016811) |
| 0.1 | 0.2 | GO:0032183 | SUMO binding(GO:0032183) |
| 0.1 | 0.2 | GO:0046997 | sarcosine dehydrogenase activity(GO:0008480) oxidoreductase activity, acting on the CH-NH group of donors, flavin as acceptor(GO:0046997) |
| 0.1 | 0.7 | GO:0016868 | intramolecular transferase activity, phosphotransferases(GO:0016868) |
| 0.1 | 0.6 | GO:0035381 | extracellular ATP-gated cation channel activity(GO:0004931) ATP-gated ion channel activity(GO:0035381) |
| 0.1 | 0.6 | GO:0070182 | DNA polymerase binding(GO:0070182) |
| 0.1 | 0.6 | GO:0008253 | 5'-nucleotidase activity(GO:0008253) |
| 0.1 | 0.4 | GO:0016167 | glial cell-derived neurotrophic factor receptor activity(GO:0016167) |
| 0.1 | 0.3 | GO:0017161 | phosphatidylinositol-3,4-bisphosphate 4-phosphatase activity(GO:0016316) inositol-1,3,4-trisphosphate 4-phosphatase activity(GO:0017161) phosphatidylinositol-4,5-bisphosphate 4-phosphatase activity(GO:0034597) inositol-3,4-bisphosphate 4-phosphatase activity(GO:0052828) |
| 0.1 | 0.2 | GO:0001588 | dopamine neurotransmitter receptor activity, coupled via Gs(GO:0001588) |
| 0.1 | 0.5 | GO:0016866 | intramolecular transferase activity(GO:0016866) |
| 0.0 | 0.2 | GO:0000990 | transcription factor activity, core RNA polymerase binding(GO:0000990) |
| 0.0 | 0.1 | GO:0051373 | FATZ binding(GO:0051373) |
| 0.0 | 0.1 | GO:0008177 | succinate dehydrogenase (ubiquinone) activity(GO:0008177) |
| 0.0 | 0.4 | GO:1990405 | protein antigen binding(GO:1990405) |
| 0.0 | 0.5 | GO:0008199 | ferric iron binding(GO:0008199) |
| 0.0 | 0.2 | GO:0004995 | tachykinin receptor activity(GO:0004995) |
| 0.0 | 0.3 | GO:0047499 | calcium-independent phospholipase A2 activity(GO:0047499) |
| 0.0 | 1.0 | GO:0005388 | calcium-transporting ATPase activity(GO:0005388) |
| 0.0 | 1.0 | GO:0003887 | DNA-directed DNA polymerase activity(GO:0003887) |
| 0.0 | 0.5 | GO:0017110 | nucleoside-diphosphatase activity(GO:0017110) |
| 0.0 | 0.5 | GO:0008026 | ATP-dependent helicase activity(GO:0008026) purine NTP-dependent helicase activity(GO:0070035) |
| 0.0 | 0.1 | GO:0098640 | integrin binding involved in cell-matrix adhesion(GO:0098640) |
| 0.0 | 2.4 | GO:0005262 | calcium channel activity(GO:0005262) |
| 0.0 | 0.1 | GO:0004947 | bradykinin receptor activity(GO:0004947) |
| 0.0 | 0.8 | GO:0032947 | protein complex scaffold(GO:0032947) |
| 0.0 | 1.2 | GO:0015631 | tubulin binding(GO:0015631) |
| 0.0 | 0.1 | GO:0051380 | beta-adrenergic receptor activity(GO:0004939) norepinephrine binding(GO:0051380) |
| 0.0 | 0.1 | GO:0016846 | carbon-sulfur lyase activity(GO:0016846) |
| 0.0 | 0.2 | GO:0052590 | sn-glycerol-3-phosphate:ubiquinone oxidoreductase activity(GO:0052590) sn-glycerol-3-phosphate:ubiquinone-8 oxidoreductase activity(GO:0052591) |
| 0.0 | 1.2 | GO:0035255 | ionotropic glutamate receptor binding(GO:0035255) |
| 0.0 | 0.2 | GO:0008073 | ornithine decarboxylase inhibitor activity(GO:0008073) |
| 0.0 | 0.2 | GO:0005143 | interleukin-12 receptor binding(GO:0005143) |
| 0.0 | 1.5 | GO:0016836 | hydro-lyase activity(GO:0016836) |
| 0.0 | 0.8 | GO:0008094 | DNA-dependent ATPase activity(GO:0008094) |
| 0.0 | 0.2 | GO:0030368 | interleukin-17 receptor activity(GO:0030368) |
| 0.0 | 23.1 | GO:0005509 | calcium ion binding(GO:0005509) |
| 0.0 | 0.2 | GO:0060175 | brain-derived neurotrophic factor-activated receptor activity(GO:0060175) |
| 0.0 | 0.9 | GO:0043027 | cysteine-type endopeptidase inhibitor activity involved in apoptotic process(GO:0043027) |
| 0.0 | 0.1 | GO:0004740 | pyruvate dehydrogenase (acetyl-transferring) kinase activity(GO:0004740) |
| 0.0 | 0.1 | GO:0005166 | neurotrophin p75 receptor binding(GO:0005166) |
| 0.0 | 0.6 | GO:0004536 | deoxyribonuclease activity(GO:0004536) |
| 0.0 | 0.7 | GO:0005104 | fibroblast growth factor receptor binding(GO:0005104) |
| 0.0 | 0.4 | GO:0016538 | cyclin-dependent protein serine/threonine kinase regulator activity(GO:0016538) |
| 0.0 | 0.1 | GO:0043325 | phosphatidylinositol-3,4-bisphosphate binding(GO:0043325) |
| 0.0 | 0.1 | GO:0031871 | proteinase activated receptor binding(GO:0031871) |
| 0.0 | 0.2 | GO:0015129 | lactate transmembrane transporter activity(GO:0015129) |
| 0.0 | 1.3 | GO:0004722 | protein serine/threonine phosphatase activity(GO:0004722) |
| 0.0 | 0.4 | GO:0004697 | protein kinase C activity(GO:0004697) |
| 0.0 | 0.0 | GO:0030151 | molybdenum ion binding(GO:0030151) |
| 0.0 | 0.0 | GO:0035673 | oligopeptide transmembrane transporter activity(GO:0035673) |
| 0.0 | 0.1 | GO:0004994 | somatostatin receptor activity(GO:0004994) |
| 0.0 | 1.2 | GO:0008565 | protein transporter activity(GO:0008565) |
| 0.0 | 1.0 | GO:0008009 | chemokine activity(GO:0008009) |
| 0.0 | 0.2 | GO:0004767 | sphingomyelin phosphodiesterase activity(GO:0004767) |
| 0.0 | 0.1 | GO:0030976 | thiamine pyrophosphate binding(GO:0030976) |
| 0.0 | 0.1 | GO:0019958 | C-X-C chemokine binding(GO:0019958) |
| 0.0 | 0.5 | GO:0019198 | transmembrane receptor protein tyrosine phosphatase activity(GO:0005001) transmembrane receptor protein phosphatase activity(GO:0019198) |
| 0.0 | 0.3 | GO:0043522 | leucine zipper domain binding(GO:0043522) |
| 0.0 | 0.2 | GO:0001758 | retinal dehydrogenase activity(GO:0001758) |
| 0.0 | 0.7 | GO:0001205 | transcriptional activator activity, RNA polymerase II distal enhancer sequence-specific binding(GO:0001205) |
| 0.0 | 0.2 | GO:0008527 | taste receptor activity(GO:0008527) bitter taste receptor activity(GO:0033038) |
| 0.0 | 21.9 | GO:0003723 | RNA binding(GO:0003723) |
| 0.0 | 0.2 | GO:0005212 | structural constituent of eye lens(GO:0005212) |
| 0.0 | 0.2 | GO:0071837 | HMG box domain binding(GO:0071837) |
| 0.0 | 0.4 | GO:0035035 | histone acetyltransferase binding(GO:0035035) |
| 0.0 | 0.0 | GO:0003828 | alpha-N-acetylneuraminate alpha-2,8-sialyltransferase activity(GO:0003828) |
| 0.0 | 0.1 | GO:0030020 | extracellular matrix structural constituent conferring tensile strength(GO:0030020) |
| 0.0 | 0.0 | GO:0051765 | inositol tetrakisphosphate 1-kinase activity(GO:0047325) inositol tetrakisphosphate kinase activity(GO:0051765) inositol-1,3,4-trisphosphate 6-kinase activity(GO:0052725) inositol-1,3,4-trisphosphate 5-kinase activity(GO:0052726) inositol-1,3,4,5,6-pentakisphosphate 1-phosphatase activity(GO:0052825) inositol-1,3,4,6-tetrakisphosphate 6-phosphatase activity(GO:0052830) inositol-1,3,4,6-tetrakisphosphate 1-phosphatase activity(GO:0052831) inositol-3,4,6-trisphosphate 1-kinase activity(GO:0052835) |
| 0.0 | 0.1 | GO:0016805 | dipeptidase activity(GO:0016805) |
| 0.0 | 0.0 | GO:0042923 | neuropeptide binding(GO:0042923) |
| 0.0 | 0.3 | GO:0030276 | clathrin binding(GO:0030276) |
| 0.0 | 0.1 | GO:0008109 | N-acetyllactosaminide beta-1,6-N-acetylglucosaminyltransferase activity(GO:0008109) |
| 0.0 | 0.0 | GO:0097677 | STAT family protein binding(GO:0097677) |
| 0.0 | 0.0 | GO:0000026 | alpha-1,2-mannosyltransferase activity(GO:0000026) |
Gene overrepresentation in C2:CP category:
| Log-likelihood per target | Total log-likelihood | Term | Description |
|---|---|---|---|
| 1.1 | 1.1 | PID REELIN PATHWAY | Reelin signaling pathway |
| 1.0 | 55.8 | PID NCADHERIN PATHWAY | N-cadherin signaling events |
| 0.9 | 16.9 | PID P38 GAMMA DELTA PATHWAY | Signaling mediated by p38-gamma and p38-delta |
| 0.9 | 36.6 | PID INSULIN GLUCOSE PATHWAY | Insulin-mediated glucose transport |
| 0.7 | 13.9 | PID ALK2 PATHWAY | ALK2 signaling events |
| 0.7 | 24.8 | PID P38 MKK3 6PATHWAY | p38 MAPK signaling pathway |
| 0.6 | 32.1 | PID HDAC CLASSII PATHWAY | Signaling events mediated by HDAC Class II |
| 0.5 | 10.7 | PID TCR JNK PATHWAY | JNK signaling in the CD4+ TCR pathway |
| 0.5 | 10.8 | PID ERB GENOMIC PATHWAY | Validated nuclear estrogen receptor beta network |
| 0.4 | 0.8 | PID THROMBIN PAR1 PATHWAY | PAR1-mediated thrombin signaling events |
| 0.3 | 1.0 | PID TCR RAS PATHWAY | Ras signaling in the CD4+ TCR pathway |
| 0.3 | 1.9 | PID PS1 PATHWAY | Presenilin action in Notch and Wnt signaling |
| 0.3 | 10.9 | PID LIS1 PATHWAY | Lissencephaly gene (LIS1) in neuronal migration and development |
| 0.3 | 6.4 | PID BETA CATENIN DEG PATHWAY | Degradation of beta catenin |
| 0.3 | 8.2 | SA CASPASE CASCADE | Apoptosis is mediated by caspases, cysteine proteases arranged in a proteolytic cascade. |
| 0.2 | 2.2 | ST PHOSPHOINOSITIDE 3 KINASE PATHWAY | PI3K Pathway |
| 0.2 | 16.2 | PID ERA GENOMIC PATHWAY | Validated nuclear estrogen receptor alpha network |
| 0.2 | 12.6 | SIG PIP3 SIGNALING IN CARDIAC MYOCTES | Genes related to PIP3 signaling in cardiac myocytes |
| 0.2 | 6.6 | PID CD40 PATHWAY | CD40/CD40L signaling |
| 0.2 | 10.3 | PID CERAMIDE PATHWAY | Ceramide signaling pathway |
| 0.2 | 10.3 | PID NFAT 3PATHWAY | Role of Calcineurin-dependent NFAT signaling in lymphocytes |
| 0.2 | 2.9 | PID S1P S1P4 PATHWAY | S1P4 pathway |
| 0.2 | 1.2 | PID INTEGRIN4 PATHWAY | Alpha6 beta4 integrin-ligand interactions |
| 0.2 | 3.1 | SA FAS SIGNALING | The TNF-type receptor Fas induces apoptosis on ligand binding. |
| 0.2 | 1.6 | ST B CELL ANTIGEN RECEPTOR | B Cell Antigen Receptor |
| 0.2 | 0.5 | PID IL8 CXCR2 PATHWAY | IL8- and CXCR2-mediated signaling events |
| 0.1 | 2.7 | PID GLYPICAN 1PATHWAY | Glypican 1 network |
| 0.1 | 2.8 | PID PI3K PLC TRK PATHWAY | Trk receptor signaling mediated by PI3K and PLC-gamma |
| 0.1 | 2.7 | PID ERBB1 DOWNSTREAM PATHWAY | ErbB1 downstream signaling |
| 0.1 | 10.6 | PID RHOA REG PATHWAY | Regulation of RhoA activity |
| 0.1 | 3.8 | ST WNT CA2 CYCLIC GMP PATHWAY | Wnt/Ca2+/cyclic GMP signaling. |
| 0.1 | 2.9 | PID LPA4 PATHWAY | LPA4-mediated signaling events |
| 0.1 | 5.7 | PID NETRIN PATHWAY | Netrin-mediated signaling events |
| 0.1 | 6.3 | PID ALPHA SYNUCLEIN PATHWAY | Alpha-synuclein signaling |
| 0.1 | 7.4 | PID ATR PATHWAY | ATR signaling pathway |
| 0.1 | 3.9 | PID IL2 PI3K PATHWAY | IL2 signaling events mediated by PI3K |
| 0.1 | 12.1 | PID HIF1 TFPATHWAY | HIF-1-alpha transcription factor network |
| 0.1 | 4.1 | PID ATM PATHWAY | ATM pathway |
| 0.1 | 1.0 | PID AR NONGENOMIC PATHWAY | Nongenotropic Androgen signaling |
| 0.1 | 0.9 | PID ERBB NETWORK PATHWAY | ErbB receptor signaling network |
| 0.1 | 2.1 | SIG BCR SIGNALING PATHWAY | Members of the BCR signaling pathway |
| 0.1 | 1.6 | ST GA12 PATHWAY | G alpha 12 Pathway |
| 0.1 | 0.4 | SA B CELL RECEPTOR COMPLEXES | Antigen binding to B cell receptors activates protein tyrosine kinases, such as the Src family, which ultimate activate MAP kinases. |
| 0.1 | 1.3 | PID MET PATHWAY | Signaling events mediated by Hepatocyte Growth Factor Receptor (c-Met) |
| 0.1 | 0.5 | PID IGF1 PATHWAY | IGF1 pathway |
| 0.1 | 1.1 | PID IL2 STAT5 PATHWAY | IL2 signaling events mediated by STAT5 |
| 0.1 | 0.6 | SIG INSULIN RECEPTOR PATHWAY IN CARDIAC MYOCYTES | Genes related to the insulin receptor pathway |
| 0.1 | 1.5 | PID TRAIL PATHWAY | TRAIL signaling pathway |
| 0.1 | 18.3 | NABA ECM GLYCOPROTEINS | Genes encoding structural ECM glycoproteins |
| 0.1 | 1.0 | PID NOTCH PATHWAY | Notch signaling pathway |
| 0.1 | 2.6 | PID P38 ALPHA BETA DOWNSTREAM PATHWAY | Signaling mediated by p38-alpha and p38-beta |
| 0.1 | 1.5 | PID FANCONI PATHWAY | Fanconi anemia pathway |
| 0.1 | 0.9 | ST DIFFERENTIATION PATHWAY IN PC12 CELLS | Differentiation Pathway in PC12 Cells; this is a specific case of PAC1 Receptor Pathway. |
| 0.1 | 1.0 | PID HDAC CLASSIII PATHWAY | Signaling events mediated by HDAC Class III |
| 0.1 | 1.7 | PID TOLL ENDOGENOUS PATHWAY | Endogenous TLR signaling |
| 0.1 | 1.0 | PID FRA PATHWAY | Validated transcriptional targets of AP1 family members Fra1 and Fra2 |
| 0.1 | 1.5 | PID RAS PATHWAY | Regulation of Ras family activation |
| 0.1 | 2.3 | PID MTOR 4PATHWAY | mTOR signaling pathway |
| 0.0 | 0.3 | PID IL6 7 PATHWAY | IL6-mediated signaling events |
| 0.0 | 0.8 | PID MYC PATHWAY | C-MYC pathway |
| 0.0 | 0.0 | ST JAK STAT PATHWAY | Jak-STAT Pathway |
| 0.0 | 0.8 | PID TNF PATHWAY | TNF receptor signaling pathway |
| 0.0 | 0.6 | PID AVB3 OPN PATHWAY | Osteopontin-mediated events |
| 0.0 | 1.9 | NABA PROTEOGLYCANS | Genes encoding proteoglycans |
| 0.0 | 0.2 | PID ENDOTHELIN PATHWAY | Endothelins |
| 0.0 | 0.6 | PID DNA PK PATHWAY | DNA-PK pathway in nonhomologous end joining |
| 0.0 | 0.5 | PID ECADHERIN NASCENT AJ PATHWAY | E-cadherin signaling in the nascent adherens junction |
| 0.0 | 0.9 | PID RAC1 REG PATHWAY | Regulation of RAC1 activity |
| 0.0 | 0.2 | PID PI3KCI PATHWAY | Class I PI3K signaling events |
| 0.0 | 0.1 | ST G ALPHA I PATHWAY | G alpha i Pathway |
| 0.0 | 1.2 | PID REG GR PATHWAY | Glucocorticoid receptor regulatory network |
| 0.0 | 0.2 | PID TXA2PATHWAY | Thromboxane A2 receptor signaling |
| 0.0 | 0.1 | PID CONE PATHWAY | Visual signal transduction: Cones |
| 0.0 | 0.7 | ST FAS SIGNALING PATHWAY | Fas Signaling Pathway |
| 0.0 | 0.7 | PID LKB1 PATHWAY | LKB1 signaling events |
| 0.0 | 0.6 | PID TELOMERASE PATHWAY | Regulation of Telomerase |
Gene overrepresentation in C2:CP:REACTOME category:
| Log-likelihood per target | Total log-likelihood | Term | Description |
|---|---|---|---|
| 2.9 | 69.5 | REACTOME UNBLOCKING OF NMDA RECEPTOR GLUTAMATE BINDING AND ACTIVATION | Genes involved in Unblocking of NMDA receptor, glutamate binding and activation |
| 1.5 | 42.6 | REACTOME AMINO ACID SYNTHESIS AND INTERCONVERSION TRANSAMINATION | Genes involved in Amino acid synthesis and interconversion (transamination) |
| 1.4 | 12.7 | REACTOME APOBEC3G MEDIATED RESISTANCE TO HIV1 INFECTION | Genes involved in APOBEC3G mediated resistance to HIV-1 infection |
| 1.3 | 35.2 | REACTOME CRMPS IN SEMA3A SIGNALING | Genes involved in CRMPs in Sema3A signaling |
| 1.2 | 27.2 | REACTOME GLUTAMATE NEUROTRANSMITTER RELEASE CYCLE | Genes involved in Glutamate Neurotransmitter Release Cycle |
| 1.0 | 15.8 | REACTOME TRAFFICKING OF GLUR2 CONTAINING AMPA RECEPTORS | Genes involved in Trafficking of GluR2-containing AMPA receptors |
| 1.0 | 16.3 | REACTOME PURINE RIBONUCLEOSIDE MONOPHOSPHATE BIOSYNTHESIS | Genes involved in Purine ribonucleoside monophosphate biosynthesis |
| 0.9 | 21.4 | REACTOME RNA POL III CHAIN ELONGATION | Genes involved in RNA Polymerase III Chain Elongation |
| 0.9 | 43.7 | REACTOME GLYCOLYSIS | Genes involved in Glycolysis |
| 0.9 | 14.5 | REACTOME REGULATION OF PYRUVATE DEHYDROGENASE PDH COMPLEX | Genes involved in Regulation of pyruvate dehydrogenase (PDH) complex |
| 0.8 | 14.6 | REACTOME CLASS C 3 METABOTROPIC GLUTAMATE PHEROMONE RECEPTORS | Genes involved in Class C/3 (Metabotropic glutamate/pheromone receptors) |
| 0.8 | 47.4 | REACTOME MITOCHONDRIAL PROTEIN IMPORT | Genes involved in Mitochondrial Protein Import |
| 0.8 | 19.6 | REACTOME ERK MAPK TARGETS | Genes involved in ERK/MAPK targets |
| 0.7 | 12.6 | REACTOME SEMA3A PAK DEPENDENT AXON REPULSION | Genes involved in Sema3A PAK dependent Axon repulsion |
| 0.7 | 23.7 | REACTOME SYNTHESIS AND INTERCONVERSION OF NUCLEOTIDE DI AND TRIPHOSPHATES | Genes involved in Synthesis and interconversion of nucleotide di- and triphosphates |
| 0.7 | 13.0 | REACTOME GABA SYNTHESIS RELEASE REUPTAKE AND DEGRADATION | Genes involved in GABA synthesis, release, reuptake and degradation |
| 0.6 | 16.8 | REACTOME DESTABILIZATION OF MRNA BY KSRP | Genes involved in Destabilization of mRNA by KSRP |
| 0.6 | 19.2 | REACTOME CHOLESTEROL BIOSYNTHESIS | Genes involved in Cholesterol biosynthesis |
| 0.6 | 15.9 | REACTOME FATTY ACYL COA BIOSYNTHESIS | Genes involved in Fatty Acyl-CoA Biosynthesis |
| 0.5 | 12.4 | REACTOME METABOLISM OF POLYAMINES | Genes involved in Metabolism of polyamines |
| 0.5 | 5.7 | REACTOME PYRUVATE METABOLISM | Genes involved in Pyruvate metabolism |
| 0.5 | 15.9 | REACTOME GABA A RECEPTOR ACTIVATION | Genes involved in GABA A receptor activation |
| 0.5 | 3.0 | REACTOME LYSOSOME VESICLE BIOGENESIS | Genes involved in Lysosome Vesicle Biogenesis |
| 0.5 | 11.7 | REACTOME TGF BETA RECEPTOR SIGNALING IN EMT EPITHELIAL TO MESENCHYMAL TRANSITION | Genes involved in TGF-beta receptor signaling in EMT (epithelial to mesenchymal transition) |
| 0.5 | 6.2 | REACTOME FORMATION OF TUBULIN FOLDING INTERMEDIATES BY CCT TRIC | Genes involved in Formation of tubulin folding intermediates by CCT/TriC |
| 0.5 | 21.4 | REACTOME SIGNALING BY ROBO RECEPTOR | Genes involved in Signaling by Robo receptor |
| 0.4 | 1.7 | REACTOME G BETA GAMMA SIGNALLING THROUGH PLC BETA | Genes involved in G beta:gamma signalling through PLC beta |
| 0.4 | 5.4 | REACTOME TRAF6 MEDIATED IRF7 ACTIVATION IN TLR7 8 OR 9 SIGNALING | Genes involved in TRAF6 mediated IRF7 activation in TLR7/8 or 9 signaling |
| 0.4 | 11.2 | REACTOME POST CHAPERONIN TUBULIN FOLDING PATHWAY | Genes involved in Post-chaperonin tubulin folding pathway |
| 0.4 | 2.0 | REACTOME IRAK2 MEDIATED ACTIVATION OF TAK1 COMPLEX UPON TLR7 8 OR 9 STIMULATION | Genes involved in IRAK2 mediated activation of TAK1 complex upon TLR7/8 or 9 stimulation |
| 0.4 | 2.1 | REACTOME PEPTIDE CHAIN ELONGATION | Genes involved in Peptide chain elongation |
| 0.3 | 16.4 | REACTOME MRNA SPLICING MINOR PATHWAY | Genes involved in mRNA Splicing - Minor Pathway |
| 0.3 | 6.9 | REACTOME ABCA TRANSPORTERS IN LIPID HOMEOSTASIS | Genes involved in ABCA transporters in lipid homeostasis |
| 0.3 | 5.5 | REACTOME FORMATION OF ATP BY CHEMIOSMOTIC COUPLING | Genes involved in Formation of ATP by chemiosmotic coupling |
| 0.3 | 4.8 | REACTOME ACTIVATION OF IRF3 IRF7 MEDIATED BY TBK1 IKK EPSILON | Genes involved in Activation of IRF3/IRF7 mediated by TBK1/IKK epsilon |
| 0.3 | 8.4 | REACTOME PURINE SALVAGE | Genes involved in Purine salvage |
| 0.3 | 6.3 | REACTOME CITRIC ACID CYCLE TCA CYCLE | Genes involved in Citric acid cycle (TCA cycle) |
| 0.3 | 1.6 | REACTOME MRNA CAPPING | Genes involved in mRNA Capping |
| 0.3 | 15.8 | REACTOME VOLTAGE GATED POTASSIUM CHANNELS | Genes involved in Voltage gated Potassium channels |
| 0.3 | 0.9 | REACTOME REGULATION OF KIT SIGNALING | Genes involved in Regulation of KIT signaling |
| 0.3 | 2.1 | REACTOME TANDEM PORE DOMAIN POTASSIUM CHANNELS | Genes involved in Tandem pore domain potassium channels |
| 0.3 | 3.5 | REACTOME ADENYLATE CYCLASE ACTIVATING PATHWAY | Genes involved in Adenylate cyclase activating pathway |
| 0.3 | 2.3 | REACTOME MICRORNA MIRNA BIOGENESIS | Genes involved in MicroRNA (miRNA) Biogenesis |
| 0.3 | 10.0 | REACTOME GLUTATHIONE CONJUGATION | Genes involved in Glutathione conjugation |
| 0.3 | 3.7 | REACTOME CREB PHOSPHORYLATION THROUGH THE ACTIVATION OF CAMKII | Genes involved in CREB phosphorylation through the activation of CaMKII |
| 0.3 | 0.8 | REACTOME ALPHA LINOLENIC ACID ALA METABOLISM | Genes involved in alpha-linolenic acid (ALA) metabolism |
| 0.3 | 7.6 | REACTOME INSULIN RECEPTOR RECYCLING | Genes involved in Insulin receptor recycling |
| 0.3 | 2.3 | REACTOME PREFOLDIN MEDIATED TRANSFER OF SUBSTRATE TO CCT TRIC | Genes involved in Prefoldin mediated transfer of substrate to CCT/TriC |
| 0.3 | 1.3 | REACTOME ADENYLATE CYCLASE INHIBITORY PATHWAY | Genes involved in Adenylate cyclase inhibitory pathway |
| 0.3 | 8.3 | REACTOME RNA POL I TRANSCRIPTION INITIATION | Genes involved in RNA Polymerase I Transcription Initiation |
| 0.2 | 5.9 | REACTOME P38MAPK EVENTS | Genes involved in p38MAPK events |
| 0.2 | 1.7 | REACTOME NEGATIVE REGULATION OF THE PI3K AKT NETWORK | Genes involved in Negative regulation of the PI3K/AKT network |
| 0.2 | 9.3 | REACTOME RAP1 SIGNALLING | Genes involved in Rap1 signalling |
| 0.2 | 3.1 | REACTOME PRE NOTCH PROCESSING IN GOLGI | Genes involved in Pre-NOTCH Processing in Golgi |
| 0.2 | 2.0 | REACTOME REGULATION OF THE FANCONI ANEMIA PATHWAY | Genes involved in Regulation of the Fanconi anemia pathway |
| 0.2 | 8.0 | REACTOME EXTENSION OF TELOMERES | Genes involved in Extension of Telomeres |
| 0.2 | 0.8 | REACTOME ASSOCIATION OF LICENSING FACTORS WITH THE PRE REPLICATIVE COMPLEX | Genes involved in Association of licensing factors with the pre-replicative complex |
| 0.2 | 7.4 | REACTOME CYTOSOLIC TRNA AMINOACYLATION | Genes involved in Cytosolic tRNA aminoacylation |
| 0.2 | 2.2 | REACTOME NOTCH HLH TRANSCRIPTION PATHWAY | Genes involved in Notch-HLH transcription pathway |
| 0.2 | 3.0 | REACTOME TRAFFICKING OF AMPA RECEPTORS | Genes involved in Trafficking of AMPA receptors |
| 0.2 | 1.7 | REACTOME IONOTROPIC ACTIVITY OF KAINATE RECEPTORS | Genes involved in Ionotropic activity of Kainate Receptors |
| 0.2 | 14.8 | REACTOME RESPIRATORY ELECTRON TRANSPORT | Genes involved in Respiratory electron transport |
| 0.2 | 5.0 | REACTOME CYTOSOLIC SULFONATION OF SMALL MOLECULES | Genes involved in Cytosolic sulfonation of small molecules |
| 0.2 | 2.5 | REACTOME PASSIVE TRANSPORT BY AQUAPORINS | Genes involved in Passive Transport by Aquaporins |
| 0.2 | 12.1 | REACTOME GOLGI ASSOCIATED VESICLE BIOGENESIS | Genes involved in Golgi Associated Vesicle Biogenesis |
| 0.2 | 7.5 | REACTOME G ALPHA Z SIGNALLING EVENTS | Genes involved in G alpha (z) signalling events |
| 0.2 | 1.4 | REACTOME INHIBITION OF INSULIN SECRETION BY ADRENALINE NORADRENALINE | Genes involved in Inhibition of Insulin Secretion by Adrenaline/Noradrenaline |
| 0.2 | 3.3 | REACTOME KERATAN SULFATE BIOSYNTHESIS | Genes involved in Keratan sulfate biosynthesis |
| 0.2 | 11.5 | REACTOME CIRCADIAN CLOCK | Genes involved in Circadian Clock |
| 0.2 | 3.2 | REACTOME GLYCOGEN BREAKDOWN GLYCOGENOLYSIS | Genes involved in Glycogen breakdown (glycogenolysis) |
| 0.2 | 16.6 | REACTOME L1CAM INTERACTIONS | Genes involved in L1CAM interactions |
| 0.2 | 0.6 | REACTOME TRANSPORT OF MATURE MRNA DERIVED FROM AN INTRONLESS TRANSCRIPT | Genes involved in Transport of Mature mRNA Derived from an Intronless Transcript |
| 0.1 | 7.9 | REACTOME ION TRANSPORT BY P TYPE ATPASES | Genes involved in Ion transport by P-type ATPases |
| 0.1 | 1.1 | REACTOME NUCLEOTIDE LIKE PURINERGIC RECEPTORS | Genes involved in Nucleotide-like (purinergic) receptors |
| 0.1 | 4.1 | REACTOME N GLYCAN ANTENNAE ELONGATION IN THE MEDIAL TRANS GOLGI | Genes involved in N-glycan antennae elongation in the medial/trans-Golgi |
| 0.1 | 2.2 | REACTOME ACTIVATION OF GENES BY ATF4 | Genes involved in Activation of Genes by ATF4 |
| 0.1 | 2.9 | REACTOME TRANSPORT OF ORGANIC ANIONS | Genes involved in Transport of organic anions |
| 0.1 | 1.0 | REACTOME CA DEPENDENT EVENTS | Genes involved in Ca-dependent events |
| 0.1 | 1.3 | REACTOME SYNTHESIS OF PIPS AT THE LATE ENDOSOME MEMBRANE | Genes involved in Synthesis of PIPs at the late endosome membrane |
| 0.1 | 0.6 | REACTOME SEMA3A PLEXIN REPULSION SIGNALING BY INHIBITING INTEGRIN ADHESION | Genes involved in SEMA3A-Plexin repulsion signaling by inhibiting Integrin adhesion |
| 0.1 | 0.6 | REACTOME THE ROLE OF NEF IN HIV1 REPLICATION AND DISEASE PATHOGENESIS | Genes involved in The role of Nef in HIV-1 replication and disease pathogenesis |
| 0.1 | 3.9 | REACTOME DARPP 32 EVENTS | Genes involved in DARPP-32 events |
| 0.1 | 1.1 | REACTOME SYNTHESIS OF BILE ACIDS AND BILE SALTS VIA 24 HYDROXYCHOLESTEROL | Genes involved in Synthesis of bile acids and bile salts via 24-hydroxycholesterol |
| 0.1 | 2.7 | REACTOME PROTEOLYTIC CLEAVAGE OF SNARE COMPLEX PROTEINS | Genes involved in Proteolytic cleavage of SNARE complex proteins |
| 0.1 | 1.9 | REACTOME BASE FREE SUGAR PHOSPHATE REMOVAL VIA THE SINGLE NUCLEOTIDE REPLACEMENT PATHWAY | Genes involved in Base-free sugar-phosphate removal via the single-nucleotide replacement pathway |
| 0.1 | 2.1 | REACTOME INTRINSIC PATHWAY | Genes involved in Intrinsic Pathway |
| 0.1 | 1.2 | REACTOME CDC6 ASSOCIATION WITH THE ORC ORIGIN COMPLEX | Genes involved in CDC6 association with the ORC:origin complex |
| 0.1 | 7.1 | REACTOME LOSS OF NLP FROM MITOTIC CENTROSOMES | Genes involved in Loss of Nlp from mitotic centrosomes |
| 0.1 | 1.8 | REACTOME GABA B RECEPTOR ACTIVATION | Genes involved in GABA B receptor activation |
| 0.1 | 0.8 | REACTOME TRAF3 DEPENDENT IRF ACTIVATION PATHWAY | Genes involved in TRAF3-dependent IRF activation pathway |
| 0.1 | 0.5 | REACTOME REGULATION OF SIGNALING BY CBL | Genes involved in Regulation of signaling by CBL |
| 0.1 | 1.7 | REACTOME N GLYCAN TRIMMING IN THE ER AND CALNEXIN CALRETICULIN CYCLE | Genes involved in N-glycan trimming in the ER and Calnexin/Calreticulin cycle |
| 0.1 | 14.6 | REACTOME SIGNALING BY RHO GTPASES | Genes involved in Signaling by Rho GTPases |
| 0.1 | 2.4 | REACTOME ADVANCED GLYCOSYLATION ENDPRODUCT RECEPTOR SIGNALING | Genes involved in Advanced glycosylation endproduct receptor signaling |
| 0.1 | 1.4 | REACTOME HOMOLOGOUS RECOMBINATION REPAIR OF REPLICATION INDEPENDENT DOUBLE STRAND BREAKS | Genes involved in Homologous recombination repair of replication-independent double-strand breaks |
| 0.1 | 1.1 | REACTOME RECRUITMENT OF MITOTIC CENTROSOME PROTEINS AND COMPLEXES | Genes involved in Recruitment of mitotic centrosome proteins and complexes |
| 0.1 | 1.7 | REACTOME FACILITATIVE NA INDEPENDENT GLUCOSE TRANSPORTERS | Genes involved in Facilitative Na+-independent glucose transporters |
| 0.1 | 1.1 | REACTOME ROLE OF DCC IN REGULATING APOPTOSIS | Genes involved in Role of DCC in regulating apoptosis |
| 0.1 | 1.2 | REACTOME P130CAS LINKAGE TO MAPK SIGNALING FOR INTEGRINS | Genes involved in p130Cas linkage to MAPK signaling for integrins |
| 0.1 | 0.8 | REACTOME NEGATIVE REGULATORS OF RIG I MDA5 SIGNALING | Genes involved in Negative regulators of RIG-I/MDA5 signaling |
| 0.1 | 0.5 | REACTOME SIGNAL ATTENUATION | Genes involved in Signal attenuation |
| 0.1 | 3.8 | REACTOME METABOLISM OF NON CODING RNA | Genes involved in Metabolism of non-coding RNA |
| 0.1 | 1.4 | REACTOME TRIGLYCERIDE BIOSYNTHESIS | Genes involved in Triglyceride Biosynthesis |
| 0.1 | 2.0 | REACTOME REGULATION OF INSULIN SECRETION | Genes involved in Regulation of Insulin Secretion |
| 0.1 | 1.0 | REACTOME PLATELET SENSITIZATION BY LDL | Genes involved in Platelet sensitization by LDL |
| 0.1 | 0.8 | REACTOME IL 7 SIGNALING | Genes involved in Interleukin-7 signaling |
| 0.1 | 11.1 | REACTOME G ALPHA Q SIGNALLING EVENTS | Genes involved in G alpha (q) signalling events |
| 0.1 | 0.6 | REACTOME CTNNB1 PHOSPHORYLATION CASCADE | Genes involved in Beta-catenin phosphorylation cascade |
| 0.1 | 0.7 | REACTOME SIGNALING BY PDGF | Genes involved in Signaling by PDGF |
| 0.1 | 0.3 | REACTOME AQUAPORIN MEDIATED TRANSPORT | Genes involved in Aquaporin-mediated transport |
| 0.1 | 0.4 | REACTOME TRAF6 MEDIATED IRF7 ACTIVATION | Genes involved in TRAF6 mediated IRF7 activation |
| 0.1 | 0.4 | REACTOME APC C CDH1 MEDIATED DEGRADATION OF CDC20 AND OTHER APC C CDH1 TARGETED PROTEINS IN LATE MITOSIS EARLY G1 | Genes involved in APC/C:Cdh1 mediated degradation of Cdc20 and other APC/C:Cdh1 targeted proteins in late mitosis/early G1 |
| 0.0 | 3.4 | REACTOME VIF MEDIATED DEGRADATION OF APOBEC3G | Genes involved in Vif-mediated degradation of APOBEC3G |
| 0.0 | 0.5 | REACTOME PACKAGING OF TELOMERE ENDS | Genes involved in Packaging Of Telomere Ends |
| 0.0 | 1.9 | REACTOME RNA POL I TRANSCRIPTION | Genes involved in RNA Polymerase I Transcription |
| 0.0 | 0.3 | REACTOME SYNTHESIS OF PIPS AT THE EARLY ENDOSOME MEMBRANE | Genes involved in Synthesis of PIPs at the early endosome membrane |
| 0.0 | 5.6 | REACTOME FACTORS INVOLVED IN MEGAKARYOCYTE DEVELOPMENT AND PLATELET PRODUCTION | Genes involved in Factors involved in megakaryocyte development and platelet production |
| 0.0 | 0.5 | REACTOME SYNTHESIS OF BILE ACIDS AND BILE SALTS VIA 7ALPHA HYDROXYCHOLESTEROL | Genes involved in Synthesis of bile acids and bile salts via 7alpha-hydroxycholesterol |
| 0.0 | 0.6 | REACTOME IRON UPTAKE AND TRANSPORT | Genes involved in Iron uptake and transport |
| 0.0 | 2.7 | REACTOME TRANSMISSION ACROSS CHEMICAL SYNAPSES | Genes involved in Transmission across Chemical Synapses |
| 0.0 | 1.0 | REACTOME FGFR LIGAND BINDING AND ACTIVATION | Genes involved in FGFR ligand binding and activation |
| 0.0 | 0.7 | REACTOME MEIOTIC RECOMBINATION | Genes involved in Meiotic Recombination |
| 0.0 | 0.3 | REACTOME P53 INDEPENDENT G1 S DNA DAMAGE CHECKPOINT | Genes involved in p53-Independent G1/S DNA damage checkpoint |
| 0.0 | 0.3 | REACTOME G ALPHA1213 SIGNALLING EVENTS | Genes involved in G alpha (12/13) signalling events |
| 0.0 | 0.9 | REACTOME SIGNALING BY NODAL | Genes involved in Signaling by NODAL |
| 0.0 | 1.1 | REACTOME SPHINGOLIPID DE NOVO BIOSYNTHESIS | Genes involved in Sphingolipid de novo biosynthesis |
| 0.0 | 0.8 | REACTOME INHIBITION OF THE PROTEOLYTIC ACTIVITY OF APC C REQUIRED FOR THE ONSET OF ANAPHASE BY MITOTIC SPINDLE CHECKPOINT COMPONENTS | Genes involved in Inhibition of the proteolytic activity of APC/C required for the onset of anaphase by mitotic spindle checkpoint components |
| 0.0 | 0.5 | REACTOME INSULIN SYNTHESIS AND PROCESSING | Genes involved in Insulin Synthesis and Processing |
| 0.0 | 0.9 | REACTOME PYRIMIDINE METABOLISM | Genes involved in Pyrimidine metabolism |
| 0.0 | 1.0 | REACTOME DOWNSTREAM TCR SIGNALING | Genes involved in Downstream TCR signaling |
| 0.0 | 0.6 | REACTOME NETRIN1 SIGNALING | Genes involved in Netrin-1 signaling |
| 0.0 | 0.5 | REACTOME DEPOSITION OF NEW CENPA CONTAINING NUCLEOSOMES AT THE CENTROMERE | Genes involved in Deposition of New CENPA-containing Nucleosomes at the Centromere |
| 0.0 | 0.1 | REACTOME RETROGRADE NEUROTROPHIN SIGNALLING | Genes involved in Retrograde neurotrophin signalling |
| 0.0 | 0.3 | REACTOME NGF SIGNALLING VIA TRKA FROM THE PLASMA MEMBRANE | Genes involved in NGF signalling via TRKA from the plasma membrane |
| 0.0 | 0.2 | REACTOME REGULATION OF ORNITHINE DECARBOXYLASE ODC | Genes involved in Regulation of ornithine decarboxylase (ODC) |
| 0.0 | 0.3 | REACTOME SIGNALING BY CONSTITUTIVELY ACTIVE EGFR | Genes involved in Signaling by constitutively active EGFR |
| 0.0 | 0.4 | REACTOME AMINE DERIVED HORMONES | Genes involved in Amine-derived hormones |
| 0.0 | 0.2 | REACTOME GENERATION OF SECOND MESSENGER MOLECULES | Genes involved in Generation of second messenger molecules |
| 0.0 | 0.2 | REACTOME HDL MEDIATED LIPID TRANSPORT | Genes involved in HDL-mediated lipid transport |