Project
averaged GNF SymAtlas + NCI-60 cancer cell lines, human (Su, 2004; Ross, 2000)
Navigation
Downloads
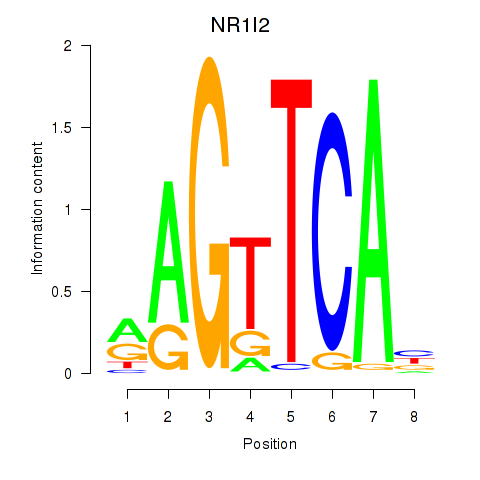
Results for NR1I2
Z-value: 1.29
Motif logo
Transcription factors associated with NR1I2
| Gene Symbol | Gene ID | Gene Info |
|---|---|---|
|
NR1I2
|
ENSG00000144852.12 | nuclear receptor subfamily 1 group I member 2 |
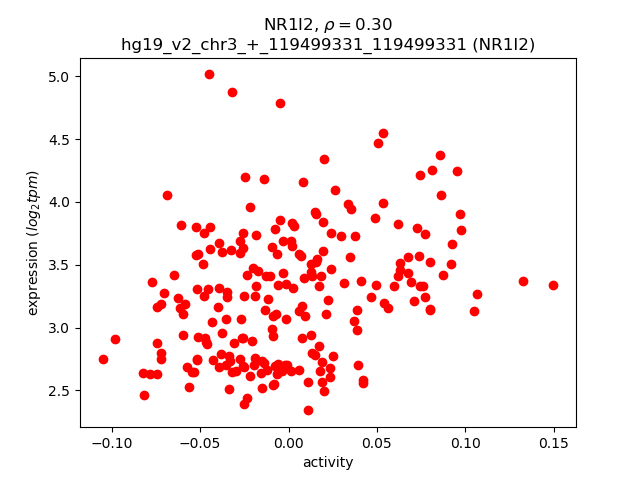
Activity-expression correlation:
| Gene | Promoter | Pearson corr. coef. | P-value | Plot |
|---|---|---|---|---|
| NR1I2 | hg19_v2_chr3_+_119499331_119499331, hg19_v2_chr3_+_119501557_119501557 | 0.30 | 6.1e-06 | Click! |
Activity profile of NR1I2 motif
Sorted Z-values of NR1I2 motif
| Promoter | Log-likelihood | Transcript | Gene | Gene Info |
|---|---|---|---|---|
| chr12_-_91576429 | 46.20 |
ENST00000552145.1
ENST00000546745.1 |
DCN
|
decorin |
| chr11_+_117073850 | 24.79 |
ENST00000529622.1
|
TAGLN
|
transgelin |
| chr12_-_91576561 | 19.83 |
ENST00000547568.2
ENST00000552962.1 |
DCN
|
decorin |
| chr12_-_91576750 | 15.24 |
ENST00000228329.5
ENST00000303320.3 ENST00000052754.5 |
DCN
|
decorin |
| chr3_+_153839149 | 13.28 |
ENST00000465093.1
ENST00000465817.1 |
ARHGEF26
|
Rho guanine nucleotide exchange factor (GEF) 26 |
| chr11_+_62439126 | 13.15 |
ENST00000377953.3
|
C11orf83
|
chromosome 11 open reading frame 83 |
| chr19_+_42817527 | 12.41 |
ENST00000598766.1
|
TMEM145
|
transmembrane protein 145 |
| chr3_-_196065248 | 11.63 |
ENST00000446879.1
ENST00000273695.3 |
TM4SF19
|
transmembrane 4 L six family member 19 |
| chr11_-_111783595 | 11.46 |
ENST00000528628.1
|
CRYAB
|
crystallin, alpha B |
| chr16_-_4292071 | 11.24 |
ENST00000399609.3
|
SRL
|
sarcalumenin |
| chr11_-_111794446 | 11.01 |
ENST00000527950.1
|
CRYAB
|
crystallin, alpha B |
| chr3_-_114343039 | 10.86 |
ENST00000481632.1
|
ZBTB20
|
zinc finger and BTB domain containing 20 |
| chr2_+_111490161 | 10.75 |
ENST00000340561.4
|
ACOXL
|
acyl-CoA oxidase-like |
| chrX_+_135279179 | 10.73 |
ENST00000370676.3
|
FHL1
|
four and a half LIM domains 1 |
| chrX_+_135278908 | 10.39 |
ENST00000539015.1
ENST00000370683.1 |
FHL1
|
four and a half LIM domains 1 |
| chr15_+_96876340 | 9.89 |
ENST00000453270.2
|
NR2F2
|
nuclear receptor subfamily 2, group F, member 2 |
| chr5_+_149569520 | 9.60 |
ENST00000230671.2
ENST00000524041.1 |
SLC6A7
|
solute carrier family 6 (neurotransmitter transporter), member 7 |
| chr15_+_39873268 | 9.58 |
ENST00000397591.2
ENST00000260356.5 |
THBS1
|
thrombospondin 1 |
| chr13_-_110959478 | 9.39 |
ENST00000543140.1
ENST00000375820.4 |
COL4A1
|
collagen, type IV, alpha 1 |
| chr8_-_82395461 | 9.38 |
ENST00000256104.4
|
FABP4
|
fatty acid binding protein 4, adipocyte |
| chr3_+_138666070 | 9.35 |
ENST00000383165.3
|
C3orf72
|
chromosome 3 open reading frame 72 |
| chr7_+_134576151 | 8.75 |
ENST00000393118.2
|
CALD1
|
caldesmon 1 |
| chr1_-_173793458 | 8.41 |
ENST00000356198.2
|
CENPL
|
centromere protein L |
| chr2_+_242127924 | 8.15 |
ENST00000402530.3
ENST00000274979.8 ENST00000402430.3 |
ANO7
|
anoctamin 7 |
| chr16_+_30710462 | 7.92 |
ENST00000262518.4
ENST00000395059.2 ENST00000344771.4 |
SRCAP
|
Snf2-related CREBBP activator protein |
| chr1_-_173793246 | 7.88 |
ENST00000345664.6
ENST00000367710.3 |
CENPL
|
centromere protein L |
| chr15_+_96875657 | 7.67 |
ENST00000559679.1
ENST00000394171.2 |
NR2F2
|
nuclear receptor subfamily 2, group F, member 2 |
| chr16_-_15950868 | 7.25 |
ENST00000396324.3
ENST00000452625.2 ENST00000576790.2 ENST00000300036.5 |
MYH11
|
myosin, heavy chain 11, smooth muscle |
| chr2_-_208489707 | 6.71 |
ENST00000448007.2
ENST00000432416.1 ENST00000411432.1 |
METTL21A
|
methyltransferase like 21A |
| chr3_+_14989186 | 6.70 |
ENST00000435454.1
ENST00000323373.6 |
NR2C2
|
nuclear receptor subfamily 2, group C, member 2 |
| chr19_+_39616410 | 6.68 |
ENST00000602004.1
ENST00000599470.1 ENST00000321944.4 ENST00000593480.1 ENST00000358301.3 ENST00000593690.1 ENST00000599386.1 |
PAK4
|
p21 protein (Cdc42/Rac)-activated kinase 4 |
| chr10_-_33625154 | 6.63 |
ENST00000265371.4
|
NRP1
|
neuropilin 1 |
| chr19_+_2977444 | 6.59 |
ENST00000246112.4
ENST00000453329.1 ENST00000482627.1 ENST00000452088.1 |
TLE6
|
transducin-like enhancer of split 6 (E(sp1) homolog, Drosophila) |
| chr1_-_151965048 | 6.58 |
ENST00000368809.1
|
S100A10
|
S100 calcium binding protein A10 |
| chr15_+_64443905 | 6.34 |
ENST00000325881.4
|
SNX22
|
sorting nexin 22 |
| chr1_+_16083154 | 6.30 |
ENST00000375771.1
|
FBLIM1
|
filamin binding LIM protein 1 |
| chr7_-_107642348 | 6.24 |
ENST00000393561.1
|
LAMB1
|
laminin, beta 1 |
| chr7_-_95225768 | 6.06 |
ENST00000005178.5
|
PDK4
|
pyruvate dehydrogenase kinase, isozyme 4 |
| chr11_-_104480019 | 5.94 |
ENST00000536529.1
ENST00000545630.1 ENST00000538641.1 |
RP11-886D15.1
|
RP11-886D15.1 |
| chr5_-_133747589 | 5.81 |
ENST00000458198.2
|
CDKN2AIPNL
|
CDKN2A interacting protein N-terminal like |
| chr3_+_157154578 | 5.81 |
ENST00000295927.3
|
PTX3
|
pentraxin 3, long |
| chr3_+_8543561 | 5.78 |
ENST00000397386.3
|
LMCD1
|
LIM and cysteine-rich domains 1 |
| chr1_-_53387386 | 5.65 |
ENST00000467988.1
ENST00000358358.5 ENST00000371522.4 |
ECHDC2
|
enoyl CoA hydratase domain containing 2 |
| chr12_+_58013693 | 5.64 |
ENST00000320442.4
ENST00000379218.2 |
SLC26A10
|
solute carrier family 26, member 10 |
| chr3_+_37284824 | 5.51 |
ENST00000431105.1
|
GOLGA4
|
golgin A4 |
| chr4_+_124317940 | 5.39 |
ENST00000505319.1
ENST00000339241.1 |
SPRY1
|
sprouty homolog 1, antagonist of FGF signaling (Drosophila) |
| chr17_+_13972807 | 5.38 |
ENST00000429152.2
ENST00000261643.3 ENST00000536205.1 ENST00000537334.1 |
COX10
|
cytochrome c oxidase assembly homolog 10 (yeast) |
| chr20_+_54933971 | 5.35 |
ENST00000371384.3
ENST00000437418.1 |
FAM210B
|
family with sequence similarity 210, member B |
| chr11_+_308143 | 5.31 |
ENST00000399817.4
|
IFITM2
|
interferon induced transmembrane protein 2 |
| chr7_-_27169801 | 5.28 |
ENST00000511914.1
|
HOXA4
|
homeobox A4 |
| chr11_+_308217 | 5.18 |
ENST00000602569.1
|
IFITM2
|
interferon induced transmembrane protein 2 |
| chr9_-_14313641 | 5.15 |
ENST00000380953.1
|
NFIB
|
nuclear factor I/B |
| chr1_+_151739131 | 5.04 |
ENST00000400999.1
|
OAZ3
|
ornithine decarboxylase antizyme 3 |
| chr1_-_157108266 | 5.00 |
ENST00000326786.4
|
ETV3
|
ets variant 3 |
| chr3_+_8543393 | 4.79 |
ENST00000157600.3
ENST00000415597.1 ENST00000535732.1 |
LMCD1
|
LIM and cysteine-rich domains 1 |
| chr22_+_29469100 | 4.76 |
ENST00000327813.5
ENST00000407188.1 |
KREMEN1
|
kringle containing transmembrane protein 1 |
| chr3_-_114790179 | 4.76 |
ENST00000462705.1
|
ZBTB20
|
zinc finger and BTB domain containing 20 |
| chr4_+_95972822 | 4.70 |
ENST00000509540.1
ENST00000440890.2 |
BMPR1B
|
bone morphogenetic protein receptor, type IB |
| chr1_-_149858227 | 4.59 |
ENST00000369155.2
|
HIST2H2BE
|
histone cluster 2, H2be |
| chr17_+_75137460 | 4.56 |
ENST00000587820.1
|
SEC14L1
|
SEC14-like 1 (S. cerevisiae) |
| chr3_+_156544057 | 4.52 |
ENST00000498839.1
ENST00000470811.1 ENST00000356539.4 ENST00000483177.1 ENST00000477399.1 ENST00000491763.1 |
LEKR1
|
leucine, glutamate and lysine rich 1 |
| chr15_+_101420028 | 4.50 |
ENST00000557963.1
ENST00000346623.6 |
ALDH1A3
|
aldehyde dehydrogenase 1 family, member A3 |
| chr16_-_28937027 | 4.49 |
ENST00000358201.4
|
RABEP2
|
rabaptin, RAB GTPase binding effector protein 2 |
| chr14_+_75761099 | 4.45 |
ENST00000561000.1
ENST00000558575.1 |
RP11-293M10.5
|
RP11-293M10.5 |
| chr5_+_34656569 | 4.44 |
ENST00000428746.2
|
RAI14
|
retinoic acid induced 14 |
| chrX_+_135251835 | 4.43 |
ENST00000456445.1
|
FHL1
|
four and a half LIM domains 1 |
| chr8_-_9009079 | 4.31 |
ENST00000519699.1
|
PPP1R3B
|
protein phosphatase 1, regulatory subunit 3B |
| chr12_-_56106060 | 4.31 |
ENST00000452168.2
|
ITGA7
|
integrin, alpha 7 |
| chr8_+_99956662 | 4.24 |
ENST00000523368.1
ENST00000297565.4 ENST00000435298.2 |
OSR2
|
odd-skipped related transciption factor 2 |
| chr20_+_43343886 | 4.24 |
ENST00000190983.4
|
WISP2
|
WNT1 inducible signaling pathway protein 2 |
| chr1_+_196788887 | 4.21 |
ENST00000320493.5
ENST00000367424.4 ENST00000367421.3 |
CFHR1
CFHR2
|
complement factor H-related 1 complement factor H-related 2 |
| chr2_+_196313239 | 4.19 |
ENST00000413290.1
|
AC064834.1
|
AC064834.1 |
| chr22_-_38699003 | 4.19 |
ENST00000451964.1
|
CSNK1E
|
casein kinase 1, epsilon |
| chr17_-_31204124 | 4.18 |
ENST00000579584.1
ENST00000318217.5 ENST00000583621.1 |
MYO1D
|
myosin ID |
| chr7_-_74221288 | 4.15 |
ENST00000451013.2
|
GTF2IRD2
|
GTF2I repeat domain containing 2 |
| chr15_-_81616446 | 4.15 |
ENST00000302824.6
|
STARD5
|
StAR-related lipid transfer (START) domain containing 5 |
| chr19_-_38806560 | 4.15 |
ENST00000591755.1
ENST00000337679.8 ENST00000339413.6 |
YIF1B
|
Yip1 interacting factor homolog B (S. cerevisiae) |
| chr1_+_22962948 | 4.10 |
ENST00000374642.3
|
C1QA
|
complement component 1, q subcomponent, A chain |
| chr11_+_107461948 | 4.08 |
ENST00000265840.7
ENST00000443271.2 |
ELMOD1
|
ELMO/CED-12 domain containing 1 |
| chr3_+_8543533 | 4.07 |
ENST00000454244.1
|
LMCD1
|
LIM and cysteine-rich domains 1 |
| chr11_+_66624527 | 4.04 |
ENST00000393952.3
|
LRFN4
|
leucine rich repeat and fibronectin type III domain containing 4 |
| chr2_+_223916862 | 4.00 |
ENST00000604125.1
|
KCNE4
|
potassium voltage-gated channel, Isk-related family, member 4 |
| chr3_+_129247479 | 3.91 |
ENST00000296271.3
|
RHO
|
rhodopsin |
| chr7_+_100183927 | 3.87 |
ENST00000241071.6
ENST00000360609.2 |
FBXO24
|
F-box protein 24 |
| chr8_+_37654424 | 3.84 |
ENST00000315215.7
|
GPR124
|
G protein-coupled receptor 124 |
| chr3_+_193853927 | 3.84 |
ENST00000232424.3
|
HES1
|
hes family bHLH transcription factor 1 |
| chr14_+_23340822 | 3.79 |
ENST00000359591.4
|
LRP10
|
low density lipoprotein receptor-related protein 10 |
| chr6_+_7108210 | 3.79 |
ENST00000467782.1
ENST00000334984.6 ENST00000349384.6 |
RREB1
|
ras responsive element binding protein 1 |
| chr22_+_29469012 | 3.78 |
ENST00000400335.4
ENST00000400338.2 |
KREMEN1
|
kringle containing transmembrane protein 1 |
| chr9_-_23825956 | 3.74 |
ENST00000397312.2
|
ELAVL2
|
ELAV like neuron-specific RNA binding protein 2 |
| chr5_-_131347501 | 3.67 |
ENST00000543479.1
|
ACSL6
|
acyl-CoA synthetase long-chain family member 6 |
| chr16_+_28875126 | 3.66 |
ENST00000359285.5
ENST00000538342.1 |
SH2B1
|
SH2B adaptor protein 1 |
| chr1_-_229569834 | 3.64 |
ENST00000366684.3
ENST00000366683.2 |
ACTA1
|
actin, alpha 1, skeletal muscle |
| chrX_+_102840408 | 3.63 |
ENST00000468024.1
ENST00000472484.1 ENST00000415568.2 ENST00000490644.1 ENST00000459722.1 ENST00000472745.1 ENST00000494801.1 ENST00000434216.2 ENST00000425011.1 |
TCEAL4
|
transcription elongation factor A (SII)-like 4 |
| chr9_+_37650945 | 3.57 |
ENST00000377765.3
|
FRMPD1
|
FERM and PDZ domain containing 1 |
| chr6_+_126102292 | 3.56 |
ENST00000368357.3
|
NCOA7
|
nuclear receptor coactivator 7 |
| chr9_+_17135016 | 3.56 |
ENST00000425824.1
ENST00000262360.5 ENST00000380641.4 |
CNTLN
|
centlein, centrosomal protein |
| chr10_+_76586348 | 3.54 |
ENST00000372724.1
ENST00000287239.4 ENST00000372714.1 |
KAT6B
|
K(lysine) acetyltransferase 6B |
| chr17_-_33905521 | 3.53 |
ENST00000225873.4
|
PEX12
|
peroxisomal biogenesis factor 12 |
| chr5_-_112630598 | 3.52 |
ENST00000302475.4
|
MCC
|
mutated in colorectal cancers |
| chr4_-_90229142 | 3.49 |
ENST00000609438.1
|
GPRIN3
|
GPRIN family member 3 |
| chr3_-_49722523 | 3.49 |
ENST00000448220.1
|
MST1
|
macrophage stimulating 1 (hepatocyte growth factor-like) |
| chrX_+_103810874 | 3.48 |
ENST00000372582.1
|
IL1RAPL2
|
interleukin 1 receptor accessory protein-like 2 |
| chr9_-_14313893 | 3.46 |
ENST00000380921.3
ENST00000380959.3 |
NFIB
|
nuclear factor I/B |
| chr2_+_171034646 | 3.40 |
ENST00000409044.3
ENST00000408978.4 |
MYO3B
|
myosin IIIB |
| chr6_+_149068464 | 3.30 |
ENST00000367463.4
|
UST
|
uronyl-2-sulfotransferase |
| chr5_-_154230130 | 3.30 |
ENST00000519501.1
ENST00000518651.1 ENST00000517938.1 ENST00000520461.1 |
FAXDC2
|
fatty acid hydroxylase domain containing 2 |
| chr22_+_46546494 | 3.26 |
ENST00000396000.2
ENST00000262735.5 ENST00000420804.1 |
PPARA
|
peroxisome proliferator-activated receptor alpha |
| chr9_+_17134980 | 3.26 |
ENST00000380647.3
|
CNTLN
|
centlein, centrosomal protein |
| chr14_+_22293618 | 3.25 |
ENST00000390432.2
|
TRAV10
|
T cell receptor alpha variable 10 |
| chr2_+_219433281 | 3.25 |
ENST00000273064.6
ENST00000509807.2 ENST00000542068.1 |
RQCD1
|
RCD1 required for cell differentiation1 homolog (S. pombe) |
| chr8_+_11561660 | 3.21 |
ENST00000526716.1
ENST00000335135.4 ENST00000528027.1 |
GATA4
|
GATA binding protein 4 |
| chr14_-_76447494 | 3.17 |
ENST00000238682.3
|
TGFB3
|
transforming growth factor, beta 3 |
| chrX_+_49832231 | 3.15 |
ENST00000376108.3
|
CLCN5
|
chloride channel, voltage-sensitive 5 |
| chr9_-_21368075 | 3.14 |
ENST00000449498.1
|
IFNA13
|
interferon, alpha 13 |
| chr3_-_9994021 | 3.14 |
ENST00000411976.2
ENST00000412055.1 |
PRRT3
|
proline-rich transmembrane protein 3 |
| chr9_-_115983641 | 3.13 |
ENST00000238256.3
|
FKBP15
|
FK506 binding protein 15, 133kDa |
| chr16_+_84209539 | 3.12 |
ENST00000569735.1
|
DNAAF1
|
dynein, axonemal, assembly factor 1 |
| chr1_+_46972668 | 3.12 |
ENST00000371956.4
ENST00000360032.3 |
DMBX1
|
diencephalon/mesencephalon homeobox 1 |
| chrX_+_152990302 | 3.10 |
ENST00000218104.3
|
ABCD1
|
ATP-binding cassette, sub-family D (ALD), member 1 |
| chr10_-_44070016 | 3.10 |
ENST00000374446.2
ENST00000426961.1 ENST00000535642.1 |
ZNF239
|
zinc finger protein 239 |
| chr9_-_14314066 | 3.09 |
ENST00000397575.3
|
NFIB
|
nuclear factor I/B |
| chr7_+_112090483 | 3.08 |
ENST00000403825.3
ENST00000429071.1 |
IFRD1
|
interferon-related developmental regulator 1 |
| chr13_-_95364389 | 3.08 |
ENST00000376945.2
|
SOX21
|
SRY (sex determining region Y)-box 21 |
| chr8_+_99956759 | 3.05 |
ENST00000522510.1
ENST00000457907.2 |
OSR2
|
odd-skipped related transciption factor 2 |
| chr10_+_94833642 | 3.01 |
ENST00000224356.4
ENST00000394139.1 |
CYP26A1
|
cytochrome P450, family 26, subfamily A, polypeptide 1 |
| chr11_-_108093329 | 3.01 |
ENST00000278612.8
|
NPAT
|
nuclear protein, ataxia-telangiectasia locus |
| chr13_+_25670268 | 2.98 |
ENST00000281589.3
|
PABPC3
|
poly(A) binding protein, cytoplasmic 3 |
| chr6_+_7107830 | 2.87 |
ENST00000379933.3
|
RREB1
|
ras responsive element binding protein 1 |
| chr20_+_37590942 | 2.83 |
ENST00000373325.2
ENST00000252011.3 ENST00000373323.4 |
DHX35
|
DEAH (Asp-Glu-Ala-His) box polypeptide 35 |
| chr6_-_167040731 | 2.82 |
ENST00000265678.4
|
RPS6KA2
|
ribosomal protein S6 kinase, 90kDa, polypeptide 2 |
| chr20_-_35724388 | 2.78 |
ENST00000344359.3
ENST00000373664.3 |
RBL1
|
retinoblastoma-like 1 (p107) |
| chr3_-_126373929 | 2.72 |
ENST00000523403.1
ENST00000524230.2 |
TXNRD3
|
thioredoxin reductase 3 |
| chr7_-_100183742 | 2.70 |
ENST00000310300.6
|
LRCH4
|
leucine-rich repeats and calponin homology (CH) domain containing 4 |
| chr9_-_129884902 | 2.70 |
ENST00000373417.1
|
ANGPTL2
|
angiopoietin-like 2 |
| chr2_+_18059906 | 2.68 |
ENST00000304101.4
|
KCNS3
|
potassium voltage-gated channel, delayed-rectifier, subfamily S, member 3 |
| chr1_-_120612240 | 2.67 |
ENST00000256646.2
|
NOTCH2
|
notch 2 |
| chr1_-_47407111 | 2.66 |
ENST00000371904.4
|
CYP4A11
|
cytochrome P450, family 4, subfamily A, polypeptide 11 |
| chr2_+_183943464 | 2.66 |
ENST00000354221.4
|
DUSP19
|
dual specificity phosphatase 19 |
| chrX_-_71525742 | 2.63 |
ENST00000450875.1
ENST00000417400.1 ENST00000431381.1 ENST00000445983.1 |
CITED1
|
Cbp/p300-interacting transactivator, with Glu/Asp-rich carboxy-terminal domain, 1 |
| chr13_-_33112823 | 2.60 |
ENST00000504114.1
|
N4BP2L2
|
NEDD4 binding protein 2-like 2 |
| chr6_+_31515337 | 2.58 |
ENST00000376148.4
ENST00000376145.4 |
NFKBIL1
|
nuclear factor of kappa light polypeptide gene enhancer in B-cells inhibitor-like 1 |
| chr1_+_15479021 | 2.57 |
ENST00000428417.1
|
TMEM51
|
transmembrane protein 51 |
| chr11_-_108369101 | 2.52 |
ENST00000323468.5
|
KDELC2
|
KDEL (Lys-Asp-Glu-Leu) containing 2 |
| chr17_-_2206801 | 2.51 |
ENST00000544865.1
|
SMG6
|
SMG6 nonsense mediated mRNA decay factor |
| chr2_-_158732340 | 2.49 |
ENST00000539637.1
ENST00000413751.1 ENST00000434821.1 ENST00000424669.1 |
ACVR1
|
activin A receptor, type I |
| chr22_-_32341336 | 2.46 |
ENST00000248984.3
|
C22orf24
|
chromosome 22 open reading frame 24 |
| chrX_-_30327495 | 2.38 |
ENST00000453287.1
|
NR0B1
|
nuclear receptor subfamily 0, group B, member 1 |
| chr12_-_114843889 | 2.38 |
ENST00000405440.2
|
TBX5
|
T-box 5 |
| chr1_+_173793641 | 2.35 |
ENST00000361951.4
|
DARS2
|
aspartyl-tRNA synthetase 2, mitochondrial |
| chr7_-_100844193 | 2.29 |
ENST00000440203.2
ENST00000379423.3 ENST00000223114.4 |
MOGAT3
|
monoacylglycerol O-acyltransferase 3 |
| chr19_+_7011509 | 2.29 |
ENST00000377296.3
|
AC025278.1
|
Uncharacterized protein |
| chr7_+_45613958 | 2.29 |
ENST00000297323.7
|
ADCY1
|
adenylate cyclase 1 (brain) |
| chr19_+_589893 | 2.26 |
ENST00000251287.2
|
HCN2
|
hyperpolarization activated cyclic nucleotide-gated potassium channel 2 |
| chr11_+_108093559 | 2.26 |
ENST00000278616.4
|
ATM
|
ataxia telangiectasia mutated |
| chr5_-_112770674 | 2.23 |
ENST00000390666.3
|
TSSK1B
|
testis-specific serine kinase 1B |
| chr11_-_66445219 | 2.19 |
ENST00000525754.1
ENST00000531969.1 ENST00000524637.1 ENST00000531036.2 ENST00000310046.4 |
RBM4B
|
RNA binding motif protein 4B |
| chr7_+_87563557 | 2.17 |
ENST00000439864.1
ENST00000412441.1 ENST00000398201.4 ENST00000265727.7 ENST00000315984.7 ENST00000398209.3 |
ADAM22
|
ADAM metallopeptidase domain 22 |
| chr13_-_33859819 | 2.15 |
ENST00000336934.5
|
STARD13
|
StAR-related lipid transfer (START) domain containing 13 |
| chr2_+_69240511 | 2.14 |
ENST00000409349.3
|
ANTXR1
|
anthrax toxin receptor 1 |
| chr3_+_37284668 | 2.14 |
ENST00000361924.2
ENST00000444882.1 ENST00000356847.4 ENST00000450863.2 ENST00000429018.1 |
GOLGA4
|
golgin A4 |
| chr17_+_33448593 | 2.13 |
ENST00000158009.5
|
FNDC8
|
fibronectin type III domain containing 8 |
| chr1_-_20250110 | 2.12 |
ENST00000375116.3
|
PLA2G2E
|
phospholipase A2, group IIE |
| chr4_+_5712898 | 2.10 |
ENST00000264956.6
ENST00000382674.2 |
EVC
|
Ellis van Creveld syndrome |
| chrX_+_45364633 | 2.09 |
ENST00000435394.1
ENST00000609127.1 |
RP11-245M24.1
|
RP11-245M24.1 |
| chr1_+_196912902 | 2.08 |
ENST00000476712.2
ENST00000367415.5 |
CFHR2
|
complement factor H-related 2 |
| chr7_-_30518387 | 2.08 |
ENST00000222823.4
ENST00000419601.1 |
NOD1
|
nucleotide-binding oligomerization domain containing 1 |
| chr5_+_149546334 | 2.07 |
ENST00000231656.8
|
CDX1
|
caudal type homeobox 1 |
| chr2_+_69240302 | 2.07 |
ENST00000303714.4
|
ANTXR1
|
anthrax toxin receptor 1 |
| chr14_-_21492113 | 2.06 |
ENST00000554094.1
|
NDRG2
|
NDRG family member 2 |
| chr12_+_54447637 | 2.06 |
ENST00000609810.1
ENST00000430889.2 |
HOXC4
HOXC4
|
homeobox C4 Homeobox protein Hox-C4 |
| chr7_+_22766766 | 2.04 |
ENST00000426291.1
ENST00000401651.1 ENST00000258743.5 ENST00000420258.2 ENST00000407492.1 ENST00000401630.3 ENST00000406575.1 |
IL6
|
interleukin 6 (interferon, beta 2) |
| chr16_+_83986827 | 2.03 |
ENST00000393306.1
ENST00000565123.1 |
OSGIN1
|
oxidative stress induced growth inhibitor 1 |
| chr22_-_24641027 | 2.03 |
ENST00000398292.3
ENST00000263112.7 ENST00000418439.2 ENST00000424217.1 ENST00000327365.4 |
GGT5
|
gamma-glutamyltransferase 5 |
| chrX_-_48216101 | 2.02 |
ENST00000298396.2
ENST00000376893.3 |
SSX3
|
synovial sarcoma, X breakpoint 3 |
| chr2_+_69240415 | 1.99 |
ENST00000409829.3
|
ANTXR1
|
anthrax toxin receptor 1 |
| chr6_+_27782788 | 1.98 |
ENST00000359465.4
|
HIST1H2BM
|
histone cluster 1, H2bm |
| chr9_-_129885010 | 1.97 |
ENST00000373425.3
|
ANGPTL2
|
angiopoietin-like 2 |
| chr4_-_168155169 | 1.97 |
ENST00000534949.1
ENST00000535728.1 |
SPOCK3
|
sparc/osteonectin, cwcv and kazal-like domains proteoglycan (testican) 3 |
| chr1_-_28177255 | 1.97 |
ENST00000601459.1
|
AL109927.1
|
HCG2032222; PRO2047; Uncharacterized protein |
| chr2_-_220083076 | 1.97 |
ENST00000295750.4
|
ABCB6
|
ATP-binding cassette, sub-family B (MDR/TAP), member 6 |
| chr12_+_6494285 | 1.96 |
ENST00000541102.1
|
LTBR
|
lymphotoxin beta receptor (TNFR superfamily, member 3) |
| chr1_+_15479054 | 1.94 |
ENST00000376014.3
ENST00000451326.2 |
TMEM51
|
transmembrane protein 51 |
| chr3_-_58196688 | 1.90 |
ENST00000486455.1
|
DNASE1L3
|
deoxyribonuclease I-like 3 |
| chr19_+_40697514 | 1.87 |
ENST00000253055.3
|
MAP3K10
|
mitogen-activated protein kinase kinase kinase 10 |
| chr11_+_118478313 | 1.87 |
ENST00000356063.5
|
PHLDB1
|
pleckstrin homology-like domain, family B, member 1 |
| chr1_+_25943959 | 1.85 |
ENST00000374332.4
|
MAN1C1
|
mannosidase, alpha, class 1C, member 1 |
| chr8_+_67579807 | 1.85 |
ENST00000519289.1
ENST00000519561.1 ENST00000521889.1 |
C8orf44-SGK3
C8orf44
|
C8orf44-SGK3 readthrough chromosome 8 open reading frame 44 |
| chr3_-_58196939 | 1.85 |
ENST00000394549.2
ENST00000461914.3 |
DNASE1L3
|
deoxyribonuclease I-like 3 |
| chr1_+_55107449 | 1.84 |
ENST00000421030.2
ENST00000545244.1 ENST00000339553.5 ENST00000409996.1 ENST00000454855.2 |
MROH7
|
maestro heat-like repeat family member 7 |
| chr5_+_66124590 | 1.84 |
ENST00000490016.2
ENST00000403666.1 ENST00000450827.1 |
MAST4
|
microtubule associated serine/threonine kinase family member 4 |
| chr8_-_57359131 | 1.82 |
ENST00000518974.1
ENST00000523051.1 ENST00000518770.1 ENST00000451791.2 |
PENK
|
proenkephalin |
| chr5_+_140810132 | 1.80 |
ENST00000252085.3
|
PCDHGA12
|
protocadherin gamma subfamily A, 12 |
| chr3_+_12330560 | 1.80 |
ENST00000397026.2
|
PPARG
|
peroxisome proliferator-activated receptor gamma |
| chr5_+_137203465 | 1.79 |
ENST00000239926.4
|
MYOT
|
myotilin |
| chr13_+_24844819 | 1.76 |
ENST00000399949.2
|
SPATA13
|
spermatogenesis associated 13 |
| chr18_+_29027696 | 1.76 |
ENST00000257189.4
|
DSG3
|
desmoglein 3 |
| chr16_-_28936493 | 1.76 |
ENST00000544477.1
ENST00000357573.6 |
RABEP2
|
rabaptin, RAB GTPase binding effector protein 2 |
| chr11_-_129872712 | 1.75 |
ENST00000358825.5
ENST00000360871.3 ENST00000528746.1 |
PRDM10
|
PR domain containing 10 |
| chr5_+_125695805 | 1.73 |
ENST00000513040.1
|
GRAMD3
|
GRAM domain containing 3 |
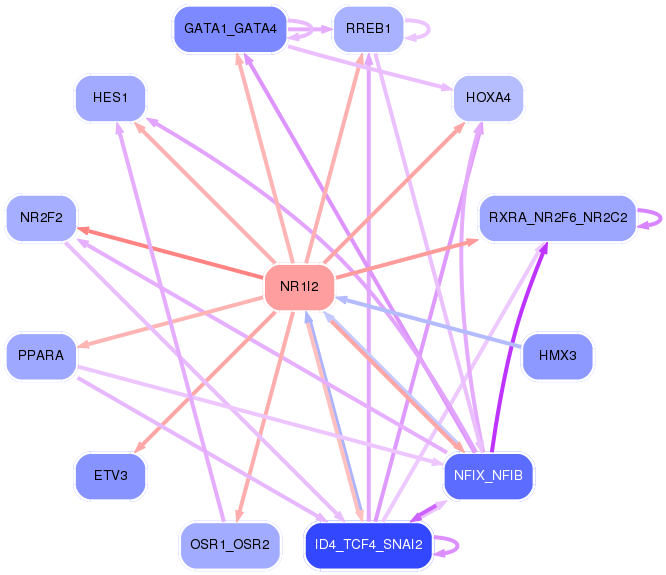
Network of associatons between targets according to the STRING database.

First level regulatory network of NR1I2
Gene Ontology Analysis
Gene overrepresentation in biological_process category:
| Log-likelihood per target | Total log-likelihood | Term | Description |
|---|---|---|---|
| 6.8 | 81.3 | GO:1900747 | negative regulation of vascular endothelial growth factor signaling pathway(GO:1900747) |
| 4.4 | 17.6 | GO:0009956 | radial pattern formation(GO:0009956) |
| 3.7 | 11.1 | GO:0002581 | negative regulation of antigen processing and presentation of peptide or polysaccharide antigen via MHC class II(GO:0002581) |
| 2.5 | 2.5 | GO:2000017 | positive regulation of determination of dorsal identity(GO:2000017) |
| 2.4 | 7.2 | GO:0030241 | skeletal muscle myosin thick filament assembly(GO:0030241) |
| 2.3 | 9.4 | GO:0061304 | retinal blood vessel morphogenesis(GO:0061304) |
| 2.1 | 4.2 | GO:0060164 | regulation of timing of neuron differentiation(GO:0060164) |
| 2.1 | 6.2 | GO:1901202 | negative regulation of extracellular matrix assembly(GO:1901202) |
| 1.9 | 9.6 | GO:0035524 | proline transmembrane transport(GO:0035524) |
| 1.8 | 7.3 | GO:0036023 | limb joint morphogenesis(GO:0036022) embryonic skeletal limb joint morphogenesis(GO:0036023) |
| 1.8 | 5.4 | GO:0060940 | epithelial to mesenchymal transition involved in cardiac fibroblast development(GO:0060940) |
| 1.7 | 11.7 | GO:0021730 | trigeminal sensory nucleus development(GO:0021730) principal sensory nucleus of trigeminal nerve development(GO:0021740) negative regulation of epithelial cell proliferation involved in lung morphogenesis(GO:2000795) |
| 1.7 | 6.7 | GO:1903691 | positive regulation of wound healing, spreading of epidermal cells(GO:1903691) |
| 1.6 | 6.2 | GO:0021812 | neuronal-glial interaction involved in cerebral cortex radial glia guided migration(GO:0021812) |
| 1.5 | 4.5 | GO:0060166 | olfactory pit development(GO:0060166) |
| 1.3 | 6.6 | GO:0060301 | vestibulocochlear nerve structural organization(GO:0021649) positive regulation of cytokine activity(GO:0060301) ganglion morphogenesis(GO:0061552) endothelial tip cell fate specification(GO:0097102) VEGF-activated neuropilin signaling pathway involved in axon guidance(GO:1902378) dorsal root ganglion morphogenesis(GO:1904835) otic placode development(GO:1905040) |
| 1.2 | 22.5 | GO:0007021 | tubulin complex assembly(GO:0007021) |
| 1.1 | 13.4 | GO:0001886 | endothelial cell morphogenesis(GO:0001886) |
| 1.1 | 6.6 | GO:0060136 | embryonic process involved in female pregnancy(GO:0060136) |
| 1.1 | 4.4 | GO:0003289 | atrial septum primum morphogenesis(GO:0003289) |
| 1.1 | 3.2 | GO:0036378 | calcitriol biosynthetic process from calciol(GO:0036378) |
| 1.0 | 3.1 | GO:0007518 | myoblast fate determination(GO:0007518) |
| 1.0 | 5.0 | GO:1902268 | negative regulation of polyamine transmembrane transport(GO:1902268) |
| 1.0 | 3.0 | GO:0034653 | diterpenoid catabolic process(GO:0016103) retinoic acid catabolic process(GO:0034653) |
| 0.9 | 4.7 | GO:0001550 | ovarian cumulus expansion(GO:0001550) fused antrum stage(GO:0048165) |
| 0.8 | 3.4 | GO:0003095 | pressure natriuresis(GO:0003095) |
| 0.8 | 3.3 | GO:0072366 | regulation of cellular ketone metabolic process by positive regulation of transcription from RNA polymerase II promoter(GO:0072366) regulation of lipid transport by positive regulation of transcription from RNA polymerase II promoter(GO:0072369) |
| 0.8 | 5.6 | GO:0019532 | oxalate transport(GO:0019532) |
| 0.8 | 4.8 | GO:0035469 | determination of pancreatic left/right asymmetry(GO:0035469) |
| 0.8 | 3.2 | GO:1905073 | ossification involved in bone remodeling(GO:0043932) frontal suture morphogenesis(GO:0060364) occluding junction disassembly(GO:1905071) regulation of occluding junction disassembly(GO:1905073) positive regulation of occluding junction disassembly(GO:1905075) |
| 0.8 | 2.4 | GO:0003218 | cardiac left ventricle formation(GO:0003218) |
| 0.8 | 3.9 | GO:0052199 | negative regulation of catalytic activity in other organism involved in symbiotic interaction(GO:0052199) |
| 0.8 | 2.3 | GO:0006421 | asparaginyl-tRNA aminoacylation(GO:0006421) |
| 0.8 | 3.1 | GO:0015910 | peroxisomal long-chain fatty acid import(GO:0015910) |
| 0.8 | 2.3 | GO:1904868 | signal transduction involved in G2 DNA damage checkpoint(GO:0072425) signal transduction involved in mitotic G2 DNA damage checkpoint(GO:0072434) telomerase catalytic core complex assembly(GO:1904868) regulation of telomerase catalytic core complex assembly(GO:1904882) positive regulation of telomerase catalytic core complex assembly(GO:1904884) |
| 0.7 | 3.6 | GO:0030240 | skeletal muscle thin filament assembly(GO:0030240) |
| 0.7 | 10.7 | GO:0033539 | fatty acid beta-oxidation using acyl-CoA dehydrogenase(GO:0033539) |
| 0.7 | 4.2 | GO:0061502 | early endosome to recycling endosome transport(GO:0061502) |
| 0.7 | 2.0 | GO:0002384 | hepatic immune response(GO:0002384) response to prolactin(GO:1990637) regulation of STAT protein import into nucleus(GO:2000364) positive regulation of STAT protein import into nucleus(GO:2000366) |
| 0.7 | 4.7 | GO:1902035 | positive regulation of hematopoietic stem cell proliferation(GO:1902035) |
| 0.6 | 1.9 | GO:0061113 | pancreas morphogenesis(GO:0061113) |
| 0.6 | 8.2 | GO:0017121 | phospholipid scrambling(GO:0017121) |
| 0.6 | 1.2 | GO:1902548 | negative regulation of cellular response to vascular endothelial growth factor stimulus(GO:1902548) |
| 0.6 | 14.6 | GO:0070886 | positive regulation of calcineurin-NFAT signaling cascade(GO:0070886) |
| 0.6 | 9.4 | GO:0071285 | cellular response to lithium ion(GO:0071285) |
| 0.5 | 16.3 | GO:0061641 | CENP-A containing nucleosome assembly(GO:0034080) CENP-A containing chromatin organization(GO:0061641) |
| 0.5 | 2.1 | GO:0014807 | regulation of somitogenesis(GO:0014807) |
| 0.5 | 1.6 | GO:0038190 | coronary vein morphogenesis(GO:0003169) neuropilin signaling pathway(GO:0038189) VEGF-activated neuropilin signaling pathway(GO:0038190) positive regulation of retinal ganglion cell axon guidance(GO:1902336) regulation of protein kinase D signaling(GO:1903570) positive regulation of protein kinase D signaling(GO:1903572) |
| 0.5 | 3.0 | GO:1904381 | Golgi apparatus mannose trimming(GO:1904381) |
| 0.5 | 1.5 | GO:0090611 | ubiquitin-independent protein catabolic process via the multivesicular body sorting pathway(GO:0090611) |
| 0.5 | 6.3 | GO:0045919 | positive regulation of cytolysis(GO:0045919) |
| 0.5 | 1.4 | GO:0060018 | astrocyte fate commitment(GO:0060018) |
| 0.5 | 5.1 | GO:0039536 | negative regulation of RIG-I signaling pathway(GO:0039536) |
| 0.5 | 25.1 | GO:0043268 | positive regulation of potassium ion transport(GO:0043268) |
| 0.5 | 1.8 | GO:0051866 | general adaptation syndrome(GO:0051866) |
| 0.5 | 6.3 | GO:0097011 | cellular response to granulocyte macrophage colony-stimulating factor stimulus(GO:0097011) response to granulocyte macrophage colony-stimulating factor(GO:0097012) |
| 0.5 | 1.8 | GO:2000230 | negative regulation of pancreatic stellate cell proliferation(GO:2000230) |
| 0.4 | 2.6 | GO:0071105 | response to interleukin-11(GO:0071105) |
| 0.4 | 4.3 | GO:0005981 | regulation of glycogen catabolic process(GO:0005981) |
| 0.4 | 2.2 | GO:0097498 | endothelial tube lumen extension(GO:0097498) |
| 0.4 | 6.8 | GO:0010457 | centriole-centriole cohesion(GO:0010457) |
| 0.4 | 3.0 | GO:1904354 | negative regulation of telomere capping(GO:1904354) |
| 0.4 | 6.3 | GO:0033623 | regulation of integrin activation(GO:0033623) |
| 0.4 | 1.2 | GO:0009447 | putrescine catabolic process(GO:0009447) |
| 0.4 | 10.8 | GO:0046597 | negative regulation of viral entry into host cell(GO:0046597) |
| 0.4 | 1.5 | GO:0033686 | positive regulation of luteinizing hormone secretion(GO:0033686) |
| 0.4 | 2.3 | GO:0071321 | cellular response to cGMP(GO:0071321) |
| 0.4 | 3.3 | GO:0006477 | protein sulfation(GO:0006477) |
| 0.4 | 1.4 | GO:0003331 | regulation of extracellular matrix constituent secretion(GO:0003330) positive regulation of extracellular matrix constituent secretion(GO:0003331) |
| 0.3 | 2.1 | GO:0016045 | detection of bacterium(GO:0016045) |
| 0.3 | 3.1 | GO:0008343 | adult feeding behavior(GO:0008343) |
| 0.3 | 6.1 | GO:0010510 | regulation of acetyl-CoA biosynthetic process from pyruvate(GO:0010510) |
| 0.3 | 6.6 | GO:0001765 | membrane raft assembly(GO:0001765) |
| 0.3 | 0.9 | GO:0061056 | sclerotome development(GO:0061056) |
| 0.3 | 2.7 | GO:0060413 | atrial septum morphogenesis(GO:0060413) |
| 0.3 | 7.7 | GO:0000042 | protein targeting to Golgi(GO:0000042) |
| 0.3 | 4.1 | GO:0035376 | sterol import(GO:0035376) cholesterol import(GO:0070508) |
| 0.3 | 3.6 | GO:0060526 | prostate glandular acinus morphogenesis(GO:0060526) prostate epithelial cord arborization involved in prostate glandular acinus morphogenesis(GO:0060527) |
| 0.3 | 0.5 | GO:0033634 | positive regulation of cell-cell adhesion mediated by integrin(GO:0033634) |
| 0.3 | 0.8 | GO:1901341 | activation of store-operated calcium channel activity(GO:0032237) positive regulation of store-operated calcium channel activity(GO:1901341) |
| 0.3 | 5.4 | GO:0008535 | respiratory chain complex IV assembly(GO:0008535) |
| 0.3 | 1.9 | GO:0007256 | activation of JNKK activity(GO:0007256) |
| 0.3 | 0.8 | GO:0018894 | dibenzo-p-dioxin metabolic process(GO:0018894) cellular alkene metabolic process(GO:0043449) |
| 0.3 | 12.4 | GO:0032728 | positive regulation of interferon-beta production(GO:0032728) |
| 0.2 | 1.5 | GO:0006287 | base-excision repair, gap-filling(GO:0006287) |
| 0.2 | 3.5 | GO:0045721 | negative regulation of gluconeogenesis(GO:0045721) |
| 0.2 | 3.9 | GO:0018298 | protein-chromophore linkage(GO:0018298) |
| 0.2 | 1.7 | GO:0033353 | S-adenosylmethionine cycle(GO:0033353) |
| 0.2 | 4.6 | GO:0002227 | innate immune response in mucosa(GO:0002227) |
| 0.2 | 3.4 | GO:1901748 | leukotriene D4 metabolic process(GO:1901748) leukotriene D4 biosynthetic process(GO:1901750) |
| 0.2 | 1.2 | GO:0090074 | negative regulation of protein homodimerization activity(GO:0090074) |
| 0.2 | 0.9 | GO:0060672 | epithelial cell differentiation involved in embryonic placenta development(GO:0060671) epithelial cell morphogenesis involved in placental branching(GO:0060672) |
| 0.2 | 0.9 | GO:0035106 | operant conditioning(GO:0035106) |
| 0.2 | 3.6 | GO:1902083 | negative regulation of peptidyl-cysteine S-nitrosylation(GO:1902083) |
| 0.2 | 2.4 | GO:0033327 | Leydig cell differentiation(GO:0033327) |
| 0.2 | 1.1 | GO:0051142 | positive regulation of interferon-gamma biosynthetic process(GO:0045078) regulation of NK T cell proliferation(GO:0051140) positive regulation of NK T cell proliferation(GO:0051142) |
| 0.2 | 1.1 | GO:0072233 | thick ascending limb development(GO:0072023) metanephric thick ascending limb development(GO:0072233) |
| 0.2 | 4.2 | GO:2000052 | positive regulation of non-canonical Wnt signaling pathway(GO:2000052) |
| 0.2 | 2.3 | GO:0010226 | response to lithium ion(GO:0010226) |
| 0.2 | 1.0 | GO:0032571 | response to vitamin K(GO:0032571) |
| 0.2 | 3.7 | GO:0010623 | programmed cell death involved in cell development(GO:0010623) |
| 0.2 | 0.8 | GO:0060762 | regulation of branching involved in mammary gland duct morphogenesis(GO:0060762) |
| 0.2 | 2.0 | GO:0015886 | heme transport(GO:0015886) |
| 0.2 | 3.5 | GO:0016558 | protein import into peroxisome matrix(GO:0016558) |
| 0.2 | 2.0 | GO:0019800 | peptide cross-linking via chondroitin 4-sulfate glycosaminoglycan(GO:0019800) |
| 0.2 | 1.9 | GO:2001197 | regulation of basement membrane assembly involved in embryonic body morphogenesis(GO:1904259) positive regulation of basement membrane assembly involved in embryonic body morphogenesis(GO:1904261) basement membrane assembly involved in embryonic body morphogenesis(GO:2001197) |
| 0.2 | 2.5 | GO:0090360 | platelet-derived growth factor production(GO:0090360) regulation of platelet-derived growth factor production(GO:0090361) |
| 0.2 | 1.0 | GO:0070166 | enamel mineralization(GO:0070166) |
| 0.2 | 0.6 | GO:0046116 | queuosine biosynthetic process(GO:0008616) queuosine metabolic process(GO:0046116) |
| 0.2 | 2.3 | GO:0006071 | glycerol metabolic process(GO:0006071) |
| 0.1 | 2.7 | GO:0045199 | maintenance of apical/basal cell polarity(GO:0035090) maintenance of epithelial cell apical/basal polarity(GO:0045199) |
| 0.1 | 2.7 | GO:0043508 | negative regulation of JUN kinase activity(GO:0043508) |
| 0.1 | 1.5 | GO:0060056 | mammary gland involution(GO:0060056) |
| 0.1 | 0.9 | GO:0034196 | acylglycerol transport(GO:0034196) triglyceride transport(GO:0034197) |
| 0.1 | 0.4 | GO:0070253 | somatostatin secretion(GO:0070253) positive regulation of pancreatic juice secretion(GO:0090187) |
| 0.1 | 1.6 | GO:2000394 | phosphatidylcholine catabolic process(GO:0034638) positive regulation of lamellipodium morphogenesis(GO:2000394) |
| 0.1 | 3.7 | GO:0036152 | phosphatidylethanolamine acyl-chain remodeling(GO:0036152) |
| 0.1 | 1.1 | GO:0002051 | osteoblast fate commitment(GO:0002051) |
| 0.1 | 1.6 | GO:0030321 | transepithelial chloride transport(GO:0030321) |
| 0.1 | 0.5 | GO:0097267 | omega-hydroxylase P450 pathway(GO:0097267) |
| 0.1 | 2.1 | GO:0045880 | positive regulation of smoothened signaling pathway(GO:0045880) |
| 0.1 | 2.3 | GO:0006853 | carnitine shuttle(GO:0006853) |
| 0.1 | 2.7 | GO:2000114 | regulation of establishment of cell polarity(GO:2000114) |
| 0.1 | 1.3 | GO:1900119 | positive regulation of execution phase of apoptosis(GO:1900119) |
| 0.1 | 0.2 | GO:0042369 | vitamin D catabolic process(GO:0042369) |
| 0.1 | 2.2 | GO:0043153 | entrainment of circadian clock by photoperiod(GO:0043153) |
| 0.1 | 0.3 | GO:0070837 | dehydroascorbic acid transport(GO:0070837) |
| 0.1 | 0.7 | GO:0014722 | regulation of skeletal muscle contraction by calcium ion signaling(GO:0014722) |
| 0.1 | 2.6 | GO:2000369 | regulation of clathrin-mediated endocytosis(GO:2000369) |
| 0.1 | 7.4 | GO:0030279 | negative regulation of ossification(GO:0030279) |
| 0.1 | 0.5 | GO:2000035 | positive regulation of somatic stem cell population maintenance(GO:1904674) regulation of stem cell division(GO:2000035) |
| 0.1 | 1.7 | GO:0060009 | Sertoli cell development(GO:0060009) |
| 0.1 | 1.1 | GO:0007351 | tripartite regional subdivision(GO:0007351) anterior/posterior axis specification, embryo(GO:0008595) |
| 0.1 | 2.0 | GO:0043011 | myeloid dendritic cell differentiation(GO:0043011) |
| 0.1 | 2.6 | GO:0034122 | negative regulation of toll-like receptor signaling pathway(GO:0034122) |
| 0.1 | 0.6 | GO:0070857 | regulation of bile acid biosynthetic process(GO:0070857) |
| 0.1 | 0.5 | GO:0070934 | CRD-mediated mRNA stabilization(GO:0070934) |
| 0.1 | 2.2 | GO:0022011 | myelination in peripheral nervous system(GO:0022011) peripheral nervous system axon ensheathment(GO:0032292) |
| 0.1 | 2.8 | GO:0030318 | melanocyte differentiation(GO:0030318) |
| 0.1 | 0.5 | GO:0048312 | intracellular distribution of mitochondria(GO:0048312) |
| 0.1 | 0.5 | GO:0044351 | macropinocytosis(GO:0044351) |
| 0.1 | 0.7 | GO:0035583 | sequestering of TGFbeta in extracellular matrix(GO:0035583) |
| 0.1 | 1.5 | GO:0001976 | neurological system process involved in regulation of systemic arterial blood pressure(GO:0001976) |
| 0.1 | 0.9 | GO:0035970 | peptidyl-threonine dephosphorylation(GO:0035970) |
| 0.1 | 4.1 | GO:0010039 | response to iron ion(GO:0010039) |
| 0.1 | 0.2 | GO:0008050 | female courtship behavior(GO:0008050) |
| 0.1 | 4.1 | GO:0006635 | fatty acid beta-oxidation(GO:0006635) |
| 0.1 | 7.8 | GO:0060996 | dendritic spine development(GO:0060996) |
| 0.1 | 3.1 | GO:1903959 | regulation of anion transmembrane transport(GO:1903959) |
| 0.1 | 3.0 | GO:0000083 | regulation of transcription involved in G1/S transition of mitotic cell cycle(GO:0000083) |
| 0.1 | 0.2 | GO:2000612 | thyroid-stimulating hormone secretion(GO:0070460) regulation of thyroid-stimulating hormone secretion(GO:2000612) |
| 0.1 | 0.8 | GO:0043116 | negative regulation of vascular permeability(GO:0043116) |
| 0.1 | 1.5 | GO:0035338 | long-chain fatty-acyl-CoA biosynthetic process(GO:0035338) |
| 0.1 | 4.4 | GO:0034113 | heterotypic cell-cell adhesion(GO:0034113) |
| 0.1 | 0.8 | GO:0035641 | locomotory exploration behavior(GO:0035641) |
| 0.1 | 0.3 | GO:0080009 | mRNA methylation(GO:0080009) |
| 0.1 | 3.5 | GO:0010633 | negative regulation of epithelial cell migration(GO:0010633) |
| 0.1 | 1.1 | GO:0001569 | patterning of blood vessels(GO:0001569) |
| 0.1 | 1.2 | GO:0007597 | blood coagulation, intrinsic pathway(GO:0007597) |
| 0.1 | 1.1 | GO:0000185 | activation of MAPKKK activity(GO:0000185) |
| 0.1 | 1.3 | GO:0045599 | negative regulation of fat cell differentiation(GO:0045599) |
| 0.0 | 0.0 | GO:0006789 | bilirubin conjugation(GO:0006789) |
| 0.0 | 3.5 | GO:0043966 | histone H3 acetylation(GO:0043966) |
| 0.0 | 6.9 | GO:0007156 | homophilic cell adhesion via plasma membrane adhesion molecules(GO:0007156) |
| 0.0 | 5.0 | GO:0016573 | histone acetylation(GO:0016573) |
| 0.0 | 3.1 | GO:0001942 | hair follicle development(GO:0001942) |
| 0.0 | 1.4 | GO:0010862 | positive regulation of pathway-restricted SMAD protein phosphorylation(GO:0010862) |
| 0.0 | 4.1 | GO:1903955 | positive regulation of protein targeting to mitochondrion(GO:1903955) |
| 0.0 | 0.6 | GO:0002251 | organ or tissue specific immune response(GO:0002251) mucosal immune response(GO:0002385) |
| 0.0 | 1.8 | GO:0043252 | sodium-independent organic anion transport(GO:0043252) |
| 0.0 | 3.1 | GO:0010923 | negative regulation of phosphatase activity(GO:0010923) |
| 0.0 | 1.7 | GO:0043588 | skin development(GO:0043588) |
| 0.0 | 23.4 | GO:0030855 | epithelial cell differentiation(GO:0030855) |
| 0.0 | 0.8 | GO:0042953 | lipoprotein transport(GO:0042953) lipoprotein localization(GO:0044872) |
| 0.0 | 1.9 | GO:0048247 | lymphocyte chemotaxis(GO:0048247) |
| 0.0 | 2.0 | GO:0030032 | lamellipodium assembly(GO:0030032) |
| 0.0 | 1.0 | GO:0001558 | regulation of cell growth(GO:0001558) |
| 0.0 | 3.4 | GO:0048562 | embryonic organ morphogenesis(GO:0048562) |
| 0.0 | 5.1 | GO:0071805 | cellular potassium ion transport(GO:0071804) potassium ion transmembrane transport(GO:0071805) |
| 0.0 | 2.4 | GO:0048839 | inner ear development(GO:0048839) |
| 0.0 | 0.3 | GO:0030150 | protein import into mitochondrial matrix(GO:0030150) |
| 0.0 | 0.2 | GO:2000353 | positive regulation of endothelial cell apoptotic process(GO:2000353) |
| 0.0 | 1.5 | GO:0097192 | signal transduction in absence of ligand(GO:0038034) extrinsic apoptotic signaling pathway in absence of ligand(GO:0097192) |
| 0.0 | 1.1 | GO:0035019 | somatic stem cell population maintenance(GO:0035019) |
| 0.0 | 2.2 | GO:0007286 | spermatid development(GO:0007286) |
| 0.0 | 0.3 | GO:0030252 | growth hormone secretion(GO:0030252) |
| 0.0 | 0.1 | GO:0010133 | proline catabolic process to glutamate(GO:0010133) |
| 0.0 | 0.8 | GO:1904893 | negative regulation of JAK-STAT cascade(GO:0046426) negative regulation of STAT cascade(GO:1904893) |
| 0.0 | 0.5 | GO:0007368 | determination of left/right symmetry(GO:0007368) |
| 0.0 | 2.5 | GO:0030308 | negative regulation of cell growth(GO:0030308) |
| 0.0 | 0.3 | GO:0030728 | ovulation(GO:0030728) |
| 0.0 | 2.6 | GO:0006664 | glycolipid metabolic process(GO:0006664) liposaccharide metabolic process(GO:1903509) |
| 0.0 | 0.4 | GO:0000466 | maturation of 5.8S rRNA from tricistronic rRNA transcript (SSU-rRNA, 5.8S rRNA, LSU-rRNA)(GO:0000466) |
| 0.0 | 2.6 | GO:0043401 | steroid hormone mediated signaling pathway(GO:0043401) |
| 0.0 | 0.8 | GO:0050911 | detection of chemical stimulus involved in sensory perception of smell(GO:0050911) |
| 0.0 | 0.9 | GO:0000381 | regulation of alternative mRNA splicing, via spliceosome(GO:0000381) |
| 0.0 | 1.6 | GO:0018105 | peptidyl-serine phosphorylation(GO:0018105) |
| 0.0 | 0.1 | GO:0043922 | negative regulation by host of viral transcription(GO:0043922) |
| 0.0 | 0.2 | GO:0033189 | response to vitamin A(GO:0033189) |
| 0.0 | 0.2 | GO:0033141 | positive regulation of peptidyl-serine phosphorylation of STAT protein(GO:0033141) |
| 0.0 | 1.6 | GO:0007601 | visual perception(GO:0007601) sensory perception of light stimulus(GO:0050953) |
| 0.0 | 1.0 | GO:0006892 | post-Golgi vesicle-mediated transport(GO:0006892) |
Gene overrepresentation in cellular_component category:
| Log-likelihood per target | Total log-likelihood | Term | Description |
|---|---|---|---|
| 5.8 | 81.3 | GO:0005589 | collagen type VI trimer(GO:0005589) collagen beaded filament(GO:0098647) |
| 2.1 | 6.2 | GO:0005607 | laminin-2 complex(GO:0005607) |
| 1.5 | 24.1 | GO:0097512 | cardiac myofibril(GO:0097512) |
| 1.2 | 9.4 | GO:0005587 | collagen type IV trimer(GO:0005587) |
| 1.1 | 12.4 | GO:0033018 | sarcoplasmic reticulum lumen(GO:0033018) |
| 1.0 | 11.7 | GO:0044300 | cerebellar mossy fiber(GO:0044300) |
| 0.8 | 4.1 | GO:0005602 | complement component C1 complex(GO:0005602) |
| 0.7 | 3.0 | GO:0000333 | telomerase catalytic core complex(GO:0000333) |
| 0.7 | 9.6 | GO:0005577 | fibrinogen complex(GO:0005577) |
| 0.6 | 6.6 | GO:0002116 | semaphorin receptor complex(GO:0002116) sorting endosome(GO:0097443) |
| 0.6 | 8.7 | GO:0030478 | actin cap(GO:0030478) |
| 0.5 | 2.0 | GO:0005896 | interleukin-6 receptor complex(GO:0005896) |
| 0.4 | 4.3 | GO:0042587 | glycogen granule(GO:0042587) |
| 0.4 | 3.0 | GO:0097504 | Gemini of coiled bodies(GO:0097504) |
| 0.4 | 4.7 | GO:1990712 | HFE-transferrin receptor complex(GO:1990712) |
| 0.4 | 3.5 | GO:0070776 | H3 histone acetyltransferase complex(GO:0070775) MOZ/MORF histone acetyltransferase complex(GO:0070776) |
| 0.3 | 1.8 | GO:0032280 | symmetric synapse(GO:0032280) |
| 0.3 | 7.2 | GO:0032982 | myosin filament(GO:0032982) |
| 0.3 | 6.6 | GO:0031231 | integral component of peroxisomal membrane(GO:0005779) intrinsic component of peroxisomal membrane(GO:0031231) |
| 0.2 | 3.9 | GO:0042622 | photoreceptor outer segment membrane(GO:0042622) |
| 0.2 | 6.3 | GO:0012506 | vesicle membrane(GO:0012506) cytoplasmic vesicle membrane(GO:0030659) |
| 0.2 | 2.4 | GO:0042788 | polysomal ribosome(GO:0042788) |
| 0.2 | 1.6 | GO:0016012 | sarcoglycan complex(GO:0016012) |
| 0.2 | 6.3 | GO:0090568 | nuclear transcriptional repressor complex(GO:0090568) |
| 0.2 | 10.6 | GO:0031907 | peroxisomal matrix(GO:0005782) microbody lumen(GO:0031907) |
| 0.2 | 4.2 | GO:0097440 | apical dendrite(GO:0097440) |
| 0.2 | 2.1 | GO:0097550 | transcriptional preinitiation complex(GO:0097550) |
| 0.2 | 7.2 | GO:0030173 | integral component of Golgi membrane(GO:0030173) |
| 0.2 | 6.2 | GO:0031527 | filopodium membrane(GO:0031527) |
| 0.2 | 1.9 | GO:0045180 | basal cortex(GO:0045180) |
| 0.2 | 2.0 | GO:0043190 | ATP-binding cassette (ABC) transporter complex(GO:0043190) |
| 0.1 | 0.8 | GO:0032541 | cortical endoplasmic reticulum(GO:0032541) |
| 0.1 | 7.0 | GO:0000786 | nucleosome(GO:0000786) |
| 0.1 | 2.3 | GO:0031588 | nucleotide-activated protein kinase complex(GO:0031588) |
| 0.1 | 1.6 | GO:0043083 | synaptic cleft(GO:0043083) |
| 0.1 | 17.7 | GO:0001650 | fibrillar center(GO:0001650) |
| 0.1 | 0.3 | GO:0036396 | MIS complex(GO:0036396) mRNA editing complex(GO:0045293) |
| 0.1 | 1.5 | GO:0090543 | Flemming body(GO:0090543) |
| 0.1 | 1.1 | GO:0043235 | receptor complex(GO:0043235) |
| 0.1 | 9.0 | GO:0005811 | lipid particle(GO:0005811) |
| 0.1 | 3.7 | GO:0044439 | peroxisomal membrane(GO:0005778) microbody membrane(GO:0031903) microbody part(GO:0044438) peroxisomal part(GO:0044439) |
| 0.1 | 4.3 | GO:0008305 | integrin complex(GO:0008305) |
| 0.1 | 1.7 | GO:0005922 | connexon complex(GO:0005922) |
| 0.1 | 1.1 | GO:0031906 | late endosome lumen(GO:0031906) |
| 0.1 | 1.6 | GO:0016010 | dystrophin-associated glycoprotein complex(GO:0016010) glycoprotein complex(GO:0090665) |
| 0.1 | 3.7 | GO:0005865 | striated muscle thin filament(GO:0005865) myofilament(GO:0036379) |
| 0.1 | 6.5 | GO:0035580 | specific granule lumen(GO:0035580) |
| 0.1 | 1.5 | GO:0042613 | MHC class II protein complex(GO:0042613) |
| 0.1 | 0.5 | GO:0036057 | filtration diaphragm(GO:0036056) slit diaphragm(GO:0036057) |
| 0.1 | 1.8 | GO:0030057 | desmosome(GO:0030057) |
| 0.1 | 7.5 | GO:0034705 | voltage-gated potassium channel complex(GO:0008076) potassium channel complex(GO:0034705) |
| 0.1 | 1.6 | GO:0008074 | guanylate cyclase complex, soluble(GO:0008074) |
| 0.1 | 8.9 | GO:0072562 | blood microparticle(GO:0072562) |
| 0.1 | 0.5 | GO:0071204 | histone pre-mRNA 3'end processing complex(GO:0071204) |
| 0.1 | 6.9 | GO:0005913 | cell-cell adherens junction(GO:0005913) |
| 0.1 | 1.0 | GO:0012510 | trans-Golgi network transport vesicle membrane(GO:0012510) |
| 0.1 | 5.1 | GO:0001669 | acrosomal vesicle(GO:0001669) |
| 0.1 | 1.5 | GO:0031092 | platelet alpha granule membrane(GO:0031092) |
| 0.1 | 3.3 | GO:0000151 | ubiquitin ligase complex(GO:0000151) |
| 0.0 | 0.3 | GO:0005742 | mitochondrial outer membrane translocase complex(GO:0005742) |
| 0.0 | 9.5 | GO:0000775 | chromosome, centromeric region(GO:0000775) |
| 0.0 | 3.2 | GO:0060170 | ciliary membrane(GO:0060170) |
| 0.0 | 0.7 | GO:0031307 | integral component of mitochondrial outer membrane(GO:0031307) |
| 0.0 | 7.8 | GO:0030426 | growth cone(GO:0030426) |
| 0.0 | 1.7 | GO:0016459 | myosin complex(GO:0016459) |
| 0.0 | 2.3 | GO:1990391 | DNA repair complex(GO:1990391) |
| 0.0 | 0.8 | GO:0032809 | neuronal cell body membrane(GO:0032809) cell body membrane(GO:0044298) |
| 0.0 | 7.1 | GO:0019897 | extrinsic component of plasma membrane(GO:0019897) |
| 0.0 | 2.7 | GO:0030864 | cortical actin cytoskeleton(GO:0030864) |
| 0.0 | 6.9 | GO:0090575 | RNA polymerase II transcription factor complex(GO:0090575) |
| 0.0 | 21.9 | GO:0031012 | extracellular matrix(GO:0031012) |
| 0.0 | 1.8 | GO:0016324 | apical plasma membrane(GO:0016324) |
| 0.0 | 3.6 | GO:0005814 | centriole(GO:0005814) |
| 0.0 | 5.3 | GO:0030027 | lamellipodium(GO:0030027) |
| 0.0 | 1.5 | GO:0045171 | intercellular bridge(GO:0045171) |
| 0.0 | 1.2 | GO:0045095 | keratin filament(GO:0045095) |
| 0.0 | 0.8 | GO:0070971 | endoplasmic reticulum exit site(GO:0070971) |
| 0.0 | 2.5 | GO:0033116 | endoplasmic reticulum-Golgi intermediate compartment membrane(GO:0033116) |
| 0.0 | 1.8 | GO:0005802 | trans-Golgi network(GO:0005802) |
| 0.0 | 0.6 | GO:0001917 | photoreceptor inner segment(GO:0001917) |
| 0.0 | 1.5 | GO:0017053 | transcriptional repressor complex(GO:0017053) |
| 0.0 | 0.8 | GO:0001772 | immunological synapse(GO:0001772) |
| 0.0 | 5.5 | GO:0005667 | transcription factor complex(GO:0005667) |
| 0.0 | 1.6 | GO:0032588 | trans-Golgi network membrane(GO:0032588) |
| 0.0 | 3.9 | GO:0005788 | endoplasmic reticulum lumen(GO:0005788) |
| 0.0 | 0.4 | GO:0032040 | small-subunit processome(GO:0032040) |
| 0.0 | 5.6 | GO:0005783 | endoplasmic reticulum(GO:0005783) |
| 0.0 | 1.5 | GO:0016605 | PML body(GO:0016605) |
| 0.0 | 4.4 | GO:0005925 | focal adhesion(GO:0005925) |
| 0.0 | 1.4 | GO:0001726 | ruffle(GO:0001726) |
| 0.0 | 0.4 | GO:0000407 | pre-autophagosomal structure(GO:0000407) |
| 0.0 | 0.3 | GO:0001750 | photoreceptor outer segment(GO:0001750) |
| 0.0 | 0.3 | GO:0016363 | nuclear matrix(GO:0016363) |
Gene overrepresentation in molecular_function category:
| Log-likelihood per target | Total log-likelihood | Term | Description |
|---|---|---|---|
| 5.4 | 5.4 | GO:0004311 | farnesyltranstransferase activity(GO:0004311) |
| 3.2 | 9.6 | GO:0070052 | collagen V binding(GO:0070052) |
| 2.1 | 10.7 | GO:0016402 | pristanoyl-CoA oxidase activity(GO:0016402) |
| 1.9 | 9.6 | GO:0015193 | L-proline transmembrane transporter activity(GO:0015193) |
| 1.5 | 6.1 | GO:0004740 | pyruvate dehydrogenase (acetyl-transferring) kinase activity(GO:0004740) |
| 1.4 | 4.3 | GO:0034714 | type III transforming growth factor beta receptor binding(GO:0034714) |
| 1.3 | 10.1 | GO:0030023 | extracellular matrix constituent conferring elasticity(GO:0030023) |
| 1.2 | 82.8 | GO:0050840 | extracellular matrix binding(GO:0050840) |
| 1.1 | 3.2 | GO:0070643 | vitamin D3 25-hydroxylase activity(GO:0030343) vitamin D 25-hydroxylase activity(GO:0070643) |
| 1.0 | 5.0 | GO:0008073 | ornithine decarboxylase inhibitor activity(GO:0008073) |
| 0.9 | 5.6 | GO:0019531 | oxalate transmembrane transporter activity(GO:0019531) |
| 0.9 | 5.1 | GO:0039552 | RIG-I binding(GO:0039552) |
| 0.8 | 3.4 | GO:0018685 | alkane 1-monooxygenase activity(GO:0018685) |
| 0.8 | 1.7 | GO:0030172 | troponin C binding(GO:0030172) |
| 0.8 | 7.2 | GO:0005025 | transforming growth factor beta receptor activity, type I(GO:0005025) |
| 0.8 | 2.3 | GO:0003846 | 2-acylglycerol O-acyltransferase activity(GO:0003846) |
| 0.7 | 8.2 | GO:0017128 | phospholipid scramblase activity(GO:0017128) |
| 0.7 | 6.6 | GO:0038085 | vascular endothelial growth factor binding(GO:0038085) |
| 0.7 | 3.5 | GO:0004910 | interleukin-1, Type II, blocking receptor activity(GO:0004910) |
| 0.7 | 20.7 | GO:0005212 | structural constituent of eye lens(GO:0005212) |
| 0.7 | 2.0 | GO:0015439 | heme-transporting ATPase activity(GO:0015439) |
| 0.6 | 7.4 | GO:0001871 | pattern binding(GO:0001871) polysaccharide binding(GO:0030247) |
| 0.6 | 6.5 | GO:0051525 | NFAT protein binding(GO:0051525) |
| 0.6 | 2.3 | GO:0005222 | intracellular cAMP activated cation channel activity(GO:0005222) |
| 0.5 | 2.5 | GO:0031708 | endothelin B receptor binding(GO:0031708) |
| 0.5 | 1.5 | GO:0010861 | thyroid hormone receptor activator activity(GO:0010861) thyroid hormone receptor coactivator activity(GO:0030375) |
| 0.5 | 4.7 | GO:0070324 | thyroid hormone binding(GO:0070324) |
| 0.5 | 5.7 | GO:0004300 | enoyl-CoA hydratase activity(GO:0004300) |
| 0.5 | 2.3 | GO:0004815 | aspartate-tRNA ligase activity(GO:0004815) |
| 0.5 | 1.9 | GO:0004706 | JUN kinase kinase kinase activity(GO:0004706) |
| 0.4 | 18.4 | GO:0001972 | retinoic acid binding(GO:0001972) |
| 0.4 | 2.7 | GO:0038049 | transcription factor activity, ligand-activated RNA polymerase II transcription factor binding(GO:0038049) |
| 0.4 | 3.1 | GO:0005324 | long-chain fatty acid transporter activity(GO:0005324) |
| 0.4 | 6.3 | GO:0017151 | DEAD/H-box RNA helicase binding(GO:0017151) |
| 0.4 | 2.3 | GO:0004677 | DNA-dependent protein kinase activity(GO:0004677) |
| 0.4 | 4.4 | GO:0050693 | LBD domain binding(GO:0050693) |
| 0.4 | 1.5 | GO:0031871 | proteinase activated receptor binding(GO:0031871) |
| 0.4 | 0.7 | GO:0005319 | lipid transporter activity(GO:0005319) |
| 0.4 | 3.9 | GO:0008020 | G-protein coupled photoreceptor activity(GO:0008020) |
| 0.3 | 1.0 | GO:0070576 | vitamin D 24-hydroxylase activity(GO:0070576) |
| 0.3 | 3.8 | GO:0005078 | MAP-kinase scaffold activity(GO:0005078) |
| 0.3 | 6.3 | GO:0031005 | filamin binding(GO:0031005) |
| 0.3 | 7.8 | GO:0098641 | cadherin binding involved in cell-cell adhesion(GO:0098641) |
| 0.3 | 8.7 | GO:0005523 | tropomyosin binding(GO:0005523) |
| 0.3 | 1.7 | GO:0016802 | adenosylhomocysteinase activity(GO:0004013) trialkylsulfonium hydrolase activity(GO:0016802) |
| 0.3 | 1.9 | GO:0031726 | CCR1 chemokine receptor binding(GO:0031726) |
| 0.3 | 2.7 | GO:0004791 | thioredoxin-disulfide reductase activity(GO:0004791) |
| 0.3 | 2.9 | GO:0004571 | mannosyl-oligosaccharide 1,2-alpha-mannosidase activity(GO:0004571) |
| 0.3 | 2.1 | GO:0038052 | RNA polymerase II transcription factor activity, estrogen-activated sequence-specific DNA binding(GO:0038052) |
| 0.3 | 1.8 | GO:0001515 | opioid peptide activity(GO:0001515) |
| 0.3 | 4.1 | GO:0032052 | bile acid binding(GO:0032052) |
| 0.3 | 2.0 | GO:0005138 | interleukin-6 receptor binding(GO:0005138) |
| 0.2 | 1.2 | GO:0046592 | polyamine oxidase activity(GO:0046592) spermine:oxygen oxidoreductase (spermidine-forming) activity(GO:0052901) |
| 0.2 | 3.4 | GO:0036374 | glutathione hydrolase activity(GO:0036374) |
| 0.2 | 5.3 | GO:0030898 | actin-dependent ATPase activity(GO:0030898) |
| 0.2 | 2.3 | GO:0008607 | phosphorylase kinase regulator activity(GO:0008607) |
| 0.2 | 1.6 | GO:0071553 | uridine nucleotide receptor activity(GO:0015065) G-protein coupled pyrimidinergic nucleotide receptor activity(GO:0071553) |
| 0.2 | 1.5 | GO:0051575 | 5'-deoxyribose-5-phosphate lyase activity(GO:0051575) |
| 0.2 | 3.7 | GO:0102391 | decanoate--CoA ligase activity(GO:0102391) |
| 0.2 | 0.8 | GO:0042954 | lipoprotein transporter activity(GO:0042954) |
| 0.2 | 0.6 | GO:0003829 | beta-1,3-galactosyl-O-glycosyl-glycoprotein beta-1,6-N-acetylglucosaminyltransferase activity(GO:0003829) |
| 0.2 | 3.8 | GO:0005041 | low-density lipoprotein receptor activity(GO:0005041) |
| 0.2 | 9.0 | GO:0005504 | fatty acid binding(GO:0005504) |
| 0.2 | 0.9 | GO:0004995 | tachykinin receptor activity(GO:0004995) |
| 0.2 | 2.6 | GO:0035612 | AP-2 adaptor complex binding(GO:0035612) |
| 0.2 | 4.8 | GO:0070840 | dynein complex binding(GO:0070840) |
| 0.2 | 16.4 | GO:0005089 | Rho guanyl-nucleotide exchange factor activity(GO:0005089) |
| 0.2 | 2.1 | GO:0042834 | peptidoglycan binding(GO:0042834) |
| 0.2 | 0.8 | GO:0070097 | delta-catenin binding(GO:0070097) |
| 0.2 | 3.8 | GO:0051393 | alpha-actinin binding(GO:0051393) |
| 0.2 | 0.8 | GO:0005499 | vitamin D binding(GO:0005499) |
| 0.2 | 34.7 | GO:0051015 | actin filament binding(GO:0051015) |
| 0.1 | 1.1 | GO:0003810 | protein-glutamine gamma-glutamyltransferase activity(GO:0003810) |
| 0.1 | 3.1 | GO:0005247 | voltage-gated chloride channel activity(GO:0005247) |
| 0.1 | 4.2 | GO:0005520 | insulin-like growth factor binding(GO:0005520) |
| 0.1 | 6.7 | GO:0030544 | Hsp70 protein binding(GO:0030544) |
| 0.1 | 10.9 | GO:0003707 | steroid hormone receptor activity(GO:0003707) |
| 0.1 | 2.7 | GO:0005251 | delayed rectifier potassium channel activity(GO:0005251) |
| 0.1 | 1.1 | GO:0005143 | interleukin-12 receptor binding(GO:0005143) |
| 0.1 | 2.5 | GO:0046527 | glucosyltransferase activity(GO:0046527) |
| 0.1 | 4.7 | GO:0001106 | RNA polymerase II transcription corepressor activity(GO:0001106) |
| 0.1 | 8.8 | GO:0004402 | histone acetyltransferase activity(GO:0004402) |
| 0.1 | 0.6 | GO:0008479 | queuine tRNA-ribosyltransferase activity(GO:0008479) |
| 0.1 | 1.7 | GO:0005243 | gap junction channel activity(GO:0005243) |
| 0.1 | 17.6 | GO:0001078 | transcriptional repressor activity, RNA polymerase II core promoter proximal region sequence-specific binding(GO:0001078) |
| 0.1 | 0.8 | GO:0005104 | fibroblast growth factor receptor binding(GO:0005104) |
| 0.1 | 19.2 | GO:0044325 | ion channel binding(GO:0044325) |
| 0.1 | 1.5 | GO:0032395 | MHC class II receptor activity(GO:0032395) |
| 0.1 | 0.3 | GO:0033300 | dehydroascorbic acid transporter activity(GO:0033300) |
| 0.1 | 4.1 | GO:0001205 | transcriptional activator activity, RNA polymerase II distal enhancer sequence-specific binding(GO:0001205) |
| 0.1 | 3.0 | GO:0070034 | telomerase RNA binding(GO:0070034) |
| 0.1 | 2.9 | GO:0008143 | poly(A) binding(GO:0008143) |
| 0.1 | 2.1 | GO:1990841 | promoter-specific chromatin binding(GO:1990841) |
| 0.1 | 2.0 | GO:0008191 | metalloendopeptidase inhibitor activity(GO:0008191) |
| 0.1 | 3.6 | GO:0043531 | ADP binding(GO:0043531) |
| 0.1 | 1.1 | GO:0030215 | semaphorin receptor binding(GO:0030215) |
| 0.1 | 3.6 | GO:0030374 | ligand-dependent nuclear receptor transcription coactivator activity(GO:0030374) |
| 0.1 | 16.3 | GO:0003714 | transcription corepressor activity(GO:0003714) |
| 0.1 | 6.9 | GO:0001227 | transcriptional repressor activity, RNA polymerase II transcription regulatory region sequence-specific binding(GO:0001227) |
| 0.1 | 0.3 | GO:0001594 | trace-amine receptor activity(GO:0001594) |
| 0.1 | 0.5 | GO:0016713 | oxidoreductase activity, acting on paired donors, with incorporation or reduction of molecular oxygen, reduced iron-sulfur protein as one donor, and incorporation of one atom of oxygen(GO:0016713) |
| 0.1 | 3.7 | GO:0004520 | endodeoxyribonuclease activity(GO:0004520) |
| 0.1 | 28.9 | GO:0001228 | transcriptional activator activity, RNA polymerase II transcription regulatory region sequence-specific binding(GO:0001228) |
| 0.1 | 1.6 | GO:0004383 | guanylate cyclase activity(GO:0004383) |
| 0.1 | 2.0 | GO:0005031 | tumor necrosis factor-activated receptor activity(GO:0005031) death receptor activity(GO:0005035) |
| 0.1 | 1.1 | GO:0008349 | MAP kinase kinase kinase kinase activity(GO:0008349) |
| 0.1 | 0.7 | GO:0089720 | caspase binding(GO:0089720) |
| 0.1 | 1.1 | GO:0019864 | IgG binding(GO:0019864) |
| 0.1 | 0.9 | GO:0017017 | MAP kinase tyrosine/serine/threonine phosphatase activity(GO:0017017) |
| 0.1 | 0.2 | GO:0005174 | CD40 receptor binding(GO:0005174) |
| 0.1 | 1.8 | GO:0051019 | mitogen-activated protein kinase binding(GO:0051019) |
| 0.1 | 10.8 | GO:0008083 | growth factor activity(GO:0008083) |
| 0.1 | 3.5 | GO:0030971 | receptor tyrosine kinase binding(GO:0030971) |
| 0.0 | 1.8 | GO:0015347 | sodium-independent organic anion transmembrane transporter activity(GO:0015347) |
| 0.0 | 0.3 | GO:0015288 | porin activity(GO:0015288) |
| 0.0 | 1.8 | GO:0050699 | WW domain binding(GO:0050699) |
| 0.0 | 0.3 | GO:0004977 | melanocortin receptor activity(GO:0004977) |
| 0.0 | 1.3 | GO:0004181 | metallocarboxypeptidase activity(GO:0004181) |
| 0.0 | 3.7 | GO:0003730 | mRNA 3'-UTR binding(GO:0003730) |
| 0.0 | 2.8 | GO:0004004 | ATP-dependent RNA helicase activity(GO:0004004) |
| 0.0 | 0.8 | GO:0005158 | insulin receptor binding(GO:0005158) |
| 0.0 | 0.4 | GO:0009931 | calcium-dependent protein serine/threonine kinase activity(GO:0009931) |
| 0.0 | 0.8 | GO:0051010 | microtubule plus-end binding(GO:0051010) |
| 0.0 | 3.7 | GO:0035591 | signaling adaptor activity(GO:0035591) |
| 0.0 | 2.2 | GO:0005249 | voltage-gated potassium channel activity(GO:0005249) |
| 0.0 | 3.9 | GO:0030674 | protein binding, bridging(GO:0030674) |
| 0.0 | 2.2 | GO:0004712 | protein serine/threonine/tyrosine kinase activity(GO:0004712) |
| 0.0 | 0.1 | GO:0004657 | proline dehydrogenase activity(GO:0004657) |
| 0.0 | 4.5 | GO:0000981 | RNA polymerase II transcription factor activity, sequence-specific DNA binding(GO:0000981) |
| 0.0 | 3.3 | GO:0004222 | metalloendopeptidase activity(GO:0004222) |
| 0.0 | 3.9 | GO:0005506 | iron ion binding(GO:0005506) |
| 0.0 | 0.4 | GO:0015269 | calcium-activated potassium channel activity(GO:0015269) |
| 0.0 | 8.4 | GO:0046982 | protein heterodimerization activity(GO:0046982) |
| 0.0 | 0.1 | GO:0008109 | N-acetyllactosaminide beta-1,6-N-acetylglucosaminyltransferase activity(GO:0008109) |
| 0.0 | 1.7 | GO:0005201 | extracellular matrix structural constituent(GO:0005201) |
| 0.0 | 1.3 | GO:0008146 | sulfotransferase activity(GO:0008146) |
| 0.0 | 0.3 | GO:0005024 | transforming growth factor beta-activated receptor activity(GO:0005024) |
| 0.0 | 0.8 | GO:0004984 | olfactory receptor activity(GO:0004984) |
| 0.0 | 1.5 | GO:0003774 | motor activity(GO:0003774) |
| 0.0 | 0.3 | GO:0030371 | translation repressor activity(GO:0030371) |
| 0.0 | 0.2 | GO:0005132 | type I interferon receptor binding(GO:0005132) |
| 0.0 | 2.5 | GO:0000287 | magnesium ion binding(GO:0000287) |
| 0.0 | 0.3 | GO:0004623 | phospholipase A2 activity(GO:0004623) |
| 0.0 | 0.7 | GO:0031072 | heat shock protein binding(GO:0031072) |
| 0.0 | 0.9 | GO:0005179 | hormone activity(GO:0005179) |
Gene overrepresentation in C2:CP category:
| Log-likelihood per target | Total log-likelihood | Term | Description |
|---|---|---|---|
| 1.5 | 81.9 | NABA PROTEOGLYCANS | Genes encoding proteoglycans |
| 0.4 | 8.2 | PID VEGF VEGFR PATHWAY | VEGF and VEGFR signaling network |
| 0.3 | 25.3 | PID HNF3A PATHWAY | FOXA1 transcription factor network |
| 0.3 | 22.0 | PID INTEGRIN3 PATHWAY | Beta3 integrin cell surface interactions |
| 0.3 | 8.5 | PID WNT SIGNALING PATHWAY | Wnt signaling network |
| 0.2 | 6.2 | PID ANTHRAX PATHWAY | Cellular roles of Anthrax toxin |
| 0.2 | 8.5 | ST MYOCYTE AD PATHWAY | Myocyte Adrenergic Pathway is a specific case of the generalized Adrenergic Pathway. |
| 0.2 | 9.3 | ST TUMOR NECROSIS FACTOR PATHWAY | Tumor Necrosis Factor Pathway. |
| 0.2 | 4.2 | PID BETA CATENIN DEG PATHWAY | Degradation of beta catenin |
| 0.2 | 11.3 | SIG CHEMOTAXIS | Genes related to chemotaxis |
| 0.2 | 1.6 | PID AVB3 INTEGRIN PATHWAY | Integrins in angiogenesis |
| 0.2 | 1.8 | PID WNT NONCANONICAL PATHWAY | Noncanonical Wnt signaling pathway |
| 0.1 | 5.7 | PID ALK1 PATHWAY | ALK1 signaling events |
| 0.1 | 2.8 | ST PHOSPHOINOSITIDE 3 KINASE PATHWAY | PI3K Pathway |
| 0.1 | 15.9 | PID AP1 PATHWAY | AP-1 transcription factor network |
| 0.1 | 3.5 | PID AMB2 NEUTROPHILS PATHWAY | amb2 Integrin signaling |
| 0.1 | 2.4 | PID ERB GENOMIC PATHWAY | Validated nuclear estrogen receptor beta network |
| 0.1 | 2.3 | PID LPA4 PATHWAY | LPA4-mediated signaling events |
| 0.1 | 22.4 | PID PDGFRB PATHWAY | PDGFR-beta signaling pathway |
| 0.1 | 5.6 | PID HES HEY PATHWAY | Notch-mediated HES/HEY network |
| 0.1 | 4.3 | PID INTEGRIN CS PATHWAY | Integrin family cell surface interactions |
| 0.1 | 3.4 | PID GLYPICAN 1PATHWAY | Glypican 1 network |
| 0.1 | 4.7 | PID BMP PATHWAY | BMP receptor signaling |
| 0.1 | 2.5 | PID P38 MKK3 6PATHWAY | p38 MAPK signaling pathway |
| 0.1 | 3.7 | PID P38 ALPHA BETA DOWNSTREAM PATHWAY | Signaling mediated by p38-alpha and p38-beta |
| 0.1 | 1.5 | PID DNA PK PATHWAY | DNA-PK pathway in nonhomologous end joining |
| 0.1 | 2.6 | PID RXR VDR PATHWAY | RXR and RAR heterodimerization with other nuclear receptor |
| 0.1 | 1.1 | PID IL27 PATHWAY | IL27-mediated signaling events |
| 0.1 | 1.2 | PID INTEGRIN A9B1 PATHWAY | Alpha9 beta1 integrin signaling events |
| 0.1 | 5.4 | PID SMAD2 3NUCLEAR PATHWAY | Regulation of nuclear SMAD2/3 signaling |
| 0.0 | 15.0 | NABA SECRETED FACTORS | Genes encoding secreted soluble factors |
| 0.0 | 1.9 | PID LKB1 PATHWAY | LKB1 signaling events |
| 0.0 | 1.8 | PID CDC42 REG PATHWAY | Regulation of CDC42 activity |
| 0.0 | 0.8 | PID RET PATHWAY | Signaling events regulated by Ret tyrosine kinase |
| 0.0 | 5.2 | NABA ECM AFFILIATED | Genes encoding proteins affiliated structurally or functionally to extracellular matrix proteins |
| 0.0 | 1.2 | PID ARF6 TRAFFICKING PATHWAY | Arf6 trafficking events |
| 0.0 | 0.8 | PID IL12 STAT4 PATHWAY | IL12 signaling mediated by STAT4 |
| 0.0 | 1.7 | PID BETA CATENIN NUC PATHWAY | Regulation of nuclear beta catenin signaling and target gene transcription |
| 0.0 | 0.8 | PID CD8 TCR PATHWAY | TCR signaling in naïve CD8+ T cells |
| 0.0 | 0.6 | PID ENDOTHELIN PATHWAY | Endothelins |
| 0.0 | 0.5 | PID PTP1B PATHWAY | Signaling events mediated by PTP1B |
| 0.0 | 2.2 | NABA ECM GLYCOPROTEINS | Genes encoding structural ECM glycoproteins |
Gene overrepresentation in C2:CP:REACTOME category:
| Log-likelihood per target | Total log-likelihood | Term | Description |
|---|---|---|---|
| 3.0 | 81.3 | REACTOME CS DS DEGRADATION | Genes involved in CS/DS degradation |
| 0.4 | 5.4 | REACTOME EGFR DOWNREGULATION | Genes involved in EGFR downregulation |
| 0.4 | 9.6 | REACTOME NA CL DEPENDENT NEUROTRANSMITTER TRANSPORTERS | Genes involved in Na+/Cl- dependent neurotransmitter transporters |
| 0.4 | 8.2 | REACTOME VEGF LIGAND RECEPTOR INTERACTIONS | Genes involved in VEGF ligand-receptor interactions |
| 0.4 | 4.1 | REACTOME CREATION OF C4 AND C2 ACTIVATORS | Genes involved in Creation of C4 and C2 activators |
| 0.4 | 11.7 | REACTOME RNA POL III TRANSCRIPTION TERMINATION | Genes involved in RNA Polymerase III Transcription Termination |
| 0.4 | 6.1 | REACTOME REGULATION OF PYRUVATE DEHYDROGENASE PDH COMPLEX | Genes involved in Regulation of pyruvate dehydrogenase (PDH) complex |
| 0.4 | 3.9 | REACTOME OPSINS | Genes involved in Opsins |
| 0.3 | 32.0 | REACTOME TRANSCRIPTIONAL REGULATION OF WHITE ADIPOCYTE DIFFERENTIATION | Genes involved in Transcriptional Regulation of White Adipocyte Differentiation |
| 0.3 | 16.1 | REACTOME SMOOTH MUSCLE CONTRACTION | Genes involved in Smooth Muscle Contraction |
| 0.3 | 2.3 | REACTOME REGULATION OF THE FANCONI ANEMIA PATHWAY | Genes involved in Regulation of the Fanconi anemia pathway |
| 0.2 | 2.7 | REACTOME RECEPTOR LIGAND BINDING INITIATES THE SECOND PROTEOLYTIC CLEAVAGE OF NOTCH RECEPTOR | Genes involved in Receptor-ligand binding initiates the second proteolytic cleavage of Notch receptor |
| 0.2 | 5.5 | REACTOME ACTIVATION OF RAC | Genes involved in Activation of Rac |
| 0.2 | 3.9 | REACTOME XENOBIOTICS | Genes involved in Xenobiotics |
| 0.2 | 4.1 | REACTOME STEROID HORMONES | Genes involved in Steroid hormones |
| 0.2 | 25.2 | REACTOME INTEGRIN CELL SURFACE INTERACTIONS | Genes involved in Integrin cell surface interactions |
| 0.2 | 2.3 | REACTOME ADENYLATE CYCLASE ACTIVATING PATHWAY | Genes involved in Adenylate cyclase activating pathway |
| 0.2 | 0.7 | REACTOME NOTCH HLH TRANSCRIPTION PATHWAY | Genes involved in Notch-HLH transcription pathway |
| 0.2 | 3.2 | REACTOME SYNTHESIS SECRETION AND INACTIVATION OF GIP | Genes involved in Synthesis, Secretion, and Inactivation of Glucose-dependent Insulinotropic Polypeptide (GIP) |
| 0.2 | 3.4 | REACTOME YAP1 AND WWTR1 TAZ STIMULATED GENE EXPRESSION | Genes involved in YAP1- and WWTR1 (TAZ)-stimulated gene expression |
| 0.2 | 3.0 | REACTOME ALPHA LINOLENIC ACID ALA METABOLISM | Genes involved in alpha-linolenic acid (ALA) metabolism |
| 0.2 | 7.2 | REACTOME CYTOCHROME P450 ARRANGED BY SUBSTRATE TYPE | Genes involved in Cytochrome P450 - arranged by substrate type |
| 0.2 | 16.3 | REACTOME MITOTIC PROMETAPHASE | Genes involved in Mitotic Prometaphase |
| 0.1 | 3.8 | REACTOME CELL EXTRACELLULAR MATRIX INTERACTIONS | Genes involved in Cell-extracellular matrix interactions |
| 0.1 | 7.2 | REACTOME PACKAGING OF TELOMERE ENDS | Genes involved in Packaging Of Telomere Ends |
| 0.1 | 2.1 | REACTOME ACYL CHAIN REMODELLING OF PG | Genes involved in Acyl chain remodelling of PG |
| 0.1 | 3.7 | REACTOME PROLACTIN RECEPTOR SIGNALING | Genes involved in Prolactin receptor signaling |
| 0.1 | 2.0 | REACTOME IL 6 SIGNALING | Genes involved in Interleukin-6 signaling |
| 0.1 | 4.3 | REACTOME CREB PHOSPHORYLATION THROUGH THE ACTIVATION OF RAS | Genes involved in CREB phosphorylation through the activation of Ras |
| 0.1 | 4.7 | REACTOME SIGNALING BY BMP | Genes involved in Signaling by BMP |
| 0.1 | 2.3 | REACTOME REGULATION OF RHEB GTPASE ACTIVITY BY AMPK | Genes involved in Regulation of Rheb GTPase activity by AMPK |
| 0.1 | 2.3 | REACTOME MITOCHONDRIAL TRNA AMINOACYLATION | Genes involved in Mitochondrial tRNA aminoacylation |
| 0.1 | 1.3 | REACTOME COMMON PATHWAY | Genes involved in Common Pathway |
| 0.1 | 4.9 | REACTOME VOLTAGE GATED POTASSIUM CHANNELS | Genes involved in Voltage gated Potassium channels |
| 0.1 | 3.4 | REACTOME GLUTATHIONE CONJUGATION | Genes involved in Glutathione conjugation |
| 0.1 | 2.8 | REACTOME G0 AND EARLY G1 | Genes involved in G0 and Early G1 |
| 0.1 | 2.6 | REACTOME ACTIVATED TAK1 MEDIATES P38 MAPK ACTIVATION | Genes involved in activated TAK1 mediates p38 MAPK activation |
| 0.1 | 1.7 | REACTOME GAP JUNCTION ASSEMBLY | Genes involved in Gap junction assembly |
| 0.1 | 3.3 | REACTOME REGULATION OF BETA CELL DEVELOPMENT | Genes involved in Regulation of beta-cell development |
| 0.1 | 3.3 | REACTOME DEADENYLATION OF MRNA | Genes involved in Deadenylation of mRNA |
| 0.1 | 4.2 | REACTOME CIRCADIAN CLOCK | Genes involved in Circadian Clock |
| 0.1 | 1.5 | REACTOME SYNTHESIS OF VERY LONG CHAIN FATTY ACYL COAS | Genes involved in Synthesis of very long-chain fatty acyl-CoAs |
| 0.1 | 1.6 | REACTOME P2Y RECEPTORS | Genes involved in P2Y receptors |
| 0.1 | 0.4 | REACTOME SPRY REGULATION OF FGF SIGNALING | Genes involved in Spry regulation of FGF signaling |
| 0.1 | 5.8 | REACTOME INTERFERON ALPHA BETA SIGNALING | Genes involved in Interferon alpha/beta signaling |
| 0.1 | 0.8 | REACTOME ELEVATION OF CYTOSOLIC CA2 LEVELS | Genes involved in Elevation of cytosolic Ca2+ levels |
| 0.1 | 5.0 | REACTOME REGULATION OF ORNITHINE DECARBOXYLASE ODC | Genes involved in Regulation of ornithine decarboxylase (ODC) |
| 0.1 | 4.0 | REACTOME NUCLEAR RECEPTOR TRANSCRIPTION PATHWAY | Genes involved in Nuclear Receptor transcription pathway |
| 0.1 | 1.2 | REACTOME METABOLISM OF POLYAMINES | Genes involved in Metabolism of polyamines |
| 0.1 | 1.1 | REACTOME OTHER SEMAPHORIN INTERACTIONS | Genes involved in Other semaphorin interactions |
| 0.1 | 1.6 | REACTOME ADHERENS JUNCTIONS INTERACTIONS | Genes involved in Adherens junctions interactions |
| 0.0 | 0.9 | REACTOME CHYLOMICRON MEDIATED LIPID TRANSPORT | Genes involved in Chylomicron-mediated lipid transport |
| 0.0 | 2.6 | REACTOME TRANSPORT TO THE GOLGI AND SUBSEQUENT MODIFICATION | Genes involved in Transport to the Golgi and subsequent modification |
| 0.0 | 2.7 | REACTOME POTASSIUM CHANNELS | Genes involved in Potassium Channels |
| 0.0 | 1.2 | REACTOME GABA A RECEPTOR ACTIVATION | Genes involved in GABA A receptor activation |
| 0.0 | 0.5 | REACTOME NEF MEDIATED DOWNREGULATION OF MHC CLASS I COMPLEX CELL SURFACE EXPRESSION | Genes involved in Nef mediated downregulation of MHC class I complex cell surface expression |
| 0.0 | 1.4 | REACTOME SEMA4D INDUCED CELL MIGRATION AND GROWTH CONE COLLAPSE | Genes involved in Sema4D induced cell migration and growth-cone collapse |
| 0.0 | 1.7 | REACTOME MUSCLE CONTRACTION | Genes involved in Muscle contraction |
| 0.0 | 5.3 | REACTOME PEPTIDE LIGAND BINDING RECEPTORS | Genes involved in Peptide ligand-binding receptors |
| 0.0 | 0.5 | REACTOME TRANSPORT OF ORGANIC ANIONS | Genes involved in Transport of organic anions |
| 0.0 | 0.5 | REACTOME REGULATION OF COMPLEMENT CASCADE | Genes involved in Regulation of Complement cascade |
| 0.0 | 0.8 | REACTOME OLFACTORY SIGNALING PATHWAY | Genes involved in Olfactory Signaling Pathway |
| 0.0 | 0.3 | REACTOME FACILITATIVE NA INDEPENDENT GLUCOSE TRANSPORTERS | Genes involved in Facilitative Na+-independent glucose transporters |
| 0.0 | 0.5 | REACTOME CHONDROITIN SULFATE DERMATAN SULFATE METABOLISM | Genes involved in Chondroitin sulfate/dermatan sulfate metabolism |
| 0.0 | 0.4 | REACTOME GLUCAGON TYPE LIGAND RECEPTORS | Genes involved in Glucagon-type ligand receptors |
| 0.0 | 0.6 | REACTOME O LINKED GLYCOSYLATION OF MUCINS | Genes involved in O-linked glycosylation of mucins |
| 0.0 | 0.2 | REACTOME GLYCOPROTEIN HORMONES | Genes involved in Glycoprotein hormones |