Project
GNF SymAtlas + NCI-60 cancer cell lines, comparison of cancers vs non-cancers, human (Su, 2004; Ross, 2000)
Navigation
Downloads
Results for AACAGUC
Z-value: 0.36
Motif logo

miRNA associated with seed AACAGUC
| Name | miRBASE accession |
|---|---|
|
hsa-miR-132-3p
|
MIMAT0000426 |
|
hsa-miR-212-3p
|
MIMAT0000269 |
Activity profile of AACAGUC motif
Sorted Z-values of AACAGUC motif
Network of associatons between targets according to the STRING database.

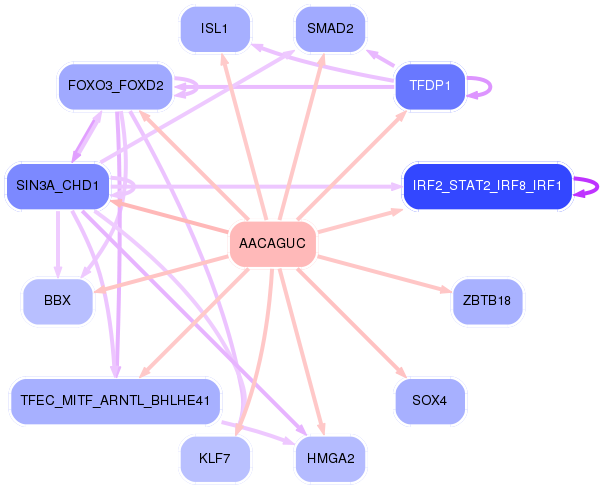
First level regulatory network of AACAGUC
Gene Ontology Analysis
Gene overrepresentation in biological_process category:
| Log-likelihood per target | Total log-likelihood | Term | Description |
|---|---|---|---|
| 1.5 | 4.4 | GO:0006597 | spermine biosynthetic process(GO:0006597) |
| 1.1 | 4.3 | GO:0033387 | putrescine biosynthetic process from ornithine(GO:0033387) |
| 1.0 | 4.0 | GO:0031064 | negative regulation of histone deacetylation(GO:0031064) |
| 0.9 | 3.6 | GO:1903984 | positive regulation of TRAIL-activated apoptotic signaling pathway(GO:1903984) |
| 0.9 | 3.6 | GO:0018076 | N-terminal peptidyl-lysine acetylation(GO:0018076) |
| 0.8 | 2.3 | GO:0001544 | initiation of primordial ovarian follicle growth(GO:0001544) |
| 0.6 | 4.0 | GO:0090204 | protein localization to nuclear pore(GO:0090204) |
| 0.5 | 2.0 | GO:0097368 | histone H4-K20 trimethylation(GO:0034773) establishment of Sertoli cell barrier(GO:0097368) |
| 0.5 | 3.4 | GO:0070934 | CRD-mediated mRNA stabilization(GO:0070934) |
| 0.5 | 2.3 | GO:0051534 | negative regulation of NFAT protein import into nucleus(GO:0051534) |
| 0.4 | 2.1 | GO:0035279 | mRNA cleavage involved in gene silencing by miRNA(GO:0035279) mRNA cleavage involved in gene silencing by siRNA(GO:0090625) mRNA cleavage involved in gene silencing(GO:0098795) |
| 0.4 | 1.2 | GO:2000685 | mesodermal-endodermal cell signaling(GO:0003131) programmed DNA elimination(GO:0031049) chromosome breakage(GO:0031052) histone H2A-S139 phosphorylation(GO:0035978) positive regulation of cellular response to X-ray(GO:2000685) |
| 0.4 | 1.2 | GO:1900224 | positive regulation of nodal signaling pathway involved in determination of lateral mesoderm left/right asymmetry(GO:1900224) |
| 0.4 | 2.6 | GO:0010606 | positive regulation of cytoplasmic mRNA processing body assembly(GO:0010606) |
| 0.4 | 1.5 | GO:0000255 | allantoin metabolic process(GO:0000255) |
| 0.4 | 1.1 | GO:1905205 | positive regulation of connective tissue replacement(GO:1905205) |
| 0.4 | 1.1 | GO:0003383 | apical constriction(GO:0003383) |
| 0.3 | 1.3 | GO:0044821 | meiotic telomere tethering at nuclear periphery(GO:0044821) meiotic attachment of telomere to nuclear envelope(GO:0070197) chromosome attachment to the nuclear envelope(GO:0097240) |
| 0.3 | 0.6 | GO:1900175 | regulation of nodal signaling pathway involved in determination of left/right asymmetry(GO:1900145) regulation of nodal signaling pathway involved in determination of lateral mesoderm left/right asymmetry(GO:1900175) |
| 0.3 | 6.1 | GO:0043923 | positive regulation by host of viral transcription(GO:0043923) |
| 0.3 | 1.1 | GO:0035616 | histone H2B conserved C-terminal lysine deubiquitination(GO:0035616) |
| 0.3 | 1.1 | GO:2000564 | CD8-positive, alpha-beta T cell proliferation(GO:0035740) regulation of CD8-positive, alpha-beta T cell proliferation(GO:2000564) |
| 0.3 | 0.8 | GO:0048936 | peripheral nervous system neuron axonogenesis(GO:0048936) |
| 0.3 | 1.3 | GO:0042091 | interleukin-10 biosynthetic process(GO:0042091) regulation of interleukin-10 biosynthetic process(GO:0045074) |
| 0.2 | 1.0 | GO:0010587 | miRNA catabolic process(GO:0010587) |
| 0.2 | 1.9 | GO:0021815 | modulation of microtubule cytoskeleton involved in cerebral cortex radial glia guided migration(GO:0021815) |
| 0.2 | 0.7 | GO:0018201 | N-terminal peptidyl-glycine N-myristoylation(GO:0018008) peptidyl-glycine modification(GO:0018201) |
| 0.2 | 1.6 | GO:0000710 | meiotic mismatch repair(GO:0000710) |
| 0.2 | 1.4 | GO:0051549 | positive regulation of keratinocyte migration(GO:0051549) |
| 0.2 | 1.9 | GO:0045039 | protein import into mitochondrial inner membrane(GO:0045039) |
| 0.2 | 0.6 | GO:0016260 | selenocysteine biosynthetic process(GO:0016260) |
| 0.2 | 2.1 | GO:0035562 | negative regulation of chromatin binding(GO:0035562) |
| 0.2 | 0.6 | GO:0044828 | negative regulation by host of viral genome replication(GO:0044828) |
| 0.2 | 1.0 | GO:0003408 | optic cup formation involved in camera-type eye development(GO:0003408) |
| 0.2 | 0.8 | GO:1904693 | midbrain morphogenesis(GO:1904693) |
| 0.2 | 1.7 | GO:0070345 | negative regulation of fat cell proliferation(GO:0070345) |
| 0.2 | 0.2 | GO:0007068 | negative regulation of transcription during mitosis(GO:0007068) negative regulation of transcription from RNA polymerase II promoter during mitosis(GO:0007070) |
| 0.2 | 2.7 | GO:0090557 | establishment of endothelial intestinal barrier(GO:0090557) |
| 0.2 | 0.2 | GO:0000720 | pyrimidine dimer repair by nucleotide-excision repair(GO:0000720) |
| 0.1 | 3.1 | GO:0007095 | mitotic G2 DNA damage checkpoint(GO:0007095) |
| 0.1 | 0.7 | GO:0099590 | neurotransmitter receptor internalization(GO:0099590) |
| 0.1 | 1.1 | GO:0021902 | commitment of neuronal cell to specific neuron type in forebrain(GO:0021902) |
| 0.1 | 3.3 | GO:2000637 | positive regulation of posttranscriptional gene silencing(GO:0060148) positive regulation of gene silencing by miRNA(GO:2000637) |
| 0.1 | 1.2 | GO:2000270 | negative regulation of fibroblast apoptotic process(GO:2000270) |
| 0.1 | 0.4 | GO:1990167 | protein K27-linked deubiquitination(GO:1990167) |
| 0.1 | 2.6 | GO:1900745 | positive regulation of p38MAPK cascade(GO:1900745) |
| 0.1 | 0.7 | GO:0098735 | positive regulation of the force of heart contraction(GO:0098735) |
| 0.1 | 0.5 | GO:0051013 | microtubule severing(GO:0051013) |
| 0.1 | 2.4 | GO:0032201 | telomere maintenance via semi-conservative replication(GO:0032201) |
| 0.1 | 0.4 | GO:0006620 | posttranslational protein targeting to membrane(GO:0006620) |
| 0.1 | 2.1 | GO:0061003 | positive regulation of dendritic spine morphogenesis(GO:0061003) |
| 0.1 | 3.9 | GO:0000281 | mitotic cytokinesis(GO:0000281) |
| 0.1 | 0.5 | GO:0009441 | glycolate metabolic process(GO:0009441) |
| 0.1 | 0.6 | GO:0035360 | positive regulation of peroxisome proliferator activated receptor signaling pathway(GO:0035360) |
| 0.1 | 0.4 | GO:0072719 | cellular response to cisplatin(GO:0072719) |
| 0.1 | 0.2 | GO:1900039 | positive regulation of cellular response to hypoxia(GO:1900039) |
| 0.1 | 1.0 | GO:0090161 | Golgi ribbon formation(GO:0090161) |
| 0.1 | 0.2 | GO:0043314 | negative regulation of neutrophil degranulation(GO:0043314) |
| 0.1 | 0.5 | GO:1903265 | positive regulation of tumor necrosis factor-mediated signaling pathway(GO:1903265) |
| 0.0 | 2.5 | GO:0007029 | endoplasmic reticulum organization(GO:0007029) |
| 0.0 | 0.6 | GO:0010225 | response to UV-C(GO:0010225) |
| 0.0 | 2.1 | GO:0042026 | protein refolding(GO:0042026) |
| 0.0 | 1.0 | GO:0061157 | mRNA destabilization(GO:0061157) |
| 0.0 | 0.7 | GO:0018345 | protein palmitoylation(GO:0018345) |
| 0.0 | 0.4 | GO:0071763 | nuclear membrane organization(GO:0071763) |
| 0.0 | 0.5 | GO:0048703 | embryonic viscerocranium morphogenesis(GO:0048703) |
| 0.0 | 2.1 | GO:0043486 | histone exchange(GO:0043486) |
| 0.0 | 1.3 | GO:0033260 | nuclear DNA replication(GO:0033260) |
| 0.0 | 0.3 | GO:0002005 | angiotensin catabolic process in blood(GO:0002005) |
| 0.0 | 1.5 | GO:0050873 | brown fat cell differentiation(GO:0050873) |
| 0.0 | 0.7 | GO:0090110 | cargo loading into COPII-coated vesicle(GO:0090110) |
| 0.0 | 0.1 | GO:0070512 | regulation of histone H4-K20 methylation(GO:0070510) positive regulation of histone H4-K20 methylation(GO:0070512) |
| 0.0 | 2.4 | GO:0090307 | mitotic spindle assembly(GO:0090307) |
| 0.0 | 2.0 | GO:0071392 | cellular response to estradiol stimulus(GO:0071392) |
| 0.0 | 0.3 | GO:0001832 | blastocyst growth(GO:0001832) |
| 0.0 | 0.2 | GO:0006581 | acetylcholine catabolic process in synaptic cleft(GO:0001507) acetylcholine catabolic process(GO:0006581) |
| 0.0 | 1.8 | GO:0031640 | killing of cells of other organism(GO:0031640) disruption of cells of other organism(GO:0044364) |
| 0.0 | 0.5 | GO:0032012 | regulation of ARF protein signal transduction(GO:0032012) |
| 0.0 | 0.1 | GO:0048250 | mitochondrial iron ion transport(GO:0048250) |
| 0.0 | 1.4 | GO:0007040 | lysosome organization(GO:0007040) lytic vacuole organization(GO:0080171) |
| 0.0 | 0.9 | GO:0050434 | positive regulation of viral transcription(GO:0050434) |
| 0.0 | 0.1 | GO:0044334 | regulation of heparan sulfate proteoglycan biosynthetic process(GO:0010908) positive regulation of heparan sulfate proteoglycan biosynthetic process(GO:0010909) canonical Wnt signaling pathway involved in positive regulation of epithelial to mesenchymal transition(GO:0044334) positive regulation of proteoglycan biosynthetic process(GO:1902730) |
| 0.0 | 0.9 | GO:2000144 | positive regulation of DNA-templated transcription, initiation(GO:2000144) |
| 0.0 | 0.9 | GO:0010501 | RNA secondary structure unwinding(GO:0010501) |
| 0.0 | 0.3 | GO:0035970 | peptidyl-threonine dephosphorylation(GO:0035970) |
| 0.0 | 0.6 | GO:0008333 | endosome to lysosome transport(GO:0008333) |
| 0.0 | 0.9 | GO:0006378 | mRNA polyadenylation(GO:0006378) |
| 0.0 | 1.0 | GO:0015701 | bicarbonate transport(GO:0015701) |
| 0.0 | 0.4 | GO:0007172 | signal complex assembly(GO:0007172) |
| 0.0 | 0.0 | GO:0019858 | diadenosine polyphosphate biosynthetic process(GO:0015960) diadenosine tetraphosphate metabolic process(GO:0015965) diadenosine tetraphosphate biosynthetic process(GO:0015966) cytosine metabolic process(GO:0019858) |
| 0.0 | 1.4 | GO:0006334 | nucleosome assembly(GO:0006334) |
| 0.0 | 1.0 | GO:0090114 | COPII-coated vesicle budding(GO:0090114) |
| 0.0 | 0.0 | GO:0043932 | ossification involved in bone remodeling(GO:0043932) |
| 0.0 | 0.3 | GO:0006646 | phosphatidylethanolamine biosynthetic process(GO:0006646) |
| 0.0 | 0.0 | GO:0051835 | positive regulation of synapse structural plasticity(GO:0051835) |
| 0.0 | 1.3 | GO:0007292 | female gamete generation(GO:0007292) |
| 0.0 | 1.0 | GO:0006521 | regulation of cellular amino acid metabolic process(GO:0006521) |
| 0.0 | 0.3 | GO:0051123 | RNA polymerase II transcriptional preinitiation complex assembly(GO:0051123) |
| 0.0 | 2.4 | GO:0051168 | nuclear export(GO:0051168) |
| 0.0 | 1.3 | GO:0050729 | positive regulation of inflammatory response(GO:0050729) |
| 0.0 | 0.6 | GO:0046513 | ceramide biosynthetic process(GO:0046513) |
| 0.0 | 1.5 | GO:0048813 | dendrite morphogenesis(GO:0048813) |
Gene overrepresentation in cellular_component category:
| Log-likelihood per target | Total log-likelihood | Term | Description |
|---|---|---|---|
| 0.5 | 1.5 | GO:0070195 | growth hormone receptor complex(GO:0070195) |
| 0.5 | 1.9 | GO:0042721 | mitochondrial inner membrane protein insertion complex(GO:0042721) |
| 0.5 | 2.4 | GO:0008622 | epsilon DNA polymerase complex(GO:0008622) |
| 0.4 | 4.0 | GO:0019907 | cyclin-dependent protein kinase activating kinase holoenzyme complex(GO:0019907) |
| 0.4 | 1.6 | GO:0032301 | MutSalpha complex(GO:0032301) |
| 0.3 | 1.7 | GO:0042272 | nuclear RNA export factor complex(GO:0042272) |
| 0.3 | 3.4 | GO:0070937 | CRD-mediated mRNA stability complex(GO:0070937) |
| 0.3 | 2.0 | GO:0001740 | Barr body(GO:0001740) |
| 0.3 | 3.2 | GO:0016593 | Cdc73/Paf1 complex(GO:0016593) |
| 0.3 | 3.6 | GO:0035749 | myelin sheath adaxonal region(GO:0035749) |
| 0.3 | 2.6 | GO:0030015 | CCR4-NOT core complex(GO:0030015) |
| 0.3 | 2.1 | GO:0035068 | micro-ribonucleoprotein complex(GO:0035068) |
| 0.2 | 1.2 | GO:0032444 | activin responsive factor complex(GO:0032444) |
| 0.2 | 1.1 | GO:0031313 | extrinsic component of endosome membrane(GO:0031313) |
| 0.2 | 1.9 | GO:0044327 | dendritic spine head(GO:0044327) |
| 0.2 | 2.8 | GO:0031235 | intrinsic component of the cytoplasmic side of the plasma membrane(GO:0031235) |
| 0.1 | 1.1 | GO:0005955 | calcineurin complex(GO:0005955) |
| 0.1 | 0.8 | GO:0016589 | NURF complex(GO:0016589) |
| 0.1 | 1.2 | GO:0035985 | senescence-associated heterochromatin focus(GO:0035985) |
| 0.1 | 0.4 | GO:0031211 | serine C-palmitoyltransferase complex(GO:0017059) endoplasmic reticulum palmitoyltransferase complex(GO:0031211) |
| 0.1 | 0.9 | GO:0008541 | proteasome regulatory particle, lid subcomplex(GO:0008541) |
| 0.1 | 1.7 | GO:0031229 | integral component of nuclear inner membrane(GO:0005639) intrinsic component of nuclear inner membrane(GO:0031229) nuclear membrane part(GO:0044453) |
| 0.1 | 0.7 | GO:0098839 | postsynaptic density membrane(GO:0098839) |
| 0.1 | 0.8 | GO:0005750 | mitochondrial respiratory chain complex III(GO:0005750) respiratory chain complex III(GO:0045275) |
| 0.1 | 1.1 | GO:0032059 | bleb(GO:0032059) |
| 0.1 | 3.3 | GO:0043034 | costamere(GO:0043034) |
| 0.1 | 1.7 | GO:0097228 | sperm principal piece(GO:0097228) |
| 0.1 | 2.0 | GO:0000159 | protein phosphatase type 2A complex(GO:0000159) |
| 0.1 | 1.4 | GO:0071564 | npBAF complex(GO:0071564) |
| 0.1 | 0.2 | GO:0044305 | calyx of Held(GO:0044305) |
| 0.1 | 0.2 | GO:0035189 | Rb-E2F complex(GO:0035189) |
| 0.0 | 1.3 | GO:0070971 | endoplasmic reticulum exit site(GO:0070971) |
| 0.0 | 0.4 | GO:0097413 | Lewy body(GO:0097413) |
| 0.0 | 0.5 | GO:1990909 | Wnt signalosome(GO:1990909) |
| 0.0 | 0.9 | GO:0016281 | eukaryotic translation initiation factor 4F complex(GO:0016281) |
| 0.0 | 0.2 | GO:0005943 | phosphatidylinositol 3-kinase complex, class IA(GO:0005943) |
| 0.0 | 2.0 | GO:0045171 | intercellular bridge(GO:0045171) |
| 0.0 | 1.2 | GO:0044665 | MLL1/2 complex(GO:0044665) MLL1 complex(GO:0071339) |
| 0.0 | 1.4 | GO:0005719 | nuclear euchromatin(GO:0005719) |
| 0.0 | 0.5 | GO:0000815 | ESCRT III complex(GO:0000815) |
| 0.0 | 2.7 | GO:0055038 | recycling endosome membrane(GO:0055038) |
| 0.0 | 1.3 | GO:0016592 | mediator complex(GO:0016592) |
| 0.0 | 0.1 | GO:0070369 | beta-catenin-TCF7L2 complex(GO:0070369) |
| 0.0 | 2.1 | GO:0010494 | cytoplasmic stress granule(GO:0010494) |
| 0.0 | 0.1 | GO:0031436 | BRCA1-BARD1 complex(GO:0031436) |
| 0.0 | 0.6 | GO:0035145 | exon-exon junction complex(GO:0035145) |
| 0.0 | 1.1 | GO:0005871 | kinesin complex(GO:0005871) |
| 0.0 | 6.9 | GO:0031965 | nuclear membrane(GO:0031965) |
| 0.0 | 2.8 | GO:0001650 | fibrillar center(GO:0001650) |
| 0.0 | 1.5 | GO:0000118 | histone deacetylase complex(GO:0000118) |
| 0.0 | 0.9 | GO:0009295 | nucleoid(GO:0009295) mitochondrial nucleoid(GO:0042645) |
| 0.0 | 3.4 | GO:0101002 | ficolin-1-rich granule(GO:0101002) ficolin-1-rich granule lumen(GO:1904813) |
| 0.0 | 1.0 | GO:0012507 | ER to Golgi transport vesicle membrane(GO:0012507) |
| 0.0 | 1.0 | GO:0031201 | SNARE complex(GO:0031201) |
| 0.0 | 0.2 | GO:0070775 | H3 histone acetyltransferase complex(GO:0070775) MOZ/MORF histone acetyltransferase complex(GO:0070776) |
| 0.0 | 0.5 | GO:0031519 | PcG protein complex(GO:0031519) |
| 0.0 | 0.7 | GO:0043198 | dendritic shaft(GO:0043198) |
| 0.0 | 0.7 | GO:0043657 | host(GO:0018995) host cell(GO:0043657) |
| 0.0 | 0.4 | GO:0000407 | pre-autophagosomal structure(GO:0000407) |
| 0.0 | 1.4 | GO:0031902 | late endosome membrane(GO:0031902) |
| 0.0 | 3.1 | GO:0000151 | ubiquitin ligase complex(GO:0000151) |
| 0.0 | 1.9 | GO:0044798 | nuclear transcription factor complex(GO:0044798) |
| 0.0 | 0.5 | GO:0030669 | clathrin-coated endocytic vesicle membrane(GO:0030669) |
Gene overrepresentation in molecular_function category:
| Log-likelihood per target | Total log-likelihood | Term | Description |
|---|---|---|---|
| 1.2 | 3.6 | GO:0016314 | phosphatidylinositol-3,4,5-trisphosphate 3-phosphatase activity(GO:0016314) |
| 1.0 | 4.0 | GO:0034648 | histone demethylase activity (H3-dimethyl-K4 specific)(GO:0034648) |
| 0.6 | 4.3 | GO:0042978 | ornithine decarboxylase activator activity(GO:0042978) |
| 0.4 | 1.2 | GO:0035501 | MH1 domain binding(GO:0035501) |
| 0.4 | 3.3 | GO:0002151 | G-quadruplex RNA binding(GO:0002151) |
| 0.4 | 1.6 | GO:0032143 | single thymine insertion binding(GO:0032143) |
| 0.3 | 1.7 | GO:0034046 | poly(G) binding(GO:0034046) |
| 0.3 | 0.5 | GO:0010314 | phosphatidylinositol-5-phosphate binding(GO:0010314) |
| 0.2 | 1.0 | GO:0050265 | RNA uridylyltransferase activity(GO:0050265) |
| 0.2 | 2.6 | GO:0001224 | RNA polymerase II transcription cofactor binding(GO:0001224) |
| 0.2 | 0.7 | GO:0004379 | glycylpeptide N-tetradecanoyltransferase activity(GO:0004379) myristoyltransferase activity(GO:0019107) |
| 0.2 | 1.1 | GO:0071208 | histone pre-mRNA DCP binding(GO:0071208) |
| 0.2 | 0.7 | GO:0099580 | ion antiporter activity involved in regulation of postsynaptic membrane potential(GO:0099580) |
| 0.2 | 0.6 | GO:0004756 | selenide, water dikinase activity(GO:0004756) phosphotransferase activity, paired acceptors(GO:0016781) |
| 0.2 | 4.0 | GO:0070273 | phosphatidylinositol-4-phosphate binding(GO:0070273) |
| 0.2 | 2.8 | GO:0019870 | potassium channel inhibitor activity(GO:0019870) |
| 0.2 | 0.6 | GO:0033149 | FFAT motif binding(GO:0033149) |
| 0.2 | 1.1 | GO:0061649 | ubiquitinated histone binding(GO:0061649) |
| 0.2 | 0.7 | GO:0042954 | lipoprotein transporter activity(GO:0042954) |
| 0.2 | 0.5 | GO:0016899 | oxidoreductase activity, acting on the CH-OH group of donors, oxygen as acceptor(GO:0016899) |
| 0.1 | 0.4 | GO:0050501 | hyaluronan synthase activity(GO:0050501) |
| 0.1 | 0.5 | GO:0034481 | chondroitin sulfotransferase activity(GO:0034481) |
| 0.1 | 6.1 | GO:0004003 | ATP-dependent DNA helicase activity(GO:0004003) |
| 0.1 | 0.4 | GO:0004758 | serine C-palmitoyltransferase activity(GO:0004758) C-palmitoyltransferase activity(GO:0016454) |
| 0.1 | 0.9 | GO:0030957 | Tat protein binding(GO:0030957) |
| 0.1 | 3.4 | GO:0070034 | telomerase RNA binding(GO:0070034) |
| 0.1 | 5.0 | GO:0031492 | nucleosomal DNA binding(GO:0031492) |
| 0.1 | 2.1 | GO:0035198 | miRNA binding(GO:0035198) |
| 0.1 | 3.5 | GO:0070410 | co-SMAD binding(GO:0070410) |
| 0.1 | 0.6 | GO:0016286 | small conductance calcium-activated potassium channel activity(GO:0016286) |
| 0.1 | 0.8 | GO:0008121 | ubiquinol-cytochrome-c reductase activity(GO:0008121) oxidoreductase activity, acting on diphenols and related substances as donors, cytochrome as acceptor(GO:0016681) |
| 0.1 | 1.1 | GO:0033192 | calmodulin-dependent protein phosphatase activity(GO:0033192) |
| 0.1 | 0.3 | GO:0034041 | sterol-transporting ATPase activity(GO:0034041) |
| 0.1 | 0.6 | GO:0043237 | laminin-1 binding(GO:0043237) |
| 0.1 | 2.4 | GO:0003887 | DNA-directed DNA polymerase activity(GO:0003887) |
| 0.1 | 0.4 | GO:0097157 | lysine N-acetyltransferase activity, acting on acetyl phosphate as donor(GO:0004468) pre-mRNA intronic binding(GO:0097157) |
| 0.1 | 1.0 | GO:0004128 | cytochrome-b5 reductase activity, acting on NAD(P)H(GO:0004128) |
| 0.1 | 4.4 | GO:0016831 | carboxy-lyase activity(GO:0016831) |
| 0.1 | 0.5 | GO:0008568 | microtubule-severing ATPase activity(GO:0008568) |
| 0.1 | 2.6 | GO:0004709 | MAP kinase kinase kinase activity(GO:0004709) |
| 0.1 | 0.8 | GO:0042975 | peroxisome proliferator activated receptor binding(GO:0042975) |
| 0.1 | 3.3 | GO:0001105 | RNA polymerase II transcription coactivator activity(GO:0001105) |
| 0.1 | 2.1 | GO:0001671 | ATPase activator activity(GO:0001671) |
| 0.1 | 1.3 | GO:0031434 | mitogen-activated protein kinase kinase binding(GO:0031434) |
| 0.1 | 3.7 | GO:0031490 | chromatin DNA binding(GO:0031490) |
| 0.1 | 0.3 | GO:0050815 | phosphoserine binding(GO:0050815) |
| 0.1 | 1.1 | GO:0070016 | armadillo repeat domain binding(GO:0070016) |
| 0.1 | 1.1 | GO:0031491 | nucleosome binding(GO:0031491) |
| 0.1 | 2.1 | GO:0004407 | histone deacetylase activity(GO:0004407) |
| 0.0 | 1.5 | GO:0070064 | proline-rich region binding(GO:0070064) |
| 0.0 | 0.9 | GO:0017049 | GTP-Rho binding(GO:0017049) |
| 0.0 | 0.7 | GO:0019706 | protein-cysteine S-palmitoyltransferase activity(GO:0019706) protein-cysteine S-acyltransferase activity(GO:0019707) |
| 0.0 | 0.2 | GO:0061676 | importin-alpha family protein binding(GO:0061676) |
| 0.0 | 0.7 | GO:0097602 | cullin family protein binding(GO:0097602) |
| 0.0 | 0.7 | GO:0032794 | GTPase activating protein binding(GO:0032794) |
| 0.0 | 2.7 | GO:0019003 | GDP binding(GO:0019003) |
| 0.0 | 0.4 | GO:0005375 | copper ion transmembrane transporter activity(GO:0005375) |
| 0.0 | 0.3 | GO:0004305 | ethanolamine kinase activity(GO:0004305) |
| 0.0 | 1.0 | GO:0051059 | NF-kappaB binding(GO:0051059) |
| 0.0 | 0.5 | GO:0001075 | transcription factor activity, RNA polymerase II core promoter sequence-specific binding involved in preinitiation complex assembly(GO:0001075) |
| 0.0 | 1.7 | GO:0030145 | manganese ion binding(GO:0030145) |
| 0.0 | 2.5 | GO:0003777 | microtubule motor activity(GO:0003777) |
| 0.0 | 0.2 | GO:0035005 | 1-phosphatidylinositol-4-phosphate 3-kinase activity(GO:0035005) |
| 0.0 | 1.5 | GO:0033613 | activating transcription factor binding(GO:0033613) |
| 0.0 | 3.0 | GO:0004386 | helicase activity(GO:0004386) |
| 0.0 | 2.4 | GO:0019888 | protein phosphatase regulator activity(GO:0019888) |
| 0.0 | 1.0 | GO:0005484 | SNAP receptor activity(GO:0005484) |
| 0.0 | 0.5 | GO:0005086 | ARF guanyl-nucleotide exchange factor activity(GO:0005086) |
| 0.0 | 1.9 | GO:0051087 | chaperone binding(GO:0051087) |
| 0.0 | 1.2 | GO:0004693 | cyclin-dependent protein serine/threonine kinase activity(GO:0004693) |
| 0.0 | 1.5 | GO:0004843 | thiol-dependent ubiquitin-specific protease activity(GO:0004843) |
| 0.0 | 0.2 | GO:0003831 | beta-N-acetylglucosaminylglycopeptide beta-1,4-galactosyltransferase activity(GO:0003831) |
| 0.0 | 0.2 | GO:0022841 | potassium ion leak channel activity(GO:0022841) |
| 0.0 | 0.3 | GO:0070006 | metalloaminopeptidase activity(GO:0070006) |
| 0.0 | 0.4 | GO:0017166 | vinculin binding(GO:0017166) |
| 0.0 | 0.7 | GO:0005245 | voltage-gated calcium channel activity(GO:0005245) |
| 0.0 | 0.4 | GO:0031624 | ubiquitin conjugating enzyme binding(GO:0031624) |
| 0.0 | 0.4 | GO:0005104 | fibroblast growth factor receptor binding(GO:0005104) |
| 0.0 | 1.9 | GO:0042393 | histone binding(GO:0042393) |
| 0.0 | 0.0 | GO:0052590 | sn-glycerol-3-phosphate:ubiquinone oxidoreductase activity(GO:0052590) sn-glycerol-3-phosphate:ubiquinone-8 oxidoreductase activity(GO:0052591) |
| 0.0 | 0.4 | GO:0030374 | ligand-dependent nuclear receptor transcription coactivator activity(GO:0030374) |
Gene overrepresentation in C2:CP category:
| Log-likelihood per target | Total log-likelihood | Term | Description |
|---|---|---|---|
| 0.1 | 4.4 | SA PTEN PATHWAY | PTEN is a tumor suppressor that dephosphorylates the lipid messenger phosphatidylinositol triphosphate. |
| 0.1 | 5.1 | PID INSULIN PATHWAY | Insulin Pathway |
| 0.1 | 1.1 | PID THROMBIN PAR4 PATHWAY | PAR4-mediated thrombin signaling events |
| 0.1 | 2.6 | PID P38 MKK3 6PATHWAY | p38 MAPK signaling pathway |
| 0.0 | 2.2 | PID IL12 STAT4 PATHWAY | IL12 signaling mediated by STAT4 |
| 0.0 | 1.2 | PID SMAD2 3PATHWAY | Regulation of cytoplasmic and nuclear SMAD2/3 signaling |
| 0.0 | 2.0 | PID HES HEY PATHWAY | Notch-mediated HES/HEY network |
| 0.0 | 1.6 | PID AURORA A PATHWAY | Aurora A signaling |
| 0.0 | 1.6 | PID PLK1 PATHWAY | PLK1 signaling events |
| 0.0 | 2.7 | PID RB 1PATHWAY | Regulation of retinoblastoma protein |
| 0.0 | 1.8 | PID P53 REGULATION PATHWAY | p53 pathway |
| 0.0 | 1.9 | PID ERA GENOMIC PATHWAY | Validated nuclear estrogen receptor alpha network |
| 0.0 | 0.5 | PID HEDGEHOG 2PATHWAY | Signaling events mediated by the Hedgehog family |
| 0.0 | 0.5 | PID ER NONGENOMIC PATHWAY | Plasma membrane estrogen receptor signaling |
| 0.0 | 1.1 | PID ERBB1 INTERNALIZATION PATHWAY | Internalization of ErbB1 |
| 0.0 | 0.9 | PID ARF6 PATHWAY | Arf6 signaling events |
| 0.0 | 1.4 | PID CMYB PATHWAY | C-MYB transcription factor network |
| 0.0 | 0.3 | ST G ALPHA S PATHWAY | G alpha s Pathway |
Gene overrepresentation in C2:CP:REACTOME category:
| Log-likelihood per target | Total log-likelihood | Term | Description |
|---|---|---|---|
| 0.4 | 3.5 | REACTOME NEGATIVE REGULATION OF THE PI3K AKT NETWORK | Genes involved in Negative regulation of the PI3K/AKT network |
| 0.2 | 4.4 | REACTOME METABOLISM OF POLYAMINES | Genes involved in Metabolism of polyamines |
| 0.1 | 3.5 | REACTOME DEADENYLATION OF MRNA | Genes involved in Deadenylation of mRNA |
| 0.1 | 2.1 | REACTOME PRE NOTCH TRANSCRIPTION AND TRANSLATION | Genes involved in Pre-NOTCH Transcription and Translation |
| 0.1 | 2.0 | REACTOME CTNNB1 PHOSPHORYLATION CASCADE | Genes involved in Beta-catenin phosphorylation cascade |
| 0.1 | 3.3 | REACTOME DOWNREGULATION OF SMAD2 3 SMAD4 TRANSCRIPTIONAL ACTIVITY | Genes involved in Downregulation of SMAD2/3:SMAD4 transcriptional activity |
| 0.1 | 0.7 | REACTOME PI3K EVENTS IN ERBB4 SIGNALING | Genes involved in PI3K events in ERBB4 signaling |
| 0.1 | 5.3 | REACTOME REGULATION OF ORNITHINE DECARBOXYLASE ODC | Genes involved in Regulation of ornithine decarboxylase (ODC) |
| 0.1 | 0.7 | REACTOME MEMBRANE BINDING AND TARGETTING OF GAG PROTEINS | Genes involved in Membrane binding and targetting of GAG proteins |
| 0.1 | 1.7 | REACTOME KINESINS | Genes involved in Kinesins |
| 0.1 | 1.5 | REACTOME PROLACTIN RECEPTOR SIGNALING | Genes involved in Prolactin receptor signaling |
| 0.1 | 2.6 | REACTOME IL1 SIGNALING | Genes involved in Interleukin-1 signaling |
| 0.1 | 1.8 | REACTOME PIP3 ACTIVATES AKT SIGNALING | Genes involved in PIP3 activates AKT signaling |
| 0.0 | 2.3 | REACTOME SIGNALING BY ROBO RECEPTOR | Genes involved in Signaling by Robo receptor |
| 0.0 | 0.8 | REACTOME SYNTHESIS SECRETION AND INACTIVATION OF GIP | Genes involved in Synthesis, Secretion, and Inactivation of Glucose-dependent Insulinotropic Polypeptide (GIP) |
| 0.0 | 2.4 | REACTOME RNA POL I PROMOTER OPENING | Genes involved in RNA Polymerase I Promoter Opening |
| 0.0 | 1.0 | REACTOME PROTEOLYTIC CLEAVAGE OF SNARE COMPLEX PROTEINS | Genes involved in Proteolytic cleavage of SNARE complex proteins |
| 0.0 | 1.9 | REACTOME REGULATION OF MRNA STABILITY BY PROTEINS THAT BIND AU RICH ELEMENTS | Genes involved in Regulation of mRNA Stability by Proteins that Bind AU-rich Elements |
| 0.0 | 1.9 | REACTOME MITOCHONDRIAL PROTEIN IMPORT | Genes involved in Mitochondrial Protein Import |
| 0.0 | 5.8 | REACTOME PROCESSING OF CAPPED INTRON CONTAINING PRE MRNA | Genes involved in Processing of Capped Intron-Containing Pre-mRNA |
| 0.0 | 1.1 | REACTOME SIGNAL REGULATORY PROTEIN SIRP FAMILY INTERACTIONS | Genes involved in Signal regulatory protein (SIRP) family interactions |
| 0.0 | 1.1 | REACTOME TRAF6 MEDIATED IRF7 ACTIVATION | Genes involved in TRAF6 mediated IRF7 activation |
| 0.0 | 0.7 | REACTOME PLATELET CALCIUM HOMEOSTASIS | Genes involved in Platelet calcium homeostasis |
| 0.0 | 0.2 | REACTOME TANDEM PORE DOMAIN POTASSIUM CHANNELS | Genes involved in Tandem pore domain potassium channels |
| 0.0 | 1.1 | REACTOME DARPP 32 EVENTS | Genes involved in DARPP-32 events |
| 0.0 | 0.4 | REACTOME HYALURONAN METABOLISM | Genes involved in Hyaluronan metabolism |
| 0.0 | 0.4 | REACTOME ACTIVATED POINT MUTANTS OF FGFR2 | Genes involved in Activated point mutants of FGFR2 |
| 0.0 | 0.2 | REACTOME INHIBITION OF REPLICATION INITIATION OF DAMAGED DNA BY RB1 E2F1 | Genes involved in Inhibition of replication initiation of damaged DNA by RB1/E2F1 |
| 0.0 | 0.3 | REACTOME DOWNREGULATION OF ERBB2 ERBB3 SIGNALING | Genes involved in Downregulation of ERBB2:ERBB3 signaling |
| 0.0 | 0.5 | REACTOME CHONDROITIN SULFATE BIOSYNTHESIS | Genes involved in Chondroitin sulfate biosynthesis |
| 0.0 | 0.3 | REACTOME SYNTHESIS OF PE | Genes involved in Synthesis of PE |
| 0.0 | 0.4 | REACTOME METAL ION SLC TRANSPORTERS | Genes involved in Metal ion SLC transporters |
| 0.0 | 0.7 | REACTOME TRAFFICKING OF AMPA RECEPTORS | Genes involved in Trafficking of AMPA receptors |
| 0.0 | 1.3 | REACTOME TRANSCRIPTIONAL REGULATION OF WHITE ADIPOCYTE DIFFERENTIATION | Genes involved in Transcriptional Regulation of White Adipocyte Differentiation |
| 0.0 | 0.5 | REACTOME ANTIVIRAL MECHANISM BY IFN STIMULATED GENES | Genes involved in Antiviral mechanism by IFN-stimulated genes |
| 0.0 | 0.4 | REACTOME SEMA4D INDUCED CELL MIGRATION AND GROWTH CONE COLLAPSE | Genes involved in Sema4D induced cell migration and growth-cone collapse |
| 0.0 | 0.2 | REACTOME ABCA TRANSPORTERS IN LIPID HOMEOSTASIS | Genes involved in ABCA transporters in lipid homeostasis |