Project
GNF SymAtlas + NCI-60 cancer cell lines, comparison of cancers vs non-cancers, human (Su, 2004; Ross, 2000)
Navigation
Downloads
Results for AACGGAA
Z-value: 0.17
Motif logo

miRNA associated with seed AACGGAA
| Name | miRBASE accession |
|---|---|
|
hsa-miR-191-5p
|
MIMAT0000440 |
Activity profile of AACGGAA motif
Sorted Z-values of AACGGAA motif
| Promoter | Log-likelihood | Transcript | Gene | Gene Info |
|---|---|---|---|---|
| chr10_-_81205373 | 0.53 |
ENST00000372336.3
|
ZCCHC24
|
zinc finger, CCHC domain containing 24 |
| chr3_+_115342159 | 0.52 |
ENST00000305124.6
|
GAP43
|
growth associated protein 43 |
| chr6_+_116601265 | 0.38 |
ENST00000452085.3
|
DSE
|
dermatan sulfate epimerase |
| chr7_-_108096822 | 0.32 |
ENST00000379028.3
ENST00000413765.2 ENST00000379022.4 |
NRCAM
|
neuronal cell adhesion molecule |
| chr8_-_134115118 | 0.29 |
ENST00000395352.3
ENST00000338087.5 |
SLA
|
Src-like-adaptor |
| chr17_-_46623441 | 0.25 |
ENST00000330070.4
|
HOXB2
|
homeobox B2 |
| chr7_-_71801980 | 0.24 |
ENST00000329008.5
|
CALN1
|
calneuron 1 |
| chr9_+_133454943 | 0.13 |
ENST00000319725.9
|
FUBP3
|
far upstream element (FUSE) binding protein 3 |
| chr5_+_149887672 | 0.13 |
ENST00000261797.6
|
NDST1
|
N-deacetylase/N-sulfotransferase (heparan glucosaminyl) 1 |
| chr12_+_122242597 | 0.11 |
ENST00000267197.5
|
SETD1B
|
SET domain containing 1B |
| chrX_-_41782249 | 0.09 |
ENST00000442742.2
ENST00000421587.2 ENST00000378166.4 ENST00000318588.9 ENST00000361962.4 |
CASK
|
calcium/calmodulin-dependent serine protein kinase (MAGUK family) |
| chrX_-_109561294 | 0.09 |
ENST00000372059.2
ENST00000262844.5 |
AMMECR1
|
Alport syndrome, mental retardation, midface hypoplasia and elliptocytosis chromosomal region gene 1 |
| chr2_-_208634287 | 0.08 |
ENST00000295417.3
|
FZD5
|
frizzled family receptor 5 |
| chr19_-_15560730 | 0.08 |
ENST00000389282.4
ENST00000263381.7 |
WIZ
|
widely interspaced zinc finger motifs |
| chr3_-_18466787 | 0.07 |
ENST00000338745.6
ENST00000450898.1 |
SATB1
|
SATB homeobox 1 |
| chr18_+_32558208 | 0.07 |
ENST00000436190.2
|
MAPRE2
|
microtubule-associated protein, RP/EB family, member 2 |
| chr16_-_4897266 | 0.06 |
ENST00000591451.1
ENST00000436648.5 ENST00000381983.3 ENST00000588297.1 ENST00000321919.9 |
GLYR1
|
glyoxylate reductase 1 homolog (Arabidopsis) |
| chr7_-_17980091 | 0.04 |
ENST00000409389.1
ENST00000409604.1 ENST00000428135.3 |
SNX13
|
sorting nexin 13 |
| chr3_-_52090461 | 0.03 |
ENST00000296483.6
ENST00000495880.1 |
DUSP7
|
dual specificity phosphatase 7 |
| chr2_+_27193480 | 0.02 |
ENST00000233121.2
ENST00000405074.3 |
MAPRE3
|
microtubule-associated protein, RP/EB family, member 3 |
| chr19_+_3359561 | 0.02 |
ENST00000589123.1
ENST00000346156.5 ENST00000395111.3 ENST00000586919.1 |
NFIC
|
nuclear factor I/C (CCAAT-binding transcription factor) |
| chr6_+_21593972 | 0.02 |
ENST00000244745.1
ENST00000543472.1 |
SOX4
|
SRY (sex determining region Y)-box 4 |
| chr9_-_3525968 | 0.00 |
ENST00000382004.3
ENST00000302303.1 ENST00000449190.1 |
RFX3
|
regulatory factor X, 3 (influences HLA class II expression) |
Network of associatons between targets according to the STRING database.

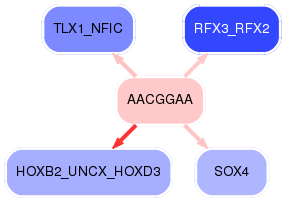
First level regulatory network of AACGGAA
Gene Ontology Analysis
Gene overrepresentation in biological_process category:
| Log-likelihood per target | Total log-likelihood | Term | Description |
|---|---|---|---|
| 0.1 | 0.3 | GO:0021569 | rhombomere 3 development(GO:0021569) |
| 0.1 | 0.3 | GO:0045162 | clustering of voltage-gated sodium channels(GO:0045162) |
| 0.1 | 0.5 | GO:0016198 | axon choice point recognition(GO:0016198) |
| 0.0 | 0.1 | GO:0060061 | Spemann organizer formation(GO:0060061) |
| 0.0 | 0.5 | GO:0015012 | heparan sulfate proteoglycan biosynthetic process(GO:0015012) |
Gene overrepresentation in cellular_component category:
| Log-likelihood per target | Total log-likelihood | Term | Description |
|---|---|---|---|
| 0.1 | 0.5 | GO:0032584 | growth cone membrane(GO:0032584) |
| 0.0 | 0.3 | GO:0043194 | axon initial segment(GO:0043194) |
Gene overrepresentation in molecular_function category:
| Log-likelihood per target | Total log-likelihood | Term | Description |
|---|---|---|---|
| 0.1 | 0.4 | GO:0047757 | chondroitin-glucuronate 5-epimerase activity(GO:0047757) |
| 0.1 | 0.5 | GO:0035727 | lysophosphatidic acid binding(GO:0035727) |
| 0.0 | 0.1 | GO:0050119 | N-acetylglucosamine deacetylase activity(GO:0050119) |
| 0.0 | 0.1 | GO:0070984 | SET domain binding(GO:0070984) |
| 0.0 | 0.3 | GO:0086080 | protein binding involved in heterotypic cell-cell adhesion(GO:0086080) |
| 0.0 | 0.1 | GO:0004616 | phosphogluconate dehydrogenase (decarboxylating) activity(GO:0004616) |