Project
GNF SymAtlas + NCI-60 cancer cell lines, comparison of cancers vs non-cancers, human (Su, 2004; Ross, 2000)
Navigation
Downloads
Results for ACAUUCA
Z-value: 0.16
Motif logo

miRNA associated with seed ACAUUCA
| Name | miRBASE accession |
|---|---|
|
hsa-miR-181a-5p
|
MIMAT0000256 |
|
hsa-miR-181b-5p
|
MIMAT0000257 |
|
hsa-miR-181c-5p
|
MIMAT0000258 |
|
hsa-miR-181d-5p
|
MIMAT0002821 |
|
hsa-miR-4262
|
MIMAT0016894 |
Activity profile of ACAUUCA motif
Sorted Z-values of ACAUUCA motif
| Promoter | Log-likelihood | Transcript | Gene | Gene Info |
|---|---|---|---|---|
| chr20_+_10199468 | 12.52 |
ENST00000254976.2
ENST00000304886.2 |
SNAP25
|
synaptosomal-associated protein, 25kDa |
| chr4_+_158141843 | 12.45 |
ENST00000509417.1
ENST00000296526.7 |
GRIA2
|
glutamate receptor, ionotropic, AMPA 2 |
| chr14_+_90863327 | 10.52 |
ENST00000356978.4
|
CALM1
|
calmodulin 1 (phosphorylase kinase, delta) |
| chr8_+_26435359 | 9.89 |
ENST00000311151.5
|
DPYSL2
|
dihydropyrimidinase-like 2 |
| chr5_-_108745689 | 9.10 |
ENST00000361189.2
|
PJA2
|
praja ring finger 2, E3 ubiquitin protein ligase |
| chr5_+_71403061 | 8.17 |
ENST00000512974.1
ENST00000296755.7 |
MAP1B
|
microtubule-associated protein 1B |
| chr6_-_99797522 | 7.61 |
ENST00000389677.5
|
FAXC
|
failed axon connections homolog (Drosophila) |
| chr20_+_11871371 | 6.99 |
ENST00000254977.3
|
BTBD3
|
BTB (POZ) domain containing 3 |
| chr1_+_50574585 | 6.98 |
ENST00000371824.1
ENST00000371823.4 |
ELAVL4
|
ELAV like neuron-specific RNA binding protein 4 |
| chr15_-_51914996 | 6.88 |
ENST00000251076.5
|
DMXL2
|
Dmx-like 2 |
| chr17_-_9929581 | 6.83 |
ENST00000437099.2
ENST00000396115.2 |
GAS7
|
growth arrest-specific 7 |
| chr3_+_158991025 | 6.81 |
ENST00000337808.6
|
IQCJ-SCHIP1
|
IQCJ-SCHIP1 readthrough |
| chr20_-_4804244 | 6.72 |
ENST00000379400.3
|
RASSF2
|
Ras association (RalGDS/AF-6) domain family member 2 |
| chrX_+_135067576 | 6.69 |
ENST00000370701.1
ENST00000370698.3 ENST00000370695.4 |
SLC9A6
|
solute carrier family 9, subfamily A (NHE6, cation proton antiporter 6), member 6 |
| chr22_-_39239987 | 6.69 |
ENST00000333039.2
|
NPTXR
|
neuronal pentraxin receptor |
| chr7_+_153584166 | 6.68 |
ENST00000404039.1
|
DPP6
|
dipeptidyl-peptidase 6 |
| chr4_+_154125565 | 6.59 |
ENST00000338700.5
|
TRIM2
|
tripartite motif containing 2 |
| chr22_-_39548627 | 6.48 |
ENST00000216133.5
|
CBX7
|
chromobox homolog 7 |
| chr15_+_80696666 | 6.46 |
ENST00000303329.4
|
ARNT2
|
aryl-hydrocarbon receptor nuclear translocator 2 |
| chr20_+_43514315 | 6.21 |
ENST00000353703.4
|
YWHAB
|
tyrosine 3-monooxygenase/tryptophan 5-monooxygenase activation protein, beta |
| chr16_+_11762270 | 6.18 |
ENST00000329565.5
|
SNN
|
stannin |
| chr12_-_16761007 | 6.15 |
ENST00000354662.1
ENST00000441439.2 |
LMO3
|
LIM domain only 3 (rhombotin-like 2) |
| chr20_+_44657845 | 6.13 |
ENST00000243964.3
|
SLC12A5
|
solute carrier family 12 (potassium/chloride transporter), member 5 |
| chr17_+_43971643 | 6.03 |
ENST00000344290.5
ENST00000262410.5 ENST00000351559.5 ENST00000340799.5 ENST00000535772.1 ENST00000347967.5 |
MAPT
|
microtubule-associated protein tau |
| chr15_+_66679155 | 5.88 |
ENST00000307102.5
|
MAP2K1
|
mitogen-activated protein kinase kinase 1 |
| chr3_+_186501336 | 5.80 |
ENST00000323963.5
ENST00000440191.2 ENST00000356531.5 |
EIF4A2
|
eukaryotic translation initiation factor 4A2 |
| chr7_-_111846435 | 5.77 |
ENST00000437633.1
ENST00000428084.1 |
DOCK4
|
dedicator of cytokinesis 4 |
| chr12_-_76953284 | 5.76 |
ENST00000547544.1
ENST00000393249.2 |
OSBPL8
|
oxysterol binding protein-like 8 |
| chr13_-_77900814 | 5.68 |
ENST00000544440.2
|
MYCBP2
|
MYC binding protein 2, E3 ubiquitin protein ligase |
| chr5_+_140248518 | 5.60 |
ENST00000398640.2
|
PCDHA11
|
protocadherin alpha 11 |
| chr5_+_140306478 | 5.54 |
ENST00000253807.2
|
PCDHAC1
|
protocadherin alpha subfamily C, 1 |
| chr10_-_75634260 | 5.49 |
ENST00000372765.1
ENST00000351293.3 |
CAMK2G
|
calcium/calmodulin-dependent protein kinase II gamma |
| chr6_+_139456226 | 5.47 |
ENST00000367658.2
|
HECA
|
headcase homolog (Drosophila) |
| chr15_-_73925651 | 5.47 |
ENST00000545878.1
ENST00000287226.8 ENST00000345330.4 |
NPTN
|
neuroplastin |
| chr5_+_145826867 | 5.44 |
ENST00000296702.5
ENST00000394421.2 |
TCERG1
|
transcription elongation regulator 1 |
| chr6_-_99873145 | 5.44 |
ENST00000369239.5
ENST00000438806.1 |
PNISR
|
PNN-interacting serine/arginine-rich protein |
| chr3_+_159557637 | 5.40 |
ENST00000445224.2
|
SCHIP1
|
schwannomin interacting protein 1 |
| chr12_+_121837844 | 5.38 |
ENST00000361234.5
|
RNF34
|
ring finger protein 34, E3 ubiquitin protein ligase |
| chr12_-_22697343 | 5.32 |
ENST00000446597.1
ENST00000536386.1 ENST00000396028.2 ENST00000545552.1 ENST00000544930.1 ENST00000333957.4 |
C2CD5
|
C2 calcium-dependent domain containing 5 |
| chrX_+_153665248 | 5.30 |
ENST00000447750.2
|
GDI1
|
GDP dissociation inhibitor 1 |
| chr5_+_140254884 | 5.29 |
ENST00000398631.2
|
PCDHA12
|
protocadherin alpha 12 |
| chr18_+_32558208 | 5.26 |
ENST00000436190.2
|
MAPRE2
|
microtubule-associated protein, RP/EB family, member 2 |
| chr5_-_137368708 | 5.20 |
ENST00000033079.3
|
FAM13B
|
family with sequence similarity 13, member B |
| chr3_-_195163803 | 5.20 |
ENST00000326793.6
|
ACAP2
|
ArfGAP with coiled-coil, ankyrin repeat and PH domains 2 |
| chr5_+_140220769 | 5.11 |
ENST00000531613.1
ENST00000378123.3 |
PCDHA8
|
protocadherin alpha 8 |
| chr6_+_44238203 | 5.08 |
ENST00000451188.2
|
TMEM151B
|
transmembrane protein 151B |
| chr5_+_140213815 | 5.02 |
ENST00000525929.1
ENST00000378125.3 |
PCDHA7
|
protocadherin alpha 7 |
| chr12_-_90049828 | 4.84 |
ENST00000261173.2
ENST00000348959.3 |
ATP2B1
|
ATPase, Ca++ transporting, plasma membrane 1 |
| chr5_+_140345820 | 4.80 |
ENST00000289269.5
|
PCDHAC2
|
protocadherin alpha subfamily C, 2 |
| chr1_+_90286562 | 4.73 |
ENST00000525774.1
ENST00000337338.5 |
LRRC8D
|
leucine rich repeat containing 8 family, member D |
| chr5_+_140227048 | 4.72 |
ENST00000532602.1
|
PCDHA9
|
protocadherin alpha 9 |
| chr10_-_15413035 | 4.58 |
ENST00000378116.4
ENST00000455654.1 |
FAM171A1
|
family with sequence similarity 171, member A1 |
| chr10_+_1095416 | 4.54 |
ENST00000358220.1
|
WDR37
|
WD repeat domain 37 |
| chr6_-_110500905 | 4.51 |
ENST00000392587.2
|
WASF1
|
WAS protein family, member 1 |
| chr12_+_32112340 | 4.45 |
ENST00000540924.1
ENST00000312561.4 |
KIAA1551
|
KIAA1551 |
| chr2_-_86790593 | 4.37 |
ENST00000263856.4
ENST00000409225.2 |
CHMP3
|
charged multivesicular body protein 3 |
| chr1_-_179846928 | 4.35 |
ENST00000367612.3
ENST00000609928.1 |
TOR1AIP2
|
torsin A interacting protein 2 |
| chr8_+_21915368 | 4.32 |
ENST00000265800.5
ENST00000517418.1 |
DMTN
|
dematin actin binding protein |
| chr14_+_57735614 | 4.29 |
ENST00000261558.3
|
AP5M1
|
adaptor-related protein complex 5, mu 1 subunit |
| chr5_+_109025067 | 4.21 |
ENST00000261483.4
|
MAN2A1
|
mannosidase, alpha, class 2A, member 1 |
| chr3_-_33481835 | 4.20 |
ENST00000283629.3
|
UBP1
|
upstream binding protein 1 (LBP-1a) |
| chr2_-_122407097 | 4.19 |
ENST00000409078.3
|
CLASP1
|
cytoplasmic linker associated protein 1 |
| chr8_-_18871159 | 4.19 |
ENST00000327040.8
ENST00000440756.2 |
PSD3
|
pleckstrin and Sec7 domain containing 3 |
| chr10_+_112679301 | 4.17 |
ENST00000265277.5
ENST00000369452.4 |
SHOC2
|
soc-2 suppressor of clear homolog (C. elegans) |
| chr6_+_69345166 | 4.07 |
ENST00000370598.1
|
BAI3
|
brain-specific angiogenesis inhibitor 3 |
| chr5_+_161274685 | 4.02 |
ENST00000428797.2
|
GABRA1
|
gamma-aminobutyric acid (GABA) A receptor, alpha 1 |
| chr10_+_99344104 | 4.00 |
ENST00000555577.1
ENST00000370649.3 |
PI4K2A
PI4K2A
|
phosphatidylinositol 4-kinase type 2 alpha Phosphatidylinositol 4-kinase type 2-alpha; Uncharacterized protein |
| chr12_-_46766577 | 3.96 |
ENST00000256689.5
|
SLC38A2
|
solute carrier family 38, member 2 |
| chr8_+_11141925 | 3.94 |
ENST00000221086.3
|
MTMR9
|
myotubularin related protein 9 |
| chr5_-_132073210 | 3.94 |
ENST00000378735.1
ENST00000378746.4 |
KIF3A
|
kinesin family member 3A |
| chr16_+_81069433 | 3.92 |
ENST00000299575.4
|
ATMIN
|
ATM interactor |
| chr13_-_79979919 | 3.75 |
ENST00000267229.7
|
RBM26
|
RNA binding motif protein 26 |
| chr6_-_136610911 | 3.75 |
ENST00000530767.1
ENST00000527759.1 ENST00000527536.1 ENST00000529826.1 ENST00000531224.1 ENST00000353331.4 |
BCLAF1
|
BCL2-associated transcription factor 1 |
| chr3_+_20081515 | 3.70 |
ENST00000263754.4
|
KAT2B
|
K(lysine) acetyltransferase 2B |
| chr6_-_16761678 | 3.69 |
ENST00000244769.4
ENST00000436367.1 |
ATXN1
|
ataxin 1 |
| chr10_+_129705299 | 3.67 |
ENST00000254667.3
|
PTPRE
|
protein tyrosine phosphatase, receptor type, E |
| chr2_-_50574856 | 3.64 |
ENST00000342183.5
|
NRXN1
|
neurexin 1 |
| chr12_+_65563329 | 3.61 |
ENST00000308330.2
|
LEMD3
|
LEM domain containing 3 |
| chr3_+_152017181 | 3.58 |
ENST00000498502.1
ENST00000324196.5 ENST00000545754.1 ENST00000357472.3 |
MBNL1
|
muscleblind-like splicing regulator 1 |
| chr4_+_47033345 | 3.58 |
ENST00000295454.3
|
GABRB1
|
gamma-aminobutyric acid (GABA) A receptor, beta 1 |
| chr10_-_27149792 | 3.51 |
ENST00000376140.3
ENST00000376170.4 |
ABI1
|
abl-interactor 1 |
| chr14_-_64010046 | 3.46 |
ENST00000337537.3
|
PPP2R5E
|
protein phosphatase 2, regulatory subunit B', epsilon isoform |
| chr2_-_152684977 | 3.40 |
ENST00000428992.2
ENST00000295087.8 |
ARL5A
|
ADP-ribosylation factor-like 5A |
| chr10_+_70480963 | 3.37 |
ENST00000265872.6
ENST00000535016.1 ENST00000538031.1 ENST00000543719.1 ENST00000539539.1 ENST00000543225.1 ENST00000536012.1 ENST00000494903.2 |
CCAR1
|
cell division cycle and apoptosis regulator 1 |
| chr5_+_140165876 | 3.37 |
ENST00000504120.2
ENST00000394633.3 ENST00000378133.3 |
PCDHA1
|
protocadherin alpha 1 |
| chr10_+_180987 | 3.35 |
ENST00000381591.1
|
ZMYND11
|
zinc finger, MYND-type containing 11 |
| chr16_+_56225248 | 3.27 |
ENST00000262493.6
|
GNAO1
|
guanine nucleotide binding protein (G protein), alpha activating activity polypeptide O |
| chr4_-_69215699 | 3.24 |
ENST00000510746.1
ENST00000344157.4 ENST00000355665.3 |
YTHDC1
|
YTH domain containing 1 |
| chr1_+_11072696 | 3.21 |
ENST00000240185.3
ENST00000476201.1 |
TARDBP
|
TAR DNA binding protein |
| chr1_+_24286287 | 3.20 |
ENST00000334351.7
ENST00000374468.1 |
PNRC2
|
proline-rich nuclear receptor coactivator 2 |
| chr2_-_38978492 | 3.18 |
ENST00000409276.1
ENST00000446327.2 ENST00000313117.6 |
SRSF7
|
serine/arginine-rich splicing factor 7 |
| chr14_-_21493884 | 3.17 |
ENST00000556974.1
ENST00000554419.1 ENST00000298687.5 ENST00000397858.1 ENST00000360463.3 ENST00000350792.3 ENST00000397847.2 |
NDRG2
|
NDRG family member 2 |
| chr4_-_141677267 | 3.15 |
ENST00000442267.2
|
TBC1D9
|
TBC1 domain family, member 9 (with GRAM domain) |
| chr16_+_58497567 | 3.11 |
ENST00000258187.5
|
NDRG4
|
NDRG family member 4 |
| chr1_-_205719295 | 3.06 |
ENST00000367142.4
|
NUCKS1
|
nuclear casein kinase and cyclin-dependent kinase substrate 1 |
| chr11_+_108093839 | 3.06 |
ENST00000452508.2
|
ATM
|
ataxia telangiectasia mutated |
| chr12_-_118498958 | 3.00 |
ENST00000315436.3
|
WSB2
|
WD repeat and SOCS box containing 2 |
| chr6_-_152958521 | 2.92 |
ENST00000367255.5
ENST00000265368.4 ENST00000448038.1 ENST00000341594.5 |
SYNE1
|
spectrin repeat containing, nuclear envelope 1 |
| chr11_+_47291193 | 2.91 |
ENST00000428807.1
ENST00000402799.1 ENST00000406482.1 ENST00000349238.3 ENST00000311027.5 ENST00000407859.3 ENST00000395344.3 ENST00000444117.1 |
MADD
|
MAP-kinase activating death domain |
| chr8_-_9008206 | 2.89 |
ENST00000310455.3
|
PPP1R3B
|
protein phosphatase 1, regulatory subunit 3B |
| chr1_-_31538517 | 2.88 |
ENST00000440538.2
ENST00000423018.2 ENST00000424085.2 ENST00000426105.2 ENST00000257075.5 ENST00000373747.3 ENST00000525843.1 ENST00000373742.2 |
PUM1
|
pumilio RNA-binding family member 1 |
| chr3_+_101292939 | 2.88 |
ENST00000265260.3
ENST00000469941.1 ENST00000296024.5 |
PCNP
|
PEST proteolytic signal containing nuclear protein |
| chrX_+_70752917 | 2.83 |
ENST00000373719.3
|
OGT
|
O-linked N-acetylglucosamine (GlcNAc) transferase |
| chr20_+_30865429 | 2.82 |
ENST00000375712.3
|
KIF3B
|
kinesin family member 3B |
| chr1_+_32930647 | 2.80 |
ENST00000609129.1
|
ZBTB8B
|
zinc finger and BTB domain containing 8B |
| chr2_+_120517174 | 2.75 |
ENST00000263708.2
|
PTPN4
|
protein tyrosine phosphatase, non-receptor type 4 (megakaryocyte) |
| chr6_+_36853607 | 2.74 |
ENST00000480824.2
ENST00000355190.3 ENST00000373685.1 |
C6orf89
|
chromosome 6 open reading frame 89 |
| chr4_-_42659102 | 2.74 |
ENST00000264449.10
ENST00000510289.1 ENST00000381668.5 |
ATP8A1
|
ATPase, aminophospholipid transporter (APLT), class I, type 8A, member 1 |
| chr13_-_110438914 | 2.66 |
ENST00000375856.3
|
IRS2
|
insulin receptor substrate 2 |
| chr18_-_5544241 | 2.65 |
ENST00000341928.2
ENST00000540638.2 |
EPB41L3
|
erythrocyte membrane protein band 4.1-like 3 |
| chr11_-_116968987 | 2.62 |
ENST00000434315.2
ENST00000292055.4 ENST00000375288.1 ENST00000542607.1 ENST00000445177.1 ENST00000375300.1 ENST00000446921.2 |
SIK3
|
SIK family kinase 3 |
| chr9_-_91793675 | 2.61 |
ENST00000375835.4
ENST00000375830.1 |
SHC3
|
SHC (Src homology 2 domain containing) transforming protein 3 |
| chr7_+_5085452 | 2.60 |
ENST00000353796.3
ENST00000396912.1 ENST00000396904.2 |
RBAK
RBAK-RBAKDN
|
RB-associated KRAB zinc finger RBAK-RBAKDN readthrough |
| chr14_+_55738021 | 2.59 |
ENST00000313833.4
|
FBXO34
|
F-box protein 34 |
| chr16_+_53088885 | 2.56 |
ENST00000566029.1
ENST00000447540.1 |
CHD9
|
chromodomain helicase DNA binding protein 9 |
| chr22_-_44708731 | 2.54 |
ENST00000381176.4
|
KIAA1644
|
KIAA1644 |
| chr17_+_45727204 | 2.50 |
ENST00000290158.4
|
KPNB1
|
karyopherin (importin) beta 1 |
| chr1_-_78148324 | 2.47 |
ENST00000370801.3
ENST00000433749.1 |
ZZZ3
|
zinc finger, ZZ-type containing 3 |
| chr2_-_16847084 | 2.46 |
ENST00000406434.1
ENST00000381323.3 |
FAM49A
|
family with sequence similarity 49, member A |
| chr12_-_8088871 | 2.42 |
ENST00000075120.7
|
SLC2A3
|
solute carrier family 2 (facilitated glucose transporter), member 3 |
| chr3_+_45730733 | 2.41 |
ENST00000418611.1
ENST00000389061.5 |
SACM1L
|
SAC1 suppressor of actin mutations 1-like (yeast) |
| chr7_-_25019760 | 2.40 |
ENST00000352860.1
ENST00000353930.1 ENST00000431825.2 ENST00000313367.2 |
OSBPL3
|
oxysterol binding protein-like 3 |
| chr16_-_66785699 | 2.38 |
ENST00000258198.2
|
DYNC1LI2
|
dynein, cytoplasmic 1, light intermediate chain 2 |
| chr6_-_18265050 | 2.35 |
ENST00000397239.3
|
DEK
|
DEK oncogene |
| chr12_+_62654119 | 2.34 |
ENST00000353364.3
ENST00000549523.1 ENST00000280377.5 |
USP15
|
ubiquitin specific peptidase 15 |
| chr4_+_88896819 | 2.34 |
ENST00000237623.7
ENST00000395080.3 ENST00000508233.1 ENST00000360804.4 |
SPP1
|
secreted phosphoprotein 1 |
| chr15_+_68346501 | 2.33 |
ENST00000249636.6
|
PIAS1
|
protein inhibitor of activated STAT, 1 |
| chr5_+_65018017 | 2.33 |
ENST00000380985.5
ENST00000502464.1 |
NLN
|
neurolysin (metallopeptidase M3 family) |
| chr12_-_65515334 | 2.31 |
ENST00000286574.4
|
WIF1
|
WNT inhibitory factor 1 |
| chr4_-_100867864 | 2.31 |
ENST00000442697.2
|
DNAJB14
|
DnaJ (Hsp40) homolog, subfamily B, member 14 |
| chr7_-_121036337 | 2.30 |
ENST00000426156.1
ENST00000359943.3 ENST00000412653.1 |
FAM3C
|
family with sequence similarity 3, member C |
| chr2_+_74881355 | 2.30 |
ENST00000357877.2
|
SEMA4F
|
sema domain, immunoglobulin domain (Ig), transmembrane domain (TM) and short cytoplasmic domain, (semaphorin) 4F |
| chr5_+_140186647 | 2.28 |
ENST00000512229.2
ENST00000356878.4 ENST00000530339.1 |
PCDHA4
|
protocadherin alpha 4 |
| chr1_+_198126093 | 2.27 |
ENST00000367385.4
ENST00000442588.1 ENST00000538004.1 |
NEK7
|
NIMA-related kinase 7 |
| chr8_-_101965146 | 2.27 |
ENST00000395957.2
ENST00000395948.2 ENST00000457309.1 |
YWHAZ
|
tyrosine 3-monooxygenase/tryptophan 5-monooxygenase activation protein, zeta |
| chr5_+_10353780 | 2.26 |
ENST00000449913.2
ENST00000503788.1 ENST00000274140.5 |
MARCH6
|
membrane-associated ring finger (C3HC4) 6, E3 ubiquitin protein ligase |
| chr16_+_50775948 | 2.24 |
ENST00000569681.1
ENST00000569418.1 ENST00000540145.1 |
CYLD
|
cylindromatosis (turban tumor syndrome) |
| chr12_-_49351303 | 2.23 |
ENST00000256682.4
|
ARF3
|
ADP-ribosylation factor 3 |
| chr6_-_79787902 | 2.22 |
ENST00000275034.4
|
PHIP
|
pleckstrin homology domain interacting protein |
| chrX_+_146993449 | 2.21 |
ENST00000218200.8
ENST00000370471.3 ENST00000370477.1 |
FMR1
|
fragile X mental retardation 1 |
| chr1_-_85156216 | 2.20 |
ENST00000342203.3
ENST00000370612.4 |
SSX2IP
|
synovial sarcoma, X breakpoint 2 interacting protein |
| chr2_-_43453734 | 2.18 |
ENST00000282388.3
|
ZFP36L2
|
ZFP36 ring finger protein-like 2 |
| chr7_+_65338230 | 2.16 |
ENST00000360768.3
|
VKORC1L1
|
vitamin K epoxide reductase complex, subunit 1-like 1 |
| chr6_-_154831779 | 2.15 |
ENST00000607772.1
|
CNKSR3
|
CNKSR family member 3 |
| chr19_+_30863271 | 2.11 |
ENST00000355537.3
|
ZNF536
|
zinc finger protein 536 |
| chr17_+_65821780 | 2.09 |
ENST00000321892.4
ENST00000335221.5 ENST00000306378.6 |
BPTF
|
bromodomain PHD finger transcription factor |
| chr5_+_140261703 | 2.09 |
ENST00000409494.1
ENST00000289272.2 |
PCDHA13
|
protocadherin alpha 13 |
| chrY_+_15016725 | 2.08 |
ENST00000336079.3
|
DDX3Y
|
DEAD (Asp-Glu-Ala-Asp) box helicase 3, Y-linked |
| chr3_-_133380731 | 2.06 |
ENST00000260810.5
|
TOPBP1
|
topoisomerase (DNA) II binding protein 1 |
| chr17_-_62502639 | 2.06 |
ENST00000225792.5
ENST00000581697.1 ENST00000584279.1 ENST00000577922.1 |
DDX5
|
DEAD (Asp-Glu-Ala-Asp) box helicase 5 |
| chr13_-_36705425 | 2.03 |
ENST00000255448.4
ENST00000360631.3 ENST00000379892.4 |
DCLK1
|
doublecortin-like kinase 1 |
| chr5_-_95768973 | 2.03 |
ENST00000311106.3
|
PCSK1
|
proprotein convertase subtilisin/kexin type 1 |
| chr12_-_498620 | 2.01 |
ENST00000399788.2
ENST00000382815.4 |
KDM5A
|
lysine (K)-specific demethylase 5A |
| chr6_+_87865262 | 1.96 |
ENST00000369577.3
ENST00000518845.1 ENST00000339907.4 ENST00000496806.2 |
ZNF292
|
zinc finger protein 292 |
| chr9_-_80646374 | 1.96 |
ENST00000286548.4
|
GNAQ
|
guanine nucleotide binding protein (G protein), q polypeptide |
| chr7_-_105029329 | 1.95 |
ENST00000393651.3
ENST00000460391.1 |
SRPK2
|
SRSF protein kinase 2 |
| chr22_-_22221900 | 1.95 |
ENST00000215832.6
ENST00000398822.3 |
MAPK1
|
mitogen-activated protein kinase 1 |
| chr15_+_43803143 | 1.94 |
ENST00000382031.1
|
MAP1A
|
microtubule-associated protein 1A |
| chr5_+_34929677 | 1.90 |
ENST00000342382.4
ENST00000382021.2 ENST00000303525.7 |
DNAJC21
|
DnaJ (Hsp40) homolog, subfamily C, member 21 |
| chr3_+_23986748 | 1.88 |
ENST00000312521.4
|
NR1D2
|
nuclear receptor subfamily 1, group D, member 2 |
| chrX_+_46306624 | 1.88 |
ENST00000360017.5
|
KRBOX4
|
KRAB box domain containing 4 |
| chr2_-_225811747 | 1.86 |
ENST00000409592.3
|
DOCK10
|
dedicator of cytokinesis 10 |
| chr2_-_160472952 | 1.86 |
ENST00000541068.2
ENST00000355831.2 ENST00000343439.5 ENST00000392782.1 |
BAZ2B
|
bromodomain adjacent to zinc finger domain, 2B |
| chr9_+_103204553 | 1.85 |
ENST00000502978.1
ENST00000334943.6 |
MSANTD3-TMEFF1
TMEFF1
|
MSANTD3-TMEFF1 readthrough transmembrane protein with EGF-like and two follistatin-like domains 1 |
| chr13_-_31038370 | 1.84 |
ENST00000399489.1
ENST00000339872.4 |
HMGB1
|
high mobility group box 1 |
| chr1_+_40627038 | 1.83 |
ENST00000372771.4
|
RLF
|
rearranged L-myc fusion |
| chr5_+_133861790 | 1.83 |
ENST00000395003.1
|
PHF15
|
jade family PHD finger 2 |
| chr17_+_45608430 | 1.82 |
ENST00000322157.4
|
NPEPPS
|
aminopeptidase puromycin sensitive |
| chr10_-_98346801 | 1.81 |
ENST00000371142.4
|
TM9SF3
|
transmembrane 9 superfamily member 3 |
| chr15_-_49447835 | 1.75 |
ENST00000388901.5
ENST00000299259.6 |
COPS2
|
COP9 signalosome subunit 2 |
| chr5_-_1524015 | 1.73 |
ENST00000283415.3
|
LPCAT1
|
lysophosphatidylcholine acyltransferase 1 |
| chr7_+_12250886 | 1.72 |
ENST00000444443.1
ENST00000396667.3 |
TMEM106B
|
transmembrane protein 106B |
| chrX_+_40944871 | 1.71 |
ENST00000378308.2
ENST00000324545.8 |
USP9X
|
ubiquitin specific peptidase 9, X-linked |
| chr14_+_74111578 | 1.69 |
ENST00000554113.1
ENST00000555631.2 ENST00000553645.2 ENST00000311089.3 ENST00000555919.3 ENST00000554339.1 ENST00000554871.1 |
DNAL1
|
dynein, axonemal, light chain 1 |
| chr2_-_202316260 | 1.65 |
ENST00000332624.3
|
TRAK2
|
trafficking protein, kinesin binding 2 |
| chr1_+_101702417 | 1.64 |
ENST00000305352.6
|
S1PR1
|
sphingosine-1-phosphate receptor 1 |
| chr1_-_84464780 | 1.64 |
ENST00000260505.8
|
TTLL7
|
tubulin tyrosine ligase-like family, member 7 |
| chr10_-_15210666 | 1.63 |
ENST00000378165.4
|
NMT2
|
N-myristoyltransferase 2 |
| chr3_+_32147997 | 1.62 |
ENST00000282541.5
|
GPD1L
|
glycerol-3-phosphate dehydrogenase 1-like |
| chr1_+_97187318 | 1.61 |
ENST00000609116.1
ENST00000370198.1 ENST00000370197.1 ENST00000426398.2 ENST00000394184.3 |
PTBP2
|
polypyrimidine tract binding protein 2 |
| chr4_-_17513702 | 1.61 |
ENST00000428702.2
ENST00000508623.1 ENST00000513615.1 |
QDPR
|
quinoid dihydropteridine reductase |
| chr6_-_90062543 | 1.60 |
ENST00000435041.2
|
UBE2J1
|
ubiquitin-conjugating enzyme E2, J1 |
| chr12_+_70636765 | 1.59 |
ENST00000552231.1
ENST00000229195.3 ENST00000547780.1 ENST00000418359.3 |
CNOT2
|
CCR4-NOT transcription complex, subunit 2 |
| chr9_+_91933407 | 1.58 |
ENST00000375807.3
ENST00000339901.4 |
SECISBP2
|
SECIS binding protein 2 |
| chr5_+_102455853 | 1.57 |
ENST00000515845.1
ENST00000321521.9 ENST00000507921.1 |
PPIP5K2
|
diphosphoinositol pentakisphosphate kinase 2 |
| chr14_+_75745477 | 1.57 |
ENST00000303562.4
ENST00000554617.1 ENST00000554212.1 ENST00000535987.1 ENST00000555242.1 |
FOS
|
FBJ murine osteosarcoma viral oncogene homolog |
| chr1_-_78225482 | 1.55 |
ENST00000524778.1
ENST00000370794.3 ENST00000370793.1 ENST00000370792.3 |
USP33
|
ubiquitin specific peptidase 33 |
| chr20_+_37101455 | 1.55 |
ENST00000262879.6
ENST00000397042.3 ENST00000397038.1 ENST00000537204.1 |
RALGAPB
|
Ral GTPase activating protein, beta subunit (non-catalytic) |
| chr8_-_67525473 | 1.53 |
ENST00000522677.3
|
MYBL1
|
v-myb avian myeloblastosis viral oncogene homolog-like 1 |
| chr5_-_171615315 | 1.51 |
ENST00000176763.5
|
STK10
|
serine/threonine kinase 10 |
| chr6_+_138483058 | 1.48 |
ENST00000251691.4
|
KIAA1244
|
KIAA1244 |
| chr10_-_3827417 | 1.48 |
ENST00000497571.1
ENST00000542957.1 |
KLF6
|
Kruppel-like factor 6 |
| chr12_-_124457371 | 1.48 |
ENST00000238156.3
ENST00000545037.1 |
CCDC92
|
coiled-coil domain containing 92 |
| chr5_-_111093406 | 1.46 |
ENST00000379671.3
|
NREP
|
neuronal regeneration related protein |
| chr3_-_197476560 | 1.46 |
ENST00000273582.5
|
KIAA0226
|
KIAA0226 |
| chr3_-_142166904 | 1.45 |
ENST00000264951.4
|
XRN1
|
5'-3' exoribonuclease 1 |
| chr11_-_85780086 | 1.44 |
ENST00000532317.1
ENST00000528256.1 ENST00000526033.1 |
PICALM
|
phosphatidylinositol binding clathrin assembly protein |
| chr10_-_735553 | 1.44 |
ENST00000280886.6
ENST00000423550.1 |
DIP2C
|
DIP2 disco-interacting protein 2 homolog C (Drosophila) |
| chr17_+_2496971 | 1.41 |
ENST00000397195.5
|
PAFAH1B1
|
platelet-activating factor acetylhydrolase 1b, regulatory subunit 1 (45kDa) |
| chr11_+_107879459 | 1.41 |
ENST00000393094.2
|
CUL5
|
cullin 5 |
Network of associatons between targets according to the STRING database.

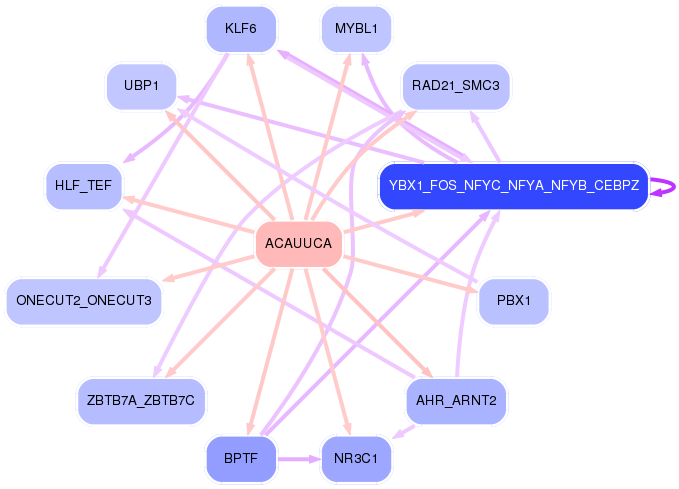
First level regulatory network of ACAUUCA
Gene Ontology Analysis
Gene overrepresentation in biological_process category:
| Log-likelihood per target | Total log-likelihood | Term | Description |
|---|---|---|---|
| 2.5 | 12.5 | GO:0099590 | neurotransmitter receptor internalization(GO:0099590) |
| 1.8 | 5.5 | GO:0048170 | positive regulation of long-term neuronal synaptic plasticity(GO:0048170) |
| 1.8 | 5.4 | GO:2000374 | regulation of oxygen metabolic process(GO:2000374) |
| 1.5 | 6.1 | GO:0030644 | cellular chloride ion homeostasis(GO:0030644) |
| 1.3 | 7.8 | GO:0090170 | regulation of Golgi inheritance(GO:0090170) |
| 1.3 | 3.8 | GO:0002276 | basophil activation involved in immune response(GO:0002276) |
| 1.2 | 3.7 | GO:0035948 | positive regulation of gluconeogenesis by positive regulation of transcription from RNA polymerase II promoter(GO:0035948) |
| 1.2 | 6.0 | GO:0090258 | negative regulation of mitochondrial fission(GO:0090258) |
| 1.2 | 5.8 | GO:0045906 | negative regulation of vasoconstriction(GO:0045906) |
| 1.0 | 8.2 | GO:0032482 | Rab protein signal transduction(GO:0032482) |
| 1.0 | 6.1 | GO:2000324 | positive regulation of glucocorticoid receptor signaling pathway(GO:2000324) |
| 1.0 | 3.1 | GO:0072425 | signal transduction involved in G2 DNA damage checkpoint(GO:0072425) signal transduction involved in mitotic G2 DNA damage checkpoint(GO:0072434) telomerase catalytic core complex assembly(GO:1904868) regulation of telomerase catalytic core complex assembly(GO:1904882) positive regulation of telomerase catalytic core complex assembly(GO:1904884) |
| 1.0 | 4.8 | GO:1990034 | calcium ion export from cell(GO:1990034) |
| 0.9 | 2.8 | GO:0090526 | regulation of gluconeogenesis involved in cellular glucose homeostasis(GO:0090526) |
| 0.9 | 3.6 | GO:0044821 | meiotic telomere tethering at nuclear periphery(GO:0044821) meiotic attachment of telomere to nuclear envelope(GO:0070197) chromosome attachment to the nuclear envelope(GO:0097240) |
| 0.8 | 5.8 | GO:0090204 | protein localization to nuclear pore(GO:0090204) |
| 0.8 | 2.4 | GO:0070837 | dehydroascorbic acid transport(GO:0070837) |
| 0.8 | 7.9 | GO:0031547 | brain-derived neurotrophic factor receptor signaling pathway(GO:0031547) |
| 0.8 | 2.3 | GO:0035937 | estrogen secretion(GO:0035937) estradiol secretion(GO:0035938) regulation of estrogen secretion(GO:2000861) regulation of estradiol secretion(GO:2000864) |
| 0.8 | 3.1 | GO:0019046 | release from viral latency(GO:0019046) |
| 0.7 | 2.2 | GO:1990108 | protein linear deubiquitination(GO:1990108) |
| 0.7 | 4.3 | GO:0070560 | protein secretion by platelet(GO:0070560) |
| 0.7 | 2.1 | GO:0048387 | negative regulation of retinoic acid receptor signaling pathway(GO:0048387) |
| 0.7 | 1.4 | GO:0036215 | response to stem cell factor(GO:0036215) cellular response to stem cell factor stimulus(GO:0036216) Kit signaling pathway(GO:0038109) |
| 0.7 | 2.7 | GO:0061092 | regulation of phospholipid translocation(GO:0061091) positive regulation of phospholipid translocation(GO:0061092) |
| 0.7 | 6.8 | GO:0072386 | plus-end-directed organelle transport along microtubule(GO:0072386) |
| 0.7 | 5.3 | GO:0038028 | insulin receptor signaling pathway via phosphatidylinositol 3-kinase(GO:0038028) |
| 0.7 | 4.0 | GO:0032328 | alanine transport(GO:0032328) |
| 0.7 | 3.9 | GO:0090435 | protein localization to nuclear envelope(GO:0090435) |
| 0.6 | 2.5 | GO:0031291 | Ran protein signal transduction(GO:0031291) |
| 0.6 | 4.8 | GO:1901725 | regulation of histone deacetylase activity(GO:1901725) |
| 0.6 | 2.3 | GO:0035616 | histone H2B conserved C-terminal lysine deubiquitination(GO:0035616) |
| 0.6 | 1.7 | GO:2001245 | regulation of phosphatidylcholine biosynthetic process(GO:2001245) |
| 0.6 | 2.9 | GO:1900246 | positive regulation of RIG-I signaling pathway(GO:1900246) |
| 0.6 | 4.5 | GO:0051388 | positive regulation of neurotrophin TRK receptor signaling pathway(GO:0051388) |
| 0.6 | 6.7 | GO:1901223 | negative regulation of NIK/NF-kappaB signaling(GO:1901223) |
| 0.6 | 1.7 | GO:0098935 | dendritic transport(GO:0098935) anterograde dendritic transport(GO:0098937) |
| 0.5 | 4.4 | GO:0032510 | endosome to lysosome transport via multivesicular body sorting pathway(GO:0032510) |
| 0.5 | 1.6 | GO:0003241 | growth involved in heart morphogenesis(GO:0003241) |
| 0.5 | 1.6 | GO:0018201 | N-terminal peptidyl-glycine N-myristoylation(GO:0018008) peptidyl-glycine modification(GO:0018201) |
| 0.5 | 1.6 | GO:0051066 | dihydrobiopterin metabolic process(GO:0051066) |
| 0.5 | 4.2 | GO:0006013 | mannose metabolic process(GO:0006013) |
| 0.5 | 3.9 | GO:0031087 | deadenylation-independent decapping of nuclear-transcribed mRNA(GO:0031087) |
| 0.5 | 1.4 | GO:0071409 | cellular response to cycloheximide(GO:0071409) |
| 0.5 | 2.4 | GO:0017055 | negative regulation of RNA polymerase II transcriptional preinitiation complex assembly(GO:0017055) |
| 0.5 | 3.6 | GO:0097116 | gephyrin clustering involved in postsynaptic density assembly(GO:0097116) |
| 0.5 | 8.2 | GO:0061162 | establishment of monopolar cell polarity(GO:0061162) establishment or maintenance of monopolar cell polarity(GO:0061339) |
| 0.5 | 1.4 | GO:0023016 | signal transduction by trans-phosphorylation(GO:0023016) |
| 0.5 | 5.4 | GO:0070070 | proton-transporting V-type ATPase complex assembly(GO:0070070) vacuolar proton-transporting V-type ATPase complex assembly(GO:0070072) |
| 0.4 | 2.7 | GO:0010748 | regulation of plasma membrane long-chain fatty acid transport(GO:0010746) negative regulation of plasma membrane long-chain fatty acid transport(GO:0010748) |
| 0.4 | 2.2 | GO:2000301 | regulation of intracellular transport of viral material(GO:1901252) negative regulation of synaptic vesicle exocytosis(GO:2000301) |
| 0.4 | 4.3 | GO:0005981 | regulation of glycogen catabolic process(GO:0005981) |
| 0.4 | 1.2 | GO:1904395 | positive regulation of skeletal muscle acetylcholine-gated channel clustering(GO:1904395) |
| 0.4 | 2.1 | GO:0033314 | mitotic DNA replication checkpoint(GO:0033314) |
| 0.4 | 1.6 | GO:0006072 | glycerol-3-phosphate metabolic process(GO:0006072) negative regulation of protein kinase C signaling(GO:0090038) |
| 0.4 | 2.0 | GO:0035063 | nuclear speck organization(GO:0035063) |
| 0.4 | 4.2 | GO:0090091 | positive regulation of extracellular matrix disassembly(GO:0090091) regulation of basement membrane assembly involved in embryonic body morphogenesis(GO:1904259) positive regulation of basement membrane assembly involved in embryonic body morphogenesis(GO:1904261) basement membrane assembly involved in embryonic body morphogenesis(GO:2001197) |
| 0.4 | 7.6 | GO:0071420 | cellular response to histamine(GO:0071420) |
| 0.4 | 2.6 | GO:0002175 | protein localization to paranode region of axon(GO:0002175) |
| 0.4 | 1.1 | GO:0097156 | fasciculation of motor neuron axon(GO:0097156) |
| 0.4 | 0.8 | GO:0060024 | rhythmic synaptic transmission(GO:0060024) |
| 0.4 | 1.9 | GO:2000973 | regulation of pro-B cell differentiation(GO:2000973) |
| 0.4 | 2.9 | GO:0090292 | nuclear matrix anchoring at nuclear membrane(GO:0090292) |
| 0.4 | 1.4 | GO:1902963 | regulation of metalloendopeptidase activity involved in amyloid precursor protein catabolic process(GO:1902962) negative regulation of metalloendopeptidase activity involved in amyloid precursor protein catabolic process(GO:1902963) |
| 0.4 | 0.7 | GO:2000182 | regulation of progesterone biosynthetic process(GO:2000182) |
| 0.3 | 1.0 | GO:0080182 | histone H3-K4 trimethylation(GO:0080182) |
| 0.3 | 3.4 | GO:0036010 | protein localization to endosome(GO:0036010) |
| 0.3 | 1.0 | GO:1900169 | regulation of glucocorticoid mediated signaling pathway(GO:1900169) |
| 0.3 | 1.0 | GO:1903371 | regulation of endoplasmic reticulum tubular network organization(GO:1903371) |
| 0.3 | 3.2 | GO:0071763 | nuclear membrane organization(GO:0071763) |
| 0.3 | 2.2 | GO:1904628 | response to phorbol 13-acetate 12-myristate(GO:1904627) cellular response to phorbol 13-acetate 12-myristate(GO:1904628) |
| 0.3 | 1.2 | GO:0072369 | regulation of lipid transport by positive regulation of transcription from RNA polymerase II promoter(GO:0072369) |
| 0.3 | 1.2 | GO:0031339 | negative regulation of vesicle fusion(GO:0031339) |
| 0.3 | 2.9 | GO:0051152 | positive regulation of smooth muscle cell differentiation(GO:0051152) |
| 0.3 | 5.5 | GO:1901897 | regulation of relaxation of cardiac muscle(GO:1901897) |
| 0.3 | 1.2 | GO:0021896 | forebrain astrocyte differentiation(GO:0021896) forebrain astrocyte development(GO:0021897) |
| 0.3 | 1.4 | GO:0051661 | maintenance of centrosome location(GO:0051661) |
| 0.3 | 0.8 | GO:0099550 | trans-synaptic signalling, modulating synaptic transmission(GO:0099550) trans-synaptic signaling by lipid, modulating synaptic transmission(GO:0099552) trans-synaptic signaling by endocannabinoid, modulating synaptic transmission(GO:0099553) |
| 0.3 | 1.6 | GO:0018095 | protein polyglutamylation(GO:0018095) |
| 0.3 | 0.8 | GO:0006679 | glucosylceramide biosynthetic process(GO:0006679) |
| 0.3 | 1.9 | GO:0010606 | positive regulation of cytoplasmic mRNA processing body assembly(GO:0010606) |
| 0.3 | 0.3 | GO:1901166 | neural crest cell migration involved in autonomic nervous system development(GO:1901166) |
| 0.3 | 2.1 | GO:0001661 | conditioned taste aversion(GO:0001661) |
| 0.3 | 0.8 | GO:0014887 | muscle hypertrophy in response to stress(GO:0003299) cardiac muscle adaptation(GO:0014887) cardiac muscle hypertrophy in response to stress(GO:0014898) |
| 0.3 | 11.8 | GO:0035235 | ionotropic glutamate receptor signaling pathway(GO:0035235) |
| 0.3 | 12.7 | GO:0035329 | hippo signaling(GO:0035329) |
| 0.3 | 0.8 | GO:0001923 | B-1 B cell differentiation(GO:0001923) |
| 0.2 | 2.2 | GO:0035020 | regulation of Rac protein signal transduction(GO:0035020) |
| 0.2 | 3.1 | GO:2001135 | regulation of endocytic recycling(GO:2001135) |
| 0.2 | 38.6 | GO:0007156 | homophilic cell adhesion via plasma membrane adhesion molecules(GO:0007156) |
| 0.2 | 0.7 | GO:1902809 | skeletal muscle fiber differentiation(GO:0098528) regulation of skeletal muscle fiber differentiation(GO:1902809) |
| 0.2 | 1.8 | GO:0002315 | marginal zone B cell differentiation(GO:0002315) |
| 0.2 | 0.9 | GO:0060335 | positive regulation of response to interferon-gamma(GO:0060332) positive regulation of interferon-gamma-mediated signaling pathway(GO:0060335) |
| 0.2 | 4.2 | GO:0032012 | regulation of ARF protein signal transduction(GO:0032012) |
| 0.2 | 0.9 | GO:0044861 | protein transport into plasma membrane raft(GO:0044861) |
| 0.2 | 2.0 | GO:0060158 | phospholipase C-activating dopamine receptor signaling pathway(GO:0060158) |
| 0.2 | 2.2 | GO:0042373 | vitamin K metabolic process(GO:0042373) |
| 0.2 | 2.4 | GO:2001032 | regulation of double-strand break repair via nonhomologous end joining(GO:2001032) |
| 0.2 | 10.9 | GO:0010501 | RNA secondary structure unwinding(GO:0010501) |
| 0.2 | 1.0 | GO:0043402 | glucocorticoid mediated signaling pathway(GO:0043402) |
| 0.2 | 1.2 | GO:0045876 | positive regulation of sister chromatid cohesion(GO:0045876) |
| 0.2 | 0.6 | GO:0061010 | gall bladder development(GO:0061010) |
| 0.2 | 3.2 | GO:0090361 | platelet-derived growth factor production(GO:0090360) regulation of platelet-derived growth factor production(GO:0090361) |
| 0.2 | 0.6 | GO:0071034 | CUT catabolic process(GO:0071034) CUT metabolic process(GO:0071043) polyadenylation-dependent snoRNA 3'-end processing(GO:0071051) |
| 0.2 | 1.4 | GO:0043353 | enucleate erythrocyte differentiation(GO:0043353) |
| 0.2 | 0.4 | GO:1990036 | regulation of calcium ion-dependent exocytosis of neurotransmitter(GO:1903233) calcium ion import into sarcoplasmic reticulum(GO:1990036) |
| 0.2 | 4.1 | GO:1902857 | positive regulation of nonmotile primary cilium assembly(GO:1902857) |
| 0.2 | 0.7 | GO:0033563 | dorsal/ventral axon guidance(GO:0033563) |
| 0.2 | 1.8 | GO:0015074 | DNA integration(GO:0015074) |
| 0.2 | 3.5 | GO:0035855 | megakaryocyte development(GO:0035855) |
| 0.2 | 1.6 | GO:2000623 | regulation of nuclear-transcribed mRNA catabolic process, nonsense-mediated decay(GO:2000622) negative regulation of nuclear-transcribed mRNA catabolic process, nonsense-mediated decay(GO:2000623) |
| 0.2 | 0.7 | GO:0048681 | negative regulation of axon regeneration(GO:0048681) |
| 0.2 | 0.5 | GO:0060940 | epithelial to mesenchymal transition involved in cardiac fibroblast development(GO:0060940) |
| 0.2 | 0.5 | GO:0043490 | malate-aspartate shuttle(GO:0043490) |
| 0.2 | 0.2 | GO:1902938 | regulation of intracellular calcium activated chloride channel activity(GO:1902938) |
| 0.2 | 1.0 | GO:0071233 | cellular response to leucine(GO:0071233) |
| 0.2 | 4.5 | GO:0000470 | maturation of LSU-rRNA(GO:0000470) |
| 0.2 | 2.3 | GO:0090168 | Golgi reassembly(GO:0090168) |
| 0.1 | 0.9 | GO:0015853 | adenine transport(GO:0015853) |
| 0.1 | 1.7 | GO:0036158 | outer dynein arm assembly(GO:0036158) |
| 0.1 | 1.4 | GO:0039536 | negative regulation of RIG-I signaling pathway(GO:0039536) |
| 0.1 | 1.2 | GO:0060235 | lens induction in camera-type eye(GO:0060235) |
| 0.1 | 4.0 | GO:0006376 | mRNA splice site selection(GO:0006376) |
| 0.1 | 1.1 | GO:0070601 | centromeric sister chromatid cohesion(GO:0070601) |
| 0.1 | 2.3 | GO:1904355 | positive regulation of telomere capping(GO:1904355) |
| 0.1 | 0.7 | GO:0061088 | regulation of sequestering of zinc ion(GO:0061088) |
| 0.1 | 2.8 | GO:0071108 | protein K48-linked deubiquitination(GO:0071108) |
| 0.1 | 0.8 | GO:0061158 | 3'-UTR-mediated mRNA destabilization(GO:0061158) |
| 0.1 | 0.5 | GO:0006391 | transcription initiation from mitochondrial promoter(GO:0006391) |
| 0.1 | 2.2 | GO:0043568 | positive regulation of insulin-like growth factor receptor signaling pathway(GO:0043568) |
| 0.1 | 0.8 | GO:1904153 | negative regulation of protein exit from endoplasmic reticulum(GO:0070862) negative regulation of retrograde protein transport, ER to cytosol(GO:1904153) |
| 0.1 | 0.5 | GO:0006203 | dGTP catabolic process(GO:0006203) |
| 0.1 | 1.8 | GO:0000338 | protein deneddylation(GO:0000338) |
| 0.1 | 3.2 | GO:0048025 | negative regulation of mRNA splicing, via spliceosome(GO:0048025) |
| 0.1 | 2.4 | GO:0051642 | centrosome localization(GO:0051642) |
| 0.1 | 1.4 | GO:0045793 | positive regulation of cell size(GO:0045793) |
| 0.1 | 0.5 | GO:0090050 | positive regulation of cell migration involved in sprouting angiogenesis(GO:0090050) |
| 0.1 | 13.1 | GO:0048675 | axon extension(GO:0048675) |
| 0.1 | 0.1 | GO:0034067 | protein localization to Golgi apparatus(GO:0034067) |
| 0.1 | 1.9 | GO:2001014 | regulation of skeletal muscle cell differentiation(GO:2001014) |
| 0.1 | 1.4 | GO:0010971 | positive regulation of G2/M transition of mitotic cell cycle(GO:0010971) |
| 0.1 | 0.4 | GO:0033634 | positive regulation of cell-cell adhesion mediated by integrin(GO:0033634) |
| 0.1 | 0.9 | GO:0051597 | response to methylmercury(GO:0051597) |
| 0.1 | 4.2 | GO:0046579 | positive regulation of Ras protein signal transduction(GO:0046579) |
| 0.1 | 0.5 | GO:0033078 | extrathymic T cell differentiation(GO:0033078) |
| 0.1 | 2.8 | GO:0034243 | regulation of transcription elongation from RNA polymerase II promoter(GO:0034243) |
| 0.1 | 0.3 | GO:0061187 | regulation of chromatin silencing at rDNA(GO:0061187) negative regulation of chromatin silencing at rDNA(GO:0061188) |
| 0.1 | 1.4 | GO:0070493 | thrombin receptor signaling pathway(GO:0070493) |
| 0.1 | 1.3 | GO:0070389 | chaperone cofactor-dependent protein refolding(GO:0070389) |
| 0.1 | 0.9 | GO:0033182 | regulation of histone ubiquitination(GO:0033182) |
| 0.1 | 0.3 | GO:0006269 | DNA replication, synthesis of RNA primer(GO:0006269) |
| 0.1 | 1.0 | GO:0045292 | mRNA cis splicing, via spliceosome(GO:0045292) |
| 0.1 | 0.2 | GO:0006428 | isoleucyl-tRNA aminoacylation(GO:0006428) |
| 0.1 | 6.7 | GO:1901379 | regulation of potassium ion transmembrane transport(GO:1901379) |
| 0.1 | 1.0 | GO:0060999 | positive regulation of dendritic spine development(GO:0060999) |
| 0.1 | 2.1 | GO:1904380 | endoplasmic reticulum mannose trimming(GO:1904380) |
| 0.1 | 2.1 | GO:0046856 | phosphatidylinositol dephosphorylation(GO:0046856) |
| 0.1 | 1.1 | GO:0034063 | stress granule assembly(GO:0034063) |
| 0.1 | 0.9 | GO:0016081 | synaptic vesicle docking(GO:0016081) |
| 0.1 | 0.7 | GO:0045602 | negative regulation of endothelial cell differentiation(GO:0045602) |
| 0.1 | 0.8 | GO:0009414 | response to water deprivation(GO:0009414) |
| 0.1 | 1.1 | GO:0045116 | protein neddylation(GO:0045116) |
| 0.1 | 0.7 | GO:0051574 | positive regulation of histone H3-K9 methylation(GO:0051574) |
| 0.1 | 3.3 | GO:0007212 | dopamine receptor signaling pathway(GO:0007212) |
| 0.1 | 0.3 | GO:0042636 | negative regulation of hair cycle(GO:0042636) |
| 0.1 | 0.3 | GO:0021610 | facial nerve development(GO:0021561) facial nerve morphogenesis(GO:0021610) |
| 0.1 | 0.3 | GO:1904885 | beta-catenin destruction complex assembly(GO:1904885) |
| 0.1 | 1.0 | GO:0034497 | protein localization to pre-autophagosomal structure(GO:0034497) |
| 0.1 | 0.3 | GO:0032467 | positive regulation of cytokinesis(GO:0032467) |
| 0.1 | 0.7 | GO:1901798 | positive regulation of signal transduction by p53 class mediator(GO:1901798) |
| 0.1 | 0.6 | GO:0030322 | stabilization of membrane potential(GO:0030322) |
| 0.1 | 0.6 | GO:0021869 | forebrain ventricular zone progenitor cell division(GO:0021869) |
| 0.1 | 0.7 | GO:0061157 | mRNA destabilization(GO:0061157) |
| 0.1 | 1.1 | GO:2000369 | regulation of clathrin-mediated endocytosis(GO:2000369) |
| 0.1 | 0.3 | GO:0030578 | PML body organization(GO:0030578) |
| 0.1 | 2.3 | GO:0035249 | synaptic transmission, glutamatergic(GO:0035249) |
| 0.1 | 0.6 | GO:0070977 | bone maturation(GO:0070977) |
| 0.1 | 1.8 | GO:0043171 | peptide catabolic process(GO:0043171) |
| 0.0 | 1.1 | GO:0035338 | long-chain fatty-acyl-CoA biosynthetic process(GO:0035338) |
| 0.0 | 0.4 | GO:0010265 | SCF complex assembly(GO:0010265) |
| 0.0 | 3.5 | GO:2001244 | positive regulation of intrinsic apoptotic signaling pathway(GO:2001244) |
| 0.0 | 0.2 | GO:0018231 | peptidyl-L-cysteine S-palmitoylation(GO:0018230) peptidyl-S-diacylglycerol-L-cysteine biosynthetic process from peptidyl-cysteine(GO:0018231) |
| 0.0 | 6.6 | GO:0048813 | dendrite morphogenesis(GO:0048813) |
| 0.0 | 4.6 | GO:0035335 | peptidyl-tyrosine dephosphorylation(GO:0035335) |
| 0.0 | 1.5 | GO:2000401 | regulation of lymphocyte migration(GO:2000401) |
| 0.0 | 0.1 | GO:0031587 | positive regulation of inositol 1,4,5-trisphosphate-sensitive calcium-release channel activity(GO:0031587) |
| 0.0 | 0.3 | GO:0034670 | chemotaxis to arachidonic acid(GO:0034670) response to arachidonic acid(GO:1904550) |
| 0.0 | 1.0 | GO:0036151 | phosphatidylcholine acyl-chain remodeling(GO:0036151) |
| 0.0 | 0.3 | GO:0001672 | regulation of chromatin assembly or disassembly(GO:0001672) |
| 0.0 | 1.8 | GO:0016486 | peptide hormone processing(GO:0016486) |
| 0.0 | 0.5 | GO:0032392 | DNA geometric change(GO:0032392) |
| 0.0 | 0.7 | GO:0045723 | positive regulation of fatty acid biosynthetic process(GO:0045723) |
| 0.0 | 0.2 | GO:0006655 | phosphatidylglycerol biosynthetic process(GO:0006655) |
| 0.0 | 2.4 | GO:0045445 | myoblast differentiation(GO:0045445) |
| 0.0 | 3.2 | GO:0006890 | retrograde vesicle-mediated transport, Golgi to ER(GO:0006890) |
| 0.0 | 2.5 | GO:0010923 | negative regulation of phosphatase activity(GO:0010923) |
| 0.0 | 0.5 | GO:0032506 | cytokinetic process(GO:0032506) |
| 0.0 | 1.3 | GO:0042073 | intraciliary transport(GO:0042073) |
| 0.0 | 0.2 | GO:0060213 | regulation of nuclear-transcribed mRNA poly(A) tail shortening(GO:0060211) positive regulation of nuclear-transcribed mRNA poly(A) tail shortening(GO:0060213) |
| 0.0 | 0.5 | GO:2000651 | positive regulation of sodium ion transmembrane transporter activity(GO:2000651) |
| 0.0 | 0.3 | GO:0035066 | positive regulation of histone acetylation(GO:0035066) positive regulation of peptidyl-lysine acetylation(GO:2000758) |
| 0.0 | 4.6 | GO:0006805 | xenobiotic metabolic process(GO:0006805) |
| 0.0 | 0.7 | GO:0006693 | prostanoid metabolic process(GO:0006692) prostaglandin metabolic process(GO:0006693) |
| 0.0 | 0.6 | GO:0003016 | respiratory system process(GO:0003016) |
| 0.0 | 0.6 | GO:1990089 | response to nerve growth factor(GO:1990089) cellular response to nerve growth factor stimulus(GO:1990090) |
| 0.0 | 1.1 | GO:0070979 | protein K11-linked ubiquitination(GO:0070979) |
| 0.0 | 0.4 | GO:1902166 | negative regulation of intrinsic apoptotic signaling pathway in response to DNA damage by p53 class mediator(GO:1902166) |
| 0.0 | 1.2 | GO:0038128 | ERBB2 signaling pathway(GO:0038128) |
| 0.0 | 0.3 | GO:0016048 | detection of temperature stimulus(GO:0016048) |
| 0.0 | 0.3 | GO:0044804 | nucleophagy(GO:0044804) |
| 0.0 | 0.1 | GO:0045586 | regulation of gamma-delta T cell differentiation(GO:0045586) |
| 0.0 | 1.0 | GO:0021762 | substantia nigra development(GO:0021762) |
| 0.0 | 0.0 | GO:2000843 | androgen secretion(GO:0035935) testosterone secretion(GO:0035936) regulation of androgen secretion(GO:2000834) positive regulation of androgen secretion(GO:2000836) regulation of testosterone secretion(GO:2000843) positive regulation of testosterone secretion(GO:2000845) |
| 0.0 | 2.6 | GO:0044070 | regulation of anion transport(GO:0044070) |
| 0.0 | 0.2 | GO:0044829 | positive regulation by host of viral genome replication(GO:0044829) |
| 0.0 | 0.4 | GO:0050772 | positive regulation of axonogenesis(GO:0050772) |
| 0.0 | 0.1 | GO:1990403 | embryonic brain development(GO:1990403) |
| 0.0 | 0.1 | GO:0090481 | pyrimidine nucleotide-sugar transmembrane transport(GO:0090481) |
| 0.0 | 0.2 | GO:0019388 | galactose catabolic process(GO:0019388) |
| 0.0 | 0.2 | GO:0021535 | cell migration in hindbrain(GO:0021535) |
| 0.0 | 0.0 | GO:1904016 | response to Thyroglobulin triiodothyronine(GO:1904016) |
| 0.0 | 0.6 | GO:0060966 | regulation of posttranscriptional gene silencing(GO:0060147) regulation of gene silencing by miRNA(GO:0060964) regulation of gene silencing by RNA(GO:0060966) |
| 0.0 | 0.6 | GO:0030206 | chondroitin sulfate biosynthetic process(GO:0030206) |
| 0.0 | 0.4 | GO:0015937 | coenzyme A biosynthetic process(GO:0015937) |
| 0.0 | 0.1 | GO:0015866 | ADP transport(GO:0015866) |
| 0.0 | 0.5 | GO:0007257 | activation of JUN kinase activity(GO:0007257) |
| 0.0 | 0.1 | GO:1901673 | regulation of mitotic spindle assembly(GO:1901673) |
| 0.0 | 0.6 | GO:0019985 | translesion synthesis(GO:0019985) |
| 0.0 | 2.5 | GO:0043523 | regulation of neuron apoptotic process(GO:0043523) |
| 0.0 | 1.0 | GO:0033138 | positive regulation of peptidyl-serine phosphorylation(GO:0033138) |
| 0.0 | 0.5 | GO:0000381 | regulation of alternative mRNA splicing, via spliceosome(GO:0000381) |
| 0.0 | 0.7 | GO:0031338 | regulation of vesicle fusion(GO:0031338) |
| 0.0 | 0.2 | GO:0051602 | response to electrical stimulus(GO:0051602) |
| 0.0 | 0.7 | GO:0038083 | peptidyl-tyrosine autophosphorylation(GO:0038083) |
| 0.0 | 1.0 | GO:1904667 | negative regulation of ubiquitin-protein ligase activity involved in mitotic cell cycle(GO:0051436) regulation of ubiquitin-protein ligase activity involved in mitotic cell cycle(GO:0051439) negative regulation of ubiquitin protein ligase activity(GO:1904667) |
| 0.0 | 0.1 | GO:0035878 | nail development(GO:0035878) |
| 0.0 | 0.1 | GO:0031584 | activation of phospholipase D activity(GO:0031584) |
| 0.0 | 2.7 | GO:0051056 | regulation of small GTPase mediated signal transduction(GO:0051056) |
| 0.0 | 0.1 | GO:0000098 | sulfur amino acid catabolic process(GO:0000098) |
Gene overrepresentation in cellular_component category:
| Log-likelihood per target | Total log-likelihood | Term | Description |
|---|---|---|---|
| 3.1 | 12.5 | GO:0070032 | synaptobrevin 2-SNAP-25-syntaxin-1a-complexin I complex(GO:0070032) |
| 2.5 | 12.4 | GO:0098843 | postsynaptic endocytic zone(GO:0098843) |
| 2.3 | 6.9 | GO:0043291 | RAVE complex(GO:0043291) |
| 1.7 | 6.8 | GO:0016939 | kinesin II complex(GO:0016939) |
| 1.3 | 6.7 | GO:0044308 | axonal spine(GO:0044308) |
| 1.2 | 6.0 | GO:0045298 | tubulin complex(GO:0045298) |
| 1.1 | 4.2 | GO:0005797 | Golgi medial cisterna(GO:0005797) |
| 1.0 | 4.2 | GO:0035838 | growing cell tip(GO:0035838) |
| 0.8 | 4.5 | GO:0070545 | PeBoW complex(GO:0070545) |
| 0.7 | 3.7 | GO:0042272 | nuclear RNA export factor complex(GO:0042272) |
| 0.7 | 2.2 | GO:0034657 | GID complex(GO:0034657) |
| 0.7 | 2.2 | GO:0019034 | viral replication complex(GO:0019034) |
| 0.7 | 4.2 | GO:0030981 | cortical microtubule cytoskeleton(GO:0030981) |
| 0.6 | 3.2 | GO:0035061 | perichromatin fibrils(GO:0005726) interchromatin granule(GO:0035061) |
| 0.6 | 8.0 | GO:0031209 | SCAR complex(GO:0031209) |
| 0.5 | 9.2 | GO:0000164 | protein phosphatase type 1 complex(GO:0000164) |
| 0.5 | 5.5 | GO:0060077 | inhibitory synapse(GO:0060077) |
| 0.4 | 3.7 | GO:0000125 | PCAF complex(GO:0000125) |
| 0.4 | 1.2 | GO:0000806 | Y chromosome(GO:0000806) |
| 0.3 | 4.5 | GO:0000815 | ESCRT III complex(GO:0000815) |
| 0.3 | 2.1 | GO:0000835 | ER ubiquitin ligase complex(GO:0000835) |
| 0.3 | 1.6 | GO:0030891 | VCB complex(GO:0030891) |
| 0.3 | 4.7 | GO:0044453 | integral component of nuclear inner membrane(GO:0005639) intrinsic component of nuclear inner membrane(GO:0031229) nuclear membrane part(GO:0044453) |
| 0.3 | 1.2 | GO:0000798 | nuclear cohesin complex(GO:0000798) |
| 0.3 | 2.1 | GO:0016589 | NURF complex(GO:0016589) |
| 0.3 | 0.9 | GO:0031372 | UBC13-MMS2 complex(GO:0031372) |
| 0.3 | 1.4 | GO:0005818 | astral microtubule(GO:0000235) aster(GO:0005818) |
| 0.3 | 1.4 | GO:0031466 | Cul5-RING ubiquitin ligase complex(GO:0031466) |
| 0.3 | 4.7 | GO:0031095 | platelet dense tubular network membrane(GO:0031095) |
| 0.3 | 2.7 | GO:0042584 | chromaffin granule membrane(GO:0042584) |
| 0.3 | 5.8 | GO:0016281 | eukaryotic translation initiation factor 4F complex(GO:0016281) |
| 0.3 | 4.8 | GO:0032591 | dendritic spine membrane(GO:0032591) |
| 0.2 | 6.1 | GO:0035371 | microtubule plus-end(GO:0035371) |
| 0.2 | 1.4 | GO:0070381 | endosome to plasma membrane transport vesicle(GO:0070381) |
| 0.2 | 2.9 | GO:0034992 | microtubule organizing center attachment site(GO:0034992) LINC complex(GO:0034993) |
| 0.2 | 1.3 | GO:0009331 | glycerol-3-phosphate dehydrogenase complex(GO:0009331) |
| 0.2 | 2.0 | GO:0019907 | cyclin-dependent protein kinase activating kinase holoenzyme complex(GO:0019907) |
| 0.2 | 7.7 | GO:1902711 | GABA-A receptor complex(GO:1902711) |
| 0.2 | 1.7 | GO:0036157 | outer dynein arm(GO:0036157) |
| 0.2 | 1.0 | GO:0071012 | catalytic step 1 spliceosome(GO:0071012) |
| 0.2 | 1.6 | GO:0035976 | AP1 complex(GO:0035976) |
| 0.2 | 1.9 | GO:0030015 | CCR4-NOT core complex(GO:0030015) |
| 0.2 | 1.1 | GO:0031313 | extrinsic component of endosome membrane(GO:0031313) |
| 0.2 | 2.4 | GO:0032433 | filopodium tip(GO:0032433) |
| 0.2 | 1.0 | GO:0072357 | PTW/PP1 phosphatase complex(GO:0072357) |
| 0.2 | 5.8 | GO:0032420 | stereocilium(GO:0032420) |
| 0.2 | 2.1 | GO:0001673 | male germ cell nucleus(GO:0001673) |
| 0.2 | 2.6 | GO:0033270 | paranode region of axon(GO:0033270) |
| 0.2 | 1.1 | GO:0031415 | NatA complex(GO:0031415) |
| 0.1 | 2.5 | GO:0005671 | Ada2/Gcn5/Ada3 transcription activator complex(GO:0005671) |
| 0.1 | 2.1 | GO:0035102 | PRC1 complex(GO:0035102) |
| 0.1 | 0.7 | GO:1990752 | microtubule end(GO:1990752) |
| 0.1 | 6.7 | GO:0019005 | SCF ubiquitin ligase complex(GO:0019005) |
| 0.1 | 2.5 | GO:0071782 | endoplasmic reticulum tubular network(GO:0071782) |
| 0.1 | 1.2 | GO:0070776 | H3 histone acetyltransferase complex(GO:0070775) MOZ/MORF histone acetyltransferase complex(GO:0070776) |
| 0.1 | 2.5 | GO:0044295 | axonal growth cone(GO:0044295) |
| 0.1 | 2.4 | GO:0032281 | AMPA glutamate receptor complex(GO:0032281) |
| 0.1 | 4.2 | GO:0033017 | sarcoplasmic reticulum membrane(GO:0033017) |
| 0.1 | 3.0 | GO:0032839 | dendrite cytoplasm(GO:0032839) |
| 0.1 | 10.1 | GO:0001750 | photoreceptor outer segment(GO:0001750) |
| 0.1 | 0.7 | GO:0030121 | AP-1 adaptor complex(GO:0030121) |
| 0.1 | 0.7 | GO:0072487 | MSL complex(GO:0072487) |
| 0.1 | 2.2 | GO:0012505 | endomembrane system(GO:0012505) |
| 0.1 | 2.0 | GO:0071141 | SMAD protein complex(GO:0071141) |
| 0.1 | 2.2 | GO:0034451 | centriolar satellite(GO:0034451) |
| 0.1 | 2.2 | GO:0097542 | ciliary tip(GO:0097542) |
| 0.1 | 3.3 | GO:0005834 | heterotrimeric G-protein complex(GO:0005834) |
| 0.1 | 1.0 | GO:0031618 | nuclear pericentric heterochromatin(GO:0031618) |
| 0.1 | 3.7 | GO:0030119 | AP-type membrane coat adaptor complex(GO:0030119) |
| 0.1 | 0.6 | GO:0070652 | HAUS complex(GO:0070652) |
| 0.1 | 3.3 | GO:0043198 | dendritic shaft(GO:0043198) |
| 0.1 | 4.6 | GO:0042734 | presynaptic membrane(GO:0042734) |
| 0.1 | 2.1 | GO:0005868 | cytoplasmic dynein complex(GO:0005868) |
| 0.1 | 5.2 | GO:0010008 | endosome membrane(GO:0010008) |
| 0.1 | 6.7 | GO:0000777 | condensed chromosome kinetochore(GO:0000777) |
| 0.1 | 1.3 | GO:0032391 | photoreceptor connecting cilium(GO:0032391) |
| 0.1 | 9.4 | GO:0000922 | spindle pole(GO:0000922) |
| 0.1 | 0.9 | GO:0031083 | BLOC-1 complex(GO:0031083) |
| 0.1 | 0.3 | GO:0030914 | STAGA complex(GO:0030914) |
| 0.1 | 3.9 | GO:0010494 | cytoplasmic stress granule(GO:0010494) |
| 0.1 | 2.1 | GO:0036464 | cytoplasmic ribonucleoprotein granule(GO:0036464) |
| 0.1 | 1.3 | GO:0035861 | site of double-strand break(GO:0035861) |
| 0.1 | 0.6 | GO:0000176 | nuclear exosome (RNase complex)(GO:0000176) |
| 0.0 | 0.4 | GO:0036056 | filtration diaphragm(GO:0036056) slit diaphragm(GO:0036057) |
| 0.0 | 0.1 | GO:0034676 | integrin alpha6-beta4 complex(GO:0034676) |
| 0.0 | 2.0 | GO:0009898 | cytoplasmic side of plasma membrane(GO:0009898) |
| 0.0 | 4.3 | GO:0034705 | voltage-gated potassium channel complex(GO:0008076) potassium channel complex(GO:0034705) |
| 0.0 | 11.4 | GO:0014069 | postsynaptic density(GO:0014069) postsynaptic specialization(GO:0099572) |
| 0.0 | 0.3 | GO:0005658 | alpha DNA polymerase:primase complex(GO:0005658) |
| 0.0 | 1.3 | GO:0031092 | platelet alpha granule membrane(GO:0031092) |
| 0.0 | 1.8 | GO:0008180 | COP9 signalosome(GO:0008180) |
| 0.0 | 4.0 | GO:0005819 | spindle(GO:0005819) |
| 0.0 | 14.8 | GO:0005815 | microtubule organizing center(GO:0005815) |
| 0.0 | 3.4 | GO:0030496 | midbody(GO:0030496) |
| 0.0 | 3.6 | GO:0017053 | transcriptional repressor complex(GO:0017053) |
| 0.0 | 0.1 | GO:0042405 | nuclear inclusion body(GO:0042405) |
| 0.0 | 0.4 | GO:0000124 | SAGA complex(GO:0000124) |
| 0.0 | 0.9 | GO:0035098 | ESC/E(Z) complex(GO:0035098) |
| 0.0 | 0.8 | GO:0034045 | pre-autophagosomal structure membrane(GO:0034045) |
| 0.0 | 3.2 | GO:0005758 | mitochondrial intermembrane space(GO:0005758) |
| 0.0 | 3.3 | GO:0030426 | growth cone(GO:0030426) |
| 0.0 | 1.1 | GO:0000159 | protein phosphatase type 2A complex(GO:0000159) |
| 0.0 | 0.3 | GO:1990589 | ATF4-CREB1 transcription factor complex(GO:1990589) |
| 0.0 | 4.6 | GO:0034702 | ion channel complex(GO:0034702) |
| 0.0 | 3.4 | GO:0000932 | cytoplasmic mRNA processing body(GO:0000932) |
| 0.0 | 0.2 | GO:0097136 | Bcl-2 family protein complex(GO:0097136) |
| 0.0 | 10.0 | GO:0005874 | microtubule(GO:0005874) |
| 0.0 | 1.3 | GO:0000123 | histone acetyltransferase complex(GO:0000123) |
| 0.0 | 1.4 | GO:0031941 | filamentous actin(GO:0031941) |
| 0.0 | 2.4 | GO:0101003 | ficolin-1-rich granule membrane(GO:0101003) |
| 0.0 | 1.2 | GO:0002102 | podosome(GO:0002102) |
| 0.0 | 12.4 | GO:0016607 | nuclear speck(GO:0016607) |
| 0.0 | 5.7 | GO:0005741 | mitochondrial outer membrane(GO:0005741) |
| 0.0 | 2.4 | GO:0031234 | extrinsic component of cytoplasmic side of plasma membrane(GO:0031234) |
| 0.0 | 4.3 | GO:0042383 | sarcolemma(GO:0042383) |
| 0.0 | 0.6 | GO:0035577 | azurophil granule membrane(GO:0035577) |
| 0.0 | 0.5 | GO:0060170 | ciliary membrane(GO:0060170) |
| 0.0 | 5.4 | GO:0031965 | nuclear membrane(GO:0031965) |
| 0.0 | 1.1 | GO:0036126 | sperm flagellum(GO:0036126) |
| 0.0 | 2.2 | GO:0016604 | nuclear body(GO:0016604) |
| 0.0 | 0.3 | GO:0005930 | axoneme(GO:0005930) ciliary plasm(GO:0097014) |
| 0.0 | 2.2 | GO:0055037 | recycling endosome(GO:0055037) |
| 0.0 | 0.5 | GO:0019897 | extrinsic component of plasma membrane(GO:0019897) |
| 0.0 | 1.7 | GO:0031902 | late endosome membrane(GO:0031902) |
| 0.0 | 0.6 | GO:0016592 | mediator complex(GO:0016592) |
| 0.0 | 0.2 | GO:0009986 | cell surface(GO:0009986) |
| 0.0 | 0.5 | GO:0042645 | nucleoid(GO:0009295) mitochondrial nucleoid(GO:0042645) |
| 0.0 | 2.3 | GO:0072562 | blood microparticle(GO:0072562) |
Gene overrepresentation in molecular_function category:
| Log-likelihood per target | Total log-likelihood | Term | Description |
|---|---|---|---|
| 3.3 | 9.9 | GO:0004157 | dihydropyrimidinase activity(GO:0004157) |
| 1.5 | 6.0 | GO:0099609 | microtubule lateral binding(GO:0099609) |
| 1.4 | 5.5 | GO:0005105 | type 1 fibroblast growth factor receptor binding(GO:0005105) |
| 1.2 | 3.6 | GO:0001069 | regulatory region RNA binding(GO:0001069) |
| 1.2 | 5.9 | GO:0034046 | poly(G) binding(GO:0034046) |
| 1.0 | 4.2 | GO:0043515 | kinetochore binding(GO:0043515) |
| 1.0 | 4.2 | GO:0035651 | AP-3 adaptor complex binding(GO:0035651) |
| 1.0 | 12.4 | GO:0004971 | AMPA glutamate receptor activity(GO:0004971) |
| 0.9 | 2.8 | GO:0016262 | protein N-acetylglucosaminyltransferase activity(GO:0016262) |
| 0.9 | 6.2 | GO:0050815 | phosphoserine binding(GO:0050815) |
| 0.8 | 2.4 | GO:0033300 | dehydroascorbic acid transporter activity(GO:0033300) |
| 0.8 | 4.0 | GO:1904315 | neurotransmitter receptor activity involved in regulation of postsynaptic membrane potential(GO:0099529) transmitter-gated ion channel activity involved in regulation of postsynaptic membrane potential(GO:1904315) |
| 0.7 | 3.7 | GO:0004468 | lysine N-acetyltransferase activity, acting on acetyl phosphate as donor(GO:0004468) |
| 0.7 | 6.9 | GO:0015385 | sodium:proton antiporter activity(GO:0015385) potassium:proton antiporter activity(GO:0015386) |
| 0.7 | 2.1 | GO:0035500 | MH2 domain binding(GO:0035500) |
| 0.6 | 1.8 | GO:0047192 | 1-alkylglycerophosphocholine O-acetyltransferase activity(GO:0047192) |
| 0.6 | 2.4 | GO:0043812 | phosphatidylinositol-4-phosphate phosphatase activity(GO:0043812) |
| 0.6 | 6.1 | GO:0022820 | potassium:chloride symporter activity(GO:0015379) potassium ion symporter activity(GO:0022820) |
| 0.5 | 1.6 | GO:0019107 | glycylpeptide N-tetradecanoyltransferase activity(GO:0004379) myristoyltransferase activity(GO:0019107) |
| 0.5 | 2.2 | GO:0016900 | oxidoreductase activity, acting on the CH-OH group of donors, disulfide as acceptor(GO:0016900) vitamin-K-epoxide reductase (warfarin-sensitive) activity(GO:0047057) |
| 0.5 | 3.1 | GO:0004677 | DNA-dependent protein kinase activity(GO:0004677) |
| 0.5 | 2.0 | GO:0005057 | receptor signaling protein activity(GO:0005057) |
| 0.5 | 4.1 | GO:0045504 | dynein heavy chain binding(GO:0045504) |
| 0.5 | 2.0 | GO:0034648 | histone demethylase activity (H3-dimethyl-K4 specific)(GO:0034648) |
| 0.5 | 4.7 | GO:0005225 | volume-sensitive anion channel activity(GO:0005225) |
| 0.5 | 2.3 | GO:0061665 | SUMO ligase activity(GO:0061665) |
| 0.4 | 5.2 | GO:0031821 | G-protein coupled serotonin receptor binding(GO:0031821) |
| 0.4 | 12.5 | GO:0017075 | syntaxin-1 binding(GO:0017075) |
| 0.4 | 2.3 | GO:0061649 | ubiquitinated histone binding(GO:0061649) |
| 0.4 | 5.3 | GO:0017162 | aryl hydrocarbon receptor binding(GO:0017162) |
| 0.4 | 5.3 | GO:0004723 | calcium-dependent protein serine/threonine phosphatase activity(GO:0004723) |
| 0.4 | 8.6 | GO:0034237 | protein kinase A regulatory subunit binding(GO:0034237) |
| 0.4 | 3.9 | GO:0052629 | phosphatidylinositol-3,5-bisphosphate 3-phosphatase activity(GO:0052629) |
| 0.4 | 3.6 | GO:0022851 | GABA-gated chloride ion channel activity(GO:0022851) |
| 0.3 | 1.0 | GO:0050613 | delta14-sterol reductase activity(GO:0050613) |
| 0.3 | 1.6 | GO:0070740 | tubulin-glutamic acid ligase activity(GO:0070740) |
| 0.3 | 4.2 | GO:0015924 | mannosyl-oligosaccharide mannosidase activity(GO:0015924) |
| 0.3 | 1.6 | GO:0070404 | NADH binding(GO:0070404) |
| 0.3 | 4.1 | GO:1990247 | N6-methyladenosine-containing RNA binding(GO:1990247) |
| 0.3 | 1.6 | GO:0033857 | diphosphoinositol-pentakisphosphate kinase activity(GO:0033857) |
| 0.3 | 1.8 | GO:0010858 | calcium-dependent protein kinase regulator activity(GO:0010858) |
| 0.3 | 1.5 | GO:0047144 | 2-acylglycerol-3-phosphate O-acyltransferase activity(GO:0047144) |
| 0.3 | 0.9 | GO:0004949 | cannabinoid receptor activity(GO:0004949) |
| 0.3 | 6.7 | GO:0008239 | dipeptidyl-peptidase activity(GO:0008239) |
| 0.3 | 5.8 | GO:0070273 | phosphatidylinositol-4-phosphate binding(GO:0070273) |
| 0.3 | 3.6 | GO:0097109 | neuroligin family protein binding(GO:0097109) |
| 0.3 | 7.8 | GO:0004708 | MAP kinase kinase activity(GO:0004708) |
| 0.3 | 4.8 | GO:1990381 | ubiquitin-specific protease binding(GO:1990381) |
| 0.3 | 2.1 | GO:0044323 | retinoic acid-responsive element binding(GO:0044323) |
| 0.3 | 1.6 | GO:0035368 | selenocysteine insertion sequence binding(GO:0035368) |
| 0.3 | 7.7 | GO:0070064 | proline-rich region binding(GO:0070064) |
| 0.3 | 3.3 | GO:0003712 | transcription cofactor activity(GO:0003712) |
| 0.2 | 1.2 | GO:0031697 | beta-1 adrenergic receptor binding(GO:0031697) |
| 0.2 | 5.2 | GO:0080025 | phosphatidylinositol-3,5-bisphosphate binding(GO:0080025) |
| 0.2 | 0.5 | GO:0070363 | mitochondrial light strand promoter sense binding(GO:0070363) |
| 0.2 | 0.7 | GO:0030158 | protein xylosyltransferase activity(GO:0030158) |
| 0.2 | 6.8 | GO:0008574 | ATP-dependent microtubule motor activity, plus-end-directed(GO:0008574) |
| 0.2 | 1.4 | GO:0017018 | myosin phosphatase activity(GO:0017018) |
| 0.2 | 2.3 | GO:0017147 | Wnt-protein binding(GO:0017147) |
| 0.2 | 0.9 | GO:0042030 | ATPase inhibitor activity(GO:0042030) |
| 0.2 | 8.1 | GO:0017091 | AU-rich element binding(GO:0017091) |
| 0.2 | 0.9 | GO:0005471 | ATP:ADP antiporter activity(GO:0005471) adenine transmembrane transporter activity(GO:0015207) |
| 0.2 | 5.3 | GO:0005092 | GDP-dissociation inhibitor activity(GO:0005092) |
| 0.2 | 1.0 | GO:0038051 | glucocorticoid receptor activity(GO:0004883) glucocorticoid-activated RNA polymerase II transcription factor binding transcription factor activity(GO:0038051) |
| 0.2 | 5.2 | GO:0005388 | calcium-transporting ATPase activity(GO:0005388) |
| 0.2 | 1.0 | GO:0070728 | leucine binding(GO:0070728) |
| 0.2 | 1.9 | GO:0042731 | PH domain binding(GO:0042731) |
| 0.2 | 4.2 | GO:0005086 | ARF guanyl-nucleotide exchange factor activity(GO:0005086) |
| 0.2 | 1.4 | GO:0051880 | G-quadruplex DNA binding(GO:0051880) |
| 0.2 | 1.4 | GO:0071933 | Arp2/3 complex binding(GO:0071933) |
| 0.2 | 1.8 | GO:0001224 | RNA polymerase II transcription cofactor binding(GO:0001224) |
| 0.2 | 1.5 | GO:0034452 | dynactin binding(GO:0034452) |
| 0.2 | 1.6 | GO:0046625 | sphingolipid binding(GO:0046625) |
| 0.2 | 0.6 | GO:0016230 | sphingomyelin phosphodiesterase activator activity(GO:0016230) |
| 0.2 | 4.0 | GO:0035064 | methylated histone binding(GO:0035064) |
| 0.2 | 2.2 | GO:0004726 | non-membrane spanning protein tyrosine phosphatase activity(GO:0004726) |
| 0.2 | 0.6 | GO:0036033 | mediator complex binding(GO:0036033) |
| 0.1 | 3.7 | GO:0030296 | protein tyrosine kinase activator activity(GO:0030296) |
| 0.1 | 0.6 | GO:0043398 | HLH domain binding(GO:0043398) |
| 0.1 | 0.7 | GO:0044729 | hemi-methylated DNA-binding(GO:0044729) |
| 0.1 | 3.7 | GO:0005001 | transmembrane receptor protein tyrosine phosphatase activity(GO:0005001) transmembrane receptor protein phosphatase activity(GO:0019198) |
| 0.1 | 2.3 | GO:0038191 | neuropilin binding(GO:0038191) |
| 0.1 | 2.4 | GO:0050811 | GABA receptor binding(GO:0050811) |
| 0.1 | 3.6 | GO:0070840 | dynein complex binding(GO:0070840) |
| 0.1 | 1.5 | GO:0001135 | transcription factor activity, RNA polymerase II transcription factor recruiting(GO:0001135) |
| 0.1 | 9.1 | GO:0004004 | ATP-dependent RNA helicase activity(GO:0004004) RNA-dependent ATPase activity(GO:0008186) |
| 0.1 | 1.6 | GO:0017160 | Ral GTPase binding(GO:0017160) |
| 0.1 | 0.5 | GO:0001588 | dopamine neurotransmitter receptor activity, coupled via Gs(GO:0001588) |
| 0.1 | 1.4 | GO:0019870 | potassium channel inhibitor activity(GO:0019870) |
| 0.1 | 7.6 | GO:0048365 | Rac GTPase binding(GO:0048365) |
| 0.1 | 2.9 | GO:0005521 | lamin binding(GO:0005521) |
| 0.1 | 1.4 | GO:0032050 | clathrin heavy chain binding(GO:0032050) |
| 0.1 | 6.1 | GO:0017112 | Rab guanyl-nucleotide exchange factor activity(GO:0017112) |
| 0.1 | 2.8 | GO:0004012 | phospholipid-translocating ATPase activity(GO:0004012) |
| 0.1 | 3.3 | GO:0001671 | ATPase activator activity(GO:0001671) |
| 0.1 | 3.9 | GO:0030507 | spectrin binding(GO:0030507) |
| 0.1 | 0.5 | GO:0015183 | L-aspartate transmembrane transporter activity(GO:0015183) |
| 0.1 | 4.9 | GO:0005544 | calcium-dependent phospholipid binding(GO:0005544) |
| 0.1 | 0.7 | GO:0097322 | 7SK snRNA binding(GO:0097322) |
| 0.1 | 2.7 | GO:0070410 | co-SMAD binding(GO:0070410) |
| 0.1 | 0.8 | GO:0004865 | protein serine/threonine phosphatase inhibitor activity(GO:0004865) |
| 0.1 | 0.5 | GO:0032554 | purine deoxyribonucleotide binding(GO:0032554) |
| 0.1 | 1.0 | GO:0017070 | U6 snRNA binding(GO:0017070) |
| 0.1 | 0.4 | GO:0004594 | pantothenate kinase activity(GO:0004594) |
| 0.1 | 0.8 | GO:0004445 | inositol-polyphosphate 5-phosphatase activity(GO:0004445) |
| 0.1 | 2.5 | GO:0051879 | Hsp90 protein binding(GO:0051879) |
| 0.1 | 1.1 | GO:0004596 | peptide alpha-N-acetyltransferase activity(GO:0004596) |
| 0.1 | 0.7 | GO:0048495 | Roundabout binding(GO:0048495) |
| 0.1 | 6.8 | GO:0002039 | p53 binding(GO:0002039) |
| 0.1 | 2.4 | GO:0015248 | sterol transporter activity(GO:0015248) |
| 0.1 | 0.9 | GO:0001206 | transcriptional repressor activity, RNA polymerase II distal enhancer sequence-specific binding(GO:0001206) |
| 0.1 | 0.2 | GO:0004822 | isoleucine-tRNA ligase activity(GO:0004822) |
| 0.1 | 2.7 | GO:0043548 | phosphatidylinositol 3-kinase binding(GO:0043548) |
| 0.1 | 2.3 | GO:0030544 | Hsp70 protein binding(GO:0030544) |
| 0.1 | 0.8 | GO:0035251 | UDP-glucosyltransferase activity(GO:0035251) |
| 0.1 | 0.7 | GO:0019855 | calcium channel inhibitor activity(GO:0019855) |
| 0.1 | 11.2 | GO:0044325 | ion channel binding(GO:0044325) |
| 0.1 | 0.9 | GO:0016634 | oxidoreductase activity, acting on the CH-CH group of donors, oxygen as acceptor(GO:0016634) |
| 0.1 | 15.5 | GO:0008017 | microtubule binding(GO:0008017) |
| 0.1 | 0.6 | GO:0008312 | 7S RNA binding(GO:0008312) |
| 0.1 | 0.8 | GO:0035497 | cAMP response element binding(GO:0035497) |
| 0.1 | 6.6 | GO:0019888 | protein phosphatase regulator activity(GO:0019888) |
| 0.1 | 0.3 | GO:0003726 | double-stranded RNA adenosine deaminase activity(GO:0003726) |
| 0.1 | 0.4 | GO:0001075 | transcription factor activity, RNA polymerase II core promoter sequence-specific binding involved in preinitiation complex assembly(GO:0001075) |
| 0.1 | 0.6 | GO:0022841 | potassium ion leak channel activity(GO:0022841) |
| 0.1 | 0.5 | GO:0035612 | AP-2 adaptor complex binding(GO:0035612) |
| 0.1 | 0.2 | GO:0004605 | phosphatidate cytidylyltransferase activity(GO:0004605) |
| 0.1 | 1.1 | GO:0102391 | decanoate--CoA ligase activity(GO:0102391) |
| 0.1 | 0.6 | GO:0043015 | gamma-tubulin binding(GO:0043015) |
| 0.1 | 1.1 | GO:0097602 | cullin family protein binding(GO:0097602) |
| 0.1 | 0.6 | GO:0005007 | fibroblast growth factor-activated receptor activity(GO:0005007) |
| 0.1 | 7.2 | GO:0017137 | Rab GTPase binding(GO:0017137) |
| 0.1 | 0.4 | GO:0035005 | 1-phosphatidylinositol-4-phosphate 3-kinase activity(GO:0035005) |
| 0.1 | 1.9 | GO:0001205 | transcriptional activator activity, RNA polymerase II distal enhancer sequence-specific binding(GO:0001205) |
| 0.0 | 1.5 | GO:0070412 | R-SMAD binding(GO:0070412) |
| 0.0 | 0.5 | GO:0017025 | TBP-class protein binding(GO:0017025) |
| 0.0 | 0.5 | GO:0032041 | histone deacetylase activity (H3-K14 specific)(GO:0031078) NAD-dependent histone deacetylase activity (H3-K14 specific)(GO:0032041) |
| 0.0 | 4.0 | GO:0015171 | amino acid transmembrane transporter activity(GO:0015171) |
| 0.0 | 1.3 | GO:0030276 | clathrin binding(GO:0030276) |
| 0.0 | 1.2 | GO:0001106 | RNA polymerase II transcription corepressor activity(GO:0001106) |
| 0.0 | 0.2 | GO:0004614 | phosphoglucomutase activity(GO:0004614) |
| 0.0 | 1.5 | GO:0061650 | ubiquitin conjugating enzyme activity(GO:0061631) ubiquitin-like protein conjugating enzyme activity(GO:0061650) |
| 0.0 | 24.9 | GO:0005509 | calcium ion binding(GO:0005509) |
| 0.0 | 0.6 | GO:0008409 | 5'-3' exonuclease activity(GO:0008409) |
| 0.0 | 0.4 | GO:0031386 | protein tag(GO:0031386) |
| 0.0 | 1.5 | GO:0004386 | helicase activity(GO:0004386) |
| 0.0 | 1.0 | GO:0032452 | histone demethylase activity(GO:0032452) |
| 0.0 | 2.6 | GO:0008094 | DNA-dependent ATPase activity(GO:0008094) |
| 0.0 | 0.9 | GO:0030159 | receptor signaling complex scaffold activity(GO:0030159) |
| 0.0 | 0.9 | GO:0019905 | syntaxin binding(GO:0019905) |
| 0.0 | 0.6 | GO:0005158 | insulin receptor binding(GO:0005158) |
| 0.0 | 5.9 | GO:0005096 | GTPase activator activity(GO:0005096) |
| 0.0 | 0.2 | GO:0010385 | double-stranded methylated DNA binding(GO:0010385) |
| 0.0 | 0.3 | GO:0001042 | RNA polymerase I core binding(GO:0001042) |
| 0.0 | 0.7 | GO:0016628 | oxidoreductase activity, acting on the CH-CH group of donors, NAD or NADP as acceptor(GO:0016628) |
| 0.0 | 1.9 | GO:0005085 | guanyl-nucleotide exchange factor activity(GO:0005085) |
| 0.0 | 0.2 | GO:0015266 | protein channel activity(GO:0015266) |
| 0.0 | 0.8 | GO:0036002 | pre-mRNA binding(GO:0036002) |
| 0.0 | 0.2 | GO:0055056 | D-glucose transmembrane transporter activity(GO:0055056) |
| 0.0 | 0.3 | GO:0004535 | poly(A)-specific ribonuclease activity(GO:0004535) |
| 0.0 | 0.1 | GO:0015165 | pyrimidine nucleotide-sugar transmembrane transporter activity(GO:0015165) |
| 0.0 | 1.5 | GO:0042826 | histone deacetylase binding(GO:0042826) |
| 0.0 | 0.1 | GO:0038132 | neuregulin binding(GO:0038132) |
| 0.0 | 0.1 | GO:0008503 | benzodiazepine receptor activity(GO:0008503) |
| 0.0 | 1.2 | GO:0101005 | thiol-dependent ubiquitinyl hydrolase activity(GO:0036459) ubiquitinyl hydrolase activity(GO:0101005) |
| 0.0 | 4.4 | GO:0031625 | ubiquitin protein ligase binding(GO:0031625) |
| 0.0 | 0.3 | GO:0070006 | metalloaminopeptidase activity(GO:0070006) |
| 0.0 | 1.4 | GO:0005200 | structural constituent of cytoskeleton(GO:0005200) |
Gene overrepresentation in C2:CP category:
| Log-likelihood per target | Total log-likelihood | Term | Description |
|---|---|---|---|
| 0.5 | 10.3 | PID TCR RAS PATHWAY | Ras signaling in the CD4+ TCR pathway |
| 0.3 | 6.0 | PID P38 GAMMA DELTA PATHWAY | Signaling mediated by p38-gamma and p38-delta |
| 0.3 | 18.5 | PID NCADHERIN PATHWAY | N-cadherin signaling events |
| 0.3 | 3.3 | PID S1P S1P4 PATHWAY | S1P4 pathway |
| 0.3 | 10.2 | PID LIS1 PATHWAY | Lissencephaly gene (LIS1) in neuronal migration and development |
| 0.2 | 9.7 | PID INSULIN GLUCOSE PATHWAY | Insulin-mediated glucose transport |
| 0.2 | 3.6 | PID S1P META PATHWAY | Sphingosine 1-phosphate (S1P) pathway |
| 0.2 | 2.3 | ST JAK STAT PATHWAY | Jak-STAT Pathway |
| 0.2 | 2.9 | PID WNT CANONICAL PATHWAY | Canonical Wnt signaling pathway |
| 0.1 | 5.3 | PID NFKAPPAB CANONICAL PATHWAY | Canonical NF-kappaB pathway |
| 0.1 | 4.3 | PID HDAC CLASSIII PATHWAY | Signaling events mediated by HDAC Class III |
| 0.1 | 6.6 | SIG REGULATION OF THE ACTIN CYTOSKELETON BY RHO GTPASES | Genes related to regulation of the actin cytoskeleton |
| 0.1 | 2.3 | SA TRKA RECEPTOR | The TrkA receptor binds nerve growth factor to activate MAP kinase pathways and promote cell growth. |
| 0.1 | 5.0 | PID ERBB1 INTERNALIZATION PATHWAY | Internalization of ErbB1 |
| 0.1 | 2.2 | SA G1 AND S PHASES | Cdk2, 4, and 6 bind cyclin D in G1, while cdk2/cyclin E promotes the G1/S transition. |
| 0.1 | 2.0 | PID AVB3 OPN PATHWAY | Osteopontin-mediated events |
| 0.1 | 1.9 | PID CDC42 REG PATHWAY | Regulation of CDC42 activity |
| 0.1 | 4.1 | PID HEDGEHOG GLI PATHWAY | Hedgehog signaling events mediated by Gli proteins |
| 0.1 | 2.1 | PID BARD1 PATHWAY | BARD1 signaling events |
| 0.1 | 4.0 | PID RAC1 REG PATHWAY | Regulation of RAC1 activity |
| 0.1 | 1.7 | PID TOLL ENDOGENOUS PATHWAY | Endogenous TLR signaling |
| 0.1 | 3.6 | PID TNF PATHWAY | TNF receptor signaling pathway |
| 0.1 | 2.4 | PID ARF6 PATHWAY | Arf6 signaling events |
| 0.0 | 2.0 | PID EPO PATHWAY | EPO signaling pathway |
| 0.0 | 0.8 | PID FOXO PATHWAY | FoxO family signaling |
| 0.0 | 0.7 | PID PRL SIGNALING EVENTS PATHWAY | Signaling events mediated by PRL |
| 0.0 | 1.8 | PID IL4 2PATHWAY | IL4-mediated signaling events |
| 0.0 | 1.4 | PID ATM PATHWAY | ATM pathway |
| 0.0 | 1.1 | PID TCPTP PATHWAY | Signaling events mediated by TCPTP |
| 0.0 | 1.4 | PID PLK1 PATHWAY | PLK1 signaling events |
| 0.0 | 1.0 | PID IL6 7 PATHWAY | IL6-mediated signaling events |
| 0.0 | 1.4 | PID RHOA REG PATHWAY | Regulation of RhoA activity |
| 0.0 | 0.5 | PID IL2 PI3K PATHWAY | IL2 signaling events mediated by PI3K |
| 0.0 | 1.0 | PID AURORA B PATHWAY | Aurora B signaling |
| 0.0 | 1.8 | PID REG GR PATHWAY | Glucocorticoid receptor regulatory network |
| 0.0 | 0.8 | PID RAC1 PATHWAY | RAC1 signaling pathway |
| 0.0 | 2.1 | PID MYC REPRESS PATHWAY | Validated targets of C-MYC transcriptional repression |
| 0.0 | 1.1 | PID LKB1 PATHWAY | LKB1 signaling events |
| 0.0 | 0.3 | PID EPHA FWDPATHWAY | EPHA forward signaling |
| 0.0 | 0.5 | PID HDAC CLASSII PATHWAY | Signaling events mediated by HDAC Class II |
| 0.0 | 0.7 | PID AJDISS 2PATHWAY | Posttranslational regulation of adherens junction stability and dissassembly |
| 0.0 | 0.3 | PID WNT SIGNALING PATHWAY | Wnt signaling network |
Gene overrepresentation in C2:CP:REACTOME category:
| Log-likelihood per target | Total log-likelihood | Term | Description |
|---|---|---|---|
| 1.1 | 15.0 | REACTOME RAF MAP KINASE CASCADE | Genes involved in RAF/MAP kinase cascade |
| 1.0 | 12.4 | REACTOME UNBLOCKING OF NMDA RECEPTOR GLUTAMATE BINDING AND ACTIVATION | Genes involved in Unblocking of NMDA receptor, glutamate binding and activation |
| 0.7 | 12.5 | REACTOME NOREPINEPHRINE NEUROTRANSMITTER RELEASE CYCLE | Genes involved in Norepinephrine Neurotransmitter Release Cycle |
| 0.5 | 10.5 | REACTOME RAS ACTIVATION UOPN CA2 INFUX THROUGH NMDA RECEPTOR | Genes involved in Ras activation uopn Ca2+ infux through NMDA receptor |
| 0.5 | 2.6 | REACTOME SHC MEDIATED SIGNALLING | Genes involved in SHC-mediated signalling |
| 0.5 | 9.6 | REACTOME SYNTHESIS OF PIPS AT THE GOLGI MEMBRANE | Genes involved in Synthesis of PIPs at the Golgi membrane |
| 0.5 | 3.6 | REACTOME SOS MEDIATED SIGNALLING | Genes involved in SOS-mediated signalling |
| 0.3 | 4.0 | REACTOME GLUTAMATE NEUROTRANSMITTER RELEASE CYCLE | Genes involved in Glutamate Neurotransmitter Release Cycle |
| 0.3 | 3.7 | REACTOME NOTCH HLH TRANSCRIPTION PATHWAY | Genes involved in Notch-HLH transcription pathway |
| 0.3 | 1.4 | REACTOME DESTABILIZATION OF MRNA BY BRF1 | Genes involved in Destabilization of mRNA by Butyrate Response Factor 1 (BRF1) |
| 0.3 | 1.6 | REACTOME MEMBRANE BINDING AND TARGETTING OF GAG PROTEINS | Genes involved in Membrane binding and targetting of GAG proteins |
| 0.3 | 7.4 | REACTOME CRMPS IN SEMA3A SIGNALING | Genes involved in CRMPs in Sema3A signaling |
| 0.3 | 4.4 | REACTOME ENDOSOMAL SORTING COMPLEX REQUIRED FOR TRANSPORT ESCRT | Genes involved in Endosomal Sorting Complex Required For Transport (ESCRT) |
| 0.2 | 7.7 | REACTOME GABA A RECEPTOR ACTIVATION | Genes involved in GABA A receptor activation |
| 0.2 | 3.1 | REACTOME REGULATION OF THE FANCONI ANEMIA PATHWAY | Genes involved in Regulation of the Fanconi anemia pathway |
| 0.2 | 7.4 | REACTOME DEADENYLATION OF MRNA | Genes involved in Deadenylation of mRNA |
| 0.2 | 6.0 | REACTOME CASPASE MEDIATED CLEAVAGE OF CYTOSKELETAL PROTEINS | Genes involved in Caspase-mediated cleavage of cytoskeletal proteins |
| 0.2 | 3.8 | REACTOME CTNNB1 PHOSPHORYLATION CASCADE | Genes involved in Beta-catenin phosphorylation cascade |
| 0.1 | 2.4 | REACTOME ACTIVATION OF THE AP1 FAMILY OF TRANSCRIPTION FACTORS | Genes involved in Activation of the AP-1 family of transcription factors |
| 0.1 | 2.9 | REACTOME DESTABILIZATION OF MRNA BY KSRP | Genes involved in Destabilization of mRNA by KSRP |
| 0.1 | 1.5 | REACTOME REGULATION OF INSULIN SECRETION BY ACETYLCHOLINE | Genes involved in Regulation of Insulin Secretion by Acetylcholine |
| 0.1 | 4.2 | REACTOME INHIBITION OF INSULIN SECRETION BY ADRENALINE NORADRENALINE | Genes involved in Inhibition of Insulin Secretion by Adrenaline/Noradrenaline |
| 0.1 | 2.3 | REACTOME REGULATION OF IFNG SIGNALING | Genes involved in Regulation of IFNG signaling |
| 0.1 | 2.0 | REACTOME SYNTHESIS SECRETION AND DEACYLATION OF GHRELIN | Genes involved in Synthesis, Secretion, and Deacylation of Ghrelin |
| 0.1 | 2.4 | REACTOME FACILITATIVE NA INDEPENDENT GLUCOSE TRANSPORTERS | Genes involved in Facilitative Na+-independent glucose transporters |
| 0.1 | 2.1 | REACTOME APOPTOSIS INDUCED DNA FRAGMENTATION | Genes involved in Apoptosis induced DNA fragmentation |
| 0.1 | 2.8 | REACTOME KINESINS | Genes involved in Kinesins |
| 0.1 | 2.5 | REACTOME DOWNREGULATION OF ERBB2 ERBB3 SIGNALING | Genes involved in Downregulation of ERBB2:ERBB3 signaling |
| 0.1 | 1.5 | REACTOME ACYL CHAIN REMODELLING OF PG | Genes involved in Acyl chain remodelling of PG |
| 0.1 | 1.6 | REACTOME SYNTHESIS OF PA | Genes involved in Synthesis of PA |
| 0.1 | 10.5 | REACTOME TRANSPORT OF INORGANIC CATIONS ANIONS AND AMINO ACIDS OLIGOPEPTIDES | Genes involved in Transport of inorganic cations/anions and amino acids/oligopeptides |
| 0.1 | 7.7 | REACTOME MITOTIC PROMETAPHASE | Genes involved in Mitotic Prometaphase |
| 0.1 | 1.0 | REACTOME ACYL CHAIN REMODELLING OF PC | Genes involved in Acyl chain remodelling of PC |
| 0.1 | 3.1 | REACTOME NOD1 2 SIGNALING PATHWAY | Genes involved in NOD1/2 Signaling Pathway |
| 0.1 | 12.3 | REACTOME SIGNALING BY RHO GTPASES | Genes involved in Signaling by Rho GTPases |
| 0.1 | 1.4 | REACTOME REGULATION OF KIT SIGNALING | Genes involved in Regulation of KIT signaling |
| 0.1 | 2.9 | REACTOME MRNA 3 END PROCESSING | Genes involved in mRNA 3'-end processing |
| 0.1 | 16.9 | REACTOME ANTIGEN PROCESSING UBIQUITINATION PROTEASOME DEGRADATION | Genes involved in Antigen processing: Ubiquitination & Proteasome degradation |
| 0.1 | 1.4 | REACTOME HORMONE SENSITIVE LIPASE HSL MEDIATED TRIACYLGLYCEROL HYDROLYSIS | Genes involved in Hormone-sensitive lipase (HSL)-mediated triacylglycerol hydrolysis |
| 0.1 | 2.7 | REACTOME ION TRANSPORT BY P TYPE ATPASES | Genes involved in Ion transport by P-type ATPases |
| 0.1 | 1.4 | REACTOME BASIGIN INTERACTIONS | Genes involved in Basigin interactions |
| 0.1 | 1.1 | REACTOME SYNTHESIS OF VERY LONG CHAIN FATTY ACYL COAS | Genes involved in Synthesis of very long-chain fatty acyl-CoAs |
| 0.0 | 1.4 | REACTOME NEGATIVE REGULATORS OF RIG I MDA5 SIGNALING | Genes involved in Negative regulators of RIG-I/MDA5 signaling |
| 0.0 | 0.6 | REACTOME SIGNALING BY FGFR3 MUTANTS | Genes involved in Signaling by FGFR3 mutants |
| 0.0 | 0.3 | REACTOME CREB PHOSPHORYLATION THROUGH THE ACTIVATION OF CAMKII | Genes involved in CREB phosphorylation through the activation of CaMKII |
| 0.0 | 0.7 | REACTOME ZINC TRANSPORTERS | Genes involved in Zinc transporters |
| 0.0 | 4.0 | REACTOME MRNA SPLICING | Genes involved in mRNA Splicing |
| 0.0 | 2.7 | REACTOME GOLGI ASSOCIATED VESICLE BIOGENESIS | Genes involved in Golgi Associated Vesicle Biogenesis |
| 0.0 | 2.9 | REACTOME MEIOTIC SYNAPSIS | Genes involved in Meiotic Synapsis |
| 0.0 | 1.0 | REACTOME CHOLESTEROL BIOSYNTHESIS | Genes involved in Cholesterol biosynthesis |
| 0.0 | 0.8 | REACTOME GLYCOSPHINGOLIPID METABOLISM | Genes involved in Glycosphingolipid metabolism |
| 0.0 | 0.9 | REACTOME REGULATION OF BETA CELL DEVELOPMENT | Genes involved in Regulation of beta-cell development |
| 0.0 | 0.2 | REACTOME PRE NOTCH TRANSCRIPTION AND TRANSLATION | Genes involved in Pre-NOTCH Transcription and Translation |
| 0.0 | 0.4 | REACTOME VITAMIN B5 PANTOTHENATE METABOLISM | Genes involved in Vitamin B5 (pantothenate) metabolism |
| 0.0 | 0.3 | REACTOME INHIBITION OF REPLICATION INITIATION OF DAMAGED DNA BY RB1 E2F1 | Genes involved in Inhibition of replication initiation of damaged DNA by RB1/E2F1 |
| 0.0 | 1.4 | REACTOME MITOCHONDRIAL PROTEIN IMPORT | Genes involved in Mitochondrial Protein Import |
| 0.0 | 2.0 | REACTOME MHC CLASS II ANTIGEN PRESENTATION | Genes involved in MHC class II antigen presentation |
| 0.0 | 0.6 | REACTOME DOWNREGULATION OF SMAD2 3 SMAD4 TRANSCRIPTIONAL ACTIVITY | Genes involved in Downregulation of SMAD2/3:SMAD4 transcriptional activity |
| 0.0 | 0.4 | REACTOME TIE2 SIGNALING | Genes involved in Tie2 Signaling |
| 0.0 | 0.5 | REACTOME AMINE LIGAND BINDING RECEPTORS | Genes involved in Amine ligand-binding receptors |
| 0.0 | 0.2 | REACTOME INSULIN SYNTHESIS AND PROCESSING | Genes involved in Insulin Synthesis and Processing |
| 0.0 | 0.6 | REACTOME GLYCEROPHOSPHOLIPID BIOSYNTHESIS | Genes involved in Glycerophospholipid biosynthesis |