Project
GNF SymAtlas + NCI-60 cancer cell lines, comparison of cancers vs non-cancers, human (Su, 2004; Ross, 2000)
Navigation
Downloads
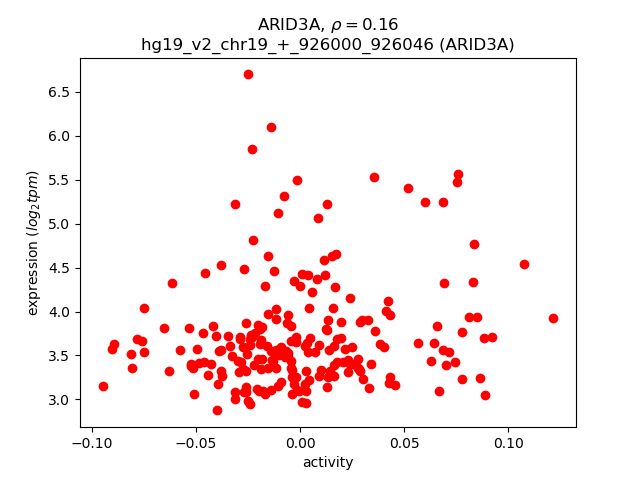
Results for ARID3A
Z-value: 0.37
Motif logo

Transcription factors associated with ARID3A
| Gene Symbol | Gene ID | Gene Info |
|---|---|---|
|
ARID3A
|
ENSG00000116017.6 | AT-rich interaction domain 3A |
Activity-expression correlation:
| Gene | Promoter | Pearson corr. coef. | P-value | Plot |
|---|---|---|---|---|
| ARID3A | hg19_v2_chr19_+_926000_926046 | 0.16 | 1.8e-02 | Click! |
Activity profile of ARID3A motif
Sorted Z-values of ARID3A motif
| Promoter | Log-likelihood | Transcript | Gene | Gene Info |
|---|---|---|---|---|
| chr2_+_90198535 | 15.09 |
ENST00000390276.2
|
IGKV1D-12
|
immunoglobulin kappa variable 1D-12 |
| chr7_-_38305279 | 14.99 |
ENST00000443402.2
|
TRGC1
|
T cell receptor gamma constant 1 |
| chr11_+_67351213 | 13.51 |
ENST00000398603.1
|
GSTP1
|
glutathione S-transferase pi 1 |
| chr3_-_121379739 | 13.51 |
ENST00000428394.2
ENST00000314583.3 |
HCLS1
|
hematopoietic cell-specific Lyn substrate 1 |
| chr1_+_145438469 | 13.39 |
ENST00000369317.4
|
TXNIP
|
thioredoxin interacting protein |
| chr11_+_67351019 | 11.22 |
ENST00000398606.3
|
GSTP1
|
glutathione S-transferase pi 1 |
| chr2_-_89340242 | 10.65 |
ENST00000480492.1
|
IGKV1-12
|
immunoglobulin kappa variable 1-12 |
| chr2_+_90248739 | 10.30 |
ENST00000468879.1
|
IGKV1D-43
|
immunoglobulin kappa variable 1D-43 |
| chr2_-_89399845 | 8.97 |
ENST00000479981.1
|
IGKV1-16
|
immunoglobulin kappa variable 1-16 |
| chr12_-_53601055 | 8.76 |
ENST00000552972.1
ENST00000422257.3 ENST00000267082.5 |
ITGB7
|
integrin, beta 7 |
| chr12_-_53601000 | 8.76 |
ENST00000338737.4
ENST00000549086.2 |
ITGB7
|
integrin, beta 7 |
| chr2_-_89417335 | 8.34 |
ENST00000490686.1
|
IGKV1-17
|
immunoglobulin kappa variable 1-17 |
| chr17_-_3599696 | 8.18 |
ENST00000225328.5
|
P2RX5
|
purinergic receptor P2X, ligand-gated ion channel, 5 |
| chr2_-_89266286 | 7.85 |
ENST00000464162.1
|
IGKV1-6
|
immunoglobulin kappa variable 1-6 |
| chr19_-_39826639 | 7.54 |
ENST00000602185.1
ENST00000598034.1 ENST00000601387.1 ENST00000595636.1 ENST00000253054.8 ENST00000594700.1 ENST00000597595.1 |
GMFG
|
glia maturation factor, gamma |
| chr1_+_211499957 | 7.51 |
ENST00000336184.2
|
TRAF5
|
TNF receptor-associated factor 5 |
| chr7_-_38289173 | 7.32 |
ENST00000436911.2
|
TRGC2
|
T cell receptor gamma constant 2 |
| chr2_+_90121477 | 7.25 |
ENST00000483379.1
|
IGKV1D-17
|
immunoglobulin kappa variable 1D-17 |
| chr17_-_3599327 | 7.17 |
ENST00000551178.1
ENST00000552276.1 ENST00000547178.1 |
P2RX5
|
purinergic receptor P2X, ligand-gated ion channel, 5 |
| chr12_-_10542617 | 7.16 |
ENST00000240618.6
|
KLRK1
|
killer cell lectin-like receptor subfamily K, member 1 |
| chr3_+_43328004 | 6.99 |
ENST00000454177.1
ENST00000429705.2 ENST00000296088.7 ENST00000437827.1 |
SNRK
|
SNF related kinase |
| chr17_-_3599492 | 6.95 |
ENST00000435558.1
ENST00000345901.3 |
P2RX5
|
purinergic receptor P2X, ligand-gated ion channel, 5 |
| chr17_-_29641084 | 6.04 |
ENST00000544462.1
|
EVI2B
|
ecotropic viral integration site 2B |
| chr17_-_29641104 | 5.89 |
ENST00000577894.1
ENST00000330927.4 |
EVI2B
|
ecotropic viral integration site 2B |
| chr14_-_106725723 | 5.80 |
ENST00000390609.2
|
IGHV3-23
|
immunoglobulin heavy variable 3-23 |
| chr15_-_34880646 | 5.80 |
ENST00000543376.1
|
GOLGA8A
|
golgin A8 family, member A |
| chr16_+_81812863 | 5.67 |
ENST00000359376.3
|
PLCG2
|
phospholipase C, gamma 2 (phosphatidylinositol-specific) |
| chr15_-_22473353 | 5.35 |
ENST00000557788.2
|
IGHV4OR15-8
|
immunoglobulin heavy variable 4/OR15-8 (non-functional) |
| chr1_-_53387386 | 5.30 |
ENST00000467988.1
ENST00000358358.5 ENST00000371522.4 |
ECHDC2
|
enoyl CoA hydratase domain containing 2 |
| chr12_-_120765565 | 5.26 |
ENST00000423423.3
ENST00000308366.4 |
PLA2G1B
|
phospholipase A2, group IB (pancreas) |
| chr1_-_92371839 | 5.18 |
ENST00000370399.2
|
TGFBR3
|
transforming growth factor, beta receptor III |
| chr1_+_207943667 | 5.11 |
ENST00000462968.2
|
CD46
|
CD46 molecule, complement regulatory protein |
| chr12_+_54892550 | 5.03 |
ENST00000545638.2
|
NCKAP1L
|
NCK-associated protein 1-like |
| chr11_+_118175132 | 5.01 |
ENST00000361763.4
|
CD3E
|
CD3e molecule, epsilon (CD3-TCR complex) |
| chr11_-_327537 | 4.62 |
ENST00000602735.1
|
IFITM3
|
interferon induced transmembrane protein 3 |
| chr7_-_139763521 | 4.62 |
ENST00000263549.3
|
PARP12
|
poly (ADP-ribose) polymerase family, member 12 |
| chr10_+_111765562 | 4.46 |
ENST00000360162.3
|
ADD3
|
adducin 3 (gamma) |
| chr2_-_87018784 | 4.43 |
ENST00000283635.3
ENST00000538832.1 |
CD8A
|
CD8a molecule |
| chr21_-_37270727 | 4.41 |
ENST00000599809.1
|
FKSG68
|
FKSG68 |
| chr4_+_71296204 | 3.88 |
ENST00000413702.1
|
MUC7
|
mucin 7, secreted |
| chr16_-_28374829 | 3.52 |
ENST00000532254.1
|
NPIPB6
|
nuclear pore complex interacting protein family, member B6 |
| chr1_+_158900568 | 3.51 |
ENST00000458222.1
|
PYHIN1
|
pyrin and HIN domain family, member 1 |
| chr2_+_79252834 | 3.50 |
ENST00000409471.1
|
REG3G
|
regenerating islet-derived 3 gamma |
| chr14_+_39734482 | 3.45 |
ENST00000554392.1
ENST00000555716.1 ENST00000341749.3 ENST00000557038.1 |
CTAGE5
|
CTAGE family, member 5 |
| chr2_+_79252822 | 3.42 |
ENST00000272324.5
|
REG3G
|
regenerating islet-derived 3 gamma |
| chr2_+_79252804 | 3.25 |
ENST00000393897.2
|
REG3G
|
regenerating islet-derived 3 gamma |
| chr10_+_118305435 | 3.22 |
ENST00000369221.2
|
PNLIP
|
pancreatic lipase |
| chr21_-_43735628 | 3.20 |
ENST00000291525.10
ENST00000518498.1 |
TFF3
|
trefoil factor 3 (intestinal) |
| chr16_+_28763108 | 3.17 |
ENST00000357796.3
ENST00000550983.1 |
NPIPB9
|
nuclear pore complex interacting protein family, member B9 |
| chr12_+_9980069 | 3.06 |
ENST00000354855.3
ENST00000324214.4 ENST00000279544.3 |
KLRF1
|
killer cell lectin-like receptor subfamily F, member 1 |
| chr7_+_150264365 | 3.06 |
ENST00000255945.2
ENST00000461940.1 |
GIMAP4
|
GTPase, IMAP family member 4 |
| chr1_-_100231349 | 3.00 |
ENST00000287474.5
ENST00000414213.1 |
FRRS1
|
ferric-chelate reductase 1 |
| chr8_+_23104130 | 2.93 |
ENST00000313219.7
ENST00000519984.1 |
CHMP7
|
charged multivesicular body protein 7 |
| chr10_+_26727125 | 2.89 |
ENST00000376236.4
|
APBB1IP
|
amyloid beta (A4) precursor protein-binding, family B, member 1 interacting protein |
| chr10_+_124320156 | 2.88 |
ENST00000338354.3
ENST00000344338.3 ENST00000330163.4 ENST00000368909.3 ENST00000368955.3 ENST00000368956.2 |
DMBT1
|
deleted in malignant brain tumors 1 |
| chr7_+_156902674 | 2.84 |
ENST00000594086.1
|
AC006967.1
|
Protein LOC100996426 |
| chr2_-_160473114 | 2.80 |
ENST00000392783.2
|
BAZ2B
|
bromodomain adjacent to zinc finger domain, 2B |
| chr1_+_73771844 | 2.80 |
ENST00000440762.1
ENST00000444827.1 ENST00000415686.1 ENST00000411903.1 |
RP4-598G3.1
|
RP4-598G3.1 |
| chr3_+_169629354 | 2.79 |
ENST00000428432.2
ENST00000335556.3 |
SAMD7
|
sterile alpha motif domain containing 7 |
| chr4_+_70916119 | 2.79 |
ENST00000246896.3
ENST00000511674.1 |
HTN1
|
histatin 1 |
| chr1_+_33439268 | 2.77 |
ENST00000594612.1
|
FKSG48
|
FKSG48 |
| chr14_-_89878369 | 2.76 |
ENST00000553840.1
ENST00000556916.1 |
FOXN3
|
forkhead box N3 |
| chr10_+_124320195 | 2.74 |
ENST00000359586.6
|
DMBT1
|
deleted in malignant brain tumors 1 |
| chr2_+_106468204 | 2.69 |
ENST00000425756.1
ENST00000393349.2 |
NCK2
|
NCK adaptor protein 2 |
| chr7_+_115862858 | 2.64 |
ENST00000393481.2
|
TES
|
testis derived transcript (3 LIM domains) |
| chr16_+_28648975 | 2.57 |
ENST00000529716.1
|
NPIPB8
|
nuclear pore complex interacting protein family, member B8 |
| chr3_+_46395219 | 2.52 |
ENST00000445132.2
ENST00000292301.4 |
CCR2
|
chemokine (C-C motif) receptor 2 |
| chr9_-_110540419 | 2.50 |
ENST00000398726.3
|
AL162389.1
|
Uncharacterized protein |
| chr6_-_30181133 | 2.49 |
ENST00000454678.2
ENST00000434785.1 |
TRIM26
|
tripartite motif containing 26 |
| chr6_-_30181156 | 2.43 |
ENST00000418026.1
ENST00000416596.1 ENST00000453195.1 |
TRIM26
|
tripartite motif containing 26 |
| chr19_+_18208603 | 2.39 |
ENST00000262811.6
|
MAST3
|
microtubule associated serine/threonine kinase 3 |
| chr7_+_16828866 | 2.34 |
ENST00000597084.1
|
AC073333.1
|
Uncharacterized protein |
| chr16_-_21868978 | 2.31 |
ENST00000357370.5
ENST00000451409.1 ENST00000341400.7 ENST00000518761.4 |
NPIPB4
|
nuclear pore complex interacting protein family, member B4 |
| chr4_+_71263599 | 2.26 |
ENST00000399575.2
|
PROL1
|
proline rich, lacrimal 1 |
| chr16_-_29415350 | 2.25 |
ENST00000524087.1
|
NPIPB11
|
nuclear pore complex interacting protein family, member B11 |
| chr6_-_32977345 | 2.25 |
ENST00000450833.2
ENST00000374813.1 ENST00000229829.5 |
HLA-DOA
|
major histocompatibility complex, class II, DO alpha |
| chr12_-_10605929 | 2.24 |
ENST00000347831.5
ENST00000359151.3 |
KLRC1
|
killer cell lectin-like receptor subfamily C, member 1 |
| chr16_-_21868739 | 2.19 |
ENST00000415645.2
|
NPIPB4
|
nuclear pore complex interacting protein family, member B4 |
| chr4_+_70894130 | 2.13 |
ENST00000526767.1
ENST00000530128.1 ENST00000381057.3 |
HTN3
|
histatin 3 |
| chr19_+_9296279 | 2.03 |
ENST00000344248.2
|
OR7D2
|
olfactory receptor, family 7, subfamily D, member 2 |
| chr2_+_110551851 | 2.02 |
ENST00000272454.6
ENST00000430736.1 ENST00000016946.3 ENST00000441344.1 |
RGPD5
|
RANBP2-like and GRIP domain containing 5 |
| chr4_-_185275104 | 2.01 |
ENST00000317596.3
|
RP11-290F5.2
|
RP11-290F5.2 |
| chr4_-_100356291 | 1.99 |
ENST00000476959.1
ENST00000482593.1 |
ADH7
|
alcohol dehydrogenase 7 (class IV), mu or sigma polypeptide |
| chr7_+_64838786 | 1.99 |
ENST00000450302.2
|
ZNF92
|
zinc finger protein 92 |
| chr11_+_17316870 | 1.98 |
ENST00000458064.2
|
NUCB2
|
nucleobindin 2 |
| chr6_+_73076432 | 1.96 |
ENST00000414192.2
|
RIMS1
|
regulating synaptic membrane exocytosis 1 |
| chr2_-_70418032 | 1.94 |
ENST00000425268.1
ENST00000428751.1 ENST00000417203.1 ENST00000417865.1 ENST00000428010.1 ENST00000447804.1 ENST00000264434.2 |
C2orf42
|
chromosome 2 open reading frame 42 |
| chr15_-_45670924 | 1.93 |
ENST00000396659.3
|
GATM
|
glycine amidinotransferase (L-arginine:glycine amidinotransferase) |
| chr19_-_20748541 | 1.92 |
ENST00000427401.4
ENST00000594419.1 |
ZNF737
|
zinc finger protein 737 |
| chr5_-_59783882 | 1.89 |
ENST00000505507.2
ENST00000502484.2 |
PDE4D
|
phosphodiesterase 4D, cAMP-specific |
| chr7_+_64838712 | 1.84 |
ENST00000328747.7
ENST00000431504.1 ENST00000357512.2 |
ZNF92
|
zinc finger protein 92 |
| chr16_-_20753114 | 1.82 |
ENST00000396083.2
|
THUMPD1
|
THUMP domain containing 1 |
| chr17_+_44588877 | 1.82 |
ENST00000576629.1
|
LRRC37A2
|
leucine rich repeat containing 37, member A2 |
| chr19_-_53758094 | 1.79 |
ENST00000601828.1
ENST00000598513.1 ENST00000599012.1 ENST00000333952.4 ENST00000598806.1 |
ZNF677
|
zinc finger protein 677 |
| chr12_-_10588539 | 1.77 |
ENST00000381902.2
ENST00000381901.1 ENST00000539033.1 |
KLRC2
NKG2-E
|
killer cell lectin-like receptor subfamily C, member 2 Uncharacterized protein |
| chr12_+_9980113 | 1.72 |
ENST00000537723.1
|
KLRF1
|
killer cell lectin-like receptor subfamily F, member 1 |
| chr12_-_113772835 | 1.71 |
ENST00000552014.1
ENST00000548186.1 ENST00000202831.3 ENST00000549181.1 |
SLC8B1
|
solute carrier family 8 (sodium/lithium/calcium exchanger), member B1 |
| chrY_+_15815447 | 1.69 |
ENST00000284856.3
|
TMSB4Y
|
thymosin beta 4, Y-linked |
| chr5_+_121647386 | 1.67 |
ENST00000542191.1
ENST00000506272.1 ENST00000508681.1 ENST00000509154.2 |
SNCAIP
|
synuclein, alpha interacting protein |
| chr7_-_6048702 | 1.66 |
ENST00000265849.7
|
PMS2
|
PMS2 postmeiotic segregation increased 2 (S. cerevisiae) |
| chr16_-_21436459 | 1.65 |
ENST00000448012.2
ENST00000504841.2 ENST00000419180.2 |
NPIPB3
|
nuclear pore complex interacting protein family, member B3 |
| chr16_-_29517141 | 1.64 |
ENST00000550665.1
|
RP11-231C14.4
|
Uncharacterized protein |
| chr18_+_29671812 | 1.59 |
ENST00000261593.3
ENST00000578914.1 |
RNF138
|
ring finger protein 138, E3 ubiquitin protein ligase |
| chr14_-_75518129 | 1.59 |
ENST00000556257.1
ENST00000557648.1 ENST00000553263.1 ENST00000355774.2 ENST00000380968.2 ENST00000238662.7 |
MLH3
|
mutL homolog 3 |
| chr19_+_45542295 | 1.57 |
ENST00000221455.3
ENST00000391953.4 ENST00000588936.1 |
CLASRP
|
CLK4-associating serine/arginine rich protein |
| chr19_+_20959142 | 1.54 |
ENST00000344519.8
|
ZNF66
|
zinc finger protein 66 |
| chr4_-_76957214 | 1.53 |
ENST00000306621.3
|
CXCL11
|
chemokine (C-X-C motif) ligand 11 |
| chr16_-_84220604 | 1.53 |
ENST00000567759.1
|
TAF1C
|
TATA box binding protein (TBP)-associated factor, RNA polymerase I, C, 110kDa |
| chr10_-_69597915 | 1.52 |
ENST00000225171.2
|
DNAJC12
|
DnaJ (Hsp40) homolog, subfamily C, member 12 |
| chr15_+_25068773 | 1.49 |
ENST00000400100.1
ENST00000400098.1 |
SNRPN
|
small nuclear ribonucleoprotein polypeptide N |
| chr1_+_207002222 | 1.46 |
ENST00000270218.6
|
IL19
|
interleukin 19 |
| chr2_-_111334678 | 1.43 |
ENST00000329516.3
ENST00000330331.5 ENST00000446930.1 |
RGPD6
|
RANBP2-like and GRIP domain containing 6 |
| chr16_-_84220633 | 1.41 |
ENST00000566732.1
ENST00000561955.1 ENST00000564454.1 ENST00000341690.6 ENST00000541676.1 ENST00000570117.1 ENST00000564345.1 |
TAF1C
|
TATA box binding protein (TBP)-associated factor, RNA polymerase I, C, 110kDa |
| chr6_+_42749759 | 1.41 |
ENST00000314073.5
|
GLTSCR1L
|
GLTSCR1-like |
| chr16_+_56970567 | 1.40 |
ENST00000563911.1
|
HERPUD1
|
homocysteine-inducible, endoplasmic reticulum stress-inducible, ubiquitin-like domain member 1 |
| chr16_+_22501658 | 1.39 |
ENST00000415833.2
|
NPIPB5
|
nuclear pore complex interacting protein family, member B5 |
| chr12_+_10658201 | 1.38 |
ENST00000322446.3
|
EIF2S3L
|
Putative eukaryotic translation initiation factor 2 subunit 3-like protein |
| chr7_-_6048650 | 1.38 |
ENST00000382321.4
ENST00000406569.3 |
PMS2
|
PMS2 postmeiotic segregation increased 2 (S. cerevisiae) |
| chr20_+_57226284 | 1.36 |
ENST00000458280.1
ENST00000355957.5 ENST00000361770.5 ENST00000312283.8 ENST00000412911.1 ENST00000359617.4 ENST00000371141.4 |
STX16
|
syntaxin 16 |
| chr5_+_59783941 | 1.35 |
ENST00000506884.1
ENST00000504876.2 |
PART1
|
prostate androgen-regulated transcript 1 (non-protein coding) |
| chr11_+_122709200 | 1.34 |
ENST00000227348.4
|
CRTAM
|
cytotoxic and regulatory T cell molecule |
| chr12_+_113344582 | 1.32 |
ENST00000202917.5
ENST00000445409.2 ENST00000452357.2 |
OAS1
|
2'-5'-oligoadenylate synthetase 1, 40/46kDa |
| chr1_+_241695670 | 1.32 |
ENST00000366557.4
|
KMO
|
kynurenine 3-monooxygenase (kynurenine 3-hydroxylase) |
| chr14_-_53162361 | 1.31 |
ENST00000395686.3
|
ERO1L
|
ERO1-like (S. cerevisiae) |
| chr14_-_69261310 | 1.30 |
ENST00000336440.3
|
ZFP36L1
|
ZFP36 ring finger protein-like 1 |
| chr11_+_65479702 | 1.30 |
ENST00000530446.1
ENST00000534104.1 ENST00000530605.1 ENST00000528198.1 ENST00000531880.1 ENST00000534650.1 |
KAT5
|
K(lysine) acetyltransferase 5 |
| chr12_+_53399942 | 1.30 |
ENST00000262056.9
|
EIF4B
|
eukaryotic translation initiation factor 4B |
| chr10_+_104613980 | 1.30 |
ENST00000339834.5
|
C10orf32
|
chromosome 10 open reading frame 32 |
| chr4_-_169239921 | 1.29 |
ENST00000514995.1
ENST00000393743.3 |
DDX60
|
DEAD (Asp-Glu-Ala-Asp) box polypeptide 60 |
| chr11_+_65479462 | 1.26 |
ENST00000377046.3
ENST00000352980.4 ENST00000341318.4 |
KAT5
|
K(lysine) acetyltransferase 5 |
| chr10_+_47894023 | 1.26 |
ENST00000358474.5
|
FAM21B
|
family with sequence similarity 21, member B |
| chr6_+_31105426 | 1.26 |
ENST00000547221.1
|
PSORS1C1
|
psoriasis susceptibility 1 candidate 1 |
| chr1_+_53308398 | 1.23 |
ENST00000371528.1
|
ZYG11A
|
zyg-11 family member A, cell cycle regulator |
| chr10_-_69597810 | 1.20 |
ENST00000483798.2
|
DNAJC12
|
DnaJ (Hsp40) homolog, subfamily C, member 12 |
| chr16_+_14802801 | 1.17 |
ENST00000526520.1
ENST00000531598.2 |
NPIPA3
|
nuclear pore complex interacting protein family, member A3 |
| chr12_-_68696652 | 1.16 |
ENST00000539972.1
|
MDM1
|
Mdm1 nuclear protein homolog (mouse) |
| chr14_-_101295407 | 1.13 |
ENST00000596284.1
|
AL117190.2
|
AL117190.2 |
| chr8_+_39759794 | 1.12 |
ENST00000518804.1
ENST00000519154.1 ENST00000522495.1 ENST00000522840.1 |
IDO1
|
indoleamine 2,3-dioxygenase 1 |
| chr12_+_133757995 | 1.11 |
ENST00000536435.2
ENST00000228289.5 ENST00000541211.2 ENST00000500625.3 ENST00000539248.2 ENST00000542711.2 ENST00000536899.2 ENST00000542986.2 ENST00000537565.1 ENST00000541975.2 |
ZNF268
|
zinc finger protein 268 |
| chr16_-_4817129 | 1.10 |
ENST00000545009.1
ENST00000219478.6 |
ZNF500
|
zinc finger protein 500 |
| chr2_-_208994548 | 1.10 |
ENST00000282141.3
|
CRYGC
|
crystallin, gamma C |
| chr16_-_15474904 | 1.09 |
ENST00000534094.1
|
NPIPA5
|
nuclear pore complex interacting protein family, member A5 |
| chr12_+_60083118 | 1.09 |
ENST00000261187.4
ENST00000543448.1 |
SLC16A7
|
solute carrier family 16 (monocarboxylate transporter), member 7 |
| chr1_-_23521222 | 1.06 |
ENST00000374619.1
|
HTR1D
|
5-hydroxytryptamine (serotonin) receptor 1D, G protein-coupled |
| chr15_-_58306295 | 1.06 |
ENST00000559517.1
|
ALDH1A2
|
aldehyde dehydrogenase 1 family, member A2 |
| chr10_-_115904361 | 1.06 |
ENST00000428953.1
ENST00000543782.1 |
C10orf118
|
chromosome 10 open reading frame 118 |
| chrX_-_15333736 | 1.05 |
ENST00000380470.3
|
ASB11
|
ankyrin repeat and SOCS box containing 11 |
| chr9_+_79074068 | 1.03 |
ENST00000444201.2
ENST00000376730.4 |
GCNT1
|
glucosaminyl (N-acetyl) transferase 1, core 2 |
| chr3_+_39424828 | 1.01 |
ENST00000273158.4
ENST00000431510.1 |
SLC25A38
|
solute carrier family 25, member 38 |
| chr3_-_48956818 | 0.97 |
ENST00000408959.2
|
ARIH2OS
|
ariadne homolog 2 opposite strand |
| chr19_-_48614033 | 0.97 |
ENST00000354276.3
|
PLA2G4C
|
phospholipase A2, group IVC (cytosolic, calcium-independent) |
| chr2_+_73429386 | 0.97 |
ENST00000398468.3
|
NOTO
|
notochord homeobox |
| chr19_-_48614063 | 0.91 |
ENST00000599921.1
ENST00000599111.1 |
PLA2G4C
|
phospholipase A2, group IVC (cytosolic, calcium-independent) |
| chr9_+_131062367 | 0.89 |
ENST00000601297.1
|
AL359091.2
|
CDNA: FLJ21673 fis, clone COL09042; HCG2036511; Uncharacterized protein |
| chr14_-_77737543 | 0.85 |
ENST00000298352.4
|
NGB
|
neuroglobin |
| chr4_+_100737954 | 0.85 |
ENST00000296414.7
ENST00000512369.1 |
DAPP1
|
dual adaptor of phosphotyrosine and 3-phosphoinositides |
| chr1_+_50459990 | 0.85 |
ENST00000448346.1
|
AL645730.2
|
AL645730.2 |
| chr1_-_247267580 | 0.85 |
ENST00000366501.1
ENST00000366500.1 ENST00000476158.2 ENST00000448299.2 ENST00000358785.4 ENST00000343381.6 |
ZNF669
|
zinc finger protein 669 |
| chr5_-_39270725 | 0.85 |
ENST00000512138.1
ENST00000512982.1 ENST00000540520.1 |
FYB
|
FYN binding protein |
| chr2_-_109605663 | 0.83 |
ENST00000409271.1
ENST00000258443.2 ENST00000376651.1 |
EDAR
|
ectodysplasin A receptor |
| chr6_+_118869452 | 0.82 |
ENST00000357525.5
|
PLN
|
phospholamban |
| chr12_-_4488872 | 0.80 |
ENST00000237837.1
|
FGF23
|
fibroblast growth factor 23 |
| chr8_-_2585929 | 0.79 |
ENST00000519393.1
ENST00000520842.1 ENST00000520570.1 ENST00000517357.1 ENST00000517984.1 ENST00000523971.1 |
RP11-134O21.1
|
RP11-134O21.1 |
| chr6_-_49681235 | 0.78 |
ENST00000339139.4
|
CRISP2
|
cysteine-rich secretory protein 2 |
| chr12_-_7656357 | 0.77 |
ENST00000396620.3
ENST00000432237.2 ENST00000359156.4 |
CD163
|
CD163 molecule |
| chr8_-_102218292 | 0.76 |
ENST00000518336.1
ENST00000520454.1 |
ZNF706
|
zinc finger protein 706 |
| chr8_+_86099884 | 0.75 |
ENST00000517476.1
ENST00000521429.1 |
E2F5
|
E2F transcription factor 5, p130-binding |
| chr1_-_23520755 | 0.74 |
ENST00000314113.3
|
HTR1D
|
5-hydroxytryptamine (serotonin) receptor 1D, G protein-coupled |
| chr17_+_7531281 | 0.73 |
ENST00000575729.1
ENST00000340624.5 |
SHBG
|
sex hormone-binding globulin |
| chrX_+_41192595 | 0.72 |
ENST00000399959.2
|
DDX3X
|
DEAD (Asp-Glu-Ala-Asp) box helicase 3, X-linked |
| chr17_+_71228740 | 0.72 |
ENST00000268942.8
ENST00000359042.2 |
C17orf80
|
chromosome 17 open reading frame 80 |
| chr2_+_109335929 | 0.71 |
ENST00000283195.6
|
RANBP2
|
RAN binding protein 2 |
| chr6_-_64029879 | 0.68 |
ENST00000370658.5
ENST00000485906.2 ENST00000370657.4 |
LGSN
|
lengsin, lens protein with glutamine synthetase domain |
| chr5_-_86534822 | 0.68 |
ENST00000445770.2
|
AC008394.1
|
Uncharacterized protein |
| chr4_-_186456766 | 0.68 |
ENST00000284771.6
|
PDLIM3
|
PDZ and LIM domain 3 |
| chr19_+_52264449 | 0.67 |
ENST00000599326.1
ENST00000598953.1 |
FPR2
|
formyl peptide receptor 2 |
| chr12_-_58220078 | 0.67 |
ENST00000549039.1
|
CTDSP2
|
CTD (carboxy-terminal domain, RNA polymerase II, polypeptide A) small phosphatase 2 |
| chr16_-_11375179 | 0.66 |
ENST00000312511.3
|
PRM1
|
protamine 1 |
| chrX_+_41193407 | 0.66 |
ENST00000457138.2
ENST00000441189.2 |
DDX3X
|
DEAD (Asp-Glu-Ala-Asp) box helicase 3, X-linked |
| chr7_-_100253993 | 0.65 |
ENST00000461605.1
ENST00000160382.5 |
ACTL6B
|
actin-like 6B |
| chr6_-_46703430 | 0.63 |
ENST00000537365.1
|
PLA2G7
|
phospholipase A2, group VII (platelet-activating factor acetylhydrolase, plasma) |
| chr18_+_61144160 | 0.62 |
ENST00000489441.1
ENST00000424602.1 |
SERPINB5
|
serpin peptidase inhibitor, clade B (ovalbumin), member 5 |
| chr19_+_13001840 | 0.62 |
ENST00000222214.5
ENST00000589039.1 ENST00000591470.1 ENST00000457854.1 ENST00000422947.2 ENST00000588905.1 ENST00000587072.1 |
GCDH
|
glutaryl-CoA dehydrogenase |
| chrX_+_49091920 | 0.61 |
ENST00000376227.3
|
CCDC22
|
coiled-coil domain containing 22 |
| chr4_-_186456652 | 0.59 |
ENST00000284767.5
ENST00000284770.5 |
PDLIM3
|
PDZ and LIM domain 3 |
| chr19_+_49199209 | 0.59 |
ENST00000522966.1
ENST00000425340.2 ENST00000391876.4 |
FUT2
|
fucosyltransferase 2 (secretor status included) |
| chr9_-_19786926 | 0.59 |
ENST00000341998.2
ENST00000286344.3 |
SLC24A2
|
solute carrier family 24 (sodium/potassium/calcium exchanger), member 2 |
| chr17_+_71228537 | 0.58 |
ENST00000577615.1
ENST00000585109.1 |
C17orf80
|
chromosome 17 open reading frame 80 |
| chr9_-_139343294 | 0.58 |
ENST00000313084.5
|
SEC16A
|
SEC16 homolog A (S. cerevisiae) |
| chr9_+_114287433 | 0.58 |
ENST00000358151.4
ENST00000355824.3 ENST00000374374.3 ENST00000309235.5 |
ZNF483
|
zinc finger protein 483 |
| chr10_-_100995603 | 0.57 |
ENST00000370552.3
ENST00000370549.1 |
HPSE2
|
heparanase 2 |
| chr20_-_60573188 | 0.57 |
ENST00000474089.1
|
TAF4
|
TAF4 RNA polymerase II, TATA box binding protein (TBP)-associated factor, 135kDa |
| chr4_+_57845043 | 0.56 |
ENST00000433463.1
ENST00000314595.5 |
POLR2B
|
polymerase (RNA) II (DNA directed) polypeptide B, 140kDa |
| chr19_+_15852203 | 0.56 |
ENST00000305892.1
|
OR10H3
|
olfactory receptor, family 10, subfamily H, member 3 |
| chr11_-_104035088 | 0.56 |
ENST00000302251.5
|
PDGFD
|
platelet derived growth factor D |
| chr6_-_142409936 | 0.55 |
ENST00000258042.1
|
NMBR
|
neuromedin B receptor |
| chr9_-_86571628 | 0.54 |
ENST00000376344.3
|
C9orf64
|
chromosome 9 open reading frame 64 |
| chrX_+_21857764 | 0.53 |
ENST00000365779.2
|
MBTPS2
|
membrane-bound transcription factor peptidase, site 2 |
| chr4_-_100242549 | 0.52 |
ENST00000305046.8
ENST00000394887.3 |
ADH1B
|
alcohol dehydrogenase 1B (class I), beta polypeptide |
| chr19_-_13617247 | 0.51 |
ENST00000573710.2
|
CACNA1A
|
calcium channel, voltage-dependent, P/Q type, alpha 1A subunit |
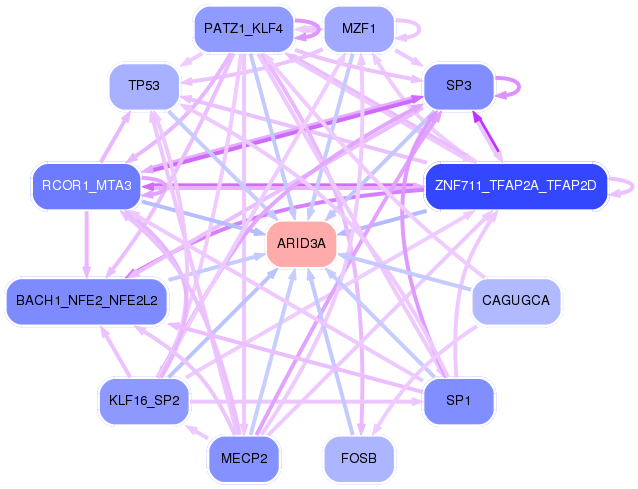
Network of associatons between targets according to the STRING database.

First level regulatory network of ARID3A
Gene Ontology Analysis
Gene overrepresentation in biological_process category:
| Log-likelihood per target | Total log-likelihood | Term | Description |
|---|---|---|---|
| 6.2 | 24.7 | GO:0051771 | negative regulation of nitric-oxide synthase biosynthetic process(GO:0051771) |
| 4.4 | 17.5 | GO:0003366 | cell-matrix adhesion involved in ameboidal cell migration(GO:0003366) |
| 3.4 | 10.2 | GO:0044278 | cell wall disruption in other organism(GO:0044278) |
| 2.4 | 7.2 | GO:1901624 | negative regulation of lymphocyte chemotaxis(GO:1901624) |
| 1.9 | 5.7 | GO:0002316 | follicular B cell differentiation(GO:0002316) activation of store-operated calcium channel activity(GO:0032237) positive regulation of store-operated calcium channel activity(GO:1901341) |
| 1.7 | 5.2 | GO:0007181 | transforming growth factor beta receptor complex assembly(GO:0007181) |
| 1.3 | 5.3 | GO:0044240 | multicellular organism lipid catabolic process(GO:0044240) |
| 1.3 | 2.5 | GO:0090264 | immune complex clearance(GO:0002434) immune complex clearance by monocytes and macrophages(GO:0002436) regulation of immune complex clearance by monocytes and macrophages(GO:0090264) |
| 1.3 | 5.0 | GO:0043376 | regulation of CD8-positive, alpha-beta T cell differentiation(GO:0043376) actin polymerization-dependent cell motility(GO:0070358) |
| 1.1 | 4.4 | GO:0045065 | cytotoxic T cell differentiation(GO:0045065) |
| 1.1 | 7.5 | GO:0034316 | negative regulation of Arp2/3 complex-mediated actin nucleation(GO:0034316) |
| 1.0 | 5.0 | GO:0002913 | positive regulation of T cell anergy(GO:0002669) positive regulation of lymphocyte anergy(GO:0002913) |
| 0.8 | 13.5 | GO:0045651 | positive regulation of granulocyte differentiation(GO:0030854) positive regulation of macrophage differentiation(GO:0045651) |
| 0.7 | 2.2 | GO:0002581 | negative regulation of antigen processing and presentation of peptide or polysaccharide antigen via MHC class II(GO:0002581) |
| 0.7 | 22.3 | GO:0035590 | purinergic nucleotide receptor signaling pathway(GO:0035590) |
| 0.7 | 2.0 | GO:0010430 | fatty acid omega-oxidation(GO:0010430) |
| 0.6 | 12.8 | GO:0002347 | response to tumor cell(GO:0002347) |
| 0.6 | 5.1 | GO:0043382 | positive regulation of memory T cell differentiation(GO:0043382) |
| 0.6 | 5.6 | GO:0043152 | induction of bacterial agglutination(GO:0043152) |
| 0.5 | 1.4 | GO:0045897 | positive regulation of transcription during mitosis(GO:0045897) |
| 0.4 | 2.7 | GO:0036493 | positive regulation of translation in response to endoplasmic reticulum stress(GO:0036493) |
| 0.4 | 1.3 | GO:0048382 | mesendoderm development(GO:0048382) |
| 0.3 | 2.4 | GO:0019441 | tryptophan catabolic process to kynurenine(GO:0019441) |
| 0.3 | 49.1 | GO:0030449 | regulation of complement activation(GO:0030449) |
| 0.3 | 1.4 | GO:0042256 | mature ribosome assembly(GO:0042256) |
| 0.3 | 1.3 | GO:0097010 | eukaryotic translation initiation factor 4F complex assembly(GO:0097010) |
| 0.3 | 1.3 | GO:1900245 | positive regulation of MDA-5 signaling pathway(GO:1900245) |
| 0.3 | 0.6 | GO:2000439 | positive regulation of monocyte extravasation(GO:2000439) |
| 0.3 | 4.9 | GO:1902187 | negative regulation of viral release from host cell(GO:1902187) |
| 0.3 | 0.8 | GO:0086092 | regulation of the force of heart contraction by cardiac conduction(GO:0086092) regulation of calcium ion binding(GO:1901876) negative regulation of calcium ion binding(GO:1901877) regulation of calcium ion import into sarcoplasmic reticulum(GO:1902080) negative regulation of calcium ion import into sarcoplasmic reticulum(GO:1902081) |
| 0.3 | 0.8 | GO:0042369 | vitamin D catabolic process(GO:0042369) |
| 0.3 | 3.4 | GO:1905097 | regulation of guanyl-nucleotide exchange factor activity(GO:1905097) |
| 0.2 | 1.7 | GO:2001256 | regulation of store-operated calcium entry(GO:2001256) |
| 0.2 | 0.7 | GO:0090526 | regulation of gluconeogenesis involved in cellular glucose homeostasis(GO:0090526) |
| 0.2 | 1.6 | GO:0010792 | DNA double-strand break processing involved in repair via single-strand annealing(GO:0010792) |
| 0.2 | 2.9 | GO:1904896 | ESCRT complex disassembly(GO:1904896) ESCRT III complex disassembly(GO:1904903) |
| 0.2 | 1.8 | GO:0014827 | intestine smooth muscle contraction(GO:0014827) |
| 0.2 | 3.2 | GO:0061365 | positive regulation of triglyceride lipase activity(GO:0061365) |
| 0.2 | 1.9 | GO:0086024 | adrenergic receptor signaling pathway involved in positive regulation of heart rate(GO:0086024) |
| 0.2 | 2.9 | GO:0002291 | T cell activation via T cell receptor contact with antigen bound to MHC molecule on antigen presenting cell(GO:0002291) |
| 0.2 | 0.6 | GO:0006568 | tryptophan metabolic process(GO:0006568) |
| 0.2 | 1.9 | GO:0006600 | creatine metabolic process(GO:0006600) |
| 0.2 | 0.7 | GO:0006542 | glutamine biosynthetic process(GO:0006542) |
| 0.2 | 4.6 | GO:0032897 | negative regulation of viral transcription(GO:0032897) |
| 0.2 | 1.5 | GO:0043950 | positive regulation of cAMP-mediated signaling(GO:0043950) |
| 0.2 | 3.0 | GO:0016446 | somatic hypermutation of immunoglobulin genes(GO:0016446) |
| 0.2 | 8.8 | GO:0044364 | killing of cells of other organism(GO:0031640) disruption of cells of other organism(GO:0044364) |
| 0.2 | 23.8 | GO:0002377 | immunoglobulin production(GO:0002377) |
| 0.2 | 1.6 | GO:0007144 | female meiosis I(GO:0007144) |
| 0.2 | 1.1 | GO:0015669 | gas transport(GO:0015669) oxygen transport(GO:0015671) |
| 0.2 | 2.6 | GO:0000729 | DNA double-strand break processing(GO:0000729) |
| 0.1 | 1.2 | GO:0046600 | negative regulation of centriole replication(GO:0046600) |
| 0.1 | 2.8 | GO:0097094 | craniofacial suture morphogenesis(GO:0097094) |
| 0.1 | 0.5 | GO:0038018 | Wnt receptor catabolic process(GO:0038018) |
| 0.1 | 1.1 | GO:1901475 | pyruvate transport(GO:0006848) pyruvate transmembrane transport(GO:1901475) |
| 0.1 | 1.7 | GO:0042989 | sequestering of actin monomers(GO:0042989) |
| 0.1 | 1.4 | GO:1903071 | positive regulation of ER-associated ubiquitin-dependent protein catabolic process(GO:1903071) |
| 0.1 | 0.6 | GO:0034441 | plasma lipoprotein particle oxidation(GO:0034441) |
| 0.1 | 1.0 | GO:0015816 | glycine transport(GO:0015816) |
| 0.1 | 0.4 | GO:0098759 | response to interleukin-8(GO:0098758) cellular response to interleukin-8(GO:0098759) |
| 0.1 | 1.1 | GO:0035799 | ureter maturation(GO:0035799) |
| 0.1 | 0.7 | GO:0002430 | complement receptor mediated signaling pathway(GO:0002430) |
| 0.1 | 1.9 | GO:0036149 | phosphatidylinositol acyl-chain remodeling(GO:0036149) |
| 0.1 | 0.2 | GO:0002566 | somatic diversification of immune receptors via somatic mutation(GO:0002566) |
| 0.1 | 1.5 | GO:0042226 | interleukin-6 biosynthetic process(GO:0042226) |
| 0.1 | 1.0 | GO:0060352 | cell adhesion molecule production(GO:0060352) |
| 0.1 | 0.8 | GO:1902455 | negative regulation of stem cell population maintenance(GO:1902455) |
| 0.1 | 0.8 | GO:1901409 | positive regulation of phosphorylation of RNA polymerase II C-terminal domain(GO:1901409) |
| 0.1 | 0.8 | GO:0060662 | tube lumen cavitation(GO:0060605) salivary gland cavitation(GO:0060662) |
| 0.1 | 0.3 | GO:0048859 | formation of anatomical boundary(GO:0048859) |
| 0.1 | 0.5 | GO:0006069 | ethanol oxidation(GO:0006069) |
| 0.1 | 1.7 | GO:0090083 | regulation of inclusion body assembly(GO:0090083) |
| 0.1 | 2.0 | GO:0000042 | protein targeting to Golgi(GO:0000042) |
| 0.1 | 2.9 | GO:0006363 | termination of RNA polymerase I transcription(GO:0006363) |
| 0.1 | 0.3 | GO:0051096 | positive regulation of helicase activity(GO:0051096) |
| 0.1 | 1.8 | GO:0000154 | rRNA modification(GO:0000154) |
| 0.1 | 5.3 | GO:0006635 | fatty acid beta-oxidation(GO:0006635) |
| 0.1 | 1.0 | GO:0030903 | notochord development(GO:0030903) |
| 0.1 | 0.2 | GO:0030309 | poly-N-acetyllactosamine metabolic process(GO:0030309) poly-N-acetyllactosamine biosynthetic process(GO:0030311) |
| 0.1 | 0.3 | GO:0035063 | nuclear speck organization(GO:0035063) |
| 0.0 | 0.6 | GO:0042355 | fucose catabolic process(GO:0019317) L-fucose metabolic process(GO:0042354) L-fucose catabolic process(GO:0042355) |
| 0.0 | 0.6 | GO:1990440 | ATF6-mediated unfolded protein response(GO:0036500) positive regulation of transcription from RNA polymerase II promoter in response to endoplasmic reticulum stress(GO:1990440) |
| 0.0 | 0.6 | GO:0007253 | cytoplasmic sequestering of NF-kappaB(GO:0007253) |
| 0.0 | 2.3 | GO:0050911 | detection of chemical stimulus involved in sensory perception of smell(GO:0050911) |
| 0.0 | 0.8 | GO:0006953 | acute-phase response(GO:0006953) |
| 0.0 | 0.4 | GO:0019509 | L-methionine biosynthetic process from methylthioadenosine(GO:0019509) |
| 0.0 | 6.7 | GO:0051092 | positive regulation of NF-kappaB transcription factor activity(GO:0051092) |
| 0.0 | 1.8 | GO:0002228 | natural killer cell mediated immunity(GO:0002228) |
| 0.0 | 0.2 | GO:0035860 | glial cell-derived neurotrophic factor receptor signaling pathway(GO:0035860) |
| 0.0 | 0.6 | GO:0006370 | 7-methylguanosine mRNA capping(GO:0006370) |
| 0.0 | 0.6 | GO:0018105 | peptidyl-serine phosphorylation(GO:0018105) |
| 0.0 | 0.3 | GO:0060285 | cilium-dependent cell motility(GO:0060285) |
| 0.0 | 0.3 | GO:0090161 | Golgi ribbon formation(GO:0090161) |
| 0.0 | 0.2 | GO:0039536 | negative regulation of RIG-I signaling pathway(GO:0039536) |
| 0.0 | 0.5 | GO:0006622 | protein targeting to lysosome(GO:0006622) |
| 0.0 | 1.3 | GO:0045071 | negative regulation of viral genome replication(GO:0045071) |
| 0.0 | 0.8 | GO:0034219 | carbohydrate transmembrane transport(GO:0034219) |
| 0.0 | 0.2 | GO:0006554 | lysine catabolic process(GO:0006554) |
| 0.0 | 0.7 | GO:0060512 | prostate gland morphogenesis(GO:0060512) |
| 0.0 | 0.9 | GO:0006470 | protein dephosphorylation(GO:0006470) |
| 0.0 | 0.4 | GO:0042359 | vitamin D metabolic process(GO:0042359) |
| 0.0 | 0.8 | GO:1902475 | L-alpha-amino acid transmembrane transport(GO:1902475) |
| 0.0 | 0.1 | GO:0098535 | de novo centriole assembly(GO:0098535) |
| 0.0 | 0.4 | GO:0007191 | adenylate cyclase-activating dopamine receptor signaling pathway(GO:0007191) |
| 0.0 | 0.7 | GO:0036498 | IRE1-mediated unfolded protein response(GO:0036498) |
| 0.0 | 0.3 | GO:0098828 | positive regulation of inhibitory postsynaptic potential(GO:0097151) modulation of inhibitory postsynaptic potential(GO:0098828) |
| 0.0 | 1.3 | GO:0007015 | actin filament organization(GO:0007015) |
| 0.0 | 0.6 | GO:0051123 | RNA polymerase II transcriptional preinitiation complex assembly(GO:0051123) |
| 0.0 | 2.1 | GO:0007586 | digestion(GO:0007586) |
| 0.0 | 0.1 | GO:0010886 | positive regulation of cholesterol storage(GO:0010886) |
| 0.0 | 0.4 | GO:0021522 | spinal cord motor neuron differentiation(GO:0021522) |
| 0.0 | 0.4 | GO:0007585 | respiratory gaseous exchange(GO:0007585) |
Gene overrepresentation in cellular_component category:
| Log-likelihood per target | Total log-likelihood | Term | Description |
|---|---|---|---|
| 8.2 | 24.7 | GO:0097057 | TRAF2-GSTP1 complex(GO:0097057) |
| 4.4 | 17.5 | GO:0034669 | integrin alpha4-beta7 complex(GO:0034669) |
| 1.7 | 5.1 | GO:0002079 | inner acrosomal membrane(GO:0002079) |
| 1.3 | 5.2 | GO:0034673 | inhibin-betaglycan-ActRII complex(GO:0034673) |
| 1.3 | 3.9 | GO:0097679 | other organism cytoplasm(GO:0097679) |
| 1.1 | 22.3 | GO:0044453 | integral component of nuclear inner membrane(GO:0005639) intrinsic component of nuclear inner membrane(GO:0031229) nuclear membrane part(GO:0044453) |
| 0.6 | 2.6 | GO:0032777 | Piccolo NuA4 histone acetyltransferase complex(GO:0032777) |
| 0.6 | 3.0 | GO:0032389 | MutLalpha complex(GO:0032389) |
| 0.6 | 7.5 | GO:0035631 | CD40 receptor complex(GO:0035631) |
| 0.5 | 5.0 | GO:0042105 | alpha-beta T cell receptor complex(GO:0042105) |
| 0.4 | 2.9 | GO:0000120 | RNA polymerase I transcription factor complex(GO:0000120) |
| 0.4 | 1.6 | GO:0005712 | chiasma(GO:0005712) |
| 0.4 | 5.0 | GO:0031209 | SCAR complex(GO:0031209) |
| 0.3 | 7.3 | GO:0042101 | T cell receptor complex(GO:0042101) |
| 0.3 | 5.6 | GO:0042589 | zymogen granule membrane(GO:0042589) |
| 0.3 | 1.1 | GO:0030485 | smooth muscle contractile fiber(GO:0030485) |
| 0.2 | 1.7 | GO:0030061 | mitochondrial crista(GO:0030061) |
| 0.2 | 1.4 | GO:1990037 | Lewy body core(GO:1990037) |
| 0.2 | 2.9 | GO:0000815 | ESCRT III complex(GO:0000815) |
| 0.2 | 14.3 | GO:0005758 | mitochondrial intermembrane space(GO:0005758) |
| 0.1 | 0.7 | GO:0044614 | nuclear pore cytoplasmic filaments(GO:0044614) |
| 0.1 | 5.8 | GO:0042571 | immunoglobulin complex, circulating(GO:0042571) |
| 0.1 | 0.3 | GO:0043159 | perinuclear theca(GO:0033011) cytoskeletal calyx(GO:0033150) acrosomal matrix(GO:0043159) |
| 0.1 | 3.2 | GO:0070971 | endoplasmic reticulum exit site(GO:0070971) |
| 0.1 | 20.2 | GO:0072562 | blood microparticle(GO:0072562) |
| 0.1 | 2.2 | GO:0042613 | MHC class II protein complex(GO:0042613) |
| 0.1 | 1.2 | GO:0031462 | Cul2-RING ubiquitin ligase complex(GO:0031462) |
| 0.1 | 1.5 | GO:0005687 | U4 snRNP(GO:0005687) |
| 0.1 | 8.8 | GO:0031985 | Golgi cisterna(GO:0031985) |
| 0.1 | 1.3 | GO:0016281 | eukaryotic translation initiation factor 4F complex(GO:0016281) |
| 0.1 | 1.6 | GO:0035861 | site of double-strand break(GO:0035861) |
| 0.1 | 7.5 | GO:1904813 | ficolin-1-rich granule(GO:0101002) ficolin-1-rich granule lumen(GO:1904813) |
| 0.1 | 1.4 | GO:0005852 | eukaryotic translation initiation factor 3 complex(GO:0005852) |
| 0.0 | 2.4 | GO:0005891 | voltage-gated calcium channel complex(GO:0005891) |
| 0.0 | 0.2 | GO:0044530 | supraspliceosomal complex(GO:0044530) |
| 0.0 | 0.5 | GO:0044754 | autolysosome(GO:0044754) |
| 0.0 | 0.1 | GO:0098536 | deuterosome(GO:0098536) |
| 0.0 | 4.1 | GO:0031902 | late endosome membrane(GO:0031902) |
| 0.0 | 0.3 | GO:0070187 | telosome(GO:0070187) |
| 0.0 | 5.9 | GO:0009897 | external side of plasma membrane(GO:0009897) |
| 0.0 | 0.8 | GO:0090533 | cation-transporting ATPase complex(GO:0090533) |
| 0.0 | 0.6 | GO:0033276 | transcription factor TFTC complex(GO:0033276) |
| 0.0 | 2.3 | GO:0000794 | condensed nuclear chromosome(GO:0000794) |
| 0.0 | 0.6 | GO:0071565 | nBAF complex(GO:0071565) |
| 0.0 | 3.0 | GO:0000932 | cytoplasmic mRNA processing body(GO:0000932) |
| 0.0 | 0.8 | GO:0016592 | mediator complex(GO:0016592) |
| 0.0 | 9.1 | GO:0005667 | transcription factor complex(GO:0005667) |
| 0.0 | 3.4 | GO:0043204 | perikaryon(GO:0043204) |
| 0.0 | 0.6 | GO:0005665 | DNA-directed RNA polymerase II, core complex(GO:0005665) |
| 0.0 | 0.1 | GO:0097442 | CA3 pyramidal cell dendrite(GO:0097442) |
| 0.0 | 0.3 | GO:0034362 | low-density lipoprotein particle(GO:0034362) |
| 0.0 | 0.1 | GO:0030688 | preribosome, small subunit precursor(GO:0030688) |
| 0.0 | 22.7 | GO:0005615 | extracellular space(GO:0005615) |
| 0.0 | 0.7 | GO:0000786 | nucleosome(GO:0000786) |
| 0.0 | 1.2 | GO:0005814 | centriole(GO:0005814) |
| 0.0 | 0.7 | GO:0101003 | ficolin-1-rich granule membrane(GO:0101003) |
Gene overrepresentation in molecular_function category:
| Log-likelihood per target | Total log-likelihood | Term | Description |
|---|---|---|---|
| 4.9 | 24.7 | GO:0070026 | nitric oxide binding(GO:0070026) |
| 2.0 | 22.3 | GO:0004931 | extracellular ATP-gated cation channel activity(GO:0004931) ATP-gated ion channel activity(GO:0035381) |
| 0.9 | 7.5 | GO:0071933 | Arp2/3 complex binding(GO:0071933) |
| 0.9 | 10.2 | GO:0070492 | oligosaccharide binding(GO:0070492) |
| 0.8 | 2.5 | GO:0031727 | CCR2 chemokine receptor binding(GO:0031727) |
| 0.8 | 4.0 | GO:0023024 | MHC class I protein complex binding(GO:0023024) |
| 0.5 | 5.3 | GO:0047498 | calcium-dependent phospholipase A2 activity(GO:0047498) |
| 0.5 | 5.2 | GO:0005114 | type II transforming growth factor beta receptor binding(GO:0005114) |
| 0.5 | 3.0 | GO:0000293 | ferric-chelate reductase activity(GO:0000293) |
| 0.5 | 2.0 | GO:0035276 | aldehyde oxidase activity(GO:0004031) ethanol binding(GO:0035276) |
| 0.5 | 7.5 | GO:0031996 | thioesterase binding(GO:0031996) |
| 0.4 | 5.3 | GO:0004300 | enoyl-CoA hydratase activity(GO:0004300) |
| 0.4 | 3.0 | GO:0032138 | single base insertion or deletion binding(GO:0032138) |
| 0.4 | 11.6 | GO:0042288 | MHC class I protein binding(GO:0042288) |
| 0.4 | 5.0 | GO:0042608 | T cell receptor binding(GO:0042608) |
| 0.4 | 1.1 | GO:0004833 | tryptophan 2,3-dioxygenase activity(GO:0004833) |
| 0.4 | 4.8 | GO:0032393 | MHC class I receptor activity(GO:0032393) |
| 0.3 | 1.0 | GO:0003829 | beta-1,3-galactosyl-O-glycosyl-glycoprotein beta-1,6-N-acetylglucosaminyltransferase activity(GO:0003829) |
| 0.3 | 74.6 | GO:0003823 | antigen binding(GO:0003823) |
| 0.3 | 1.3 | GO:0034057 | RNA strand-exchange activity(GO:0034057) |
| 0.3 | 1.5 | GO:0048248 | CXCR3 chemokine receptor binding(GO:0048248) |
| 0.3 | 2.5 | GO:0047499 | calcium-independent phospholipase A2 activity(GO:0047499) |
| 0.3 | 1.1 | GO:0005477 | pyruvate secondary active transmembrane transporter activity(GO:0005477) |
| 0.2 | 1.0 | GO:0030305 | heparanase activity(GO:0030305) |
| 0.2 | 0.8 | GO:0042030 | ATPase inhibitor activity(GO:0042030) |
| 0.2 | 0.8 | GO:0005105 | type 1 fibroblast growth factor receptor binding(GO:0005105) |
| 0.2 | 1.4 | GO:0033592 | RNA strand annealing activity(GO:0033592) |
| 0.2 | 0.8 | GO:0004060 | arylamine N-acetyltransferase activity(GO:0004060) |
| 0.2 | 5.7 | GO:0004435 | phosphatidylinositol phospholipase C activity(GO:0004435) |
| 0.2 | 0.5 | GO:0004024 | alcohol dehydrogenase activity, zinc-dependent(GO:0004024) |
| 0.2 | 1.7 | GO:0005432 | calcium:sodium antiporter activity(GO:0005432) |
| 0.2 | 0.7 | GO:0016211 | glutamate-ammonia ligase activity(GO:0004356) ammonia ligase activity(GO:0016211) acid-ammonia (or amide) ligase activity(GO:0016880) |
| 0.2 | 0.7 | GO:0005124 | scavenger receptor binding(GO:0005124) |
| 0.2 | 1.0 | GO:0015187 | glycine transmembrane transporter activity(GO:0015187) |
| 0.2 | 1.8 | GO:0043176 | amine binding(GO:0043176) serotonin binding(GO:0051378) |
| 0.1 | 5.1 | GO:0001848 | complement binding(GO:0001848) |
| 0.1 | 4.6 | GO:0003950 | NAD+ ADP-ribosyltransferase activity(GO:0003950) |
| 0.1 | 0.4 | GO:0008386 | cholesterol monooxygenase (side-chain-cleaving) activity(GO:0008386) |
| 0.1 | 2.9 | GO:0001164 | RNA polymerase I regulatory region DNA binding(GO:0001013) RNA polymerase I regulatory region sequence-specific DNA binding(GO:0001163) RNA polymerase I CORE element sequence-specific DNA binding(GO:0001164) |
| 0.1 | 0.7 | GO:0008420 | CTD phosphatase activity(GO:0008420) |
| 0.1 | 1.3 | GO:0001730 | 2'-5'-oligoadenylate synthetase activity(GO:0001730) |
| 0.1 | 0.4 | GO:0019959 | interleukin-8 binding(GO:0019959) |
| 0.1 | 3.2 | GO:0004806 | triglyceride lipase activity(GO:0004806) |
| 0.1 | 1.6 | GO:0030983 | mismatched DNA binding(GO:0030983) |
| 0.1 | 3.2 | GO:0008329 | signaling pattern recognition receptor activity(GO:0008329) pattern recognition receptor activity(GO:0038187) |
| 0.1 | 0.6 | GO:0008273 | calcium, potassium:sodium antiporter activity(GO:0008273) |
| 0.1 | 0.5 | GO:0017040 | ceramidase activity(GO:0017040) |
| 0.1 | 1.9 | GO:0031698 | beta-2 adrenergic receptor binding(GO:0031698) |
| 0.1 | 2.7 | GO:0008093 | cytoskeletal adaptor activity(GO:0008093) |
| 0.1 | 8.8 | GO:0001618 | virus receptor activity(GO:0001618) |
| 0.1 | 0.7 | GO:0005497 | androgen binding(GO:0005497) |
| 0.1 | 1.3 | GO:0016174 | NAD(P)H oxidase activity(GO:0016174) |
| 0.1 | 1.3 | GO:0035925 | mRNA 3'-UTR AU-rich region binding(GO:0035925) |
| 0.1 | 1.9 | GO:0016769 | transferase activity, transferring nitrogenous groups(GO:0016769) |
| 0.1 | 1.1 | GO:0004028 | 3-chloroallyl aldehyde dehydrogenase activity(GO:0004028) |
| 0.1 | 13.5 | GO:0001085 | RNA polymerase II transcription factor binding(GO:0001085) |
| 0.1 | 0.2 | GO:0003726 | double-stranded RNA adenosine deaminase activity(GO:0003726) |
| 0.1 | 0.2 | GO:0008532 | N-acetyllactosaminide beta-1,3-N-acetylglucosaminyltransferase activity(GO:0008532) |
| 0.0 | 0.2 | GO:0016639 | oxidoreductase activity, acting on the CH-NH2 group of donors, NAD or NADP as acceptor(GO:0016639) |
| 0.0 | 2.3 | GO:0004984 | olfactory receptor activity(GO:0004984) |
| 0.0 | 0.6 | GO:0017162 | aryl hydrocarbon receptor binding(GO:0017162) |
| 0.0 | 0.6 | GO:0008417 | fucosyltransferase activity(GO:0008417) |
| 0.0 | 1.7 | GO:0003785 | actin monomer binding(GO:0003785) |
| 0.0 | 2.6 | GO:0004402 | histone acetyltransferase activity(GO:0004402) |
| 0.0 | 0.6 | GO:0003995 | acyl-CoA dehydrogenase activity(GO:0003995) |
| 0.0 | 0.9 | GO:0043325 | phosphatidylinositol-3,4-bisphosphate binding(GO:0043325) |
| 0.0 | 1.1 | GO:0005212 | structural constituent of eye lens(GO:0005212) |
| 0.0 | 0.7 | GO:0019789 | SUMO transferase activity(GO:0019789) |
| 0.0 | 0.2 | GO:0016167 | glial cell-derived neurotrophic factor receptor activity(GO:0016167) |
| 0.0 | 0.2 | GO:0039552 | RIG-I binding(GO:0039552) |
| 0.0 | 0.6 | GO:0097602 | cullin family protein binding(GO:0097602) |
| 0.0 | 0.3 | GO:0017151 | DEAD/H-box RNA helicase binding(GO:0017151) |
| 0.0 | 0.2 | GO:0035005 | 1-phosphatidylinositol-4-phosphate 3-kinase activity(GO:0035005) |
| 0.0 | 0.6 | GO:0001055 | RNA polymerase II activity(GO:0001055) |
| 0.0 | 0.6 | GO:0005161 | platelet-derived growth factor receptor binding(GO:0005161) |
| 0.0 | 0.5 | GO:0008331 | high voltage-gated calcium channel activity(GO:0008331) |
| 0.0 | 0.8 | GO:0016538 | cyclin-dependent protein serine/threonine kinase regulator activity(GO:0016538) |
| 0.0 | 6.0 | GO:0000287 | magnesium ion binding(GO:0000287) |
| 0.0 | 2.2 | GO:0030295 | protein kinase activator activity(GO:0030295) |
| 0.0 | 0.5 | GO:0050681 | androgen receptor binding(GO:0050681) |
| 0.0 | 1.1 | GO:0005044 | scavenger receptor activity(GO:0005044) |
| 0.0 | 0.1 | GO:0048101 | calcium- and calmodulin-regulated 3',5'-cyclic-GMP phosphodiesterase activity(GO:0048101) |
| 0.0 | 0.5 | GO:0005109 | frizzled binding(GO:0005109) |
| 0.0 | 0.4 | GO:0004602 | glutathione peroxidase activity(GO:0004602) |
| 0.0 | 0.4 | GO:0016702 | oxidoreductase activity, acting on single donors with incorporation of molecular oxygen, incorporation of two atoms of oxygen(GO:0016702) |
| 0.0 | 1.6 | GO:0003697 | single-stranded DNA binding(GO:0003697) |
| 0.0 | 0.4 | GO:0031683 | G-protein beta/gamma-subunit complex binding(GO:0031683) |
| 0.0 | 1.3 | GO:0008307 | structural constituent of muscle(GO:0008307) |
| 0.0 | 1.3 | GO:0003727 | single-stranded RNA binding(GO:0003727) |
| 0.0 | 0.8 | GO:0015144 | carbohydrate transmembrane transporter activity(GO:0015144) carbohydrate transporter activity(GO:1901476) |
| 0.0 | 4.8 | GO:0031625 | ubiquitin protein ligase binding(GO:0031625) |
| 0.0 | 0.3 | GO:0005160 | transforming growth factor beta receptor binding(GO:0005160) |
| 0.0 | 1.6 | GO:0044325 | ion channel binding(GO:0044325) |
| 0.0 | 1.5 | GO:0005200 | structural constituent of cytoskeleton(GO:0005200) |
| 0.0 | 4.0 | GO:0005525 | GTP binding(GO:0005525) |
Gene overrepresentation in C2:CP category:
| Log-likelihood per target | Total log-likelihood | Term | Description |
|---|---|---|---|
| 0.6 | 17.5 | PID INTEGRIN5 PATHWAY | Beta5 beta6 beta7 and beta8 integrin cell surface interactions |
| 0.2 | 6.4 | PID AR NONGENOMIC PATHWAY | Nongenotropic Androgen signaling |
| 0.2 | 7.5 | SIG CD40PATHWAYMAP | Genes related to CD40 signaling |
| 0.2 | 18.8 | PID FCER1 PATHWAY | Fc-epsilon receptor I signaling in mast cells |
| 0.2 | 9.4 | PID CD8 TCR PATHWAY | TCR signaling in naïve CD8+ T cells |
| 0.1 | 3.8 | ST MYOCYTE AD PATHWAY | Myocyte Adrenergic Pathway is a specific case of the generalized Adrenergic Pathway. |
| 0.1 | 16.3 | NABA ECM AFFILIATED | Genes encoding proteins affiliated structurally or functionally to extracellular matrix proteins |
| 0.1 | 0.4 | PID IL8 CXCR1 PATHWAY | IL8- and CXCR1-mediated signaling events |
| 0.1 | 2.7 | PID NEPHRIN NEPH1 PATHWAY | Nephrin/Neph1 signaling in the kidney podocyte |
| 0.1 | 1.5 | PID CXCR3 PATHWAY | CXCR3-mediated signaling events |
| 0.0 | 0.7 | PID RANBP2 PATHWAY | Sumoylation by RanBP2 regulates transcriptional repression |
| 0.0 | 0.8 | PID TCR PATHWAY | TCR signaling in naïve CD4+ T cells |
| 0.0 | 1.5 | PID IL23 PATHWAY | IL23-mediated signaling events |
| 0.0 | 1.7 | PID ALPHA SYNUCLEIN PATHWAY | Alpha-synuclein signaling |
| 0.0 | 1.2 | PID UPA UPAR PATHWAY | Urokinase-type plasminogen activator (uPA) and uPAR-mediated signaling |
| 0.0 | 0.9 | PID PI3KCI PATHWAY | Class I PI3K signaling events |
| 0.0 | 0.6 | PID LIS1 PATHWAY | Lissencephaly gene (LIS1) in neuronal migration and development |
| 0.0 | 0.7 | PID SMAD2 3PATHWAY | Regulation of cytoplasmic and nuclear SMAD2/3 signaling |
| 0.0 | 5.2 | NABA ECM GLYCOPROTEINS | Genes encoding structural ECM glycoproteins |
| 0.0 | 1.6 | PID IL4 2PATHWAY | IL4-mediated signaling events |
| 0.0 | 0.4 | PID LPA4 PATHWAY | LPA4-mediated signaling events |
| 0.0 | 1.1 | PID TGFBR PATHWAY | TGF-beta receptor signaling |
| 0.0 | 1.3 | PID MTOR 4PATHWAY | mTOR signaling pathway |
| 0.0 | 0.8 | PID FGF PATHWAY | FGF signaling pathway |
| 0.0 | 0.5 | PID P73PATHWAY | p73 transcription factor network |
| 0.0 | 0.7 | PID TAP63 PATHWAY | Validated transcriptional targets of TAp63 isoforms |
| 0.0 | 0.1 | PID GMCSF PATHWAY | GMCSF-mediated signaling events |
| 0.0 | 1.3 | PID MYC REPRESS PATHWAY | Validated targets of C-MYC transcriptional repression |
| 0.0 | 0.2 | ST DIFFERENTIATION PATHWAY IN PC12 CELLS | Differentiation Pathway in PC12 Cells; this is a specific case of PAC1 Receptor Pathway. |
Gene overrepresentation in C2:CP:REACTOME category:
| Log-likelihood per target | Total log-likelihood | Term | Description |
|---|---|---|---|
| 0.7 | 13.4 | REACTOME THE NLRP3 INFLAMMASOME | Genes involved in The NLRP3 inflammasome |
| 0.6 | 20.3 | REACTOME GLUTATHIONE CONJUGATION | Genes involved in Glutathione conjugation |
| 0.4 | 37.7 | REACTOME IMMUNOREGULATORY INTERACTIONS BETWEEN A LYMPHOID AND A NON LYMPHOID CELL | Genes involved in Immunoregulatory interactions between a Lymphoid and a non-Lymphoid cell |
| 0.4 | 7.1 | REACTOME ACYL CHAIN REMODELLING OF PI | Genes involved in Acyl chain remodelling of PI |
| 0.3 | 2.5 | REACTOME ETHANOL OXIDATION | Genes involved in Ethanol oxidation |
| 0.3 | 2.5 | REACTOME BETA DEFENSINS | Genes involved in Beta defensins |
| 0.2 | 3.9 | REACTOME TERMINATION OF O GLYCAN BIOSYNTHESIS | Genes involved in Termination of O-glycan biosynthesis |
| 0.2 | 2.4 | REACTOME TRYPTOPHAN CATABOLISM | Genes involved in Tryptophan catabolism |
| 0.1 | 1.4 | REACTOME ACTIVATION OF GENES BY ATF4 | Genes involved in Activation of Genes by ATF4 |
| 0.1 | 3.3 | REACTOME REGULATION OF COMPLEMENT CASCADE | Genes involved in Regulation of Complement cascade |
| 0.1 | 5.7 | REACTOME ANTIGEN ACTIVATES B CELL RECEPTOR LEADING TO GENERATION OF SECOND MESSENGERS | Genes involved in Antigen Activates B Cell Receptor Leading to Generation of Second Messengers |
| 0.1 | 2.9 | REACTOME ENDOSOMAL SORTING COMPLEX REQUIRED FOR TRANSPORT ESCRT | Genes involved in Endosomal Sorting Complex Required For Transport (ESCRT) |
| 0.1 | 2.9 | REACTOME P130CAS LINKAGE TO MAPK SIGNALING FOR INTEGRINS | Genes involved in p130Cas linkage to MAPK signaling for integrins |
| 0.1 | 2.7 | REACTOME ACTIVATION OF RAC | Genes involved in Activation of Rac |
| 0.1 | 2.0 | REACTOME NOREPINEPHRINE NEUROTRANSMITTER RELEASE CYCLE | Genes involved in Norepinephrine Neurotransmitter Release Cycle |
| 0.1 | 3.4 | REACTOME INTERFERON ALPHA BETA SIGNALING | Genes involved in Interferon alpha/beta signaling |
| 0.1 | 3.6 | REACTOME METABOLISM OF STEROID HORMONES AND VITAMINS A AND D | Genes involved in Metabolism of steroid hormones and vitamins A and D |
| 0.1 | 2.9 | REACTOME RNA POL I TRANSCRIPTION TERMINATION | Genes involved in RNA Polymerase I Transcription Termination |
| 0.1 | 1.1 | REACTOME BILE SALT AND ORGANIC ANION SLC TRANSPORTERS | Genes involved in Bile salt and organic anion SLC transporters |
| 0.1 | 1.3 | REACTOME DESTABILIZATION OF MRNA BY BRF1 | Genes involved in Destabilization of mRNA by Butyrate Response Factor 1 (BRF1) |
| 0.1 | 1.3 | REACTOME MTORC1 MEDIATED SIGNALLING | Genes involved in mTORC1-mediated signalling |
| 0.1 | 0.8 | REACTOME SIGNALING BY FGFR3 MUTANTS | Genes involved in Signaling by FGFR3 mutants |
| 0.1 | 1.3 | REACTOME INSULIN SYNTHESIS AND PROCESSING | Genes involved in Insulin Synthesis and Processing |
| 0.1 | 2.7 | REACTOME OLFACTORY SIGNALING PATHWAY | Genes involved in Olfactory Signaling Pathway |
| 0.0 | 1.2 | REACTOME O LINKED GLYCOSYLATION OF MUCINS | Genes involved in O-linked glycosylation of mucins |
| 0.0 | 0.6 | REACTOME SEROTONIN RECEPTORS | Genes involved in Serotonin receptors |
| 0.0 | 0.6 | REACTOME SYNTHESIS SECRETION AND DEACYLATION OF GHRELIN | Genes involved in Synthesis, Secretion, and Deacylation of Ghrelin |
| 0.0 | 0.8 | REACTOME SIGNAL REGULATORY PROTEIN SIRP FAMILY INTERACTIONS | Genes involved in Signal regulatory protein (SIRP) family interactions |
| 0.0 | 1.0 | REACTOME HS GAG DEGRADATION | Genes involved in HS-GAG degradation |
| 0.0 | 1.9 | REACTOME DARPP 32 EVENTS | Genes involved in DARPP-32 events |
| 0.0 | 0.6 | REACTOME ACTIVATION OF CHAPERONES BY ATF6 ALPHA | Genes involved in Activation of Chaperones by ATF6-alpha |
| 0.0 | 0.6 | REACTOME VIRAL MESSENGER RNA SYNTHESIS | Genes involved in Viral Messenger RNA Synthesis |
| 0.0 | 1.6 | REACTOME SMAD2 SMAD3 SMAD4 HETEROTRIMER REGULATES TRANSCRIPTION | Genes involved in SMAD2/SMAD3:SMAD4 heterotrimer regulates transcription |
| 0.0 | 0.3 | REACTOME PACKAGING OF TELOMERE ENDS | Genes involved in Packaging Of Telomere Ends |
| 0.0 | 0.6 | REACTOME SIGNALING BY PDGF | Genes involved in Signaling by PDGF |
| 0.0 | 0.6 | REACTOME RNA POL II TRANSCRIPTION PRE INITIATION AND PROMOTER OPENING | Genes involved in RNA Polymerase II Transcription Pre-Initiation And Promoter Opening |
| 0.0 | 0.7 | REACTOME ACTIVATION OF CHAPERONE GENES BY XBP1S | Genes involved in Activation of Chaperone Genes by XBP1(S) |
| 0.0 | 0.7 | REACTOME NEP NS2 INTERACTS WITH THE CELLULAR EXPORT MACHINERY | Genes involved in NEP/NS2 Interacts with the Cellular Export Machinery |
| 0.0 | 2.2 | REACTOME MHC CLASS II ANTIGEN PRESENTATION | Genes involved in MHC class II antigen presentation |
| 0.0 | 0.4 | REACTOME METABOLISM OF POLYAMINES | Genes involved in Metabolism of polyamines |
| 0.0 | 0.4 | REACTOME ACTIVATED NOTCH1 TRANSMITS SIGNAL TO THE NUCLEUS | Genes involved in Activated NOTCH1 Transmits Signal to the Nucleus |
| 0.0 | 0.3 | REACTOME FACILITATIVE NA INDEPENDENT GLUCOSE TRANSPORTERS | Genes involved in Facilitative Na+-independent glucose transporters |
| 0.0 | 0.3 | REACTOME PROTEOLYTIC CLEAVAGE OF SNARE COMPLEX PROTEINS | Genes involved in Proteolytic cleavage of SNARE complex proteins |
| 0.0 | 0.2 | REACTOME SYNTHESIS OF PIPS AT THE GOLGI MEMBRANE | Genes involved in Synthesis of PIPs at the Golgi membrane |
| 0.0 | 0.9 | REACTOME MEIOTIC RECOMBINATION | Genes involved in Meiotic Recombination |
| 0.0 | 0.8 | REACTOME INTERFERON GAMMA SIGNALING | Genes involved in Interferon gamma signaling |