Project
GNF SymAtlas + NCI-60 cancer cell lines, comparison of cancers vs non-cancers, human (Su, 2004; Ross, 2000)
Navigation
Downloads
Results for CACAGUG
Z-value: 0.57
Motif logo

miRNA associated with seed CACAGUG
| Name | miRBASE accession |
|---|---|
|
hsa-miR-128-3p
|
MIMAT0000424 |
|
hsa-miR-216a-3p
|
MIMAT0022844 |
|
hsa-miR-3681-3p
|
MIMAT0018109 |
Activity profile of CACAGUG motif
Sorted Z-values of CACAGUG motif
| Promoter | Log-likelihood | Transcript | Gene | Gene Info |
|---|---|---|---|---|
| chrX_+_64708615 | 21.06 |
ENST00000338957.4
ENST00000423889.3 |
ZC3H12B
|
zinc finger CCCH-type containing 12B |
| chr10_-_21786179 | 15.76 |
ENST00000377113.5
|
CASC10
|
cancer susceptibility candidate 10 |
| chr12_-_105478339 | 12.08 |
ENST00000424857.2
ENST00000258494.9 |
ALDH1L2
|
aldehyde dehydrogenase 1 family, member L2 |
| chr16_-_4292071 | 8.92 |
ENST00000399609.3
|
SRL
|
sarcalumenin |
| chr16_-_70719925 | 8.63 |
ENST00000338779.6
|
MTSS1L
|
metastasis suppressor 1-like |
| chr17_+_47865917 | 8.05 |
ENST00000259021.4
ENST00000454930.2 ENST00000509773.1 ENST00000510819.1 ENST00000424009.2 |
KAT7
|
K(lysine) acetyltransferase 7 |
| chr10_+_104474207 | 7.96 |
ENST00000602831.1
ENST00000369893.5 |
SFXN2
|
sideroflexin 2 |
| chr11_-_18656028 | 7.79 |
ENST00000336349.5
|
SPTY2D1
|
SPT2, Suppressor of Ty, domain containing 1 (S. cerevisiae) |
| chr1_+_54519242 | 7.74 |
ENST00000234827.1
|
TCEANC2
|
transcription elongation factor A (SII) N-terminal and central domain containing 2 |
| chr19_+_7968728 | 7.43 |
ENST00000397981.3
ENST00000545011.1 ENST00000397983.3 ENST00000397979.3 |
MAP2K7
|
mitogen-activated protein kinase kinase 7 |
| chr7_-_103629963 | 7.41 |
ENST00000428762.1
ENST00000343529.5 ENST00000424685.2 |
RELN
|
reelin |
| chr5_-_132299313 | 6.96 |
ENST00000265343.5
|
AFF4
|
AF4/FMR2 family, member 4 |
| chr6_-_119399895 | 6.70 |
ENST00000338891.7
|
FAM184A
|
family with sequence similarity 184, member A |
| chr2_-_206950781 | 6.49 |
ENST00000403263.1
|
INO80D
|
INO80 complex subunit D |
| chr2_-_201936302 | 6.26 |
ENST00000453765.1
ENST00000452799.1 ENST00000446678.1 ENST00000418596.3 |
FAM126B
|
family with sequence similarity 126, member B |
| chr2_-_9143786 | 6.17 |
ENST00000462696.1
ENST00000305997.3 |
MBOAT2
|
membrane bound O-acyltransferase domain containing 2 |
| chrX_-_54384425 | 6.13 |
ENST00000375169.3
ENST00000354646.2 |
WNK3
|
WNK lysine deficient protein kinase 3 |
| chrX_-_40594755 | 6.06 |
ENST00000324817.1
|
MED14
|
mediator complex subunit 14 |
| chr14_+_101193164 | 5.85 |
ENST00000341267.4
|
DLK1
|
delta-like 1 homolog (Drosophila) |
| chr16_-_75498553 | 5.78 |
ENST00000569276.1
ENST00000357613.4 ENST00000561878.1 ENST00000566980.1 ENST00000567194.1 |
TMEM170A
RP11-77K12.1
|
transmembrane protein 170A Uncharacterized protein |
| chr16_+_1756162 | 5.78 |
ENST00000250894.4
ENST00000356010.5 |
MAPK8IP3
|
mitogen-activated protein kinase 8 interacting protein 3 |
| chr1_+_180601139 | 5.73 |
ENST00000367590.4
ENST00000367589.3 |
XPR1
|
xenotropic and polytropic retrovirus receptor 1 |
| chr7_+_77325738 | 5.70 |
ENST00000334955.8
|
RSBN1L
|
round spermatid basic protein 1-like |
| chr7_-_27183263 | 5.68 |
ENST00000222726.3
|
HOXA5
|
homeobox A5 |
| chr5_-_111754948 | 5.55 |
ENST00000261486.5
|
EPB41L4A
|
erythrocyte membrane protein band 4.1 like 4A |
| chr1_-_57045228 | 5.55 |
ENST00000371250.3
|
PPAP2B
|
phosphatidic acid phosphatase type 2B |
| chr20_+_10199468 | 5.49 |
ENST00000254976.2
ENST00000304886.2 |
SNAP25
|
synaptosomal-associated protein, 25kDa |
| chr12_-_42538657 | 5.47 |
ENST00000398675.3
|
GXYLT1
|
glucoside xylosyltransferase 1 |
| chr5_-_115910630 | 5.42 |
ENST00000343348.6
|
SEMA6A
|
sema domain, transmembrane domain (TM), and cytoplasmic domain, (semaphorin) 6A |
| chr7_+_138916231 | 5.37 |
ENST00000473989.3
ENST00000288561.8 |
UBN2
|
ubinuclein 2 |
| chr16_+_2587998 | 5.30 |
ENST00000441549.3
ENST00000268673.7 |
PDPK1
|
3-phosphoinositide dependent protein kinase-1 |
| chr10_-_90712520 | 5.24 |
ENST00000224784.6
|
ACTA2
|
actin, alpha 2, smooth muscle, aorta |
| chr10_-_124768300 | 5.23 |
ENST00000368886.5
|
IKZF5
|
IKAROS family zinc finger 5 (Pegasus) |
| chr17_+_47572647 | 5.20 |
ENST00000172229.3
|
NGFR
|
nerve growth factor receptor |
| chr11_+_14665263 | 5.17 |
ENST00000282096.4
|
PDE3B
|
phosphodiesterase 3B, cGMP-inhibited |
| chr11_+_118401706 | 5.16 |
ENST00000411589.2
ENST00000442938.2 ENST00000359862.4 |
TMEM25
|
transmembrane protein 25 |
| chr3_-_170303845 | 5.15 |
ENST00000231706.5
|
SLC7A14
|
solute carrier family 7, member 14 |
| chr17_+_25799008 | 5.15 |
ENST00000583370.1
ENST00000398988.3 ENST00000268763.6 |
KSR1
|
kinase suppressor of ras 1 |
| chr14_-_100070363 | 5.13 |
ENST00000380243.4
|
CCDC85C
|
coiled-coil domain containing 85C |
| chr2_-_71454185 | 4.90 |
ENST00000244221.8
|
PAIP2B
|
poly(A) binding protein interacting protein 2B |
| chr3_-_114790179 | 4.79 |
ENST00000462705.1
|
ZBTB20
|
zinc finger and BTB domain containing 20 |
| chr5_-_93447333 | 4.77 |
ENST00000395965.3
ENST00000505869.1 ENST00000509163.1 |
FAM172A
|
family with sequence similarity 172, member A |
| chr2_+_242641442 | 4.68 |
ENST00000313552.6
ENST00000406941.1 |
ING5
|
inhibitor of growth family, member 5 |
| chr20_+_49348081 | 4.65 |
ENST00000371610.2
|
PARD6B
|
par-6 family cell polarity regulator beta |
| chrX_+_23352133 | 4.64 |
ENST00000379361.4
|
PTCHD1
|
patched domain containing 1 |
| chr5_-_95297678 | 4.61 |
ENST00000237853.4
|
ELL2
|
elongation factor, RNA polymerase II, 2 |
| chr6_+_126112001 | 4.58 |
ENST00000392477.2
|
NCOA7
|
nuclear receptor coactivator 7 |
| chr20_-_48532019 | 4.45 |
ENST00000289431.5
|
SPATA2
|
spermatogenesis associated 2 |
| chr19_+_18794470 | 4.29 |
ENST00000321949.8
ENST00000338797.6 |
CRTC1
|
CREB regulated transcription coactivator 1 |
| chr19_+_41222998 | 4.28 |
ENST00000263370.2
|
ITPKC
|
inositol-trisphosphate 3-kinase C |
| chr16_+_66914264 | 4.26 |
ENST00000311765.2
ENST00000568869.1 ENST00000561704.1 ENST00000568398.1 ENST00000566776.1 |
PDP2
|
pyruvate dehyrogenase phosphatase catalytic subunit 2 |
| chr8_-_10588010 | 4.24 |
ENST00000304501.1
|
SOX7
|
SRY (sex determining region Y)-box 7 |
| chr22_-_28197486 | 4.23 |
ENST00000302326.4
|
MN1
|
meningioma (disrupted in balanced translocation) 1 |
| chr5_+_176560742 | 4.17 |
ENST00000439151.2
|
NSD1
|
nuclear receptor binding SET domain protein 1 |
| chrX_+_16804544 | 3.99 |
ENST00000380122.5
ENST00000398155.4 |
TXLNG
|
taxilin gamma |
| chr11_-_118661828 | 3.98 |
ENST00000264018.4
|
DDX6
|
DEAD (Asp-Glu-Ala-Asp) box helicase 6 |
| chrX_-_107979616 | 3.96 |
ENST00000372129.2
|
IRS4
|
insulin receptor substrate 4 |
| chr11_+_12695944 | 3.95 |
ENST00000361905.4
|
TEAD1
|
TEA domain family member 1 (SV40 transcriptional enhancer factor) |
| chr6_+_41606176 | 3.91 |
ENST00000441667.1
ENST00000230321.6 ENST00000373050.4 ENST00000446650.1 ENST00000435476.1 |
MDFI
|
MyoD family inhibitor |
| chr14_-_59932044 | 3.89 |
ENST00000395116.1
|
GPR135
|
G protein-coupled receptor 135 |
| chr7_-_31380502 | 3.89 |
ENST00000297142.3
|
NEUROD6
|
neuronal differentiation 6 |
| chr4_+_55095264 | 3.80 |
ENST00000257290.5
|
PDGFRA
|
platelet-derived growth factor receptor, alpha polypeptide |
| chr6_-_46293378 | 3.77 |
ENST00000330430.6
|
RCAN2
|
regulator of calcineurin 2 |
| chr5_+_65018017 | 3.74 |
ENST00000380985.5
ENST00000502464.1 |
NLN
|
neurolysin (metallopeptidase M3 family) |
| chr12_+_4918342 | 3.68 |
ENST00000280684.3
ENST00000433855.1 |
KCNA6
|
potassium voltage-gated channel, shaker-related subfamily, member 6 |
| chr9_-_23821273 | 3.63 |
ENST00000380110.4
|
ELAVL2
|
ELAV like neuron-specific RNA binding protein 2 |
| chr1_-_19229248 | 3.57 |
ENST00000375341.3
|
ALDH4A1
|
aldehyde dehydrogenase 4 family, member A1 |
| chr19_-_344786 | 3.49 |
ENST00000264819.4
|
MIER2
|
mesoderm induction early response 1, family member 2 |
| chr10_+_104678032 | 3.40 |
ENST00000369878.4
ENST00000369875.3 |
CNNM2
|
cyclin M2 |
| chr4_+_85504075 | 3.40 |
ENST00000295887.5
|
CDS1
|
CDP-diacylglycerol synthase (phosphatidate cytidylyltransferase) 1 |
| chr15_-_73661605 | 3.38 |
ENST00000261917.3
|
HCN4
|
hyperpolarization activated cyclic nucleotide-gated potassium channel 4 |
| chr11_-_74109422 | 3.37 |
ENST00000298198.4
|
PGM2L1
|
phosphoglucomutase 2-like 1 |
| chr19_+_1286097 | 3.37 |
ENST00000215368.2
|
EFNA2
|
ephrin-A2 |
| chr5_-_179780312 | 3.34 |
ENST00000253778.8
|
GFPT2
|
glutamine-fructose-6-phosphate transaminase 2 |
| chr16_-_402639 | 3.32 |
ENST00000262320.3
|
AXIN1
|
axin 1 |
| chr18_+_55102917 | 3.29 |
ENST00000491143.2
|
ONECUT2
|
one cut homeobox 2 |
| chr2_+_148602058 | 3.28 |
ENST00000241416.7
ENST00000535787.1 ENST00000404590.1 |
ACVR2A
|
activin A receptor, type IIA |
| chr19_-_7293942 | 3.28 |
ENST00000341500.5
ENST00000302850.5 |
INSR
|
insulin receptor |
| chr21_+_33245548 | 3.23 |
ENST00000270112.2
|
HUNK
|
hormonally up-regulated Neu-associated kinase |
| chr20_+_48599506 | 3.23 |
ENST00000244050.2
|
SNAI1
|
snail family zinc finger 1 |
| chr4_+_20255123 | 3.22 |
ENST00000504154.1
ENST00000273739.5 |
SLIT2
|
slit homolog 2 (Drosophila) |
| chr3_+_139654018 | 3.17 |
ENST00000458420.3
|
CLSTN2
|
calsyntenin 2 |
| chr14_-_92413727 | 3.16 |
ENST00000267620.10
|
FBLN5
|
fibulin 5 |
| chr10_-_81205373 | 3.15 |
ENST00000372336.3
|
ZCCHC24
|
zinc finger, CCHC domain containing 24 |
| chr20_-_41818373 | 3.14 |
ENST00000373187.1
ENST00000356100.2 ENST00000373184.1 ENST00000373190.1 |
PTPRT
|
protein tyrosine phosphatase, receptor type, T |
| chr3_+_36421826 | 3.10 |
ENST00000273183.3
|
STAC
|
SH3 and cysteine rich domain |
| chr2_+_203879568 | 3.09 |
ENST00000449802.1
|
NBEAL1
|
neurobeachin-like 1 |
| chr16_+_66878814 | 3.07 |
ENST00000394069.3
|
CA7
|
carbonic anhydrase VII |
| chr4_-_90229142 | 3.07 |
ENST00000609438.1
|
GPRIN3
|
GPRIN family member 3 |
| chrX_+_70316005 | 3.05 |
ENST00000374259.3
|
FOXO4
|
forkhead box O4 |
| chr1_-_21671968 | 3.02 |
ENST00000415912.2
|
ECE1
|
endothelin converting enzyme 1 |
| chr6_+_37225540 | 3.02 |
ENST00000373491.3
|
TBC1D22B
|
TBC1 domain family, member 22B |
| chr14_+_35515598 | 3.02 |
ENST00000280987.4
|
FAM177A1
|
family with sequence similarity 177, member A1 |
| chr10_-_15762124 | 3.01 |
ENST00000378076.3
|
ITGA8
|
integrin, alpha 8 |
| chr1_+_70876891 | 3.01 |
ENST00000411986.2
|
CTH
|
cystathionase (cystathionine gamma-lyase) |
| chr14_+_99947715 | 3.01 |
ENST00000389879.5
ENST00000557441.1 ENST00000555049.1 ENST00000555842.1 |
CCNK
|
cyclin K |
| chr10_+_60272814 | 3.00 |
ENST00000373886.3
|
BICC1
|
bicaudal C homolog 1 (Drosophila) |
| chr7_-_139876812 | 3.00 |
ENST00000397560.2
|
JHDM1D
|
lysine (K)-specific demethylase 7A |
| chr1_-_47697387 | 2.97 |
ENST00000371884.2
|
TAL1
|
T-cell acute lymphocytic leukemia 1 |
| chr10_-_70287231 | 2.95 |
ENST00000609923.1
|
SLC25A16
|
solute carrier family 25 (mitochondrial carrier; Graves disease autoantigen), member 16 |
| chr9_-_93405352 | 2.93 |
ENST00000375765.3
|
DIRAS2
|
DIRAS family, GTP-binding RAS-like 2 |
| chr11_+_33278811 | 2.93 |
ENST00000303296.4
ENST00000379016.3 |
HIPK3
|
homeodomain interacting protein kinase 3 |
| chr1_+_110453203 | 2.91 |
ENST00000357302.4
ENST00000344188.5 ENST00000329608.6 |
CSF1
|
colony stimulating factor 1 (macrophage) |
| chr5_+_172483347 | 2.90 |
ENST00000522692.1
ENST00000296953.2 ENST00000540014.1 ENST00000520420.1 |
CREBRF
|
CREB3 regulatory factor |
| chr7_+_100210133 | 2.87 |
ENST00000393950.2
ENST00000424091.2 |
MOSPD3
|
motile sperm domain containing 3 |
| chr1_-_92351769 | 2.85 |
ENST00000212355.4
|
TGFBR3
|
transforming growth factor, beta receptor III |
| chr5_+_7396141 | 2.84 |
ENST00000338316.4
|
ADCY2
|
adenylate cyclase 2 (brain) |
| chr1_-_154474589 | 2.84 |
ENST00000304760.2
|
SHE
|
Src homology 2 domain containing E |
| chr8_-_41166953 | 2.79 |
ENST00000220772.3
|
SFRP1
|
secreted frizzled-related protein 1 |
| chr16_-_65155833 | 2.78 |
ENST00000566827.1
ENST00000394156.3 ENST00000562998.1 |
CDH11
|
cadherin 11, type 2, OB-cadherin (osteoblast) |
| chr20_+_20348740 | 2.77 |
ENST00000310227.1
|
INSM1
|
insulinoma-associated 1 |
| chr16_-_18937726 | 2.72 |
ENST00000389467.3
ENST00000446231.2 |
SMG1
|
SMG1 phosphatidylinositol 3-kinase-related kinase |
| chr4_-_153457197 | 2.71 |
ENST00000281708.4
|
FBXW7
|
F-box and WD repeat domain containing 7, E3 ubiquitin protein ligase |
| chr16_-_68482440 | 2.71 |
ENST00000219334.5
|
SMPD3
|
sphingomyelin phosphodiesterase 3, neutral membrane (neutral sphingomyelinase II) |
| chr3_-_21792838 | 2.67 |
ENST00000281523.2
|
ZNF385D
|
zinc finger protein 385D |
| chr1_+_27561007 | 2.65 |
ENST00000319394.3
|
WDTC1
|
WD and tetratricopeptide repeats 1 |
| chr8_+_1922024 | 2.64 |
ENST00000320248.3
|
KBTBD11
|
kelch repeat and BTB (POZ) domain containing 11 |
| chr19_+_15218180 | 2.64 |
ENST00000342784.2
ENST00000597977.1 ENST00000600440.1 |
SYDE1
|
synapse defective 1, Rho GTPase, homolog 1 (C. elegans) |
| chr19_-_13617247 | 2.64 |
ENST00000573710.2
|
CACNA1A
|
calcium channel, voltage-dependent, P/Q type, alpha 1A subunit |
| chr12_+_70760056 | 2.62 |
ENST00000258111.4
|
KCNMB4
|
potassium large conductance calcium-activated channel, subfamily M, beta member 4 |
| chr4_+_144257915 | 2.61 |
ENST00000262995.4
|
GAB1
|
GRB2-associated binding protein 1 |
| chr12_+_103981044 | 2.59 |
ENST00000388887.2
|
STAB2
|
stabilin 2 |
| chr4_-_177713788 | 2.55 |
ENST00000280193.2
|
VEGFC
|
vascular endothelial growth factor C |
| chr12_-_124457371 | 2.55 |
ENST00000238156.3
ENST00000545037.1 |
CCDC92
|
coiled-coil domain containing 92 |
| chr2_-_25142708 | 2.53 |
ENST00000260600.5
ENST00000435135.1 |
ADCY3
|
adenylate cyclase 3 |
| chr6_+_136172820 | 2.53 |
ENST00000308191.6
|
PDE7B
|
phosphodiesterase 7B |
| chr12_-_12419703 | 2.52 |
ENST00000543091.1
ENST00000261349.4 |
LRP6
|
low density lipoprotein receptor-related protein 6 |
| chr2_-_27718052 | 2.52 |
ENST00000264703.3
|
FNDC4
|
fibronectin type III domain containing 4 |
| chr17_-_78450398 | 2.48 |
ENST00000306773.4
|
NPTX1
|
neuronal pentraxin I |
| chr4_-_53525406 | 2.47 |
ENST00000451218.2
ENST00000441222.3 |
USP46
|
ubiquitin specific peptidase 46 |
| chr14_-_30396948 | 2.47 |
ENST00000331968.5
|
PRKD1
|
protein kinase D1 |
| chr4_+_140374961 | 2.47 |
ENST00000305626.5
|
RAB33B
|
RAB33B, member RAS oncogene family |
| chr5_-_160279207 | 2.42 |
ENST00000327245.5
|
ATP10B
|
ATPase, class V, type 10B |
| chr5_+_135468516 | 2.40 |
ENST00000507118.1
ENST00000511116.1 ENST00000545279.1 ENST00000545620.1 |
SMAD5
|
SMAD family member 5 |
| chr2_+_241508039 | 2.35 |
ENST00000270357.4
|
RNPEPL1
|
arginyl aminopeptidase (aminopeptidase B)-like 1 |
| chr21_+_45285050 | 2.34 |
ENST00000291572.8
|
AGPAT3
|
1-acylglycerol-3-phosphate O-acyltransferase 3 |
| chr1_+_46972668 | 2.34 |
ENST00000371956.4
ENST00000360032.3 |
DMBX1
|
diencephalon/mesencephalon homeobox 1 |
| chr22_-_39239987 | 2.33 |
ENST00000333039.2
|
NPTXR
|
neuronal pentraxin receptor |
| chr1_-_179198702 | 2.31 |
ENST00000502732.1
|
ABL2
|
c-abl oncogene 2, non-receptor tyrosine kinase |
| chr1_+_203274639 | 2.30 |
ENST00000290551.4
|
BTG2
|
BTG family, member 2 |
| chr22_+_41956767 | 2.29 |
ENST00000306149.7
|
CSDC2
|
cold shock domain containing C2, RNA binding |
| chr9_-_26947453 | 2.25 |
ENST00000397292.3
|
PLAA
|
phospholipase A2-activating protein |
| chr11_-_30038490 | 2.22 |
ENST00000328224.6
|
KCNA4
|
potassium voltage-gated channel, shaker-related subfamily, member 4 |
| chr2_-_100721178 | 2.19 |
ENST00000409236.2
|
AFF3
|
AF4/FMR2 family, member 3 |
| chr15_+_33010175 | 2.18 |
ENST00000300177.4
ENST00000560677.1 ENST00000560830.1 |
GREM1
|
gremlin 1, DAN family BMP antagonist |
| chr6_-_166075557 | 2.18 |
ENST00000539869.2
ENST00000366882.1 |
PDE10A
|
phosphodiesterase 10A |
| chr12_+_20522179 | 2.18 |
ENST00000359062.3
|
PDE3A
|
phosphodiesterase 3A, cGMP-inhibited |
| chr4_-_107957454 | 2.16 |
ENST00000285311.3
|
DKK2
|
dickkopf WNT signaling pathway inhibitor 2 |
| chr5_+_76506706 | 2.13 |
ENST00000340978.3
ENST00000346042.3 ENST00000264917.5 ENST00000342343.4 ENST00000333194.4 |
PDE8B
|
phosphodiesterase 8B |
| chr2_+_189839046 | 2.13 |
ENST00000304636.3
ENST00000317840.5 |
COL3A1
|
collagen, type III, alpha 1 |
| chr17_+_54911444 | 2.13 |
ENST00000284061.3
ENST00000572810.1 |
DGKE
|
diacylglycerol kinase, epsilon 64kDa |
| chr3_-_56502375 | 2.12 |
ENST00000288221.6
|
ERC2
|
ELKS/RAB6-interacting/CAST family member 2 |
| chr6_-_99873145 | 2.11 |
ENST00000369239.5
ENST00000438806.1 |
PNISR
|
PNN-interacting serine/arginine-rich protein |
| chr12_-_57400227 | 2.11 |
ENST00000300101.2
|
ZBTB39
|
zinc finger and BTB domain containing 39 |
| chr12_-_120806960 | 2.11 |
ENST00000257552.2
|
MSI1
|
musashi RNA-binding protein 1 |
| chr15_+_29131103 | 2.11 |
ENST00000558402.1
ENST00000558330.1 |
APBA2
|
amyloid beta (A4) precursor protein-binding, family A, member 2 |
| chr9_+_112403088 | 2.10 |
ENST00000448454.2
|
PALM2
|
paralemmin 2 |
| chr19_+_18942720 | 2.07 |
ENST00000262803.5
|
UPF1
|
UPF1 regulator of nonsense transcripts homolog (yeast) |
| chr10_+_89419370 | 2.07 |
ENST00000361175.4
ENST00000456849.1 |
PAPSS2
|
3'-phosphoadenosine 5'-phosphosulfate synthase 2 |
| chr2_-_50574856 | 2.04 |
ENST00000342183.5
|
NRXN1
|
neurexin 1 |
| chr9_+_132934835 | 2.04 |
ENST00000372398.3
|
NCS1
|
neuronal calcium sensor 1 |
| chr5_+_52285144 | 2.01 |
ENST00000296585.5
|
ITGA2
|
integrin, alpha 2 (CD49B, alpha 2 subunit of VLA-2 receptor) |
| chr4_-_174451370 | 2.01 |
ENST00000359562.4
|
HAND2
|
heart and neural crest derivatives expressed 2 |
| chr9_+_34958254 | 2.01 |
ENST00000242315.3
|
KIAA1045
|
KIAA1045 |
| chr17_-_58603568 | 2.00 |
ENST00000083182.3
|
APPBP2
|
amyloid beta precursor protein (cytoplasmic tail) binding protein 2 |
| chr6_-_88876058 | 2.00 |
ENST00000369501.2
|
CNR1
|
cannabinoid receptor 1 (brain) |
| chr6_+_117002339 | 1.98 |
ENST00000413340.1
ENST00000368564.1 ENST00000356348.1 |
KPNA5
|
karyopherin alpha 5 (importin alpha 6) |
| chr8_-_127570603 | 1.97 |
ENST00000304916.3
|
FAM84B
|
family with sequence similarity 84, member B |
| chr14_-_91526922 | 1.97 |
ENST00000418736.2
ENST00000261991.3 |
RPS6KA5
|
ribosomal protein S6 kinase, 90kDa, polypeptide 5 |
| chr8_+_28351707 | 1.96 |
ENST00000537916.1
ENST00000523546.1 ENST00000240093.3 |
FZD3
|
frizzled family receptor 3 |
| chr14_-_61116168 | 1.95 |
ENST00000247182.6
|
SIX1
|
SIX homeobox 1 |
| chr15_+_73344791 | 1.94 |
ENST00000261908.6
|
NEO1
|
neogenin 1 |
| chr11_-_31839488 | 1.93 |
ENST00000419022.1
ENST00000379132.3 ENST00000379129.2 |
PAX6
|
paired box 6 |
| chr6_-_8064567 | 1.92 |
ENST00000543936.1
ENST00000397457.2 |
BLOC1S5
|
biogenesis of lysosomal organelles complex-1, subunit 5, muted |
| chr18_+_67956135 | 1.92 |
ENST00000397942.3
|
SOCS6
|
suppressor of cytokine signaling 6 |
| chr5_-_121413974 | 1.90 |
ENST00000231004.4
|
LOX
|
lysyl oxidase |
| chr4_+_56815102 | 1.88 |
ENST00000257287.4
|
CEP135
|
centrosomal protein 135kDa |
| chr8_-_42698433 | 1.88 |
ENST00000345117.2
ENST00000254250.3 |
THAP1
|
THAP domain containing, apoptosis associated protein 1 |
| chr7_-_105029329 | 1.87 |
ENST00000393651.3
ENST00000460391.1 |
SRPK2
|
SRSF protein kinase 2 |
| chr1_-_113498943 | 1.87 |
ENST00000369626.3
|
SLC16A1
|
solute carrier family 16 (monocarboxylate transporter), member 1 |
| chr3_+_11034403 | 1.85 |
ENST00000287766.4
ENST00000425938.1 |
SLC6A1
|
solute carrier family 6 (neurotransmitter transporter), member 1 |
| chr2_-_109605663 | 1.85 |
ENST00000409271.1
ENST00000258443.2 ENST00000376651.1 |
EDAR
|
ectodysplasin A receptor |
| chr2_+_192542850 | 1.85 |
ENST00000410026.2
|
NABP1
|
nucleic acid binding protein 1 |
| chr7_-_152133059 | 1.83 |
ENST00000262189.6
ENST00000355193.2 |
KMT2C
|
lysine (K)-specific methyltransferase 2C |
| chr6_+_149068464 | 1.82 |
ENST00000367463.4
|
UST
|
uronyl-2-sulfotransferase |
| chr11_+_72929319 | 1.80 |
ENST00000393597.2
ENST00000311131.2 |
P2RY2
|
purinergic receptor P2Y, G-protein coupled, 2 |
| chr7_+_97736197 | 1.80 |
ENST00000297293.5
|
LMTK2
|
lemur tyrosine kinase 2 |
| chr18_+_19749386 | 1.78 |
ENST00000269216.3
|
GATA6
|
GATA binding protein 6 |
| chr19_-_43969796 | 1.78 |
ENST00000244333.3
|
LYPD3
|
LY6/PLAUR domain containing 3 |
| chr5_+_152870106 | 1.78 |
ENST00000285900.5
|
GRIA1
|
glutamate receptor, ionotropic, AMPA 1 |
| chrX_+_133507327 | 1.77 |
ENST00000332070.3
ENST00000394292.1 ENST00000370799.1 ENST00000416404.2 |
PHF6
|
PHD finger protein 6 |
| chr1_+_213123915 | 1.76 |
ENST00000366968.4
ENST00000490792.1 |
VASH2
|
vasohibin 2 |
| chr1_+_32573636 | 1.75 |
ENST00000373625.3
|
KPNA6
|
karyopherin alpha 6 (importin alpha 7) |
| chr15_+_96873921 | 1.75 |
ENST00000394166.3
|
NR2F2
|
nuclear receptor subfamily 2, group F, member 2 |
| chr4_+_81951957 | 1.74 |
ENST00000282701.2
|
BMP3
|
bone morphogenetic protein 3 |
| chr3_+_141205852 | 1.74 |
ENST00000286364.3
ENST00000452898.1 |
RASA2
|
RAS p21 protein activator 2 |
| chr11_-_45687128 | 1.74 |
ENST00000308064.2
|
CHST1
|
carbohydrate (keratan sulfate Gal-6) sulfotransferase 1 |
| chr12_-_95611149 | 1.72 |
ENST00000549499.1
ENST00000343958.4 ENST00000546711.1 |
FGD6
|
FYVE, RhoGEF and PH domain containing 6 |
| chr3_-_178790057 | 1.69 |
ENST00000311417.2
|
ZMAT3
|
zinc finger, matrin-type 3 |
| chr9_+_133454943 | 1.67 |
ENST00000319725.9
|
FUBP3
|
far upstream element (FUSE) binding protein 3 |
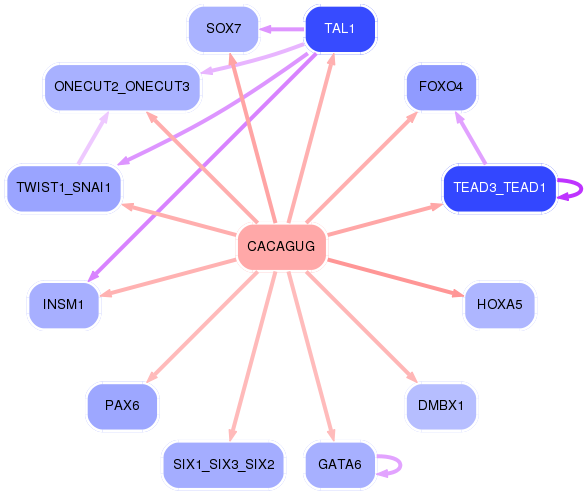
Network of associatons between targets according to the STRING database.

First level regulatory network of CACAGUG
Gene Ontology Analysis
Gene overrepresentation in biological_process category:
| Log-likelihood per target | Total log-likelihood | Term | Description |
|---|---|---|---|
| 4.0 | 12.1 | GO:0009258 | 10-formyltetrahydrofolate catabolic process(GO:0009258) |
| 2.7 | 8.2 | GO:0060535 | trachea cartilage morphogenesis(GO:0060535) |
| 2.1 | 8.2 | GO:0097476 | spinal cord motor neuron migration(GO:0097476) lateral motor column neuron migration(GO:0097477) |
| 2.0 | 8.0 | GO:0043983 | histone H4-K12 acetylation(GO:0043983) |
| 1.9 | 1.9 | GO:0001935 | endothelial cell proliferation(GO:0001935) |
| 1.4 | 4.3 | GO:1902630 | regulation of membrane hyperpolarization(GO:1902630) |
| 1.4 | 2.8 | GO:0090244 | Wnt signaling pathway involved in somitogenesis(GO:0090244) |
| 1.3 | 4.0 | GO:0019072 | viral genome packaging(GO:0019072) viral RNA genome packaging(GO:0019074) |
| 1.3 | 2.6 | GO:1901165 | positive regulation of trophoblast cell migration(GO:1901165) |
| 1.3 | 3.8 | GO:0072275 | metanephric glomerulus morphogenesis(GO:0072275) metanephric glomerulus vasculature morphogenesis(GO:0072276) metanephric glomerular capillary formation(GO:0072277) |
| 1.2 | 3.7 | GO:1902809 | skeletal muscle fiber differentiation(GO:0098528) regulation of skeletal muscle fiber differentiation(GO:1902809) |
| 1.1 | 3.2 | GO:0021966 | corticospinal neuron axon guidance(GO:0021966) negative regulation of granulocyte chemotaxis(GO:0071623) negative regulation of mononuclear cell migration(GO:0071676) negative regulation of neutrophil chemotaxis(GO:0090024) negative regulation of neutrophil migration(GO:1902623) |
| 1.1 | 5.3 | GO:0071698 | olfactory placode formation(GO:0030910) olfactory placode development(GO:0071698) olfactory placode morphogenesis(GO:0071699) |
| 1.0 | 5.2 | GO:1903588 | negative regulation of blood vessel endothelial cell proliferation involved in sprouting angiogenesis(GO:1903588) |
| 1.0 | 2.1 | GO:0000294 | nuclear-transcribed mRNA catabolic process, endonucleolytic cleavage-dependent decay(GO:0000294) |
| 1.0 | 3.0 | GO:0044828 | negative regulation by host of viral genome replication(GO:0044828) |
| 1.0 | 5.0 | GO:0099590 | neurotransmitter receptor internalization(GO:0099590) |
| 1.0 | 3.0 | GO:0060018 | astrocyte fate commitment(GO:0060018) |
| 1.0 | 2.9 | GO:1900169 | regulation of glucocorticoid mediated signaling pathway(GO:1900169) |
| 0.9 | 2.8 | GO:0007181 | transforming growth factor beta receptor complex assembly(GO:0007181) |
| 0.9 | 7.4 | GO:0035897 | proteolysis in other organism(GO:0035897) |
| 0.9 | 2.8 | GO:0003358 | noradrenergic neuron development(GO:0003358) |
| 0.9 | 3.6 | GO:0019470 | 4-hydroxyproline catabolic process(GO:0019470) |
| 0.9 | 5.2 | GO:0090131 | mesenchyme migration(GO:0090131) |
| 0.8 | 4.2 | GO:0001957 | intramembranous ossification(GO:0001957) direct ossification(GO:0036072) |
| 0.8 | 2.5 | GO:0008355 | olfactory learning(GO:0008355) |
| 0.8 | 3.3 | GO:1990535 | transformation of host cell by virus(GO:0019087) neuron projection maintenance(GO:1990535) |
| 0.8 | 5.7 | GO:0072502 | cellular phosphate ion homeostasis(GO:0030643) cellular trivalent inorganic anion homeostasis(GO:0072502) |
| 0.8 | 3.2 | GO:0060800 | regulation of cell differentiation involved in embryonic placenta development(GO:0060800) |
| 0.8 | 2.4 | GO:0060023 | soft palate development(GO:0060023) |
| 0.8 | 3.1 | GO:0018352 | protein-pyridoxal-5-phosphate linkage(GO:0018352) |
| 0.8 | 3.0 | GO:0070317 | negative regulation of G0 to G1 transition(GO:0070317) |
| 0.8 | 3.0 | GO:0010816 | substance P catabolic process(GO:0010814) calcitonin catabolic process(GO:0010816) endothelin maturation(GO:0034959) |
| 0.7 | 1.5 | GO:0007621 | negative regulation of female receptivity(GO:0007621) |
| 0.7 | 2.2 | GO:1900158 | negative regulation of osteoclast proliferation(GO:0090291) negative regulation of bone mineralization involved in bone maturation(GO:1900158) |
| 0.7 | 3.4 | GO:0033591 | response to L-ascorbic acid(GO:0033591) |
| 0.7 | 1.4 | GO:2001038 | regulation of cellular response to drug(GO:2001038) |
| 0.7 | 2.0 | GO:0099553 | trans-synaptic signaling by lipid, modulating synaptic transmission(GO:0099552) trans-synaptic signaling by endocannabinoid, modulating synaptic transmission(GO:0099553) |
| 0.7 | 3.3 | GO:0042713 | sperm ejaculation(GO:0042713) |
| 0.7 | 2.0 | GO:0045976 | negative regulation of mitotic cell cycle, embryonic(GO:0045976) |
| 0.6 | 5.1 | GO:0001672 | regulation of chromatin assembly or disassembly(GO:0001672) |
| 0.6 | 3.1 | GO:0032849 | positive regulation of cellular pH reduction(GO:0032849) |
| 0.6 | 4.2 | GO:0000414 | regulation of histone H3-K36 methylation(GO:0000414) |
| 0.6 | 4.1 | GO:0086046 | membrane depolarization during SA node cell action potential(GO:0086046) |
| 0.6 | 2.9 | GO:0060611 | positive regulation of odontogenesis of dentin-containing tooth(GO:0042488) mammary gland fat development(GO:0060611) positive regulation of macrophage colony-stimulating factor signaling pathway(GO:1902228) positive regulation of response to macrophage colony-stimulating factor(GO:1903971) positive regulation of cellular response to macrophage colony-stimulating factor stimulus(GO:1903974) positive regulation of microglial cell migration(GO:1904141) |
| 0.6 | 2.2 | GO:2000686 | regulation of rubidium ion transmembrane transporter activity(GO:2000686) |
| 0.5 | 1.6 | GO:0061534 | gamma-aminobutyric acid secretion, neurotransmission(GO:0061534) |
| 0.5 | 2.7 | GO:2000639 | regulation of SREBP signaling pathway(GO:2000638) negative regulation of SREBP signaling pathway(GO:2000639) |
| 0.5 | 4.8 | GO:0008343 | adult feeding behavior(GO:0008343) |
| 0.5 | 5.3 | GO:1990416 | cellular response to brain-derived neurotrophic factor stimulus(GO:1990416) |
| 0.5 | 2.1 | GO:0000103 | sulfate assimilation(GO:0000103) |
| 0.5 | 5.2 | GO:0033629 | negative regulation of cell adhesion mediated by integrin(GO:0033629) |
| 0.5 | 1.5 | GO:0098746 | fast, calcium ion-dependent exocytosis of neurotransmitter(GO:0098746) |
| 0.5 | 2.6 | GO:1901490 | regulation of lymphangiogenesis(GO:1901490) |
| 0.5 | 2.0 | GO:0003357 | noradrenergic neuron differentiation(GO:0003357) |
| 0.5 | 1.0 | GO:0045900 | negative regulation of translational elongation(GO:0045900) |
| 0.5 | 1.4 | GO:0031133 | regulation of axon diameter(GO:0031133) positive regulation of adenosine receptor signaling pathway(GO:0060168) |
| 0.5 | 1.9 | GO:0035879 | plasma membrane lactate transport(GO:0035879) |
| 0.5 | 1.9 | GO:0014054 | positive regulation of gamma-aminobutyric acid secretion(GO:0014054) |
| 0.4 | 0.9 | GO:0045994 | positive regulation of translational initiation by iron(GO:0045994) |
| 0.4 | 1.8 | GO:0032912 | negative regulation of transforming growth factor beta2 production(GO:0032912) |
| 0.4 | 1.3 | GO:0033023 | mast cell homeostasis(GO:0033023) mast cell apoptotic process(GO:0033024) regulation of mast cell apoptotic process(GO:0033025) regulation of mast cell proliferation(GO:0070666) positive regulation of mast cell proliferation(GO:0070668) |
| 0.4 | 1.7 | GO:0060849 | radial pattern formation(GO:0009956) regulation of transcription involved in lymphatic endothelial cell fate commitment(GO:0060849) |
| 0.4 | 1.3 | GO:0002541 | activation of plasma proteins involved in acute inflammatory response(GO:0002541) |
| 0.4 | 5.1 | GO:0048251 | elastic fiber assembly(GO:0048251) |
| 0.4 | 0.8 | GO:0061113 | pancreas morphogenesis(GO:0061113) |
| 0.4 | 2.8 | GO:0006655 | phosphatidylglycerol biosynthetic process(GO:0006655) |
| 0.4 | 2.4 | GO:0001880 | Mullerian duct regression(GO:0001880) |
| 0.4 | 2.8 | GO:0021957 | corticospinal tract morphogenesis(GO:0021957) |
| 0.4 | 1.6 | GO:0042636 | negative regulation of hair cycle(GO:0042636) |
| 0.4 | 2.0 | GO:0043988 | histone H3-S28 phosphorylation(GO:0043988) histone H2A phosphorylation(GO:1990164) |
| 0.4 | 1.9 | GO:0003322 | pancreatic A cell development(GO:0003322) |
| 0.4 | 1.1 | GO:0045082 | positive regulation of interleukin-10 biosynthetic process(GO:0045082) |
| 0.4 | 6.1 | GO:0071786 | endoplasmic reticulum tubular network organization(GO:0071786) |
| 0.4 | 1.9 | GO:0035063 | nuclear speck organization(GO:0035063) |
| 0.4 | 0.4 | GO:2000729 | positive regulation of mesenchymal cell proliferation involved in ureter development(GO:2000729) |
| 0.4 | 2.2 | GO:0060282 | positive regulation of oocyte development(GO:0060282) |
| 0.4 | 3.3 | GO:0006477 | protein sulfation(GO:0006477) |
| 0.4 | 2.1 | GO:0060414 | aorta smooth muscle tissue morphogenesis(GO:0060414) |
| 0.4 | 2.5 | GO:0089700 | protein kinase D signaling(GO:0089700) |
| 0.4 | 0.7 | GO:0061428 | negative regulation of transcription from RNA polymerase II promoter in response to hypoxia(GO:0061428) |
| 0.4 | 2.5 | GO:1903433 | regulation of constitutive secretory pathway(GO:1903433) |
| 0.4 | 1.1 | GO:0002071 | glandular epithelial cell maturation(GO:0002071) type B pancreatic cell maturation(GO:0072560) |
| 0.3 | 4.8 | GO:0021794 | thalamus development(GO:0021794) |
| 0.3 | 1.0 | GO:1900039 | positive regulation of cellular response to hypoxia(GO:1900039) |
| 0.3 | 1.0 | GO:0031587 | positive regulation of inositol 1,4,5-trisphosphate-sensitive calcium-release channel activity(GO:0031587) |
| 0.3 | 1.0 | GO:0061549 | sympathetic ganglion development(GO:0061549) |
| 0.3 | 1.6 | GO:0033564 | anterior/posterior axon guidance(GO:0033564) |
| 0.3 | 1.0 | GO:0006114 | glycerol biosynthetic process(GO:0006114) |
| 0.3 | 1.8 | GO:0035881 | amacrine cell differentiation(GO:0035881) |
| 0.3 | 1.5 | GO:0045629 | negative regulation of T-helper 2 cell differentiation(GO:0045629) |
| 0.3 | 1.2 | GO:0045829 | negative regulation of isotype switching(GO:0045829) |
| 0.3 | 2.7 | GO:0090154 | positive regulation of sphingolipid biosynthetic process(GO:0090154) positive regulation of ceramide biosynthetic process(GO:2000304) |
| 0.3 | 0.9 | GO:0061073 | ciliary body morphogenesis(GO:0061073) |
| 0.3 | 5.4 | GO:0010510 | regulation of acetyl-CoA biosynthetic process from pyruvate(GO:0010510) |
| 0.3 | 3.2 | GO:2001224 | positive regulation of neuron migration(GO:2001224) |
| 0.3 | 4.6 | GO:1902083 | negative regulation of peptidyl-cysteine S-nitrosylation(GO:1902083) |
| 0.3 | 1.1 | GO:1905071 | proepicardium development(GO:0003342) septum transversum development(GO:0003343) occluding junction disassembly(GO:1905071) regulation of occluding junction disassembly(GO:1905073) positive regulation of occluding junction disassembly(GO:1905075) |
| 0.3 | 1.4 | GO:0048318 | axial mesoderm development(GO:0048318) |
| 0.3 | 3.9 | GO:0060707 | trophoblast giant cell differentiation(GO:0060707) |
| 0.3 | 2.5 | GO:0060385 | axonogenesis involved in innervation(GO:0060385) |
| 0.3 | 6.9 | GO:0045746 | negative regulation of Notch signaling pathway(GO:0045746) |
| 0.3 | 1.6 | GO:1900239 | phenotypic switching(GO:0036166) regulation of phenotypic switching(GO:1900239) |
| 0.3 | 1.6 | GO:0048549 | positive regulation of pinocytosis(GO:0048549) |
| 0.3 | 1.1 | GO:0060010 | Sertoli cell fate commitment(GO:0060010) |
| 0.3 | 3.4 | GO:0019388 | galactose catabolic process(GO:0019388) |
| 0.3 | 2.8 | GO:1904322 | response to forskolin(GO:1904321) cellular response to forskolin(GO:1904322) |
| 0.3 | 2.0 | GO:0097116 | gephyrin clustering involved in postsynaptic density assembly(GO:0097116) |
| 0.2 | 1.5 | GO:0046940 | nucleoside monophosphate phosphorylation(GO:0046940) |
| 0.2 | 1.2 | GO:0035672 | oligopeptide transmembrane transport(GO:0035672) |
| 0.2 | 3.4 | GO:1903830 | magnesium ion transmembrane transport(GO:1903830) |
| 0.2 | 6.2 | GO:0021542 | dentate gyrus development(GO:0021542) |
| 0.2 | 2.6 | GO:0060605 | tube lumen cavitation(GO:0060605) salivary gland cavitation(GO:0060662) |
| 0.2 | 1.6 | GO:0006012 | galactose metabolic process(GO:0006012) |
| 0.2 | 6.2 | GO:0036152 | phosphatidylethanolamine acyl-chain remodeling(GO:0036152) |
| 0.2 | 0.9 | GO:0090385 | phagosome-lysosome fusion(GO:0090385) |
| 0.2 | 1.1 | GO:0051029 | rRNA transport(GO:0051029) |
| 0.2 | 0.7 | GO:0010587 | miRNA catabolic process(GO:0010587) |
| 0.2 | 1.5 | GO:0098501 | polynucleotide dephosphorylation(GO:0098501) |
| 0.2 | 1.9 | GO:0050942 | positive regulation of pigment cell differentiation(GO:0050942) |
| 0.2 | 0.6 | GO:0006684 | sphingomyelin metabolic process(GO:0006684) |
| 0.2 | 1.1 | GO:0035977 | protein deglycosylation involved in glycoprotein catabolic process(GO:0035977) glycoprotein ERAD pathway(GO:0097466) mannose trimming involved in glycoprotein ERAD pathway(GO:1904382) |
| 0.2 | 4.7 | GO:0045947 | negative regulation of translational initiation(GO:0045947) |
| 0.2 | 0.6 | GO:0090118 | receptor-mediated endocytosis of low-density lipoprotein particle involved in cholesterol transport(GO:0090118) positive regulation of lysosomal protein catabolic process(GO:1905167) |
| 0.2 | 0.4 | GO:1901420 | negative regulation of response to alcohol(GO:1901420) |
| 0.2 | 2.3 | GO:0016024 | CDP-diacylglycerol biosynthetic process(GO:0016024) |
| 0.2 | 1.0 | GO:0014052 | regulation of gamma-aminobutyric acid secretion(GO:0014052) |
| 0.2 | 1.5 | GO:0099566 | regulation of postsynaptic cytosolic calcium ion concentration(GO:0099566) |
| 0.2 | 1.5 | GO:0097091 | synaptic vesicle clustering(GO:0097091) |
| 0.2 | 1.3 | GO:0098914 | membrane repolarization during atrial cardiac muscle cell action potential(GO:0098914) |
| 0.2 | 1.8 | GO:0070257 | positive regulation of mucus secretion(GO:0070257) |
| 0.2 | 0.4 | GO:0007256 | activation of JNKK activity(GO:0007256) |
| 0.2 | 1.1 | GO:0086015 | SA node cell action potential(GO:0086015) SA node cell to atrial cardiac muscle cell signalling(GO:0086018) |
| 0.2 | 2.9 | GO:0043508 | negative regulation of JUN kinase activity(GO:0043508) |
| 0.2 | 0.9 | GO:0072069 | thick ascending limb development(GO:0072023) DCT cell differentiation(GO:0072069) metanephric thick ascending limb development(GO:0072233) metanephric DCT cell differentiation(GO:0072240) |
| 0.2 | 7.0 | GO:0006198 | cAMP catabolic process(GO:0006198) |
| 0.2 | 1.5 | GO:0015791 | polyol transport(GO:0015791) |
| 0.2 | 0.5 | GO:0007497 | posterior midgut development(GO:0007497) |
| 0.2 | 2.6 | GO:0005513 | detection of calcium ion(GO:0005513) |
| 0.2 | 2.6 | GO:0010457 | centriole-centriole cohesion(GO:0010457) |
| 0.2 | 1.4 | GO:0060012 | synaptic transmission, glycinergic(GO:0060012) |
| 0.2 | 0.6 | GO:0008063 | Toll signaling pathway(GO:0008063) |
| 0.2 | 1.3 | GO:0060665 | regulation of branching involved in salivary gland morphogenesis by mesenchymal-epithelial signaling(GO:0060665) |
| 0.2 | 0.5 | GO:1904798 | negative regulation of muscle hyperplasia(GO:0014740) cellular response to cycloheximide(GO:0071409) positive regulation of core promoter binding(GO:1904798) |
| 0.2 | 0.5 | GO:0060455 | negative regulation of gastric acid secretion(GO:0060455) |
| 0.2 | 0.8 | GO:0045454 | cell redox homeostasis(GO:0045454) |
| 0.1 | 0.3 | GO:1901341 | activation of store-operated calcium channel activity(GO:0032237) regulation of store-operated calcium channel activity(GO:1901339) positive regulation of store-operated calcium channel activity(GO:1901341) |
| 0.1 | 0.9 | GO:0055064 | chloride ion homeostasis(GO:0055064) |
| 0.1 | 0.6 | GO:1905098 | negative regulation of guanyl-nucleotide exchange factor activity(GO:1905098) |
| 0.1 | 0.3 | GO:0044340 | canonical Wnt signaling pathway involved in regulation of cell proliferation(GO:0044340) |
| 0.1 | 0.6 | GO:0072675 | multinuclear osteoclast differentiation(GO:0072674) osteoclast fusion(GO:0072675) |
| 0.1 | 3.8 | GO:0021772 | olfactory bulb development(GO:0021772) |
| 0.1 | 3.6 | GO:0048935 | peripheral nervous system neuron differentiation(GO:0048934) peripheral nervous system neuron development(GO:0048935) |
| 0.1 | 5.1 | GO:0007257 | activation of JUN kinase activity(GO:0007257) |
| 0.1 | 0.5 | GO:1904327 | protein localization to cytosolic proteasome complex(GO:1904327) protein localization to cytosolic proteasome complex involved in ERAD pathway(GO:1904379) |
| 0.1 | 0.7 | GO:0006127 | glycerophosphate shuttle(GO:0006127) |
| 0.1 | 0.3 | GO:0010767 | regulation of transcription from RNA polymerase II promoter in response to UV-induced DNA damage(GO:0010767) |
| 0.1 | 1.0 | GO:2000189 | positive regulation of cholesterol homeostasis(GO:2000189) |
| 0.1 | 1.3 | GO:0036066 | protein O-linked fucosylation(GO:0036066) |
| 0.1 | 2.7 | GO:0045717 | negative regulation of fatty acid biosynthetic process(GO:0045717) |
| 0.1 | 3.0 | GO:0048745 | smooth muscle tissue development(GO:0048745) |
| 0.1 | 0.5 | GO:0019086 | late viral transcription(GO:0019086) |
| 0.1 | 4.0 | GO:0008286 | insulin receptor signaling pathway(GO:0008286) |
| 0.1 | 0.5 | GO:1904059 | regulation of locomotor rhythm(GO:1904059) |
| 0.1 | 4.7 | GO:0070884 | regulation of calcineurin-NFAT signaling cascade(GO:0070884) |
| 0.1 | 2.6 | GO:0030214 | hyaluronan catabolic process(GO:0030214) |
| 0.1 | 1.4 | GO:1990035 | calcium ion import across plasma membrane(GO:0098703) calcium ion import into cell(GO:1990035) |
| 0.1 | 3.9 | GO:1902895 | positive regulation of pri-miRNA transcription from RNA polymerase II promoter(GO:1902895) |
| 0.1 | 1.2 | GO:1990403 | embryonic brain development(GO:1990403) |
| 0.1 | 0.9 | GO:1903361 | protein localization to basolateral plasma membrane(GO:1903361) |
| 0.1 | 1.0 | GO:0010891 | negative regulation of sequestering of triglyceride(GO:0010891) |
| 0.1 | 1.4 | GO:1990118 | sodium ion import across plasma membrane(GO:0098719) sodium ion import into cell(GO:1990118) |
| 0.1 | 0.8 | GO:0060576 | intestinal epithelial cell development(GO:0060576) |
| 0.1 | 1.1 | GO:1903608 | protein localization to cytoplasmic stress granule(GO:1903608) |
| 0.1 | 0.5 | GO:0036438 | maintenance of lens transparency(GO:0036438) |
| 0.1 | 1.0 | GO:0035970 | peptidyl-threonine dephosphorylation(GO:0035970) |
| 0.1 | 4.8 | GO:0032728 | positive regulation of interferon-beta production(GO:0032728) |
| 0.1 | 1.6 | GO:0032354 | response to follicle-stimulating hormone(GO:0032354) |
| 0.1 | 2.5 | GO:0034204 | lipid translocation(GO:0034204) phospholipid translocation(GO:0045332) |
| 0.1 | 1.7 | GO:0060716 | labyrinthine layer blood vessel development(GO:0060716) |
| 0.1 | 0.5 | GO:0048845 | venous blood vessel morphogenesis(GO:0048845) |
| 0.1 | 0.9 | GO:0019919 | peptidyl-arginine methylation, to asymmetrical-dimethyl arginine(GO:0019919) |
| 0.1 | 1.4 | GO:0060252 | positive regulation of glial cell proliferation(GO:0060252) |
| 0.1 | 0.5 | GO:0050673 | epithelial cell proliferation(GO:0050673) |
| 0.1 | 9.7 | GO:0055072 | iron ion homeostasis(GO:0055072) |
| 0.1 | 2.3 | GO:0035116 | embryonic hindlimb morphogenesis(GO:0035116) |
| 0.1 | 0.4 | GO:0045586 | regulation of gamma-delta T cell differentiation(GO:0045586) |
| 0.1 | 2.2 | GO:1901385 | regulation of voltage-gated calcium channel activity(GO:1901385) |
| 0.1 | 8.7 | GO:0006368 | transcription elongation from RNA polymerase II promoter(GO:0006368) |
| 0.1 | 4.7 | GO:0043966 | histone H3 acetylation(GO:0043966) |
| 0.1 | 4.2 | GO:0030500 | regulation of bone mineralization(GO:0030500) |
| 0.1 | 0.7 | GO:0031584 | activation of phospholipase D activity(GO:0031584) |
| 0.1 | 0.8 | GO:1903672 | cell-cell adhesion mediated by integrin(GO:0033631) positive regulation of sprouting angiogenesis(GO:1903672) |
| 0.1 | 1.0 | GO:0021987 | cerebral cortex development(GO:0021987) |
| 0.1 | 0.9 | GO:0042481 | regulation of odontogenesis(GO:0042481) |
| 0.1 | 1.0 | GO:0043517 | positive regulation of DNA damage response, signal transduction by p53 class mediator(GO:0043517) |
| 0.1 | 2.9 | GO:0086010 | membrane depolarization during action potential(GO:0086010) |
| 0.1 | 0.4 | GO:0051967 | negative regulation of synaptic transmission, glutamatergic(GO:0051967) |
| 0.1 | 2.1 | GO:0009301 | snRNA transcription(GO:0009301) snRNA transcription from RNA polymerase II promoter(GO:0042795) |
| 0.1 | 2.1 | GO:0007205 | protein kinase C-activating G-protein coupled receptor signaling pathway(GO:0007205) |
| 0.1 | 1.4 | GO:0046710 | GDP metabolic process(GO:0046710) |
| 0.1 | 0.5 | GO:0032000 | positive regulation of fatty acid beta-oxidation(GO:0032000) |
| 0.1 | 1.1 | GO:0035728 | response to hepatocyte growth factor(GO:0035728) |
| 0.1 | 1.5 | GO:0090162 | establishment of epithelial cell polarity(GO:0090162) |
| 0.1 | 2.1 | GO:1903959 | regulation of anion transmembrane transport(GO:1903959) |
| 0.1 | 0.6 | GO:0048387 | negative regulation of retinoic acid receptor signaling pathway(GO:0048387) |
| 0.1 | 1.1 | GO:0035024 | negative regulation of Rho protein signal transduction(GO:0035024) |
| 0.1 | 2.3 | GO:0010863 | positive regulation of phospholipase C activity(GO:0010863) |
| 0.1 | 0.5 | GO:0030322 | stabilization of membrane potential(GO:0030322) |
| 0.1 | 4.1 | GO:0010923 | negative regulation of phosphatase activity(GO:0010923) |
| 0.1 | 1.8 | GO:0033572 | transferrin transport(GO:0033572) |
| 0.1 | 1.5 | GO:0030866 | cortical actin cytoskeleton organization(GO:0030866) |
| 0.1 | 0.1 | GO:0060017 | parathyroid gland development(GO:0060017) |
| 0.1 | 4.4 | GO:0072332 | intrinsic apoptotic signaling pathway by p53 class mediator(GO:0072332) |
| 0.1 | 4.3 | GO:0043647 | inositol phosphate metabolic process(GO:0043647) |
| 0.1 | 0.4 | GO:0002175 | protein localization to paranode region of axon(GO:0002175) |
| 0.0 | 1.9 | GO:0046580 | negative regulation of Ras protein signal transduction(GO:0046580) |
| 0.0 | 1.8 | GO:0051568 | histone H3-K4 methylation(GO:0051568) |
| 0.0 | 7.6 | GO:0071805 | cellular potassium ion transport(GO:0071804) potassium ion transmembrane transport(GO:0071805) |
| 0.0 | 7.4 | GO:0007156 | homophilic cell adhesion via plasma membrane adhesion molecules(GO:0007156) |
| 0.0 | 0.6 | GO:0006776 | vitamin A metabolic process(GO:0006776) |
| 0.0 | 1.8 | GO:0000083 | regulation of transcription involved in G1/S transition of mitotic cell cycle(GO:0000083) |
| 0.0 | 0.5 | GO:0043951 | negative regulation of cAMP-mediated signaling(GO:0043951) |
| 0.0 | 0.5 | GO:0035641 | locomotory exploration behavior(GO:0035641) |
| 0.0 | 0.6 | GO:0030208 | dermatan sulfate biosynthetic process(GO:0030208) |
| 0.0 | 1.0 | GO:0014002 | astrocyte development(GO:0014002) |
| 0.0 | 0.3 | GO:0000707 | meiotic DNA recombinase assembly(GO:0000707) |
| 0.0 | 2.3 | GO:0007368 | determination of left/right symmetry(GO:0007368) |
| 0.0 | 0.5 | GO:0072600 | protein targeting to Golgi(GO:0000042) establishment of protein localization to Golgi(GO:0072600) |
| 0.0 | 1.7 | GO:0060135 | maternal process involved in female pregnancy(GO:0060135) |
| 0.0 | 1.5 | GO:0010862 | positive regulation of pathway-restricted SMAD protein phosphorylation(GO:0010862) |
| 0.0 | 0.5 | GO:0007625 | grooming behavior(GO:0007625) |
| 0.0 | 3.2 | GO:1902017 | regulation of cilium assembly(GO:1902017) |
| 0.0 | 0.2 | GO:0034983 | peptidyl-lysine deacetylation(GO:0034983) |
| 0.0 | 1.4 | GO:0090263 | positive regulation of canonical Wnt signaling pathway(GO:0090263) |
| 0.0 | 1.7 | GO:0048015 | phosphatidylinositol-mediated signaling(GO:0048015) |
| 0.0 | 1.6 | GO:1904893 | negative regulation of JAK-STAT cascade(GO:0046426) negative regulation of STAT cascade(GO:1904893) |
| 0.0 | 3.3 | GO:1990823 | response to leukemia inhibitory factor(GO:1990823) cellular response to leukemia inhibitory factor(GO:1990830) |
| 0.0 | 1.1 | GO:0042058 | regulation of epidermal growth factor receptor signaling pathway(GO:0042058) |
| 0.0 | 0.8 | GO:0007507 | heart development(GO:0007507) |
| 0.0 | 0.2 | GO:0042118 | endothelial cell activation(GO:0042118) |
| 0.0 | 0.5 | GO:0007405 | neuroblast proliferation(GO:0007405) |
| 0.0 | 0.2 | GO:2001014 | regulation of skeletal muscle cell differentiation(GO:2001014) |
| 0.0 | 0.6 | GO:0003334 | keratinocyte development(GO:0003334) |
| 0.0 | 1.8 | GO:0006501 | C-terminal protein lipidation(GO:0006501) |
| 0.0 | 0.9 | GO:0048635 | negative regulation of muscle organ development(GO:0048635) |
| 0.0 | 0.3 | GO:0016576 | histone dephosphorylation(GO:0016576) |
| 0.0 | 3.5 | GO:0007626 | locomotory behavior(GO:0007626) |
| 0.0 | 0.2 | GO:0046836 | glycolipid transport(GO:0046836) |
| 0.0 | 0.0 | GO:2000653 | regulation of genetic imprinting(GO:2000653) |
| 0.0 | 0.3 | GO:0090136 | epithelial cell-cell adhesion(GO:0090136) |
| 0.0 | 1.0 | GO:0001706 | endoderm formation(GO:0001706) |
| 0.0 | 0.9 | GO:2000177 | regulation of neural precursor cell proliferation(GO:2000177) |
| 0.0 | 3.1 | GO:0008360 | regulation of cell shape(GO:0008360) |
| 0.0 | 1.2 | GO:0014068 | positive regulation of phosphatidylinositol 3-kinase signaling(GO:0014068) |
| 0.0 | 0.1 | GO:0007207 | adenylate cyclase-inhibiting G-protein coupled acetylcholine receptor signaling pathway(GO:0007197) phospholipase C-activating G-protein coupled acetylcholine receptor signaling pathway(GO:0007207) |
| 0.0 | 0.1 | GO:0001923 | B-1 B cell differentiation(GO:0001923) B cell proliferation involved in immune response(GO:0002322) |
| 0.0 | 2.8 | GO:0006367 | transcription initiation from RNA polymerase II promoter(GO:0006367) |
| 0.0 | 0.6 | GO:0045773 | positive regulation of axon extension(GO:0045773) |
| 0.0 | 3.3 | GO:0031032 | actomyosin structure organization(GO:0031032) |
| 0.0 | 0.6 | GO:0007274 | neuromuscular synaptic transmission(GO:0007274) |
| 0.0 | 0.4 | GO:0018105 | peptidyl-serine phosphorylation(GO:0018105) |
| 0.0 | 1.2 | GO:0070098 | chemokine-mediated signaling pathway(GO:0070098) |
| 0.0 | 0.2 | GO:0043278 | response to isoquinoline alkaloid(GO:0014072) response to morphine(GO:0043278) |
| 0.0 | 0.1 | GO:0043586 | tongue development(GO:0043586) |
| 0.0 | 0.0 | GO:0043922 | negative regulation by host of viral transcription(GO:0043922) |
| 0.0 | 0.4 | GO:0007194 | negative regulation of adenylate cyclase activity(GO:0007194) |
| 0.0 | 0.2 | GO:0090161 | Golgi ribbon formation(GO:0090161) |
| 0.0 | 0.1 | GO:0034378 | chylomicron assembly(GO:0034378) |
| 0.0 | 0.2 | GO:0060976 | coronary vasculature development(GO:0060976) |
| 0.0 | 0.8 | GO:0032479 | regulation of type I interferon production(GO:0032479) |
| 0.0 | 0.4 | GO:2000300 | regulation of synaptic vesicle exocytosis(GO:2000300) |
| 0.0 | 0.6 | GO:0050808 | synapse organization(GO:0050808) |
| 0.0 | 0.1 | GO:1902916 | positive regulation of protein polyubiquitination(GO:1902916) |
| 0.0 | 0.1 | GO:0043981 | histone H4-K5 acetylation(GO:0043981) histone H4-K8 acetylation(GO:0043982) |
Gene overrepresentation in cellular_component category:
| Log-likelihood per target | Total log-likelihood | Term | Description |
|---|---|---|---|
| 1.5 | 6.1 | GO:0034673 | inhibin-betaglycan-ActRII complex(GO:0034673) |
| 1.4 | 5.5 | GO:0070032 | synaptobrevin 2-SNAP-25-syntaxin-1a-complexin I complex(GO:0070032) |
| 1.3 | 5.2 | GO:0030485 | smooth muscle contractile fiber(GO:0030485) |
| 1.2 | 6.1 | GO:0070847 | core mediator complex(GO:0070847) |
| 1.0 | 3.0 | GO:0034678 | integrin alpha8-beta1 complex(GO:0034678) |
| 1.0 | 3.0 | GO:0002945 | cyclin K-CDK13 complex(GO:0002945) |
| 0.8 | 2.5 | GO:1990851 | Wnt-Frizzled-LRP5/6 complex(GO:1990851) |
| 0.8 | 8.9 | GO:0033018 | sarcoplasmic reticulum lumen(GO:0033018) |
| 0.8 | 3.9 | GO:0071148 | TEAD-1-YAP complex(GO:0071148) |
| 0.8 | 3.0 | GO:0031302 | intrinsic component of endosome membrane(GO:0031302) |
| 0.8 | 3.8 | GO:0005899 | insulin receptor complex(GO:0005899) |
| 0.7 | 2.0 | GO:0034666 | integrin alpha2-beta1 complex(GO:0034666) |
| 0.6 | 4.0 | GO:0001520 | outer dense fiber(GO:0001520) |
| 0.5 | 2.9 | GO:1990682 | CSF1-CSF1R complex(GO:1990682) |
| 0.5 | 4.7 | GO:0070775 | H3 histone acetyltransferase complex(GO:0070775) MOZ/MORF histone acetyltransferase complex(GO:0070776) |
| 0.5 | 1.8 | GO:0070876 | SOSS complex(GO:0070876) |
| 0.4 | 5.1 | GO:0032045 | guanyl-nucleotide exchange factor complex(GO:0032045) |
| 0.4 | 2.1 | GO:0044530 | supraspliceosomal complex(GO:0044530) |
| 0.4 | 2.7 | GO:1990452 | Parkin-FBXW7-Cul1 ubiquitin ligase complex(GO:1990452) |
| 0.4 | 2.7 | GO:0000137 | Golgi cis cisterna(GO:0000137) |
| 0.4 | 1.8 | GO:0044308 | axonal spine(GO:0044308) |
| 0.3 | 1.0 | GO:0044305 | calyx of Held(GO:0044305) |
| 0.3 | 1.6 | GO:0044354 | pinosome(GO:0044352) macropinosome(GO:0044354) |
| 0.3 | 3.2 | GO:0071953 | elastic fiber(GO:0071953) |
| 0.3 | 1.5 | GO:0060201 | clathrin-sculpted acetylcholine transport vesicle(GO:0060200) clathrin-sculpted acetylcholine transport vesicle membrane(GO:0060201) |
| 0.3 | 0.9 | GO:0005879 | axonemal microtubule(GO:0005879) |
| 0.3 | 1.1 | GO:0033257 | Bcl3/NF-kappaB2 complex(GO:0033257) |
| 0.3 | 1.1 | GO:0033596 | TSC1-TSC2 complex(GO:0033596) |
| 0.3 | 1.1 | GO:0005967 | mitochondrial pyruvate dehydrogenase complex(GO:0005967) |
| 0.3 | 1.5 | GO:0061689 | tricellular tight junction(GO:0061689) |
| 0.2 | 7.0 | GO:0035327 | transcriptionally active chromatin(GO:0035327) |
| 0.2 | 2.4 | GO:0071141 | SMAD protein complex(GO:0071141) |
| 0.2 | 2.9 | GO:0005583 | fibrillar collagen trimer(GO:0005583) banded collagen fibril(GO:0098643) |
| 0.2 | 5.4 | GO:0008074 | guanylate cyclase complex, soluble(GO:0008074) |
| 0.2 | 1.5 | GO:0035032 | phosphatidylinositol 3-kinase complex, class III(GO:0035032) |
| 0.2 | 0.8 | GO:0071062 | alphav-beta3 integrin-vitronectin complex(GO:0071062) |
| 0.2 | 3.4 | GO:0031235 | intrinsic component of the cytoplasmic side of the plasma membrane(GO:0031235) |
| 0.2 | 0.7 | GO:0016939 | kinesin II complex(GO:0016939) |
| 0.2 | 1.2 | GO:0000347 | THO complex(GO:0000347) THO complex part of transcription export complex(GO:0000445) |
| 0.2 | 1.8 | GO:0044666 | MLL3/4 complex(GO:0044666) |
| 0.2 | 0.6 | GO:0000138 | Golgi trans cisterna(GO:0000138) |
| 0.2 | 1.1 | GO:0000813 | ESCRT I complex(GO:0000813) |
| 0.1 | 15.8 | GO:0034705 | voltage-gated potassium channel complex(GO:0008076) potassium channel complex(GO:0034705) |
| 0.1 | 0.4 | GO:0038039 | G-protein coupled receptor heterodimeric complex(GO:0038039) |
| 0.1 | 2.0 | GO:0031045 | dense core granule(GO:0031045) |
| 0.1 | 1.1 | GO:0070022 | transforming growth factor beta receptor homodimeric complex(GO:0070022) |
| 0.1 | 5.3 | GO:0048786 | presynaptic active zone(GO:0048786) |
| 0.1 | 1.9 | GO:0031083 | BLOC-1 complex(GO:0031083) |
| 0.1 | 0.7 | GO:0009331 | glycerol-3-phosphate dehydrogenase complex(GO:0009331) |
| 0.1 | 5.1 | GO:0008023 | transcription elongation factor complex(GO:0008023) |
| 0.1 | 1.6 | GO:0030877 | beta-catenin destruction complex(GO:0030877) |
| 0.1 | 1.8 | GO:0046658 | anchored component of plasma membrane(GO:0046658) |
| 0.1 | 0.7 | GO:0044300 | cerebellar mossy fiber(GO:0044300) |
| 0.1 | 0.6 | GO:0097443 | sorting endosome(GO:0097443) |
| 0.1 | 12.6 | GO:0043204 | perikaryon(GO:0043204) |
| 0.1 | 0.6 | GO:0097504 | Gemini of coiled bodies(GO:0097504) |
| 0.1 | 1.0 | GO:0002116 | semaphorin receptor complex(GO:0002116) |
| 0.1 | 0.4 | GO:0033553 | rDNA heterochromatin(GO:0033553) |
| 0.1 | 1.3 | GO:0001518 | voltage-gated sodium channel complex(GO:0001518) |
| 0.1 | 0.9 | GO:0097025 | MPP7-DLG1-LIN7 complex(GO:0097025) |
| 0.1 | 2.5 | GO:0000421 | autophagosome membrane(GO:0000421) |
| 0.1 | 4.9 | GO:0000123 | histone acetyltransferase complex(GO:0000123) |
| 0.1 | 0.9 | GO:0031618 | nuclear pericentric heterochromatin(GO:0031618) |
| 0.1 | 3.7 | GO:0042734 | presynaptic membrane(GO:0042734) |
| 0.1 | 1.0 | GO:1990124 | messenger ribonucleoprotein complex(GO:1990124) |
| 0.1 | 1.9 | GO:0044665 | MLL1/2 complex(GO:0044665) MLL1 complex(GO:0071339) |
| 0.1 | 1.3 | GO:0031233 | intrinsic component of external side of plasma membrane(GO:0031233) |
| 0.1 | 2.1 | GO:0005891 | voltage-gated calcium channel complex(GO:0005891) |
| 0.1 | 3.7 | GO:0031463 | Cul3-RING ubiquitin ligase complex(GO:0031463) |
| 0.1 | 0.1 | GO:0098984 | asymmetric synapse(GO:0032279) symmetric synapse(GO:0032280) neuron to neuron synapse(GO:0098984) |
| 0.0 | 0.3 | GO:0032541 | cortical endoplasmic reticulum(GO:0032541) |
| 0.0 | 0.0 | GO:0005943 | phosphatidylinositol 3-kinase complex, class IA(GO:0005943) |
| 0.0 | 0.2 | GO:0035867 | alphav-beta3 integrin-IGF-1-IGF1R complex(GO:0035867) |
| 0.0 | 3.2 | GO:0030315 | T-tubule(GO:0030315) |
| 0.0 | 3.8 | GO:0005902 | microvillus(GO:0005902) |
| 0.0 | 0.5 | GO:1990023 | mitotic spindle midzone(GO:1990023) |
| 0.0 | 2.2 | GO:0043198 | dendritic shaft(GO:0043198) |
| 0.0 | 9.2 | GO:0001726 | ruffle(GO:0001726) |
| 0.0 | 2.5 | GO:0005844 | polysome(GO:0005844) |
| 0.0 | 0.3 | GO:0033063 | DNA recombinase mediator complex(GO:0033061) Rad51B-Rad51C-Rad51D-XRCC2 complex(GO:0033063) |
| 0.0 | 2.3 | GO:0005771 | multivesicular body(GO:0005771) |
| 0.0 | 1.9 | GO:0001772 | immunological synapse(GO:0001772) |
| 0.0 | 2.5 | GO:0005796 | Golgi lumen(GO:0005796) |
| 0.0 | 13.4 | GO:0005578 | proteinaceous extracellular matrix(GO:0005578) |
| 0.0 | 3.8 | GO:0031093 | platelet alpha granule lumen(GO:0031093) |
| 0.0 | 3.6 | GO:0005814 | centriole(GO:0005814) |
| 0.0 | 1.1 | GO:0044322 | endoplasmic reticulum quality control compartment(GO:0044322) |
| 0.0 | 4.3 | GO:0001650 | fibrillar center(GO:0001650) |
| 0.0 | 0.3 | GO:0005916 | fascia adherens(GO:0005916) |
| 0.0 | 1.0 | GO:0044291 | cell-cell contact zone(GO:0044291) |
| 0.0 | 3.3 | GO:0016605 | PML body(GO:0016605) |
| 0.0 | 2.2 | GO:0005758 | mitochondrial intermembrane space(GO:0005758) |
| 0.0 | 0.6 | GO:0009925 | basal plasma membrane(GO:0009925) |
| 0.0 | 11.7 | GO:0005759 | mitochondrial matrix(GO:0005759) |
| 0.0 | 6.2 | GO:0030424 | axon(GO:0030424) |
| 0.0 | 0.3 | GO:0016327 | apicolateral plasma membrane(GO:0016327) |
| 0.0 | 2.3 | GO:0070160 | occluding junction(GO:0070160) |
| 0.0 | 1.3 | GO:0055038 | recycling endosome membrane(GO:0055038) |
| 0.0 | 2.4 | GO:0030426 | growth cone(GO:0030426) |
| 0.0 | 0.6 | GO:0016235 | aggresome(GO:0016235) |
| 0.0 | 2.3 | GO:0043025 | neuronal cell body(GO:0043025) |
| 0.0 | 0.6 | GO:0002102 | podosome(GO:0002102) |
| 0.0 | 0.7 | GO:0031526 | brush border membrane(GO:0031526) |
| 0.0 | 1.2 | GO:0032588 | trans-Golgi network membrane(GO:0032588) |
| 0.0 | 18.5 | GO:0005615 | extracellular space(GO:0005615) |
| 0.0 | 3.7 | GO:0005743 | mitochondrial inner membrane(GO:0005743) |
| 0.0 | 0.1 | GO:0030137 | COPI-coated vesicle(GO:0030137) |
| 0.0 | 0.3 | GO:0080008 | Cul4-RING E3 ubiquitin ligase complex(GO:0080008) |
| 0.0 | 0.7 | GO:0034707 | chloride channel complex(GO:0034707) |
Gene overrepresentation in molecular_function category:
| Log-likelihood per target | Total log-likelihood | Term | Description |
|---|---|---|---|
| 4.0 | 12.1 | GO:0016155 | formyltetrahydrofolate dehydrogenase activity(GO:0016155) |
| 2.5 | 7.4 | GO:0070326 | very-low-density lipoprotein particle receptor binding(GO:0070326) |
| 2.4 | 7.3 | GO:0004119 | cGMP-inhibited cyclic-nucleotide phosphodiesterase activity(GO:0004119) |
| 1.8 | 5.3 | GO:0004676 | 3-phosphoinositide-dependent protein kinase activity(GO:0004676) |
| 1.4 | 5.7 | GO:0000822 | inositol hexakisphosphate binding(GO:0000822) |
| 1.4 | 4.2 | GO:0042799 | histone methyltransferase activity (H4-K20 specific)(GO:0042799) |
| 1.4 | 6.9 | GO:0035252 | UDP-xylosyltransferase activity(GO:0035252) xylosyltransferase activity(GO:0042285) |
| 1.3 | 3.8 | GO:0005017 | platelet-derived growth factor-activated receptor activity(GO:0005017) |
| 0.9 | 2.8 | GO:0004605 | phosphatidate cytidylyltransferase activity(GO:0004605) |
| 0.9 | 10.9 | GO:0005078 | MAP-kinase scaffold activity(GO:0005078) |
| 0.8 | 3.4 | GO:0005222 | intracellular cAMP activated cation channel activity(GO:0005222) |
| 0.7 | 4.3 | GO:0008440 | inositol-1,4,5-trisphosphate 3-kinase activity(GO:0008440) |
| 0.7 | 4.3 | GO:0004741 | [pyruvate dehydrogenase (lipoamide)] phosphatase activity(GO:0004741) |
| 0.7 | 7.8 | GO:0001042 | RNA polymerase I core binding(GO:0001042) |
| 0.7 | 2.1 | GO:0004020 | adenylylsulfate kinase activity(GO:0004020) sulfate adenylyltransferase activity(GO:0004779) sulfate adenylyltransferase (ATP) activity(GO:0004781) |
| 0.7 | 2.0 | GO:0004949 | cannabinoid receptor activity(GO:0004949) |
| 0.6 | 3.1 | GO:0070097 | delta-catenin binding(GO:0070097) |
| 0.6 | 3.8 | GO:0008597 | calcium-dependent protein serine/threonine phosphatase regulator activity(GO:0008597) |
| 0.6 | 3.6 | GO:0043237 | laminin-1 binding(GO:0043237) |
| 0.6 | 3.4 | GO:0004614 | phosphoglucomutase activity(GO:0004614) |
| 0.5 | 3.3 | GO:0098821 | BMP receptor activity(GO:0098821) |
| 0.5 | 5.2 | GO:0048406 | nerve growth factor binding(GO:0048406) |
| 0.5 | 1.5 | GO:0008798 | beta-aspartyl-peptidase activity(GO:0008798) |
| 0.5 | 1.5 | GO:0008192 | RNA guanylyltransferase activity(GO:0008192) |
| 0.5 | 2.9 | GO:0005157 | macrophage colony-stimulating factor receptor binding(GO:0005157) |
| 0.5 | 1.4 | GO:0015275 | stretch-activated, cation-selective, calcium channel activity(GO:0015275) |
| 0.5 | 7.9 | GO:0003688 | DNA replication origin binding(GO:0003688) |
| 0.5 | 5.0 | GO:0019869 | chloride channel inhibitor activity(GO:0019869) |
| 0.4 | 3.5 | GO:0071936 | coreceptor activity involved in Wnt signaling pathway(GO:0071936) |
| 0.4 | 1.2 | GO:0045322 | unmethylated CpG binding(GO:0045322) |
| 0.4 | 2.0 | GO:0098639 | collagen binding involved in cell-matrix adhesion(GO:0098639) |
| 0.4 | 4.0 | GO:0005114 | type II transforming growth factor beta receptor binding(GO:0005114) |
| 0.4 | 3.0 | GO:0016846 | carbon-sulfur lyase activity(GO:0016846) |
| 0.4 | 1.5 | GO:0046899 | nucleoside triphosphate adenylate kinase activity(GO:0046899) |
| 0.4 | 4.1 | GO:0039706 | co-receptor binding(GO:0039706) |
| 0.4 | 3.0 | GO:0050816 | phosphothreonine binding(GO:0050816) |
| 0.4 | 2.2 | GO:0016015 | morphogen activity(GO:0016015) |
| 0.4 | 2.2 | GO:0004118 | cGMP-stimulated cyclic-nucleotide phosphodiesterase activity(GO:0004118) |
| 0.4 | 1.4 | GO:0050119 | N-acetylglucosamine deacetylase activity(GO:0050119) |
| 0.3 | 6.7 | GO:0000900 | translation repressor activity, nucleic acid binding(GO:0000900) |
| 0.3 | 3.3 | GO:0051425 | PTB domain binding(GO:0051425) |
| 0.3 | 1.0 | GO:0098519 | nucleotide phosphatase activity, acting on free nucleotides(GO:0098519) |
| 0.3 | 1.5 | GO:0030348 | syntaxin-3 binding(GO:0030348) |
| 0.3 | 1.9 | GO:0015185 | gamma-aminobutyric acid:sodium symporter activity(GO:0005332) gamma-aminobutyric acid transmembrane transporter activity(GO:0015185) |
| 0.3 | 1.2 | GO:0035673 | oligopeptide transmembrane transporter activity(GO:0035673) |
| 0.3 | 3.4 | GO:0046875 | ephrin receptor binding(GO:0046875) |
| 0.3 | 1.4 | GO:0016933 | extracellular-glycine-gated ion channel activity(GO:0016933) extracellular-glycine-gated chloride channel activity(GO:0016934) |
| 0.3 | 0.9 | GO:0035241 | protein-arginine omega-N monomethyltransferase activity(GO:0035241) |
| 0.3 | 1.1 | GO:0004740 | pyruvate dehydrogenase (acetyl-transferring) kinase activity(GO:0004740) |
| 0.3 | 2.7 | GO:0004767 | sphingomyelin phosphodiesterase activity(GO:0004767) |
| 0.3 | 4.8 | GO:0042813 | Wnt-activated receptor activity(GO:0042813) |
| 0.2 | 1.7 | GO:0001517 | N-acetylglucosamine 6-O-sulfotransferase activity(GO:0001517) |
| 0.2 | 3.4 | GO:0015095 | magnesium ion transmembrane transporter activity(GO:0015095) |
| 0.2 | 4.0 | GO:0004089 | carbonate dehydratase activity(GO:0004089) |
| 0.2 | 0.9 | GO:0004886 | 9-cis retinoic acid receptor activity(GO:0004886) |
| 0.2 | 1.8 | GO:1904315 | neurotransmitter receptor activity involved in regulation of postsynaptic membrane potential(GO:0099529) transmitter-gated ion channel activity involved in regulation of postsynaptic membrane potential(GO:1904315) |
| 0.2 | 5.4 | GO:0004383 | guanylate cyclase activity(GO:0004383) |
| 0.2 | 0.6 | GO:0047493 | sphingomyelin synthase activity(GO:0033188) ceramide cholinephosphotransferase activity(GO:0047493) |
| 0.2 | 1.3 | GO:0086089 | voltage-gated potassium channel activity involved in atrial cardiac muscle cell action potential repolarization(GO:0086089) |
| 0.2 | 1.5 | GO:0070324 | thyroid hormone binding(GO:0070324) |
| 0.2 | 5.5 | GO:0017075 | syntaxin-1 binding(GO:0017075) |
| 0.2 | 1.1 | GO:0086006 | voltage-gated sodium channel activity involved in cardiac muscle cell action potential(GO:0086006) |
| 0.2 | 1.9 | GO:0015129 | lactate transmembrane transporter activity(GO:0015129) |
| 0.2 | 1.7 | GO:0070700 | BMP receptor binding(GO:0070700) |
| 0.2 | 2.7 | GO:0042809 | vitamin D receptor binding(GO:0042809) |
| 0.2 | 8.6 | GO:0003785 | actin monomer binding(GO:0003785) |
| 0.2 | 3.8 | GO:0001134 | transcription factor activity, transcription factor recruiting(GO:0001134) |
| 0.2 | 2.1 | GO:0048407 | platelet-derived growth factor binding(GO:0048407) |
| 0.2 | 2.4 | GO:0017151 | DEAD/H-box RNA helicase binding(GO:0017151) |
| 0.2 | 3.6 | GO:0016646 | aldehyde dehydrogenase (NAD) activity(GO:0004029) oxidoreductase activity, acting on the CH-NH group of donors, NAD or NADP as acceptor(GO:0016646) |
| 0.2 | 0.7 | GO:0052591 | sn-glycerol-3-phosphate:ubiquinone oxidoreductase activity(GO:0052590) sn-glycerol-3-phosphate:ubiquinone-8 oxidoreductase activity(GO:0052591) |
| 0.2 | 4.8 | GO:0004115 | 3',5'-cyclic-AMP phosphodiesterase activity(GO:0004115) |
| 0.2 | 3.7 | GO:0005251 | delayed rectifier potassium channel activity(GO:0005251) |
| 0.2 | 3.2 | GO:0070016 | armadillo repeat domain binding(GO:0070016) |
| 0.2 | 1.3 | GO:0015166 | polyol transmembrane transporter activity(GO:0015166) |
| 0.2 | 1.6 | GO:0001223 | transcription coactivator binding(GO:0001223) |
| 0.2 | 4.9 | GO:0071889 | 14-3-3 protein binding(GO:0071889) |
| 0.2 | 3.3 | GO:0003841 | 1-acylglycerol-3-phosphate O-acyltransferase activity(GO:0003841) |
| 0.2 | 1.5 | GO:0022841 | potassium ion leak channel activity(GO:0022841) |
| 0.2 | 2.3 | GO:0008140 | cAMP response element binding protein binding(GO:0008140) |
| 0.1 | 3.0 | GO:0070888 | E-box binding(GO:0070888) |
| 0.1 | 2.2 | GO:0016004 | phospholipase activator activity(GO:0016004) |
| 0.1 | 1.4 | GO:0015385 | sodium:proton antiporter activity(GO:0015385) potassium:proton antiporter activity(GO:0015386) |
| 0.1 | 1.9 | GO:0016641 | oxidoreductase activity, acting on the CH-NH2 group of donors, oxygen as acceptor(GO:0016641) |
| 0.1 | 2.6 | GO:0008331 | high voltage-gated calcium channel activity(GO:0008331) |
| 0.1 | 0.8 | GO:0043184 | vascular endothelial growth factor receptor 2 binding(GO:0043184) |
| 0.1 | 0.4 | GO:0004965 | G-protein coupled GABA receptor activity(GO:0004965) |
| 0.1 | 2.0 | GO:0097109 | neuroligin family protein binding(GO:0097109) |
| 0.1 | 2.4 | GO:0030955 | potassium ion binding(GO:0030955) |
| 0.1 | 2.0 | GO:0003680 | AT DNA binding(GO:0003680) |
| 0.1 | 1.6 | GO:0008429 | phosphatidylethanolamine binding(GO:0008429) |
| 0.1 | 0.7 | GO:0030020 | extracellular matrix structural constituent conferring tensile strength(GO:0030020) |
| 0.1 | 3.0 | GO:0008353 | RNA polymerase II carboxy-terminal domain kinase activity(GO:0008353) |
| 0.1 | 2.5 | GO:0004697 | protein kinase C activity(GO:0004697) |
| 0.1 | 2.5 | GO:0071837 | HMG box domain binding(GO:0071837) |
| 0.1 | 1.6 | GO:0001011 | transcription factor activity, sequence-specific DNA binding, RNA polymerase recruiting(GO:0001011) transcription factor activity, TFIIB-class binding(GO:0001087) |
| 0.1 | 16.6 | GO:0004519 | endonuclease activity(GO:0004519) |
| 0.1 | 1.8 | GO:0042800 | histone methyltransferase activity (H3-K4 specific)(GO:0042800) |
| 0.1 | 2.1 | GO:0004143 | diacylglycerol kinase activity(GO:0004143) |
| 0.1 | 3.4 | GO:0043548 | phosphatidylinositol 3-kinase binding(GO:0043548) |
| 0.1 | 3.1 | GO:0015269 | calcium-activated potassium channel activity(GO:0015269) |
| 0.1 | 4.8 | GO:0042162 | telomeric DNA binding(GO:0042162) |
| 0.1 | 1.8 | GO:0043236 | laminin binding(GO:0043236) |
| 0.1 | 0.7 | GO:1990825 | sequence-specific mRNA binding(GO:1990825) |
| 0.1 | 3.2 | GO:0005540 | hyaluronic acid binding(GO:0005540) |
| 0.1 | 3.8 | GO:0042056 | chemoattractant activity(GO:0042056) |
| 0.1 | 0.4 | GO:0043398 | HLH domain binding(GO:0043398) |
| 0.1 | 0.7 | GO:0050693 | LBD domain binding(GO:0050693) |
| 0.1 | 2.5 | GO:0004012 | phospholipid-translocating ATPase activity(GO:0004012) |
| 0.1 | 0.6 | GO:0016416 | O-palmitoyltransferase activity(GO:0016416) |
| 0.1 | 1.1 | GO:0004571 | mannosyl-oligosaccharide 1,2-alpha-mannosidase activity(GO:0004571) |
| 0.1 | 2.1 | GO:0005247 | voltage-gated chloride channel activity(GO:0005247) |
| 0.1 | 2.8 | GO:0030332 | cyclin binding(GO:0030332) |
| 0.1 | 0.6 | GO:0016176 | superoxide-generating NADPH oxidase activator activity(GO:0016176) |
| 0.1 | 1.9 | GO:0005112 | Notch binding(GO:0005112) |
| 0.1 | 4.2 | GO:0030374 | ligand-dependent nuclear receptor transcription coactivator activity(GO:0030374) |
| 0.1 | 1.8 | GO:0001608 | G-protein coupled nucleotide receptor activity(GO:0001608) G-protein coupled purinergic nucleotide receptor activity(GO:0045028) |
| 0.1 | 1.0 | GO:0005021 | vascular endothelial growth factor-activated receptor activity(GO:0005021) |
| 0.1 | 0.6 | GO:0030229 | very-low-density lipoprotein particle receptor activity(GO:0030229) |
| 0.1 | 0.5 | GO:0097322 | 7SK snRNA binding(GO:0097322) |
| 0.1 | 2.1 | GO:0008266 | poly(U) RNA binding(GO:0008266) |
| 0.1 | 0.9 | GO:0097016 | L27 domain binding(GO:0097016) |
| 0.1 | 1.0 | GO:0034452 | dynactin binding(GO:0034452) |
| 0.1 | 1.9 | GO:0070412 | R-SMAD binding(GO:0070412) |
| 0.1 | 2.1 | GO:0001540 | beta-amyloid binding(GO:0001540) |
| 0.1 | 0.5 | GO:0008109 | N-acetyllactosaminide beta-1,6-N-acetylglucosaminyltransferase activity(GO:0008109) |
| 0.1 | 1.0 | GO:0017017 | MAP kinase tyrosine/serine/threonine phosphatase activity(GO:0017017) |
| 0.1 | 7.6 | GO:0004222 | metalloendopeptidase activity(GO:0004222) |
| 0.1 | 0.7 | GO:0050780 | dopamine receptor binding(GO:0050780) |
| 0.1 | 1.2 | GO:0016493 | C-C chemokine receptor activity(GO:0016493) |
| 0.1 | 0.8 | GO:0035612 | AP-2 adaptor complex binding(GO:0035612) |
| 0.1 | 1.5 | GO:0005245 | voltage-gated calcium channel activity(GO:0005245) |
| 0.1 | 1.4 | GO:0051428 | peptide hormone receptor binding(GO:0051428) |
| 0.1 | 1.1 | GO:0032794 | GTPase activating protein binding(GO:0032794) |
| 0.1 | 1.5 | GO:0019198 | transmembrane receptor protein tyrosine phosphatase activity(GO:0005001) transmembrane receptor protein phosphatase activity(GO:0019198) |
| 0.1 | 4.0 | GO:0008186 | ATP-dependent RNA helicase activity(GO:0004004) RNA-dependent ATPase activity(GO:0008186) |
| 0.1 | 0.4 | GO:0098988 | adenylate cyclase inhibiting G-protein coupled glutamate receptor activity(GO:0001640) kainate selective glutamate receptor activity(GO:0015277) G-protein coupled glutamate receptor activity(GO:0098988) |
| 0.1 | 0.5 | GO:1990380 | Lys63-specific deubiquitinase activity(GO:0061578) Lys48-specific deubiquitinase activity(GO:1990380) |
| 0.1 | 15.0 | GO:0001227 | transcriptional repressor activity, RNA polymerase II transcription regulatory region sequence-specific binding(GO:0001227) |
| 0.1 | 0.1 | GO:1990763 | arrestin family protein binding(GO:1990763) |
| 0.1 | 0.4 | GO:0004957 | prostaglandin E receptor activity(GO:0004957) |
| 0.1 | 0.8 | GO:0015467 | G-protein activated inward rectifier potassium channel activity(GO:0015467) |
| 0.1 | 1.7 | GO:0001972 | retinoic acid binding(GO:0001972) |
| 0.1 | 3.3 | GO:0019905 | syntaxin binding(GO:0019905) |
| 0.0 | 1.4 | GO:0004385 | guanylate kinase activity(GO:0004385) |
| 0.0 | 0.2 | GO:0008823 | cupric reductase activity(GO:0008823) ferric-chelate reductase (NADPH) activity(GO:0052851) |
| 0.0 | 9.4 | GO:0000287 | magnesium ion binding(GO:0000287) |
| 0.0 | 4.3 | GO:0003705 | transcription factor activity, RNA polymerase II distal enhancer sequence-specific binding(GO:0003705) |
| 0.0 | 0.2 | GO:0017089 | glycolipid transporter activity(GO:0017089) |
| 0.0 | 0.5 | GO:0008020 | G-protein coupled photoreceptor activity(GO:0008020) |
| 0.0 | 3.6 | GO:0015171 | amino acid transmembrane transporter activity(GO:0015171) |
| 0.0 | 2.3 | GO:0015297 | antiporter activity(GO:0015297) |
| 0.0 | 2.6 | GO:0002039 | p53 binding(GO:0002039) |
| 0.0 | 2.5 | GO:0004843 | thiol-dependent ubiquitin-specific protease activity(GO:0004843) |
| 0.0 | 16.6 | GO:0001228 | transcriptional activator activity, RNA polymerase II transcription regulatory region sequence-specific binding(GO:0001228) |
| 0.0 | 2.7 | GO:0003777 | microtubule motor activity(GO:0003777) |
| 0.0 | 1.7 | GO:0043621 | protein self-association(GO:0043621) |
| 0.0 | 0.6 | GO:0000983 | transcription factor activity, RNA polymerase II core promoter sequence-specific(GO:0000983) |
| 0.0 | 1.6 | GO:0004407 | histone deacetylase activity(GO:0004407) |
| 0.0 | 1.1 | GO:0019894 | kinesin binding(GO:0019894) |
| 0.0 | 0.8 | GO:0051721 | protein phosphatase 2A binding(GO:0051721) |
| 0.0 | 1.8 | GO:0008146 | sulfotransferase activity(GO:0008146) |
| 0.0 | 0.1 | GO:0004351 | glutamate decarboxylase activity(GO:0004351) |
| 0.0 | 0.5 | GO:0070402 | NADPH binding(GO:0070402) |
| 0.0 | 0.9 | GO:0036002 | pre-mRNA binding(GO:0036002) |
| 0.0 | 3.0 | GO:0004860 | protein kinase inhibitor activity(GO:0004860) |
| 0.0 | 0.3 | GO:0045294 | alpha-catenin binding(GO:0045294) |
| 0.0 | 1.5 | GO:0003697 | single-stranded DNA binding(GO:0003697) |
| 0.0 | 0.3 | GO:1905030 | voltage-gated sodium channel activity(GO:0005248) voltage-gated ion channel activity involved in regulation of postsynaptic membrane potential(GO:1905030) |
| 0.0 | 1.3 | GO:0004714 | transmembrane receptor protein tyrosine kinase activity(GO:0004714) |
| 0.0 | 0.8 | GO:0030507 | spectrin binding(GO:0030507) |
| 0.0 | 0.4 | GO:0015020 | glucuronosyltransferase activity(GO:0015020) |
| 0.0 | 0.9 | GO:0030674 | protein binding, bridging(GO:0030674) |
| 0.0 | 11.4 | GO:0005509 | calcium ion binding(GO:0005509) |
| 0.0 | 1.4 | GO:0005070 | SH3/SH2 adaptor activity(GO:0005070) |
| 0.0 | 1.6 | GO:1901981 | phosphatidylinositol phosphate binding(GO:1901981) |
| 0.0 | 1.2 | GO:0001664 | G-protein coupled receptor binding(GO:0001664) |
| 0.0 | 0.2 | GO:0070001 | aspartic-type endopeptidase activity(GO:0004190) aspartic-type peptidase activity(GO:0070001) |
| 0.0 | 0.2 | GO:0005159 | insulin-like growth factor receptor binding(GO:0005159) |
| 0.0 | 0.1 | GO:0004435 | phosphatidylinositol phospholipase C activity(GO:0004435) |
| 0.0 | 0.2 | GO:0008417 | fucosyltransferase activity(GO:0008417) |
Gene overrepresentation in C2:CP category:
| Log-likelihood per target | Total log-likelihood | Term | Description |
|---|---|---|---|
| 0.5 | 5.1 | SIG PIP3 SIGNALING IN CARDIAC MYOCTES | Genes related to PIP3 signaling in cardiac myocytes |
| 0.4 | 2.3 | PID PDGFRA PATHWAY | PDGFR-alpha signaling pathway |
| 0.3 | 7.4 | PID ANTHRAX PATHWAY | Cellular roles of Anthrax toxin |
| 0.2 | 5.8 | PID LPA4 PATHWAY | LPA4-mediated signaling events |
| 0.2 | 1.8 | PID EPHB FWD PATHWAY | EPHB forward signaling |
| 0.2 | 3.5 | PID VEGF VEGFR PATHWAY | VEGF and VEGFR signaling network |
| 0.2 | 11.6 | PID ARF6 TRAFFICKING PATHWAY | Arf6 trafficking events |
| 0.2 | 6.8 | PID ALK1 PATHWAY | ALK1 signaling events |
| 0.2 | 4.4 | PID WNT CANONICAL PATHWAY | Canonical Wnt signaling pathway |
| 0.2 | 4.3 | ST WNT BETA CATENIN PATHWAY | Wnt/beta-catenin Pathway |
| 0.1 | 9.4 | ST GA13 PATHWAY | G alpha 13 Pathway |
| 0.1 | 9.1 | PID HNF3B PATHWAY | FOXA2 and FOXA3 transcription factor networks |
| 0.1 | 5.6 | PID REELIN PATHWAY | Reelin signaling pathway |
| 0.1 | 8.1 | PID CERAMIDE PATHWAY | Ceramide signaling pathway |
| 0.1 | 1.5 | PID PI3K PLC TRK PATHWAY | Trk receptor signaling mediated by PI3K and PLC-gamma |
| 0.1 | 1.1 | PID NFKAPPAB ATYPICAL PATHWAY | Atypical NF-kappaB pathway |
| 0.1 | 2.9 | SA MMP CYTOKINE CONNECTION | Cytokines can induce activation of matrix metalloproteinases, which degrade extracellular matrix. |
| 0.1 | 3.4 | PID HDAC CLASSIII PATHWAY | Signaling events mediated by HDAC Class III |
| 0.1 | 3.5 | PID RXR VDR PATHWAY | RXR and RAR heterodimerization with other nuclear receptor |
| 0.1 | 4.7 | PID SYNDECAN 1 PATHWAY | Syndecan-1-mediated signaling events |
| 0.1 | 4.1 | PID TCR CALCIUM PATHWAY | Calcium signaling in the CD4+ TCR pathway |
| 0.1 | 4.6 | PID FRA PATHWAY | Validated transcriptional targets of AP1 family members Fra1 and Fra2 |
| 0.1 | 1.5 | ST MYOCYTE AD PATHWAY | Myocyte Adrenergic Pathway is a specific case of the generalized Adrenergic Pathway. |
| 0.1 | 2.7 | PID MYC PATHWAY | C-MYC pathway |
| 0.1 | 2.6 | SIG PIP3 SIGNALING IN B LYMPHOCYTES | Genes related to PIP3 signaling in B lymphocytes |
| 0.1 | 4.1 | PID AR TF PATHWAY | Regulation of Androgen receptor activity |
| 0.1 | 2.0 | PID NCADHERIN PATHWAY | N-cadherin signaling events |
| 0.1 | 4.8 | PID P75 NTR PATHWAY | p75(NTR)-mediated signaling |
| 0.1 | 1.1 | PID SYNDECAN 3 PATHWAY | Syndecan-3-mediated signaling events |
| 0.1 | 1.5 | PID RAS PATHWAY | Regulation of Ras family activation |
| 0.1 | 1.6 | PID NETRIN PATHWAY | Netrin-mediated signaling events |
| 0.0 | 2.8 | PID HNF3A PATHWAY | FOXA1 transcription factor network |
| 0.0 | 1.0 | PID TRKR PATHWAY | Neurotrophic factor-mediated Trk receptor signaling |
| 0.0 | 6.9 | NABA ECM AFFILIATED | Genes encoding proteins affiliated structurally or functionally to extracellular matrix proteins |
| 0.0 | 2.2 | PID ERA GENOMIC PATHWAY | Validated nuclear estrogen receptor alpha network |
| 0.0 | 1.4 | PID RHOA PATHWAY | RhoA signaling pathway |
| 0.0 | 0.5 | SIG CD40PATHWAYMAP | Genes related to CD40 signaling |
| 0.0 | 1.1 | PID SMAD2 3NUCLEAR PATHWAY | Regulation of nuclear SMAD2/3 signaling |
| 0.0 | 0.5 | PID S1P S1P2 PATHWAY | S1P2 pathway |
| 0.0 | 1.3 | PID KIT PATHWAY | Signaling events mediated by Stem cell factor receptor (c-Kit) |
| 0.0 | 1.7 | PID CDC42 PATHWAY | CDC42 signaling events |
| 0.0 | 0.4 | ST DIFFERENTIATION PATHWAY IN PC12 CELLS | Differentiation Pathway in PC12 Cells; this is a specific case of PAC1 Receptor Pathway. |
| 0.0 | 0.7 | ST WNT CA2 CYCLIC GMP PATHWAY | Wnt/Ca2+/cyclic GMP signaling. |
| 0.0 | 0.5 | PID BETA CATENIN NUC PATHWAY | Regulation of nuclear beta catenin signaling and target gene transcription |
| 0.0 | 1.6 | PID DELTA NP63 PATHWAY | Validated transcriptional targets of deltaNp63 isoforms |
| 0.0 | 0.6 | PID CONE PATHWAY | Visual signal transduction: Cones |
| 0.0 | 5.4 | NABA ECM GLYCOPROTEINS | Genes encoding structural ECM glycoproteins |
| 0.0 | 2.0 | WNT SIGNALING | Genes related to Wnt-mediated signal transduction |
| 0.0 | 0.9 | PID NOTCH PATHWAY | Notch signaling pathway |
| 0.0 | 0.6 | PID EPHA FWDPATHWAY | EPHA forward signaling |
| 0.0 | 0.3 | PID PS1 PATHWAY | Presenilin action in Notch and Wnt signaling |
| 0.0 | 0.4 | PID EPHRINB REV PATHWAY | Ephrin B reverse signaling |
| 0.0 | 0.7 | PID HEDGEHOG GLI PATHWAY | Hedgehog signaling events mediated by Gli proteins |
| 0.0 | 0.2 | PID ATF2 PATHWAY | ATF-2 transcription factor network |
| 0.0 | 0.7 | PID HIF2PATHWAY | HIF-2-alpha transcription factor network |
| 0.0 | 2.7 | NABA ECM REGULATORS | Genes encoding enzymes and their regulators involved in the remodeling of the extracellular matrix |
| 0.0 | 0.7 | PID IL4 2PATHWAY | IL4-mediated signaling events |
| 0.0 | 0.5 | PID PTP1B PATHWAY | Signaling events mediated by PTP1B |
Gene overrepresentation in C2:CP:REACTOME category:
| Log-likelihood per target | Total log-likelihood | Term | Description |
|---|---|---|---|
| 0.6 | 3.8 | REACTOME DOWNSTREAM SIGNAL TRANSDUCTION | Genes involved in Downstream signal transduction |
| 0.4 | 5.4 | REACTOME ADENYLATE CYCLASE ACTIVATING PATHWAY | Genes involved in Adenylate cyclase activating pathway |
| 0.4 | 3.2 | REACTOME REGULATION OF KIT SIGNALING | Genes involved in Regulation of KIT signaling |
| 0.4 | 7.4 | REACTOME JNK C JUN KINASES PHOSPHORYLATION AND ACTIVATION MEDIATED BY ACTIVATED HUMAN TAK1 | Genes involved in JNK (c-Jun kinases) phosphorylation and activation mediated by activated human TAK1 |
| 0.4 | 7.0 | REACTOME DOPAMINE NEUROTRANSMITTER RELEASE CYCLE | Genes involved in Dopamine Neurotransmitter Release Cycle |
| 0.3 | 5.2 | REACTOME NFKB IS ACTIVATED AND SIGNALS SURVIVAL | Genes involved in NF-kB is activated and signals survival |
| 0.3 | 5.4 | REACTOME REGULATION OF PYRUVATE DEHYDROGENASE PDH COMPLEX | Genes involved in Regulation of pyruvate dehydrogenase (PDH) complex |
| 0.3 | 12.3 | REACTOME CGMP EFFECTS | Genes involved in cGMP effects |
| 0.3 | 4.0 | REACTOME REVERSIBLE HYDRATION OF CARBON DIOXIDE | Genes involved in Reversible Hydration of Carbon Dioxide |
| 0.3 | 6.2 | REACTOME ACYL CHAIN REMODELLING OF PE | Genes involved in Acyl chain remodelling of PE |
| 0.2 | 6.9 | REACTOME ACTIVATED NOTCH1 TRANSMITS SIGNAL TO THE NUCLEUS | Genes involved in Activated NOTCH1 Transmits Signal to the Nucleus |
| 0.2 | 2.9 | REACTOME VITAMIN B5 PANTOTHENATE METABOLISM | Genes involved in Vitamin B5 (pantothenate) metabolism |
| 0.2 | 3.3 | REACTOME SYNTHESIS OF SUBSTRATES IN N GLYCAN BIOSYTHESIS | Genes involved in Synthesis of substrates in N-glycan biosythesis |
| 0.2 | 4.7 | REACTOME OTHER SEMAPHORIN INTERACTIONS | Genes involved in Other semaphorin interactions |
| 0.2 | 3.5 | REACTOME VEGF LIGAND RECEPTOR INTERACTIONS | Genes involved in VEGF ligand-receptor interactions |
| 0.2 | 1.9 | REACTOME PYRUVATE METABOLISM | Genes involved in Pyruvate metabolism |
| 0.2 | 5.7 | REACTOME SPHINGOLIPID DE NOVO BIOSYNTHESIS | Genes involved in Sphingolipid de novo biosynthesis |
| 0.2 | 5.8 | REACTOME REGULATION OF BETA CELL DEVELOPMENT | Genes involved in Regulation of beta-cell development |
| 0.1 | 6.8 | REACTOME PIP3 ACTIVATES AKT SIGNALING | Genes involved in PIP3 activates AKT signaling |
| 0.1 | 1.0 | REACTOME TANDEM PORE DOMAIN POTASSIUM CHANNELS | Genes involved in Tandem pore domain potassium channels |
| 0.1 | 3.3 | REACTOME CTNNB1 PHOSPHORYLATION CASCADE | Genes involved in Beta-catenin phosphorylation cascade |
| 0.1 | 2.6 | REACTOME HYALURONAN UPTAKE AND DEGRADATION | Genes involved in Hyaluronan uptake and degradation |
| 0.1 | 2.0 | REACTOME PLATELET ADHESION TO EXPOSED COLLAGEN | Genes involved in Platelet Adhesion to exposed collagen |
| 0.1 | 5.1 | REACTOME YAP1 AND WWTR1 TAZ STIMULATED GENE EXPRESSION | Genes involved in YAP1- and WWTR1 (TAZ)-stimulated gene expression |
| 0.1 | 6.4 | REACTOME VOLTAGE GATED POTASSIUM CHANNELS | Genes involved in Voltage gated Potassium channels |
| 0.1 | 2.3 | REACTOME SIGNALING BY ROBO RECEPTOR | Genes involved in Signaling by Robo receptor |
| 0.1 | 2.4 | REACTOME SIGNALING BY BMP | Genes involved in Signaling by BMP |
| 0.1 | 4.6 | REACTOME TIGHT JUNCTION INTERACTIONS | Genes involved in Tight junction interactions |
| 0.1 | 9.5 | REACTOME TRANSCRIPTIONAL REGULATION OF WHITE ADIPOCYTE DIFFERENTIATION | Genes involved in Transcriptional Regulation of White Adipocyte Differentiation |
| 0.1 | 3.3 | REACTOME INSULIN RECEPTOR RECYCLING | Genes involved in Insulin receptor recycling |
| 0.1 | 1.6 | REACTOME ROLE OF SECOND MESSENGERS IN NETRIN1 SIGNALING | Genes involved in Role of second messengers in netrin-1 signaling |
| 0.1 | 4.3 | REACTOME A TETRASACCHARIDE LINKER SEQUENCE IS REQUIRED FOR GAG SYNTHESIS | Genes involved in A tetrasaccharide linker sequence is required for GAG synthesis |
| 0.1 | 4.8 | REACTOME NETRIN1 SIGNALING | Genes involved in Netrin-1 signaling |
| 0.1 | 2.0 | REACTOME GABA SYNTHESIS RELEASE REUPTAKE AND DEGRADATION | Genes involved in GABA synthesis, release, reuptake and degradation |
| 0.1 | 1.8 | REACTOME CHONDROITIN SULFATE DERMATAN SULFATE METABOLISM | Genes involved in Chondroitin sulfate/dermatan sulfate metabolism |
| 0.1 | 1.8 | REACTOME P2Y RECEPTORS | Genes involved in P2Y receptors |
| 0.1 | 2.8 | REACTOME CELL CELL JUNCTION ORGANIZATION | Genes involved in Cell-cell junction organization |
| 0.1 | 2.7 | REACTOME ASSOCIATION OF TRIC CCT WITH TARGET PROTEINS DURING BIOSYNTHESIS | Genes involved in Association of TriC/CCT with target proteins during biosynthesis |
| 0.1 | 1.0 | REACTOME HORMONE SENSITIVE LIPASE HSL MEDIATED TRIACYLGLYCEROL HYDROLYSIS | Genes involved in Hormone-sensitive lipase (HSL)-mediated triacylglycerol hydrolysis |
| 0.1 | 5.5 | REACTOME SMOOTH MUSCLE CONTRACTION | Genes involved in Smooth Muscle Contraction |
| 0.1 | 3.0 | REACTOME SULFUR AMINO ACID METABOLISM | Genes involved in Sulfur amino acid metabolism |
| 0.1 | 2.1 | REACTOME CYTOSOLIC SULFONATION OF SMALL MOLECULES | Genes involved in Cytosolic sulfonation of small molecules |
| 0.1 | 1.4 | REACTOME HS GAG BIOSYNTHESIS | Genes involved in HS-GAG biosynthesis |
| 0.1 | 1.1 | REACTOME TGF BETA RECEPTOR SIGNALING IN EMT EPITHELIAL TO MESENCHYMAL TRANSITION | Genes involved in TGF-beta receptor signaling in EMT (epithelial to mesenchymal transition) |
| 0.1 | 0.5 | REACTOME PI3K AKT ACTIVATION | Genes involved in PI3K/AKT activation |
| 0.1 | 1.6 | REACTOME SMAD2 SMAD3 SMAD4 HETEROTRIMER REGULATES TRANSCRIPTION | Genes involved in SMAD2/SMAD3:SMAD4 heterotrimer regulates transcription |
| 0.1 | 1.1 | REACTOME REGULATION OF RHEB GTPASE ACTIVITY BY AMPK | Genes involved in Regulation of Rheb GTPase activity by AMPK |
| 0.1 | 1.8 | REACTOME TRAFFICKING OF GLUR2 CONTAINING AMPA RECEPTORS | Genes involved in Trafficking of GluR2-containing AMPA receptors |
| 0.1 | 1.1 | REACTOME CALNEXIN CALRETICULIN CYCLE | Genes involved in Calnexin/calreticulin cycle |
| 0.1 | 2.1 | REACTOME EFFECTS OF PIP2 HYDROLYSIS | Genes involved in Effects of PIP2 hydrolysis |
| 0.1 | 1.9 | REACTOME RECYCLING PATHWAY OF L1 | Genes involved in Recycling pathway of L1 |
| 0.1 | 1.6 | REACTOME REGULATION OF INSULIN LIKE GROWTH FACTOR IGF ACTIVITY BY INSULIN LIKE GROWTH FACTOR BINDING PROTEINS IGFBPS | Genes involved in Regulation of Insulin-like Growth Factor (IGF) Activity by Insulin-like Growth Factor Binding Proteins (IGFBPs) |
| 0.1 | 3.5 | REACTOME NCAM1 INTERACTIONS | Genes involved in NCAM1 interactions |
| 0.1 | 0.8 | REACTOME MRNA DECAY BY 5 TO 3 EXORIBONUCLEASE | Genes involved in mRNA Decay by 5' to 3' Exoribonuclease |
| 0.1 | 2.3 | REACTOME CLASS B 2 SECRETIN FAMILY RECEPTORS | Genes involved in Class B/2 (Secretin family receptors) |
| 0.1 | 0.4 | REACTOME PROSTANOID LIGAND RECEPTORS | Genes involved in Prostanoid ligand receptors |
| 0.1 | 1.7 | REACTOME KERATAN SULFATE BIOSYNTHESIS | Genes involved in Keratan sulfate biosynthesis |
| 0.1 | 0.8 | REACTOME CRMPS IN SEMA3A SIGNALING | Genes involved in CRMPs in Sema3A signaling |
| 0.1 | 0.7 | REACTOME THROMBOXANE SIGNALLING THROUGH TP RECEPTOR | Genes involved in Thromboxane signalling through TP receptor |
| 0.0 | 2.3 | REACTOME ION TRANSPORT BY P TYPE ATPASES | Genes involved in Ion transport by P-type ATPases |
| 0.0 | 1.6 | REACTOME PRE NOTCH EXPRESSION AND PROCESSING | Genes involved in Pre-NOTCH Expression and Processing |
| 0.0 | 2.2 | REACTOME POTASSIUM CHANNELS | Genes involved in Potassium Channels |
| 0.0 | 1.0 | REACTOME TRAFFICKING OF AMPA RECEPTORS | Genes involved in Trafficking of AMPA receptors |
| 0.0 | 0.2 | REACTOME TRANSFERRIN ENDOCYTOSIS AND RECYCLING | Genes involved in Transferrin endocytosis and recycling |
| 0.0 | 0.7 | REACTOME RNA POL III TRANSCRIPTION TERMINATION | Genes involved in RNA Polymerase III Transcription Termination |
| 0.0 | 0.6 | REACTOME CHYLOMICRON MEDIATED LIPID TRANSPORT | Genes involved in Chylomicron-mediated lipid transport |
| 0.0 | 1.5 | REACTOME MRNA CAPPING | Genes involved in mRNA Capping |
| 0.0 | 0.4 | REACTOME IONOTROPIC ACTIVITY OF KAINATE RECEPTORS | Genes involved in Ionotropic activity of Kainate Receptors |
| 0.0 | 0.5 | REACTOME ELONGATION ARREST AND RECOVERY | Genes involved in Elongation arrest and recovery |
| 0.0 | 0.8 | REACTOME SIGNAL TRANSDUCTION BY L1 | Genes involved in Signal transduction by L1 |
| 0.0 | 2.1 | REACTOME NUCLEAR RECEPTOR TRANSCRIPTION PATHWAY | Genes involved in Nuclear Receptor transcription pathway |
| 0.0 | 1.0 | REACTOME SEMA4D IN SEMAPHORIN SIGNALING | Genes involved in Sema4D in semaphorin signaling |
| 0.0 | 3.0 | REACTOME G ALPHA S SIGNALLING EVENTS | Genes involved in G alpha (s) signalling events |
| 0.0 | 0.3 | REACTOME SIGNALING BY HIPPO | Genes involved in Signaling by Hippo |
| 0.0 | 0.3 | REACTOME RNA POL III TRANSCRIPTION INITIATION FROM TYPE 3 PROMOTER | Genes involved in RNA Polymerase III Transcription Initiation From Type 3 Promoter |
| 0.0 | 1.9 | REACTOME LOSS OF NLP FROM MITOTIC CENTROSOMES | Genes involved in Loss of Nlp from mitotic centrosomes |
| 0.0 | 0.7 | REACTOME FORMATION OF FIBRIN CLOT CLOTTING CASCADE | Genes involved in Formation of Fibrin Clot (Clotting Cascade) |
| 0.0 | 3.6 | REACTOME G ALPHA I SIGNALLING EVENTS | Genes involved in G alpha (i) signalling events |
| 0.0 | 0.7 | REACTOME COLLAGEN FORMATION | Genes involved in Collagen formation |
| 0.0 | 0.6 | REACTOME METABOLISM OF STEROID HORMONES AND VITAMINS A AND D | Genes involved in Metabolism of steroid hormones and vitamins A and D |
| 0.0 | 0.2 | REACTOME HDL MEDIATED LIPID TRANSPORT | Genes involved in HDL-mediated lipid transport |
| 0.0 | 0.7 | REACTOME ION CHANNEL TRANSPORT | Genes involved in Ion channel transport |
| 0.0 | 1.4 | REACTOME TRANSPORT OF GLUCOSE AND OTHER SUGARS BILE SALTS AND ORGANIC ACIDS METAL IONS AND AMINE COMPOUNDS | Genes involved in Transport of glucose and other sugars, bile salts and organic acids, metal ions and amine compounds |
| 0.0 | 0.1 | REACTOME REGULATION OF SIGNALING BY CBL | Genes involved in Regulation of signaling by CBL |