Project
GNF SymAtlas + NCI-60 cancer cell lines, comparison of cancers vs non-cancers, human (Su, 2004; Ross, 2000)
Navigation
Downloads
Results for CAGUAGU
Z-value: 0.81
Motif logo

miRNA associated with seed CAGUAGU
| Name | miRBASE accession |
|---|---|
|
hsa-miR-199a-3p
|
MIMAT0000232 |
|
hsa-miR-199b-3p
|
MIMAT0004563 |
|
hsa-miR-3129-5p
|
MIMAT0014992 |
Activity profile of CAGUAGU motif
Sorted Z-values of CAGUAGU motif
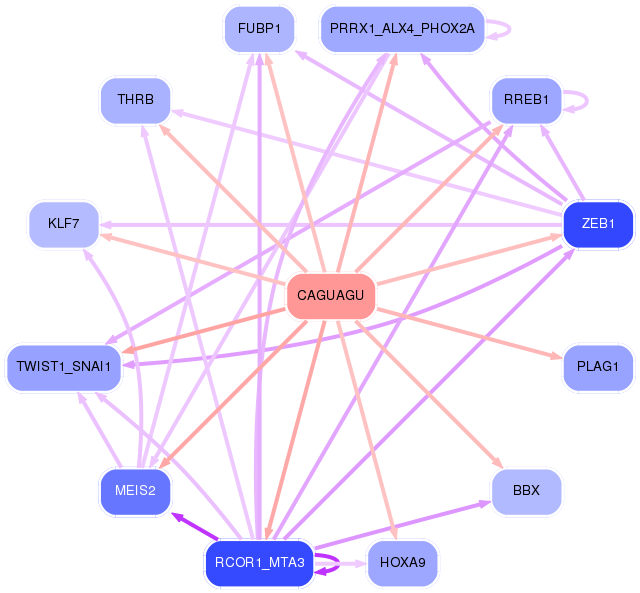
Network of associatons between targets according to the STRING database.

First level regulatory network of CAGUAGU
Gene Ontology Analysis
Gene overrepresentation in biological_process category:
| Log-likelihood per target | Total log-likelihood | Term | Description |
|---|---|---|---|
| 6.1 | 18.2 | GO:0032911 | negative regulation of transforming growth factor beta1 production(GO:0032911) |
| 5.4 | 21.6 | GO:0046035 | CMP salvage(GO:0006238) CMP biosynthetic process(GO:0009224) CMP metabolic process(GO:0046035) |
| 2.8 | 11.1 | GO:0042986 | positive regulation of amyloid precursor protein biosynthetic process(GO:0042986) |
| 2.4 | 18.8 | GO:1900625 | regulation of monocyte aggregation(GO:1900623) positive regulation of monocyte aggregation(GO:1900625) |
| 2.1 | 12.8 | GO:0044789 | modulation by host of viral release from host cell(GO:0044789) positive regulation by host of viral release from host cell(GO:0044791) |
| 2.1 | 8.4 | GO:0006391 | transcription initiation from mitochondrial promoter(GO:0006391) |
| 2.0 | 6.1 | GO:2000276 | negative regulation of peroxisome proliferator activated receptor signaling pathway(GO:0035359) negative regulation of oxidative phosphorylation uncoupler activity(GO:2000276) |
| 2.0 | 8.0 | GO:0044111 | development involved in symbiotic interaction(GO:0044111) |
| 1.6 | 8.1 | GO:0038026 | reelin-mediated signaling pathway(GO:0038026) |
| 1.4 | 2.9 | GO:0034773 | histone H4-K20 trimethylation(GO:0034773) |
| 1.4 | 4.2 | GO:0072275 | metanephric glomerulus morphogenesis(GO:0072275) metanephric glomerulus vasculature morphogenesis(GO:0072276) metanephric glomerular capillary formation(GO:0072277) |
| 1.3 | 9.3 | GO:1903593 | regulation of histamine secretion by mast cell(GO:1903593) |
| 1.3 | 7.6 | GO:1903385 | regulation of homophilic cell adhesion(GO:1903385) |
| 1.3 | 3.8 | GO:1903033 | regulation of microtubule plus-end binding(GO:1903031) positive regulation of microtubule plus-end binding(GO:1903033) |
| 1.2 | 3.7 | GO:0044205 | 'de novo' UMP biosynthetic process(GO:0044205) |
| 1.2 | 9.5 | GO:2001256 | regulation of store-operated calcium entry(GO:2001256) |
| 1.2 | 3.5 | GO:1903371 | regulation of endoplasmic reticulum tubular network organization(GO:1903371) |
| 1.1 | 4.6 | GO:1904046 | negative regulation of vascular endothelial growth factor production(GO:1904046) |
| 1.1 | 3.3 | GO:0052047 | interaction with other organism via secreted substance involved in symbiotic interaction(GO:0052047) |
| 1.0 | 6.3 | GO:0016554 | cytidine to uridine editing(GO:0016554) |
| 1.0 | 3.1 | GO:0033140 | negative regulation of peptidyl-serine phosphorylation of STAT protein(GO:0033140) |
| 1.0 | 2.9 | GO:2000687 | negative regulation of rubidium ion transport(GO:2000681) negative regulation of rubidium ion transmembrane transporter activity(GO:2000687) |
| 0.9 | 2.8 | GO:1903778 | protein localization to vacuolar membrane(GO:1903778) |
| 0.9 | 5.5 | GO:0070966 | nuclear-transcribed mRNA catabolic process, no-go decay(GO:0070966) |
| 0.9 | 2.7 | GO:1902309 | regulation of heart rate by hormone(GO:0003064) negative regulation of peptidyl-serine dephosphorylation(GO:1902309) |
| 0.9 | 14.6 | GO:0051198 | negative regulation of glycolytic process(GO:0045820) negative regulation of cofactor metabolic process(GO:0051195) negative regulation of coenzyme metabolic process(GO:0051198) |
| 0.8 | 4.2 | GO:0061088 | regulation of sequestering of zinc ion(GO:0061088) |
| 0.8 | 5.8 | GO:0000710 | meiotic mismatch repair(GO:0000710) |
| 0.8 | 3.3 | GO:1900245 | positive regulation of MDA-5 signaling pathway(GO:1900245) |
| 0.8 | 5.7 | GO:0000290 | deadenylation-dependent decapping of nuclear-transcribed mRNA(GO:0000290) |
| 0.8 | 3.2 | GO:1903691 | positive regulation of wound healing, spreading of epidermal cells(GO:1903691) |
| 0.8 | 1.5 | GO:0061428 | negative regulation of transcription from RNA polymerase II promoter in response to hypoxia(GO:0061428) |
| 0.6 | 3.2 | GO:0048880 | sensory system development(GO:0048880) |
| 0.6 | 18.3 | GO:0031581 | hemidesmosome assembly(GO:0031581) |
| 0.6 | 2.5 | GO:0007538 | primary sex determination(GO:0007538) |
| 0.6 | 4.4 | GO:1904885 | beta-catenin destruction complex assembly(GO:1904885) |
| 0.6 | 5.4 | GO:1902459 | positive regulation of stem cell population maintenance(GO:1902459) |
| 0.6 | 3.5 | GO:2000567 | memory T cell activation(GO:0035709) regulation of memory T cell activation(GO:2000567) positive regulation of memory T cell activation(GO:2000568) |
| 0.6 | 2.3 | GO:0051138 | positive regulation of NK T cell differentiation(GO:0051138) |
| 0.6 | 4.5 | GO:0015693 | magnesium ion transport(GO:0015693) |
| 0.6 | 2.2 | GO:0021796 | cerebral cortex regionalization(GO:0021796) |
| 0.6 | 7.3 | GO:0051451 | myoblast migration(GO:0051451) |
| 0.5 | 2.2 | GO:0007621 | negative regulation of female receptivity(GO:0007621) |
| 0.5 | 5.3 | GO:0070933 | histone H4 deacetylation(GO:0070933) |
| 0.5 | 2.7 | GO:0007068 | negative regulation of transcription during mitosis(GO:0007068) negative regulation of transcription from RNA polymerase II promoter during mitosis(GO:0007070) |
| 0.5 | 8.0 | GO:0000338 | protein deneddylation(GO:0000338) |
| 0.5 | 1.0 | GO:0060437 | lung growth(GO:0060437) |
| 0.5 | 2.8 | GO:0046940 | nucleoside monophosphate phosphorylation(GO:0046940) |
| 0.5 | 1.8 | GO:0031339 | negative regulation of vesicle fusion(GO:0031339) |
| 0.5 | 10.4 | GO:0019372 | lipoxygenase pathway(GO:0019372) |
| 0.4 | 10.7 | GO:0060148 | positive regulation of posttranscriptional gene silencing(GO:0060148) positive regulation of gene silencing by miRNA(GO:2000637) |
| 0.4 | 6.6 | GO:0007253 | cytoplasmic sequestering of NF-kappaB(GO:0007253) |
| 0.4 | 14.8 | GO:1902475 | L-alpha-amino acid transmembrane transport(GO:1902475) |
| 0.4 | 4.5 | GO:0048251 | elastic fiber assembly(GO:0048251) |
| 0.4 | 1.4 | GO:1903826 | arginine transmembrane transport(GO:1903826) |
| 0.3 | 6.4 | GO:0007084 | mitotic nuclear envelope reassembly(GO:0007084) |
| 0.3 | 3.0 | GO:0060591 | chondroblast differentiation(GO:0060591) |
| 0.3 | 7.9 | GO:0002089 | lens morphogenesis in camera-type eye(GO:0002089) |
| 0.3 | 2.4 | GO:0070885 | positive regulation of sodium:proton antiporter activity(GO:0032417) negative regulation of calcineurin-NFAT signaling cascade(GO:0070885) |
| 0.3 | 3.0 | GO:0031274 | positive regulation of pseudopodium assembly(GO:0031274) |
| 0.3 | 6.5 | GO:0007172 | signal complex assembly(GO:0007172) |
| 0.3 | 3.6 | GO:1904903 | ESCRT complex disassembly(GO:1904896) ESCRT III complex disassembly(GO:1904903) |
| 0.3 | 1.5 | GO:1900748 | positive regulation of vascular endothelial growth factor signaling pathway(GO:1900748) |
| 0.2 | 1.0 | GO:0090107 | aminophospholipid transport(GO:0015917) regulation of high-density lipoprotein particle assembly(GO:0090107) |
| 0.2 | 2.1 | GO:0045602 | negative regulation of endothelial cell differentiation(GO:0045602) semicircular canal morphogenesis(GO:0048752) |
| 0.2 | 6.7 | GO:0009226 | nucleotide-sugar biosynthetic process(GO:0009226) |
| 0.2 | 1.6 | GO:1904153 | negative regulation of protein exit from endoplasmic reticulum(GO:0070862) negative regulation of retrograde protein transport, ER to cytosol(GO:1904153) |
| 0.2 | 0.9 | GO:0033031 | positive regulation of neutrophil apoptotic process(GO:0033031) |
| 0.2 | 3.3 | GO:0035970 | peptidyl-threonine dephosphorylation(GO:0035970) |
| 0.2 | 3.2 | GO:0060252 | positive regulation of glial cell proliferation(GO:0060252) |
| 0.2 | 4.6 | GO:0070734 | histone H3-K27 methylation(GO:0070734) |
| 0.2 | 10.1 | GO:0018196 | peptidyl-asparagine modification(GO:0018196) protein N-linked glycosylation via asparagine(GO:0018279) |
| 0.2 | 0.5 | GO:0031064 | negative regulation of histone deacetylation(GO:0031064) |
| 0.2 | 1.1 | GO:0090336 | positive regulation of brown fat cell differentiation(GO:0090336) |
| 0.1 | 1.5 | GO:0090168 | Golgi reassembly(GO:0090168) |
| 0.1 | 3.9 | GO:0045747 | positive regulation of Notch signaling pathway(GO:0045747) |
| 0.1 | 0.7 | GO:0006990 | positive regulation of transcription from RNA polymerase II promoter involved in unfolded protein response(GO:0006990) |
| 0.1 | 2.5 | GO:0048026 | positive regulation of mRNA splicing, via spliceosome(GO:0048026) |
| 0.1 | 1.5 | GO:0042118 | endothelial cell activation(GO:0042118) |
| 0.1 | 6.7 | GO:0048009 | insulin-like growth factor receptor signaling pathway(GO:0048009) |
| 0.1 | 0.7 | GO:0032511 | late endosome to vacuole transport via multivesicular body sorting pathway(GO:0032511) |
| 0.1 | 0.9 | GO:0003344 | pericardium morphogenesis(GO:0003344) |
| 0.1 | 1.2 | GO:0000183 | chromatin silencing at rDNA(GO:0000183) |
| 0.1 | 1.9 | GO:0006646 | phosphatidylethanolamine biosynthetic process(GO:0006646) |
| 0.1 | 0.4 | GO:0021683 | cerebellar granular layer morphogenesis(GO:0021683) |
| 0.1 | 3.4 | GO:0035116 | embryonic hindlimb morphogenesis(GO:0035116) |
| 0.1 | 0.8 | GO:0031936 | negative regulation of chromatin silencing(GO:0031936) |
| 0.1 | 0.4 | GO:2000381 | negative regulation of mesoderm development(GO:2000381) |
| 0.1 | 0.5 | GO:0036438 | maintenance of lens transparency(GO:0036438) |
| 0.1 | 1.4 | GO:0090161 | Golgi ribbon formation(GO:0090161) |
| 0.1 | 4.0 | GO:0070911 | global genome nucleotide-excision repair(GO:0070911) |
| 0.1 | 0.9 | GO:0061158 | long-chain fatty acid biosynthetic process(GO:0042759) 3'-UTR-mediated mRNA destabilization(GO:0061158) |
| 0.1 | 0.5 | GO:0001574 | ganglioside biosynthetic process(GO:0001574) |
| 0.1 | 0.5 | GO:0042670 | retinal cone cell differentiation(GO:0042670) retinal cone cell development(GO:0046549) |
| 0.1 | 0.9 | GO:0097094 | craniofacial suture morphogenesis(GO:0097094) |
| 0.1 | 8.6 | GO:0043473 | pigmentation(GO:0043473) |
| 0.1 | 0.4 | GO:1900239 | phenotypic switching(GO:0036166) regulation of phenotypic switching(GO:1900239) |
| 0.1 | 2.6 | GO:0034067 | protein localization to Golgi apparatus(GO:0034067) |
| 0.0 | 0.2 | GO:0097466 | protein deglycosylation involved in glycoprotein catabolic process(GO:0035977) glycoprotein ERAD pathway(GO:0097466) mannose trimming involved in glycoprotein ERAD pathway(GO:1904382) |
| 0.0 | 2.2 | GO:0070979 | protein K11-linked ubiquitination(GO:0070979) |
| 0.0 | 1.4 | GO:0035025 | positive regulation of Rho protein signal transduction(GO:0035025) |
| 0.0 | 1.2 | GO:0071711 | basement membrane organization(GO:0071711) |
| 0.0 | 6.9 | GO:0043484 | regulation of RNA splicing(GO:0043484) |
| 0.0 | 1.4 | GO:0060765 | regulation of androgen receptor signaling pathway(GO:0060765) |
| 0.0 | 1.2 | GO:1903206 | negative regulation of hydrogen peroxide-induced cell death(GO:1903206) |
| 0.0 | 1.0 | GO:0090162 | establishment of epithelial cell polarity(GO:0090162) |
| 0.0 | 4.2 | GO:0007292 | female gamete generation(GO:0007292) |
| 0.0 | 0.6 | GO:0007064 | mitotic sister chromatid cohesion(GO:0007064) |
| 0.0 | 1.1 | GO:0036152 | phosphatidylethanolamine acyl-chain remodeling(GO:0036152) |
| 0.0 | 2.0 | GO:0008542 | visual learning(GO:0008542) |
| 0.0 | 0.2 | GO:0031087 | nuclear-transcribed mRNA catabolic process, deadenylation-independent decay(GO:0031086) deadenylation-independent decapping of nuclear-transcribed mRNA(GO:0031087) |
| 0.0 | 1.1 | GO:0046949 | fatty-acyl-CoA biosynthetic process(GO:0046949) |
| 0.0 | 1.1 | GO:0051489 | regulation of filopodium assembly(GO:0051489) |
| 0.0 | 12.7 | GO:0043687 | post-translational protein modification(GO:0043687) |
| 0.0 | 6.8 | GO:0030336 | negative regulation of cell migration(GO:0030336) |
| 0.0 | 1.5 | GO:0046677 | response to antibiotic(GO:0046677) |
| 0.0 | 0.5 | GO:0072643 | interferon-gamma secretion(GO:0072643) |
| 0.0 | 2.6 | GO:0006334 | nucleosome assembly(GO:0006334) |
| 0.0 | 0.5 | GO:0032878 | regulation of establishment or maintenance of cell polarity(GO:0032878) |
| 0.0 | 0.2 | GO:0021702 | cerebellar Purkinje cell layer formation(GO:0021694) cerebellar Purkinje cell differentiation(GO:0021702) |
| 0.0 | 0.1 | GO:0001692 | histamine metabolic process(GO:0001692) |
| 0.0 | 7.2 | GO:0002283 | neutrophil activation involved in immune response(GO:0002283) neutrophil degranulation(GO:0043312) |
| 0.0 | 0.7 | GO:0007528 | neuromuscular junction development(GO:0007528) |
Gene overrepresentation in cellular_component category:
| Log-likelihood per target | Total log-likelihood | Term | Description |
|---|---|---|---|
| 2.7 | 18.8 | GO:0035692 | macrophage migration inhibitory factor receptor complex(GO:0035692) |
| 1.8 | 5.5 | GO:0034665 | integrin alpha1-beta1 complex(GO:0034665) |
| 1.7 | 5.0 | GO:0034676 | integrin alpha6-beta4 complex(GO:0034676) |
| 1.5 | 5.8 | GO:0032301 | MutSalpha complex(GO:0032301) |
| 1.4 | 5.6 | GO:0044094 | host cell nucleus(GO:0042025) host cell nuclear part(GO:0044094) |
| 1.1 | 5.6 | GO:0071148 | TEAD-1-YAP complex(GO:0071148) |
| 0.9 | 2.7 | GO:0035189 | Rb-E2F complex(GO:0035189) |
| 0.9 | 8.7 | GO:0097255 | R2TP complex(GO:0097255) |
| 0.7 | 16.6 | GO:0016580 | Sin3 complex(GO:0016580) |
| 0.6 | 3.8 | GO:0030981 | cortical microtubule cytoskeleton(GO:0030981) |
| 0.5 | 12.8 | GO:0002080 | acrosomal membrane(GO:0002080) |
| 0.5 | 4.6 | GO:0001739 | sex chromatin(GO:0001739) |
| 0.4 | 14.9 | GO:0000159 | protein phosphatase type 2A complex(GO:0000159) |
| 0.4 | 3.9 | GO:0097197 | tetraspanin-enriched microdomain(GO:0097197) |
| 0.4 | 4.5 | GO:0008250 | oligosaccharyltransferase complex(GO:0008250) |
| 0.4 | 4.4 | GO:0005847 | mRNA cleavage and polyadenylation specificity factor complex(GO:0005847) |
| 0.3 | 17.5 | GO:0031941 | filamentous actin(GO:0031941) |
| 0.3 | 3.4 | GO:0033018 | sarcoplasmic reticulum lumen(GO:0033018) |
| 0.3 | 4.6 | GO:0044613 | nuclear pore central transport channel(GO:0044613) |
| 0.3 | 8.1 | GO:0034385 | very-low-density lipoprotein particle(GO:0034361) triglyceride-rich lipoprotein particle(GO:0034385) |
| 0.2 | 1.2 | GO:0033553 | rDNA heterochromatin(GO:0033553) |
| 0.2 | 8.0 | GO:0016327 | apicolateral plasma membrane(GO:0016327) |
| 0.2 | 10.7 | GO:0043034 | costamere(GO:0043034) |
| 0.2 | 4.0 | GO:0098563 | integral component of synaptic vesicle membrane(GO:0030285) intrinsic component of synaptic vesicle membrane(GO:0098563) |
| 0.2 | 2.3 | GO:0030123 | AP-3 adaptor complex(GO:0030123) |
| 0.2 | 18.6 | GO:0005604 | basement membrane(GO:0005604) |
| 0.2 | 10.4 | GO:0000118 | histone deacetylase complex(GO:0000118) |
| 0.2 | 8.0 | GO:0008180 | COP9 signalosome(GO:0008180) |
| 0.2 | 8.4 | GO:0009295 | nucleoid(GO:0009295) mitochondrial nucleoid(GO:0042645) |
| 0.2 | 9.3 | GO:0031201 | SNARE complex(GO:0031201) |
| 0.1 | 11.5 | GO:0033116 | endoplasmic reticulum-Golgi intermediate compartment membrane(GO:0033116) |
| 0.1 | 5.3 | GO:1990391 | DNA repair complex(GO:1990391) |
| 0.1 | 11.1 | GO:0005884 | actin filament(GO:0005884) |
| 0.1 | 6.9 | GO:0010494 | cytoplasmic stress granule(GO:0010494) |
| 0.1 | 4.5 | GO:0005581 | collagen trimer(GO:0005581) |
| 0.1 | 2.8 | GO:0000421 | autophagosome membrane(GO:0000421) |
| 0.1 | 0.4 | GO:0031232 | extrinsic component of external side of plasma membrane(GO:0031232) |
| 0.1 | 6.5 | GO:0097517 | stress fiber(GO:0001725) contractile actin filament bundle(GO:0097517) |
| 0.1 | 1.1 | GO:0032433 | filopodium tip(GO:0032433) |
| 0.1 | 0.5 | GO:0035867 | alphav-beta3 integrin-IGF-1-IGF1R complex(GO:0035867) |
| 0.1 | 10.3 | GO:0048770 | melanosome(GO:0042470) pigment granule(GO:0048770) |
| 0.1 | 3.1 | GO:0016328 | lateral plasma membrane(GO:0016328) |
| 0.1 | 0.9 | GO:0042622 | photoreceptor outer segment membrane(GO:0042622) |
| 0.1 | 21.4 | GO:0005788 | endoplasmic reticulum lumen(GO:0005788) |
| 0.1 | 4.2 | GO:0005902 | microvillus(GO:0005902) |
| 0.1 | 1.0 | GO:0034364 | high-density lipoprotein particle(GO:0034364) |
| 0.1 | 3.1 | GO:0031410 | cytoplasmic vesicle(GO:0031410) |
| 0.1 | 1.8 | GO:0098802 | plasma membrane receptor complex(GO:0098802) |
| 0.1 | 4.2 | GO:0030315 | T-tubule(GO:0030315) |
| 0.1 | 1.8 | GO:0005635 | nuclear envelope(GO:0005635) |
| 0.1 | 3.7 | GO:0043195 | terminal bouton(GO:0043195) |
| 0.1 | 4.6 | GO:0031093 | platelet alpha granule lumen(GO:0031093) |
| 0.1 | 0.5 | GO:0019907 | cyclin-dependent protein kinase activating kinase holoenzyme complex(GO:0019907) |
| 0.1 | 9.5 | GO:0048471 | perinuclear region of cytoplasm(GO:0048471) |
| 0.1 | 4.1 | GO:0005791 | rough endoplasmic reticulum(GO:0005791) |
| 0.1 | 2.4 | GO:0005793 | endoplasmic reticulum-Golgi intermediate compartment(GO:0005793) |
| 0.0 | 0.9 | GO:0044295 | axonal growth cone(GO:0044295) |
| 0.0 | 7.7 | GO:0101002 | ficolin-1-rich granule(GO:0101002) ficolin-1-rich granule lumen(GO:1904813) |
| 0.0 | 0.9 | GO:0005942 | phosphatidylinositol 3-kinase complex(GO:0005942) |
| 0.0 | 1.1 | GO:0016235 | aggresome(GO:0016235) |
| 0.0 | 3.2 | GO:0016607 | nuclear speck(GO:0016607) |
| 0.0 | 3.6 | GO:0001650 | fibrillar center(GO:0001650) |
| 0.0 | 1.4 | GO:0005637 | nuclear inner membrane(GO:0005637) |
| 0.0 | 2.1 | GO:0005874 | microtubule(GO:0005874) |
| 0.0 | 2.0 | GO:0031901 | early endosome membrane(GO:0031901) |
| 0.0 | 10.4 | GO:0005764 | lytic vacuole(GO:0000323) lysosome(GO:0005764) |
| 0.0 | 3.7 | GO:0031965 | nuclear membrane(GO:0031965) |
| 0.0 | 0.2 | GO:1904724 | tertiary granule lumen(GO:1904724) |
| 0.0 | 0.1 | GO:0016442 | RISC complex(GO:0016442) RNAi effector complex(GO:0031332) |
Gene overrepresentation in molecular_function category:
| Log-likelihood per target | Total log-likelihood | Term | Description |
|---|---|---|---|
| 3.5 | 10.4 | GO:0102007 | lactonohydrolase activity(GO:0046573) acyl-L-homoserine-lactone lactonohydrolase activity(GO:0102007) |
| 3.1 | 21.6 | GO:0004849 | uridine kinase activity(GO:0004849) |
| 2.3 | 6.9 | GO:0001069 | regulatory region RNA binding(GO:0001069) |
| 2.0 | 8.1 | GO:0038025 | glycoprotein transporter activity(GO:0034437) reelin receptor activity(GO:0038025) |
| 1.7 | 8.4 | GO:0070363 | mitochondrial light strand promoter sense binding(GO:0070363) |
| 1.5 | 10.7 | GO:0050815 | phosphoserine binding(GO:0050815) |
| 1.5 | 5.8 | GO:0032143 | single thymine insertion binding(GO:0032143) |
| 1.4 | 4.2 | GO:0005017 | platelet-derived growth factor-activated receptor activity(GO:0005017) |
| 1.3 | 17.8 | GO:0005172 | vascular endothelial growth factor receptor binding(GO:0005172) |
| 1.2 | 3.7 | GO:0004088 | carbamoyl-phosphate synthase (ammonia) activity(GO:0004087) carbamoyl-phosphate synthase (glutamine-hydrolyzing) activity(GO:0004088) |
| 1.1 | 5.5 | GO:0098639 | collagen binding involved in cell-matrix adhesion(GO:0098639) |
| 1.0 | 10.7 | GO:0002151 | G-quadruplex RNA binding(GO:0002151) RNA strand annealing activity(GO:0033592) |
| 0.8 | 4.1 | GO:0005294 | neutral L-amino acid secondary active transmembrane transporter activity(GO:0005294) |
| 0.7 | 2.8 | GO:0046899 | nucleoside triphosphate adenylate kinase activity(GO:0046899) |
| 0.7 | 10.7 | GO:0005283 | sodium:amino acid symporter activity(GO:0005283) |
| 0.6 | 18.8 | GO:0005540 | hyaluronic acid binding(GO:0005540) |
| 0.6 | 11.1 | GO:0043522 | leucine zipper domain binding(GO:0043522) |
| 0.6 | 3.5 | GO:0023025 | MHC class Ib protein complex binding(GO:0023025) MHC class Ib protein binding, via antigen binding groove(GO:0023030) |
| 0.6 | 10.2 | GO:0017049 | GTP-Rho binding(GO:0017049) |
| 0.5 | 2.7 | GO:0061676 | importin-alpha family protein binding(GO:0061676) |
| 0.5 | 4.6 | GO:0046976 | histone methyltransferase activity (H3-K27 specific)(GO:0046976) |
| 0.4 | 4.5 | GO:0004579 | dolichyl-diphosphooligosaccharide-protein glycotransferase activity(GO:0004579) |
| 0.4 | 15.1 | GO:0005520 | insulin-like growth factor binding(GO:0005520) |
| 0.4 | 12.9 | GO:0071889 | 14-3-3 protein binding(GO:0071889) |
| 0.4 | 1.1 | GO:0016215 | stearoyl-CoA 9-desaturase activity(GO:0004768) acyl-CoA desaturase activity(GO:0016215) |
| 0.4 | 1.4 | GO:0015181 | arginine transmembrane transporter activity(GO:0015181) |
| 0.4 | 6.4 | GO:0048156 | tau protein binding(GO:0048156) |
| 0.3 | 4.0 | GO:0031386 | protein tag(GO:0031386) |
| 0.3 | 1.0 | GO:0034188 | apolipoprotein A-I receptor activity(GO:0034188) phosphatidylserine-translocating ATPase activity(GO:0090556) |
| 0.3 | 5.6 | GO:0004535 | poly(A)-specific ribonuclease activity(GO:0004535) |
| 0.3 | 9.3 | GO:0017075 | syntaxin-1 binding(GO:0017075) |
| 0.3 | 4.5 | GO:0016641 | oxidoreductase activity, acting on the CH-NH2 group of donors, oxygen as acceptor(GO:0016641) |
| 0.3 | 4.2 | GO:0019855 | calcium channel inhibitor activity(GO:0019855) |
| 0.3 | 0.5 | GO:0034648 | histone demethylase activity (H3-dimethyl-K4 specific)(GO:0034648) |
| 0.3 | 6.5 | GO:0017166 | vinculin binding(GO:0017166) |
| 0.3 | 4.1 | GO:0045499 | chemorepellent activity(GO:0045499) |
| 0.2 | 5.7 | GO:0070403 | NAD+ binding(GO:0070403) |
| 0.2 | 10.3 | GO:0019894 | kinesin binding(GO:0019894) |
| 0.2 | 4.6 | GO:0005487 | nucleocytoplasmic transporter activity(GO:0005487) |
| 0.2 | 1.9 | GO:0004305 | ethanolamine kinase activity(GO:0004305) |
| 0.2 | 3.0 | GO:0017017 | MAP kinase tyrosine/serine/threonine phosphatase activity(GO:0017017) |
| 0.2 | 5.4 | GO:0070064 | proline-rich region binding(GO:0070064) |
| 0.2 | 16.8 | GO:0032947 | protein complex scaffold(GO:0032947) |
| 0.2 | 2.5 | GO:0035613 | RNA stem-loop binding(GO:0035613) |
| 0.2 | 8.2 | GO:0033558 | histone deacetylase activity(GO:0004407) protein deacetylase activity(GO:0033558) |
| 0.2 | 4.4 | GO:0005001 | transmembrane receptor protein tyrosine phosphatase activity(GO:0005001) transmembrane receptor protein phosphatase activity(GO:0019198) |
| 0.2 | 1.4 | GO:0070915 | lysophosphatidic acid receptor activity(GO:0070915) |
| 0.2 | 3.7 | GO:0071837 | HMG box domain binding(GO:0071837) |
| 0.2 | 1.5 | GO:0050693 | LBD domain binding(GO:0050693) |
| 0.1 | 8.2 | GO:0070888 | E-box binding(GO:0070888) |
| 0.1 | 4.2 | GO:0070410 | co-SMAD binding(GO:0070410) |
| 0.1 | 3.8 | GO:0051010 | microtubule plus-end binding(GO:0051010) |
| 0.1 | 3.5 | GO:0017056 | structural constituent of nuclear pore(GO:0017056) |
| 0.1 | 1.1 | GO:0060002 | plus-end directed microfilament motor activity(GO:0060002) |
| 0.1 | 1.5 | GO:0004128 | cytochrome-b5 reductase activity, acting on NAD(P)H(GO:0004128) |
| 0.1 | 0.9 | GO:0035005 | 1-phosphatidylinositol-4-phosphate 3-kinase activity(GO:0035005) |
| 0.1 | 17.2 | GO:0005178 | integrin binding(GO:0005178) |
| 0.1 | 1.0 | GO:0070324 | thyroid hormone binding(GO:0070324) |
| 0.1 | 3.9 | GO:0042056 | chemoattractant activity(GO:0042056) |
| 0.1 | 4.0 | GO:0061631 | ubiquitin conjugating enzyme activity(GO:0061631) |
| 0.1 | 2.2 | GO:0070717 | poly-purine tract binding(GO:0070717) |
| 0.1 | 8.5 | GO:0019888 | protein phosphatase regulator activity(GO:0019888) |
| 0.1 | 9.5 | GO:0005179 | hormone activity(GO:0005179) |
| 0.1 | 0.5 | GO:0008109 | N-acetyllactosaminide beta-1,6-N-acetylglucosaminyltransferase activity(GO:0008109) |
| 0.1 | 7.9 | GO:0005070 | SH3/SH2 adaptor activity(GO:0005070) |
| 0.1 | 2.3 | GO:0030742 | GTP-dependent protein binding(GO:0030742) |
| 0.1 | 0.5 | GO:0003828 | alpha-N-acetylneuraminate alpha-2,8-sialyltransferase activity(GO:0003828) |
| 0.1 | 1.2 | GO:0001164 | RNA polymerase I regulatory region DNA binding(GO:0001013) RNA polymerase I regulatory region sequence-specific DNA binding(GO:0001163) RNA polymerase I CORE element sequence-specific DNA binding(GO:0001164) |
| 0.0 | 6.2 | GO:0001078 | transcriptional repressor activity, RNA polymerase II core promoter proximal region sequence-specific binding(GO:0001078) |
| 0.0 | 1.0 | GO:0008483 | transaminase activity(GO:0008483) |
| 0.0 | 0.2 | GO:0008142 | transcription corepressor binding(GO:0001222) oxysterol binding(GO:0008142) |
| 0.0 | 0.9 | GO:0070006 | metalloaminopeptidase activity(GO:0070006) |
| 0.0 | 0.7 | GO:0035497 | cAMP response element binding(GO:0035497) |
| 0.0 | 2.4 | GO:0048306 | calcium-dependent protein binding(GO:0048306) |
| 0.0 | 8.5 | GO:0003714 | transcription corepressor activity(GO:0003714) |
| 0.0 | 1.1 | GO:0018024 | histone-lysine N-methyltransferase activity(GO:0018024) |
| 0.0 | 1.4 | GO:0050681 | androgen receptor binding(GO:0050681) |
| 0.0 | 2.3 | GO:0003707 | steroid hormone receptor activity(GO:0003707) |
| 0.0 | 0.6 | GO:0070577 | lysine-acetylated histone binding(GO:0070577) |
| 0.0 | 0.2 | GO:0004571 | mannosyl-oligosaccharide 1,2-alpha-mannosidase activity(GO:0004571) |
| 0.0 | 2.7 | GO:0008201 | heparin binding(GO:0008201) |
| 0.0 | 1.2 | GO:0004722 | protein serine/threonine phosphatase activity(GO:0004722) |
| 0.0 | 1.7 | GO:0045296 | cadherin binding(GO:0045296) |
| 0.0 | 0.9 | GO:0019905 | syntaxin binding(GO:0019905) |
| 0.0 | 0.2 | GO:0001134 | transcription factor activity, transcription factor recruiting(GO:0001134) |
| 0.0 | 1.8 | GO:0004896 | cytokine receptor activity(GO:0004896) |
| 0.0 | 0.8 | GO:0000979 | RNA polymerase II core promoter sequence-specific DNA binding(GO:0000979) |
| 0.0 | 0.1 | GO:0050072 | m7G(5')pppN diphosphatase activity(GO:0050072) |
Gene overrepresentation in C2:CP category:
| Log-likelihood per target | Total log-likelihood | Term | Description |
|---|---|---|---|
| 0.6 | 18.8 | SA MMP CYTOKINE CONNECTION | Cytokines can induce activation of matrix metalloproteinases, which degrade extracellular matrix. |
| 0.4 | 18.2 | PID VEGFR1 PATHWAY | VEGFR1 specific signals |
| 0.3 | 5.0 | PID INTEGRIN4 PATHWAY | Alpha6 beta4 integrin-ligand interactions |
| 0.3 | 16.1 | PID SYNDECAN 2 PATHWAY | Syndecan-2-mediated signaling events |
| 0.3 | 23.9 | PID MTOR 4PATHWAY | mTOR signaling pathway |
| 0.2 | 4.2 | PID PDGFRA PATHWAY | PDGFR-alpha signaling pathway |
| 0.2 | 14.2 | PID CERAMIDE PATHWAY | Ceramide signaling pathway |
| 0.2 | 11.1 | PID ARF6 TRAFFICKING PATHWAY | Arf6 trafficking events |
| 0.2 | 1.8 | ST IL 13 PATHWAY | Interleukin 13 (IL-13) Pathway |
| 0.2 | 11.8 | PID TGFBR PATHWAY | TGF-beta receptor signaling |
| 0.2 | 7.8 | PID HIF2PATHWAY | HIF-2-alpha transcription factor network |
| 0.2 | 8.1 | PID UPA UPAR PATHWAY | Urokinase-type plasminogen activator (uPA) and uPAR-mediated signaling |
| 0.2 | 9.9 | PID PS1 PATHWAY | Presenilin action in Notch and Wnt signaling |
| 0.2 | 4.7 | PID NECTIN PATHWAY | Nectin adhesion pathway |
| 0.2 | 7.9 | PID CDC42 REG PATHWAY | Regulation of CDC42 activity |
| 0.1 | 1.8 | PID INSULIN GLUCOSE PATHWAY | Insulin-mediated glucose transport |
| 0.1 | 3.0 | PID SYNDECAN 4 PATHWAY | Syndecan-4-mediated signaling events |
| 0.1 | 3.8 | PID NCADHERIN PATHWAY | N-cadherin signaling events |
| 0.1 | 5.2 | PID ATF2 PATHWAY | ATF-2 transcription factor network |
| 0.1 | 4.1 | PID RHOA REG PATHWAY | Regulation of RhoA activity |
| 0.1 | 2.0 | PID RXR VDR PATHWAY | RXR and RAR heterodimerization with other nuclear receptor |
| 0.1 | 1.9 | NABA BASEMENT MEMBRANES | Genes encoding structural components of basement membranes |
| 0.0 | 1.1 | PID NETRIN PATHWAY | Netrin-mediated signaling events |
| 0.0 | 0.9 | PID NEPHRIN NEPH1 PATHWAY | Nephrin/Neph1 signaling in the kidney podocyte |
| 0.0 | 2.1 | PID ILK PATHWAY | Integrin-linked kinase signaling |
| 0.0 | 6.9 | NABA ECM REGULATORS | Genes encoding enzymes and their regulators involved in the remodeling of the extracellular matrix |
| 0.0 | 3.9 | NABA ECM GLYCOPROTEINS | Genes encoding structural ECM glycoproteins |
| 0.0 | 3.2 | NABA ECM AFFILIATED | Genes encoding proteins affiliated structurally or functionally to extracellular matrix proteins |
| 0.0 | 0.7 | PID P38 ALPHA BETA DOWNSTREAM PATHWAY | Signaling mediated by p38-alpha and p38-beta |
| 0.0 | 0.4 | PID FRA PATHWAY | Validated transcriptional targets of AP1 family members Fra1 and Fra2 |
Gene overrepresentation in C2:CP:REACTOME category:
| Log-likelihood per target | Total log-likelihood | Term | Description |
|---|---|---|---|
| 1.0 | 18.8 | REACTOME HYALURONAN UPTAKE AND DEGRADATION | Genes involved in Hyaluronan uptake and degradation |
| 0.7 | 25.4 | REACTOME PYRIMIDINE METABOLISM | Genes involved in Pyrimidine metabolism |
| 0.6 | 19.1 | REACTOME NEPHRIN INTERACTIONS | Genes involved in Nephrin interactions |
| 0.5 | 12.9 | REACTOME CTNNB1 PHOSPHORYLATION CASCADE | Genes involved in Beta-catenin phosphorylation cascade |
| 0.4 | 16.3 | REACTOME AMINO ACID TRANSPORT ACROSS THE PLASMA MEMBRANE | Genes involved in Amino acid transport across the plasma membrane |
| 0.3 | 8.1 | REACTOME SIGNALING BY HIPPO | Genes involved in Signaling by Hippo |
| 0.3 | 4.2 | REACTOME ZINC TRANSPORTERS | Genes involved in Zinc transporters |
| 0.2 | 2.7 | REACTOME INHIBITION OF REPLICATION INITIATION OF DAMAGED DNA BY RB1 E2F1 | Genes involved in Inhibition of replication initiation of damaged DNA by RB1/E2F1 |
| 0.2 | 3.0 | REACTOME SIGNALING BY FGFR3 MUTANTS | Genes involved in Signaling by FGFR3 mutants |
| 0.2 | 5.5 | REACTOME OTHER SEMAPHORIN INTERACTIONS | Genes involved in Other semaphorin interactions |
| 0.2 | 3.2 | REACTOME SEMA3A PLEXIN REPULSION SIGNALING BY INHIBITING INTEGRIN ADHESION | Genes involved in SEMA3A-Plexin repulsion signaling by inhibiting Integrin adhesion |
| 0.2 | 10.1 | REACTOME TRANSPORT TO THE GOLGI AND SUBSEQUENT MODIFICATION | Genes involved in Transport to the Golgi and subsequent modification |
| 0.2 | 5.6 | REACTOME DEADENYLATION OF MRNA | Genes involved in Deadenylation of mRNA |
| 0.2 | 18.0 | REACTOME CELL JUNCTION ORGANIZATION | Genes involved in Cell junction organization |
| 0.1 | 3.6 | REACTOME ENDOSOMAL SORTING COMPLEX REQUIRED FOR TRANSPORT ESCRT | Genes involved in Endosomal Sorting Complex Required For Transport (ESCRT) |
| 0.1 | 3.3 | REACTOME P130CAS LINKAGE TO MAPK SIGNALING FOR INTEGRINS | Genes involved in p130Cas linkage to MAPK signaling for integrins |
| 0.1 | 6.4 | REACTOME G1 PHASE | Genes involved in G1 Phase |
| 0.1 | 1.0 | REACTOME ACTIVATED POINT MUTANTS OF FGFR2 | Genes involved in Activated point mutants of FGFR2 |
| 0.1 | 1.9 | REACTOME SYNTHESIS OF PE | Genes involved in Synthesis of PE |
| 0.1 | 8.3 | REACTOME ANTIVIRAL MECHANISM BY IFN STIMULATED GENES | Genes involved in Antiviral mechanism by IFN-stimulated genes |
| 0.1 | 1.4 | REACTOME P2Y RECEPTORS | Genes involved in P2Y receptors |
| 0.1 | 4.1 | REACTOME NRAGE SIGNALS DEATH THROUGH JNK | Genes involved in NRAGE signals death through JNK |
| 0.1 | 1.6 | REACTOME DESTABILIZATION OF MRNA BY KSRP | Genes involved in Destabilization of mRNA by KSRP |
| 0.1 | 2.8 | REACTOME DOWNREGULATION OF SMAD2 3 SMAD4 TRANSCRIPTIONAL ACTIVITY | Genes involved in Downregulation of SMAD2/3:SMAD4 transcriptional activity |
| 0.1 | 1.0 | REACTOME SYNTHESIS OF SUBSTRATES IN N GLYCAN BIOSYTHESIS | Genes involved in Synthesis of substrates in N-glycan biosythesis |
| 0.1 | 8.4 | REACTOME RNA POL I RNA POL III AND MITOCHONDRIAL TRANSCRIPTION | Genes involved in RNA Polymerase I, RNA Polymerase III, and Mitochondrial Transcription |
| 0.0 | 0.7 | REACTOME ACTIVATION OF CHAPERONE GENES BY ATF6 ALPHA | Genes involved in Activation of Chaperone Genes by ATF6-alpha |
| 0.0 | 3.8 | REACTOME MITOTIC PROMETAPHASE | Genes involved in Mitotic Prometaphase |
| 0.0 | 5.4 | REACTOME SIGNALING BY RHO GTPASES | Genes involved in Signaling by Rho GTPases |
| 0.0 | 1.0 | REACTOME HDL MEDIATED LIPID TRANSPORT | Genes involved in HDL-mediated lipid transport |
| 0.0 | 2.2 | REACTOME COLLAGEN FORMATION | Genes involved in Collagen formation |
| 0.0 | 4.6 | REACTOME RESPONSE TO ELEVATED PLATELET CYTOSOLIC CA2 | Genes involved in Response to elevated platelet cytosolic Ca2+ |
| 0.0 | 2.3 | REACTOME GOLGI ASSOCIATED VESICLE BIOGENESIS | Genes involved in Golgi Associated Vesicle Biogenesis |
| 0.0 | 1.1 | REACTOME NETRIN1 SIGNALING | Genes involved in Netrin-1 signaling |
| 0.0 | 0.4 | REACTOME TRANSCRIPTIONAL ACTIVITY OF SMAD2 SMAD3 SMAD4 HETEROTRIMER | Genes involved in Transcriptional activity of SMAD2/SMAD3:SMAD4 heterotrimer |
| 0.0 | 2.5 | REACTOME DOWNSTREAM SIGNAL TRANSDUCTION | Genes involved in Downstream signal transduction |
| 0.0 | 1.7 | REACTOME NUCLEAR RECEPTOR TRANSCRIPTION PATHWAY | Genes involved in Nuclear Receptor transcription pathway |
| 0.0 | 0.4 | REACTOME CREB PHOSPHORYLATION THROUGH THE ACTIVATION OF RAS | Genes involved in CREB phosphorylation through the activation of Ras |
| 0.0 | 0.2 | REACTOME CALNEXIN CALRETICULIN CYCLE | Genes involved in Calnexin/calreticulin cycle |
| 0.0 | 1.9 | REACTOME FACTORS INVOLVED IN MEGAKARYOCYTE DEVELOPMENT AND PLATELET PRODUCTION | Genes involved in Factors involved in megakaryocyte development and platelet production |
| 0.0 | 0.4 | REACTOME EXTRACELLULAR MATRIX ORGANIZATION | Genes involved in Extracellular matrix organization |
| 0.0 | 0.5 | REACTOME NCAM1 INTERACTIONS | Genes involved in NCAM1 interactions |