Project
GNF SymAtlas + NCI-60 cancer cell lines, comparison of cancers vs non-cancers, human (Su, 2004; Ross, 2000)
Navigation
Downloads
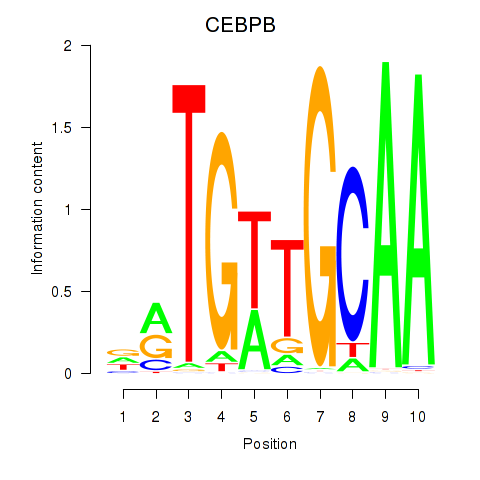
Results for CEBPB
Z-value: 0.16
Motif logo
Transcription factors associated with CEBPB
| Gene Symbol | Gene ID | Gene Info |
|---|---|---|
|
CEBPB
|
ENSG00000172216.4 | CCAAT enhancer binding protein beta |
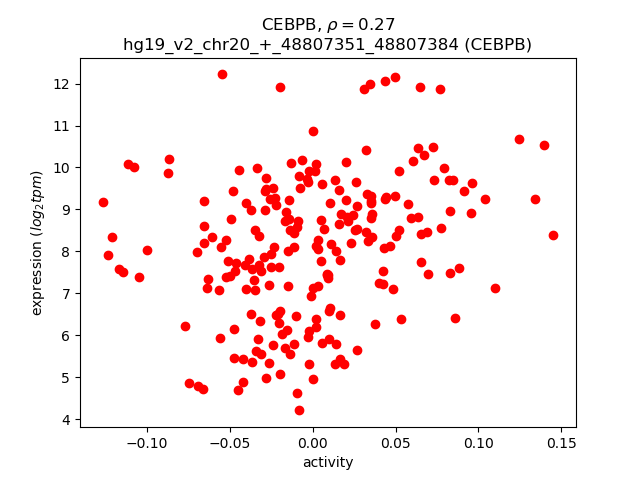
Activity-expression correlation:
| Gene | Promoter | Pearson corr. coef. | P-value | Plot |
|---|---|---|---|---|
| CEBPB | hg19_v2_chr20_+_48807351_48807384 | 0.27 | 4.4e-05 | Click! |
Activity profile of CEBPB motif
Sorted Z-values of CEBPB motif
| Promoter | Log-likelihood | Transcript | Gene | Gene Info |
|---|---|---|---|---|
| chr4_-_134070250 | 16.76 |
ENST00000505289.1
ENST00000509715.1 |
RP11-9G1.3
|
RP11-9G1.3 |
| chr20_+_361261 | 14.34 |
ENST00000217233.3
|
TRIB3
|
tribbles pseudokinase 3 |
| chr2_-_216300784 | 13.84 |
ENST00000421182.1
ENST00000432072.2 ENST00000323926.6 ENST00000336916.4 ENST00000357867.4 ENST00000359671.1 ENST00000346544.3 ENST00000345488.5 ENST00000357009.2 ENST00000446046.1 ENST00000356005.4 ENST00000443816.1 ENST00000426059.1 ENST00000354785.4 |
FN1
|
fibronectin 1 |
| chr3_+_157154578 | 11.88 |
ENST00000295927.3
|
PTX3
|
pentraxin 3, long |
| chr11_+_92085707 | 11.31 |
ENST00000525166.1
|
FAT3
|
FAT atypical cadherin 3 |
| chr11_+_92085262 | 9.86 |
ENST00000298047.6
ENST00000409404.2 ENST00000541502.1 |
FAT3
|
FAT atypical cadherin 3 |
| chr12_+_57624085 | 9.55 |
ENST00000553474.1
|
SHMT2
|
serine hydroxymethyltransferase 2 (mitochondrial) |
| chr17_-_64216748 | 8.96 |
ENST00000585162.1
|
APOH
|
apolipoprotein H (beta-2-glycoprotein I) |
| chr4_-_139163491 | 8.45 |
ENST00000280612.5
|
SLC7A11
|
solute carrier family 7 (anionic amino acid transporter light chain, xc- system), member 11 |
| chr12_+_57623477 | 8.28 |
ENST00000557487.1
ENST00000555634.1 ENST00000556689.1 |
SHMT2
|
serine hydroxymethyltransferase 2 (mitochondrial) |
| chr12_+_57623869 | 8.26 |
ENST00000414700.3
ENST00000557703.1 |
SHMT2
|
serine hydroxymethyltransferase 2 (mitochondrial) |
| chr5_-_172756506 | 7.53 |
ENST00000265087.4
|
STC2
|
stanniocalcin 2 |
| chr11_-_102668879 | 7.46 |
ENST00000315274.6
|
MMP1
|
matrix metallopeptidase 1 (interstitial collagenase) |
| chr12_+_57624119 | 7.43 |
ENST00000555773.1
ENST00000554975.1 ENST00000449049.3 ENST00000393827.4 |
SHMT2
|
serine hydroxymethyltransferase 2 (mitochondrial) |
| chr4_-_155533787 | 7.32 |
ENST00000407946.1
ENST00000405164.1 ENST00000336098.3 ENST00000393846.2 ENST00000404648.3 ENST00000443553.1 |
FGG
|
fibrinogen gamma chain |
| chr1_-_36948879 | 7.31 |
ENST00000373106.1
ENST00000373104.1 ENST00000373103.1 |
CSF3R
|
colony stimulating factor 3 receptor (granulocyte) |
| chr17_+_1665345 | 7.25 |
ENST00000576406.1
ENST00000571149.1 |
SERPINF1
|
serpin peptidase inhibitor, clade F (alpha-2 antiplasmin, pigment epithelium derived factor), member 1 |
| chr20_+_56136136 | 7.11 |
ENST00000319441.4
ENST00000543666.1 |
PCK1
|
phosphoenolpyruvate carboxykinase 1 (soluble) |
| chr19_-_47288162 | 7.10 |
ENST00000594991.1
|
SLC1A5
|
solute carrier family 1 (neutral amino acid transporter), member 5 |
| chr2_+_211421262 | 7.00 |
ENST00000233072.5
|
CPS1
|
carbamoyl-phosphate synthase 1, mitochondrial |
| chr19_-_47287990 | 6.99 |
ENST00000593713.1
ENST00000598022.1 ENST00000434726.2 |
SLC1A5
|
solute carrier family 1 (neutral amino acid transporter), member 5 |
| chr14_-_100841670 | 6.81 |
ENST00000557297.1
ENST00000555813.1 ENST00000557135.1 ENST00000556698.1 ENST00000554509.1 ENST00000555410.1 |
WARS
|
tryptophanyl-tRNA synthetase |
| chr3_-_138763734 | 6.33 |
ENST00000413199.1
ENST00000502927.2 |
PRR23C
|
proline rich 23C |
| chr1_-_36945097 | 6.14 |
ENST00000331941.5
ENST00000418048.2 ENST00000338937.5 ENST00000440588.2 |
CSF3R
|
colony stimulating factor 3 receptor (granulocyte) |
| chr1_+_212782012 | 6.10 |
ENST00000341491.4
ENST00000366985.1 |
ATF3
|
activating transcription factor 3 |
| chr6_+_31895467 | 6.04 |
ENST00000556679.1
ENST00000456570.1 |
CFB
CFB
|
complement factor B Complement factor B; Uncharacterized protein; cDNA FLJ55673, highly similar to Complement factor B |
| chr1_-_204380919 | 5.94 |
ENST00000367188.4
|
PPP1R15B
|
protein phosphatase 1, regulatory subunit 15B |
| chr5_+_33441053 | 5.51 |
ENST00000541634.1
ENST00000455217.2 ENST00000414361.2 |
TARS
|
threonyl-tRNA synthetase |
| chr5_+_33440802 | 5.45 |
ENST00000502553.1
ENST00000514259.1 ENST00000265112.3 |
TARS
|
threonyl-tRNA synthetase |
| chr14_-_100841930 | 5.21 |
ENST00000555031.1
ENST00000553395.1 ENST00000553545.1 ENST00000344102.5 ENST00000556338.1 ENST00000392882.2 ENST00000553934.1 |
WARS
|
tryptophanyl-tRNA synthetase |
| chr15_+_41245160 | 5.20 |
ENST00000444189.2
ENST00000446533.3 |
CHAC1
|
ChaC, cation transport regulator homolog 1 (E. coli) |
| chr22_+_35776828 | 5.12 |
ENST00000216117.8
|
HMOX1
|
heme oxygenase (decycling) 1 |
| chr3_+_186435137 | 4.73 |
ENST00000447445.1
|
KNG1
|
kininogen 1 |
| chr3_-_48057890 | 4.68 |
ENST00000434267.1
|
MAP4
|
microtubule-associated protein 4 |
| chr21_-_44495964 | 4.66 |
ENST00000398168.1
ENST00000398165.3 |
CBS
|
cystathionine-beta-synthase |
| chr5_+_150400124 | 4.65 |
ENST00000388825.4
ENST00000521650.1 ENST00000517973.1 |
GPX3
|
glutathione peroxidase 3 (plasma) |
| chr16_+_72088376 | 4.62 |
ENST00000570083.1
ENST00000355906.5 ENST00000398131.2 ENST00000569639.1 ENST00000564499.1 ENST00000357763.4 ENST00000562526.1 ENST00000565574.1 ENST00000568417.2 ENST00000356967.5 |
HP
HPR
|
haptoglobin haptoglobin-related protein |
| chr12_+_57849048 | 4.57 |
ENST00000266646.2
|
INHBE
|
inhibin, beta E |
| chr16_-_28550348 | 4.56 |
ENST00000324873.6
|
NUPR1
|
nuclear protein, transcriptional regulator, 1 |
| chr21_-_44495919 | 4.46 |
ENST00000398158.1
|
CBS
|
cystathionine-beta-synthase |
| chr3_+_186435065 | 4.33 |
ENST00000287611.2
ENST00000265023.4 |
KNG1
|
kininogen 1 |
| chr20_+_36974759 | 4.14 |
ENST00000217407.2
|
LBP
|
lipopolysaccharide binding protein |
| chr17_+_1665253 | 4.12 |
ENST00000254722.4
|
SERPINF1
|
serpin peptidase inhibitor, clade F (alpha-2 antiplasmin, pigment epithelium derived factor), member 1 |
| chr2_-_160654745 | 4.11 |
ENST00000259053.4
ENST00000429078.2 |
CD302
|
CD302 molecule |
| chr12_-_96390063 | 4.04 |
ENST00000541929.1
|
HAL
|
histidine ammonia-lyase |
| chr12_-_57914275 | 4.02 |
ENST00000547303.1
ENST00000552740.1 ENST00000547526.1 ENST00000551116.1 ENST00000346473.3 |
DDIT3
|
DNA-damage-inducible transcript 3 |
| chr16_-_28550320 | 3.90 |
ENST00000395641.2
|
NUPR1
|
nuclear protein, transcriptional regulator, 1 |
| chr12_-_54691668 | 3.81 |
ENST00000553198.1
|
NFE2
|
nuclear factor, erythroid 2 |
| chr5_+_150020214 | 3.81 |
ENST00000307662.4
|
SYNPO
|
synaptopodin |
| chr5_-_137878887 | 3.81 |
ENST00000507939.1
ENST00000572514.1 ENST00000499810.2 ENST00000360541.5 |
ETF1
|
eukaryotic translation termination factor 1 |
| chr6_+_31895480 | 3.79 |
ENST00000418949.2
ENST00000383177.3 ENST00000477310.1 |
C2
CFB
|
complement component 2 Complement factor B; Uncharacterized protein; cDNA FLJ55673, highly similar to Complement factor B |
| chrX_+_24072833 | 3.67 |
ENST00000253039.4
|
EIF2S3
|
eukaryotic translation initiation factor 2, subunit 3 gamma, 52kDa |
| chr1_+_99127225 | 3.60 |
ENST00000370189.5
ENST00000529992.1 |
SNX7
|
sorting nexin 7 |
| chr6_+_30687978 | 3.52 |
ENST00000327892.8
ENST00000435534.1 |
TUBB
|
tubulin, beta class I |
| chr9_+_137218362 | 3.40 |
ENST00000481739.1
|
RXRA
|
retinoid X receptor, alpha |
| chr11_+_118955583 | 3.20 |
ENST00000278715.3
ENST00000536813.1 ENST00000537841.1 ENST00000542729.1 ENST00000546302.1 ENST00000442944.2 ENST00000544387.1 ENST00000543090.1 |
HMBS
|
hydroxymethylbilane synthase |
| chr11_-_3078616 | 2.87 |
ENST00000401769.3
ENST00000278224.9 ENST00000397114.3 ENST00000380525.4 |
CARS
|
cysteinyl-tRNA synthetase |
| chr17_-_79895097 | 2.86 |
ENST00000402252.2
ENST00000583564.1 ENST00000585244.1 ENST00000337943.5 ENST00000579698.1 |
PYCR1
|
pyrroline-5-carboxylate reductase 1 |
| chr3_+_12392971 | 2.82 |
ENST00000287820.6
|
PPARG
|
peroxisome proliferator-activated receptor gamma |
| chr12_+_6644443 | 2.71 |
ENST00000396858.1
|
GAPDH
|
glyceraldehyde-3-phosphate dehydrogenase |
| chr17_-_79895154 | 2.61 |
ENST00000405481.4
ENST00000585215.1 ENST00000577624.1 ENST00000403172.4 |
PYCR1
|
pyrroline-5-carboxylate reductase 1 |
| chr19_+_33865218 | 2.58 |
ENST00000585933.2
|
CEBPG
|
CCAAT/enhancer binding protein (C/EBP), gamma |
| chr2_+_121010413 | 2.54 |
ENST00000404963.3
|
RALB
|
v-ral simian leukemia viral oncogene homolog B |
| chr4_-_70725856 | 2.51 |
ENST00000226444.3
|
SULT1E1
|
sulfotransferase family 1E, estrogen-preferring, member 1 |
| chr17_-_46703826 | 2.49 |
ENST00000550387.1
ENST00000311177.5 |
HOXB9
|
homeobox B9 |
| chr3_+_42897512 | 2.48 |
ENST00000493193.1
|
ACKR2
|
atypical chemokine receptor 2 |
| chr1_-_149908217 | 2.46 |
ENST00000369140.3
|
MTMR11
|
myotubularin related protein 11 |
| chr6_+_31895254 | 2.44 |
ENST00000299367.5
ENST00000442278.2 |
C2
|
complement component 2 |
| chr7_-_76829125 | 2.44 |
ENST00000248598.5
|
FGL2
|
fibrinogen-like 2 |
| chr11_-_3078838 | 2.44 |
ENST00000397111.5
|
CARS
|
cysteinyl-tRNA synthetase |
| chr5_-_35230434 | 2.40 |
ENST00000504500.1
|
PRLR
|
prolactin receptor |
| chr14_-_92413727 | 2.37 |
ENST00000267620.10
|
FBLN5
|
fibulin 5 |
| chr15_+_96869165 | 2.34 |
ENST00000421109.2
|
NR2F2
|
nuclear receptor subfamily 2, group F, member 2 |
| chr12_+_56390964 | 2.33 |
ENST00000356124.4
ENST00000266971.3 ENST00000394115.2 ENST00000547586.1 ENST00000552258.1 ENST00000548274.1 ENST00000546833.1 |
SUOX
|
sulfite oxidase |
| chr9_+_2621798 | 2.30 |
ENST00000382100.3
|
VLDLR
|
very low density lipoprotein receptor |
| chr7_-_50860565 | 2.29 |
ENST00000403097.1
|
GRB10
|
growth factor receptor-bound protein 10 |
| chr12_-_6451235 | 2.25 |
ENST00000440083.2
ENST00000162749.2 |
TNFRSF1A
|
tumor necrosis factor receptor superfamily, member 1A |
| chr11_+_62649158 | 2.24 |
ENST00000539891.1
ENST00000536981.1 |
SLC3A2
|
solute carrier family 3 (amino acid transporter heavy chain), member 2 |
| chr2_-_217559517 | 2.21 |
ENST00000449583.1
|
IGFBP5
|
insulin-like growth factor binding protein 5 |
| chr5_-_141704566 | 2.18 |
ENST00000344120.4
ENST00000434127.2 |
SPRY4
|
sprouty homolog 4 (Drosophila) |
| chr12_-_96390108 | 2.16 |
ENST00000538703.1
ENST00000261208.3 |
HAL
|
histidine ammonia-lyase |
| chr1_-_220220000 | 2.12 |
ENST00000366923.3
|
EPRS
|
glutamyl-prolyl-tRNA synthetase |
| chr12_-_25102252 | 2.10 |
ENST00000261192.7
|
BCAT1
|
branched chain amino-acid transaminase 1, cytosolic |
| chr20_-_32700075 | 2.10 |
ENST00000374980.2
|
EIF2S2
|
eukaryotic translation initiation factor 2, subunit 2 beta, 38kDa |
| chr3_-_49722523 | 2.10 |
ENST00000448220.1
|
MST1
|
macrophage stimulating 1 (hepatocyte growth factor-like) |
| chr2_+_113885138 | 2.10 |
ENST00000409930.3
|
IL1RN
|
interleukin 1 receptor antagonist |
| chr12_-_25101920 | 2.06 |
ENST00000539780.1
ENST00000546285.1 ENST00000342945.5 |
BCAT1
|
branched chain amino-acid transaminase 1, cytosolic |
| chr2_+_28618532 | 2.06 |
ENST00000545753.1
|
FOSL2
|
FOS-like antigen 2 |
| chr5_+_125758865 | 2.06 |
ENST00000542322.1
ENST00000544396.1 |
GRAMD3
|
GRAM domain containing 3 |
| chr5_+_125758813 | 2.04 |
ENST00000285689.3
ENST00000515200.1 |
GRAMD3
|
GRAM domain containing 3 |
| chr5_+_38846101 | 2.02 |
ENST00000274276.3
|
OSMR
|
oncostatin M receptor |
| chr14_-_92413353 | 2.00 |
ENST00000556154.1
|
FBLN5
|
fibulin 5 |
| chr1_-_149908710 | 2.00 |
ENST00000439741.2
ENST00000361405.6 ENST00000406732.3 |
MTMR11
|
myotubularin related protein 11 |
| chr7_+_28725585 | 2.00 |
ENST00000396298.2
|
CREB5
|
cAMP responsive element binding protein 5 |
| chr5_-_35230649 | 1.96 |
ENST00000382002.5
|
PRLR
|
prolactin receptor |
| chr16_-_57809015 | 1.90 |
ENST00000540079.2
ENST00000569222.1 |
KIFC3
|
kinesin family member C3 |
| chr1_+_221051699 | 1.90 |
ENST00000366903.6
|
HLX
|
H2.0-like homeobox |
| chr2_+_5832799 | 1.87 |
ENST00000322002.3
|
SOX11
|
SRY (sex determining region Y)-box 11 |
| chr10_+_95848824 | 1.82 |
ENST00000371385.3
ENST00000371375.1 |
PLCE1
|
phospholipase C, epsilon 1 |
| chr19_-_54824344 | 1.81 |
ENST00000346508.3
ENST00000446712.3 ENST00000432233.3 ENST00000301219.3 |
LILRA5
|
leukocyte immunoglobulin-like receptor, subfamily A (with TM domain), member 5 |
| chr1_-_220219775 | 1.74 |
ENST00000609181.1
|
EPRS
|
glutamyl-prolyl-tRNA synthetase |
| chrX_-_109683446 | 1.69 |
ENST00000372057.1
|
AMMECR1
|
Alport syndrome, mental retardation, midface hypoplasia and elliptocytosis chromosomal region gene 1 |
| chr19_-_11347173 | 1.69 |
ENST00000587656.1
|
DOCK6
|
dedicator of cytokinesis 6 |
| chr3_+_138067666 | 1.66 |
ENST00000475711.1
ENST00000464896.1 |
MRAS
|
muscle RAS oncogene homolog |
| chr12_+_123868320 | 1.62 |
ENST00000402868.3
ENST00000330479.4 |
SETD8
|
SET domain containing (lysine methyltransferase) 8 |
| chr6_-_55739542 | 1.58 |
ENST00000446683.2
|
BMP5
|
bone morphogenetic protein 5 |
| chr11_-_119999611 | 1.57 |
ENST00000529044.1
|
TRIM29
|
tripartite motif containing 29 |
| chr11_+_47279504 | 1.56 |
ENST00000441012.2
ENST00000437276.1 ENST00000436029.1 ENST00000467728.1 ENST00000405853.3 |
NR1H3
|
nuclear receptor subfamily 1, group H, member 3 |
| chrX_-_106243451 | 1.51 |
ENST00000355610.4
ENST00000535534.1 |
MORC4
|
MORC family CW-type zinc finger 4 |
| chr11_-_119999539 | 1.50 |
ENST00000541857.1
|
TRIM29
|
tripartite motif containing 29 |
| chr12_+_21207503 | 1.50 |
ENST00000545916.1
|
SLCO1B7
|
solute carrier organic anion transporter family, member 1B7 (non-functional) |
| chr16_+_58426296 | 1.50 |
ENST00000426538.2
ENST00000328514.7 ENST00000318129.5 |
GINS3
|
GINS complex subunit 3 (Psf3 homolog) |
| chr18_+_61420169 | 1.47 |
ENST00000425392.1
ENST00000336429.2 |
SERPINB7
|
serpin peptidase inhibitor, clade B (ovalbumin), member 7 |
| chr12_-_6451186 | 1.46 |
ENST00000540022.1
ENST00000536194.1 |
TNFRSF1A
|
tumor necrosis factor receptor superfamily, member 1A |
| chr1_-_221915418 | 1.45 |
ENST00000323825.3
ENST00000366899.3 |
DUSP10
|
dual specificity phosphatase 10 |
| chr12_-_56236690 | 1.43 |
ENST00000322569.4
|
MMP19
|
matrix metallopeptidase 19 |
| chr8_-_21966893 | 1.40 |
ENST00000522405.1
ENST00000522379.1 ENST00000309188.6 ENST00000521807.2 |
NUDT18
|
nudix (nucleoside diphosphate linked moiety X)-type motif 18 |
| chr7_-_27224842 | 1.40 |
ENST00000517402.1
|
HOXA11
|
homeobox A11 |
| chr12_-_123187890 | 1.39 |
ENST00000328880.5
|
HCAR2
|
hydroxycarboxylic acid receptor 2 |
| chr16_-_4323015 | 1.33 |
ENST00000204517.6
|
TFAP4
|
transcription factor AP-4 (activating enhancer binding protein 4) |
| chrX_-_80457385 | 1.30 |
ENST00000451455.1
ENST00000436386.1 ENST00000358130.2 |
HMGN5
|
high mobility group nucleosome binding domain 5 |
| chr1_+_150954493 | 1.29 |
ENST00000368947.4
|
ANXA9
|
annexin A9 |
| chr4_+_77870856 | 1.29 |
ENST00000264893.6
ENST00000502584.1 ENST00000510641.1 |
SEPT11
|
septin 11 |
| chr11_-_128737163 | 1.28 |
ENST00000324003.3
ENST00000392665.2 |
KCNJ1
|
potassium inwardly-rectifying channel, subfamily J, member 1 |
| chr11_-_128737259 | 1.28 |
ENST00000440599.2
ENST00000392666.1 ENST00000324036.3 |
KCNJ1
|
potassium inwardly-rectifying channel, subfamily J, member 1 |
| chr5_-_35230771 | 1.27 |
ENST00000342362.5
|
PRLR
|
prolactin receptor |
| chr5_+_52083730 | 1.22 |
ENST00000282588.6
ENST00000274311.2 |
ITGA1
PELO
|
integrin, alpha 1 pelota homolog (Drosophila) |
| chr1_+_53480598 | 1.22 |
ENST00000430330.2
ENST00000408941.3 ENST00000478274.2 ENST00000484100.1 ENST00000435345.2 ENST00000488965.1 |
SCP2
|
sterol carrier protein 2 |
| chrX_+_13587712 | 1.22 |
ENST00000361306.1
ENST00000380602.3 |
EGFL6
|
EGF-like-domain, multiple 6 |
| chr7_-_27224795 | 1.22 |
ENST00000006015.3
|
HOXA11
|
homeobox A11 |
| chr1_-_110155671 | 1.21 |
ENST00000351050.3
|
GNAT2
|
guanine nucleotide binding protein (G protein), alpha transducing activity polypeptide 2 |
| chrX_-_133792480 | 1.17 |
ENST00000359237.4
|
PLAC1
|
placenta-specific 1 |
| chr15_-_88799948 | 1.16 |
ENST00000394480.2
|
NTRK3
|
neurotrophic tyrosine kinase, receptor, type 3 |
| chr1_-_23857698 | 1.15 |
ENST00000361729.2
|
E2F2
|
E2F transcription factor 2 |
| chr7_-_115670792 | 1.12 |
ENST00000265440.7
ENST00000393485.1 |
TFEC
|
transcription factor EC |
| chr17_-_10372875 | 1.07 |
ENST00000255381.2
|
MYH4
|
myosin, heavy chain 4, skeletal muscle |
| chrX_-_55024967 | 1.05 |
ENST00000545676.1
|
PFKFB1
|
6-phosphofructo-2-kinase/fructose-2,6-biphosphatase 1 |
| chr15_-_88799384 | 1.05 |
ENST00000540489.2
ENST00000557856.1 ENST00000558676.1 |
NTRK3
|
neurotrophic tyrosine kinase, receptor, type 3 |
| chr4_-_164534657 | 1.04 |
ENST00000339875.5
|
MARCH1
|
membrane-associated ring finger (C3HC4) 1, E3 ubiquitin protein ligase |
| chr5_-_158757895 | 1.01 |
ENST00000231228.2
|
IL12B
|
interleukin 12B (natural killer cell stimulatory factor 2, cytotoxic lymphocyte maturation factor 2, p40) |
| chrX_-_151619746 | 1.00 |
ENST00000370314.4
|
GABRA3
|
gamma-aminobutyric acid (GABA) A receptor, alpha 3 |
| chr1_-_44497118 | 0.98 |
ENST00000537678.1
ENST00000466926.1 |
SLC6A9
|
solute carrier family 6 (neurotransmitter transporter, glycine), member 9 |
| chr5_-_58652788 | 0.97 |
ENST00000405755.2
|
PDE4D
|
phosphodiesterase 4D, cAMP-specific |
| chr7_-_56101826 | 0.97 |
ENST00000421626.1
|
PSPH
|
phosphoserine phosphatase |
| chr7_-_115670804 | 0.97 |
ENST00000320239.7
|
TFEC
|
transcription factor EC |
| chr18_+_29027696 | 0.96 |
ENST00000257189.4
|
DSG3
|
desmoglein 3 |
| chr4_-_38858428 | 0.96 |
ENST00000436693.2
ENST00000508254.1 ENST00000514655.1 ENST00000506146.1 |
TLR6
TLR1
|
toll-like receptor 6 toll-like receptor 1 |
| chr5_+_169780485 | 0.91 |
ENST00000377360.4
|
KCNIP1
|
Kv channel interacting protein 1 |
| chr1_-_44497024 | 0.89 |
ENST00000372306.3
ENST00000372310.3 ENST00000475075.2 |
SLC6A9
|
solute carrier family 6 (neurotransmitter transporter, glycine), member 9 |
| chr3_+_138067521 | 0.88 |
ENST00000494949.1
|
MRAS
|
muscle RAS oncogene homolog |
| chr12_-_123201337 | 0.86 |
ENST00000528880.2
|
HCAR3
|
hydroxycarboxylic acid receptor 3 |
| chr19_+_11350278 | 0.83 |
ENST00000252453.8
|
C19orf80
|
chromosome 19 open reading frame 80 |
| chr3_+_138067314 | 0.82 |
ENST00000423968.2
|
MRAS
|
muscle RAS oncogene homolog |
| chr17_-_41277467 | 0.82 |
ENST00000494123.1
ENST00000346315.3 ENST00000309486.4 ENST00000468300.1 ENST00000354071.3 ENST00000352993.3 ENST00000471181.2 |
BRCA1
|
breast cancer 1, early onset |
| chr19_-_51869592 | 0.79 |
ENST00000596253.1
ENST00000309244.4 |
ETFB
|
electron-transfer-flavoprotein, beta polypeptide |
| chr9_-_95055956 | 0.78 |
ENST00000375629.3
ENST00000447699.2 ENST00000375643.3 ENST00000395554.3 |
IARS
|
isoleucyl-tRNA synthetase |
| chr2_-_219031709 | 0.78 |
ENST00000295683.2
|
CXCR1
|
chemokine (C-X-C motif) receptor 1 |
| chr1_+_153232160 | 0.75 |
ENST00000368742.3
|
LOR
|
loricrin |
| chrX_+_99839799 | 0.73 |
ENST00000373031.4
|
TNMD
|
tenomodulin |
| chr15_-_88799661 | 0.69 |
ENST00000360948.2
ENST00000357724.2 ENST00000355254.2 ENST00000317501.3 |
NTRK3
|
neurotrophic tyrosine kinase, receptor, type 3 |
| chr10_+_101542462 | 0.68 |
ENST00000370449.4
ENST00000370434.1 |
ABCC2
|
ATP-binding cassette, sub-family C (CFTR/MRP), member 2 |
| chr16_+_56970567 | 0.66 |
ENST00000563911.1
|
HERPUD1
|
homocysteine-inducible, endoplasmic reticulum stress-inducible, ubiquitin-like domain member 1 |
| chrX_-_32173579 | 0.64 |
ENST00000359836.1
ENST00000343523.2 ENST00000378707.3 ENST00000541735.1 ENST00000474231.1 |
DMD
|
dystrophin |
| chr8_-_38008783 | 0.64 |
ENST00000276449.4
|
STAR
|
steroidogenic acute regulatory protein |
| chr6_+_31939608 | 0.64 |
ENST00000375331.2
ENST00000375333.2 |
STK19
|
serine/threonine kinase 19 |
| chr3_+_6902794 | 0.63 |
ENST00000357716.4
ENST00000486284.1 ENST00000389336.4 ENST00000403881.1 ENST00000402647.2 |
GRM7
|
glutamate receptor, metabotropic 7 |
| chr1_+_25757376 | 0.62 |
ENST00000399766.3
ENST00000399763.3 ENST00000374343.4 |
TMEM57
|
transmembrane protein 57 |
| chr22_-_39640756 | 0.57 |
ENST00000331163.6
|
PDGFB
|
platelet-derived growth factor beta polypeptide |
| chr2_+_46769798 | 0.49 |
ENST00000238738.4
|
RHOQ
|
ras homolog family member Q |
| chr2_+_169926047 | 0.44 |
ENST00000428522.1
ENST00000450153.1 ENST00000421653.1 |
DHRS9
|
dehydrogenase/reductase (SDR family) member 9 |
| chr13_-_99667960 | 0.43 |
ENST00000448493.2
|
DOCK9
|
dedicator of cytokinesis 9 |
| chr3_-_99833333 | 0.43 |
ENST00000354552.3
ENST00000331335.5 ENST00000398326.2 |
FILIP1L
|
filamin A interacting protein 1-like |
| chr17_-_41277370 | 0.40 |
ENST00000476777.1
ENST00000491747.2 ENST00000478531.1 ENST00000477152.1 ENST00000357654.3 ENST00000493795.1 ENST00000493919.1 |
BRCA1
|
breast cancer 1, early onset |
| chr16_+_3162557 | 0.37 |
ENST00000382192.3
ENST00000219091.4 ENST00000444510.2 ENST00000414351.1 |
ZNF205
|
zinc finger protein 205 |
| chrX_+_115567767 | 0.37 |
ENST00000371900.4
|
SLC6A14
|
solute carrier family 6 (amino acid transporter), member 14 |
| chr19_-_44124019 | 0.36 |
ENST00000300811.3
|
ZNF428
|
zinc finger protein 428 |
| chr18_+_46065393 | 0.35 |
ENST00000256413.3
|
CTIF
|
CBP80/20-dependent translation initiation factor |
| chr16_+_56965960 | 0.33 |
ENST00000439977.2
ENST00000344114.4 ENST00000300302.5 ENST00000379792.2 |
HERPUD1
|
homocysteine-inducible, endoplasmic reticulum stress-inducible, ubiquitin-like domain member 1 |
| chr17_-_76836729 | 0.32 |
ENST00000587783.1
ENST00000542802.3 ENST00000586531.1 ENST00000589424.1 ENST00000590546.2 |
USP36
|
ubiquitin specific peptidase 36 |
| chr11_-_12030905 | 0.32 |
ENST00000326932.4
|
DKK3
|
dickkopf WNT signaling pathway inhibitor 3 |
| chr19_-_33360647 | 0.31 |
ENST00000590341.1
ENST00000587772.1 ENST00000023064.4 |
SLC7A9
|
solute carrier family 7 (amino acid transporter light chain, bo,+ system), member 9 |
| chr17_+_56315936 | 0.27 |
ENST00000543544.1
|
LPO
|
lactoperoxidase |
| chr7_-_99006443 | 0.26 |
ENST00000350498.3
|
PDAP1
|
PDGFA associated protein 1 |
| chr10_-_101190202 | 0.25 |
ENST00000543866.1
ENST00000370508.5 |
GOT1
|
glutamic-oxaloacetic transaminase 1, soluble |
| chr11_+_7506713 | 0.22 |
ENST00000329293.3
ENST00000534244.1 |
OLFML1
|
olfactomedin-like 1 |
| chr15_+_71145578 | 0.22 |
ENST00000544974.2
ENST00000558546.1 |
LRRC49
|
leucine rich repeat containing 49 |
| chr17_+_44588877 | 0.20 |
ENST00000576629.1
|
LRRC37A2
|
leucine rich repeat containing 37, member A2 |
| chr4_+_86396265 | 0.19 |
ENST00000395184.1
|
ARHGAP24
|
Rho GTPase activating protein 24 |
| chr9_-_13175823 | 0.16 |
ENST00000545857.1
|
MPDZ
|
multiple PDZ domain protein |
| chr10_+_26727125 | 0.15 |
ENST00000376236.4
|
APBB1IP
|
amyloid beta (A4) precursor protein-binding, family B, member 1 interacting protein |
| chr22_-_30901637 | 0.15 |
ENST00000381982.3
ENST00000255858.7 ENST00000540456.1 ENST00000392772.2 |
SEC14L4
|
SEC14-like 4 (S. cerevisiae) |
| chr11_-_8680383 | 0.15 |
ENST00000299550.6
|
TRIM66
|
tripartite motif containing 66 |
| chr11_-_12030629 | 0.13 |
ENST00000396505.2
|
DKK3
|
dickkopf WNT signaling pathway inhibitor 3 |
| chr19_+_44455368 | 0.12 |
ENST00000591168.1
ENST00000587682.1 ENST00000251269.5 |
ZNF221
|
zinc finger protein 221 |
| chr17_-_76836963 | 0.09 |
ENST00000312010.6
|
USP36
|
ubiquitin specific peptidase 36 |
| chr20_+_8112824 | 0.07 |
ENST00000378641.3
|
PLCB1
|
phospholipase C, beta 1 (phosphoinositide-specific) |
| chr13_-_30169807 | 0.06 |
ENST00000380752.5
|
SLC7A1
|
solute carrier family 7 (cationic amino acid transporter, y+ system), member 1 |
| chr13_+_27825446 | 0.04 |
ENST00000311549.6
|
RPL21
|
ribosomal protein L21 |
| chr12_+_57914742 | 0.04 |
ENST00000551351.1
|
MBD6
|
methyl-CpG binding domain protein 6 |
| chr1_+_29213678 | 0.04 |
ENST00000347529.3
|
EPB41
|
erythrocyte membrane protein band 4.1 (elliptocytosis 1, RH-linked) |
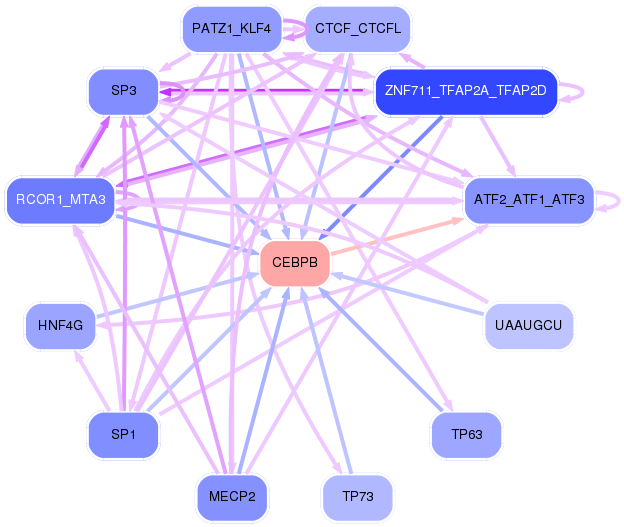
Network of associatons between targets according to the STRING database.

First level regulatory network of CEBPB
Gene Ontology Analysis
Gene overrepresentation in biological_process category:
| Log-likelihood per target | Total log-likelihood | Term | Description |
|---|---|---|---|
| 4.8 | 33.5 | GO:0019264 | glycine biosynthetic process from serine(GO:0019264) |
| 4.6 | 13.8 | GO:0052047 | interaction with other organism via secreted substance involved in symbiotic interaction(GO:0052047) |
| 3.7 | 11.0 | GO:0006435 | threonyl-tRNA aminoacylation(GO:0006435) |
| 3.5 | 14.1 | GO:1903803 | glutamine secretion(GO:0010585) L-glutamine import(GO:0036229) L-glutamine import into cell(GO:1903803) |
| 3.0 | 9.1 | GO:0006535 | cysteine biosynthetic process from serine(GO:0006535) |
| 2.4 | 12.0 | GO:0006436 | tryptophanyl-tRNA aminoacylation(GO:0006436) |
| 2.4 | 11.9 | GO:0052199 | negative regulation of catalytic activity in other organism involved in symbiotic interaction(GO:0052199) |
| 2.3 | 11.4 | GO:0071279 | cellular response to cobalt ion(GO:0071279) |
| 2.1 | 6.2 | GO:0019557 | histidine catabolic process to glutamate and formamide(GO:0019556) histidine catabolic process to glutamate and formate(GO:0019557) formamide metabolic process(GO:0043606) |
| 2.0 | 6.1 | GO:0061394 | regulation of transcription from RNA polymerase II promoter in response to arsenic-containing substance(GO:0061394) |
| 1.8 | 7.4 | GO:0006114 | glycerol biosynthetic process(GO:0006114) |
| 1.8 | 5.3 | GO:0006423 | cysteinyl-tRNA aminoacylation(GO:0006423) |
| 1.7 | 5.1 | GO:0006788 | heme oxidation(GO:0006788) smooth muscle hyperplasia(GO:0014806) |
| 1.6 | 4.7 | GO:0006982 | response to lipid hydroperoxide(GO:0006982) |
| 1.5 | 4.6 | GO:2000296 | negative regulation of hydrogen peroxide catabolic process(GO:2000296) |
| 1.4 | 4.1 | GO:0015920 | leukocyte chemotaxis involved in inflammatory response(GO:0002232) lipopolysaccharide transport(GO:0015920) |
| 1.2 | 7.0 | GO:0034201 | response to oleic acid(GO:0034201) |
| 1.1 | 3.4 | GO:0045994 | positive regulation of translational initiation by iron(GO:0045994) |
| 1.0 | 4.0 | GO:0032792 | negative regulation of CREB transcription factor activity(GO:0032792) |
| 1.0 | 2.9 | GO:0052026 | modulation by virus of host transcription(GO:0019056) positive regulation of sprouting of injured axon(GO:0048687) positive regulation of axon extension involved in regeneration(GO:0048691) modulation by symbiont of host transcription(GO:0052026) |
| 0.9 | 7.5 | GO:2001256 | regulation of store-operated calcium entry(GO:2001256) |
| 0.9 | 5.6 | GO:0038161 | prolactin signaling pathway(GO:0038161) |
| 0.9 | 5.5 | GO:0006561 | proline biosynthetic process(GO:0006561) L-proline biosynthetic process(GO:0055129) |
| 0.9 | 2.7 | GO:0035606 | induction of programmed cell death(GO:0012502) peptidyl-cysteine S-trans-nitrosylation(GO:0035606) positive regulation of apoptotic process in other organism(GO:0044533) positive regulation by symbiont of host programmed cell death(GO:0052042) positive regulation by organism of programmed cell death in other organism involved in symbiotic interaction(GO:0052330) positive regulation by organism of apoptotic process in other organism involved in symbiotic interaction(GO:0052501) |
| 0.9 | 9.0 | GO:0051918 | negative regulation of fibrinolysis(GO:0051918) |
| 0.8 | 2.5 | GO:0001928 | regulation of exocyst assembly(GO:0001928) regulation of exocyst localization(GO:0060178) |
| 0.8 | 2.5 | GO:0006711 | estrogen catabolic process(GO:0006711) |
| 0.8 | 4.7 | GO:0051012 | microtubule sliding(GO:0051012) |
| 0.7 | 2.2 | GO:1904204 | regulation of skeletal muscle hypertrophy(GO:1904204) |
| 0.7 | 2.8 | GO:2000230 | negative regulation of pancreatic stellate cell proliferation(GO:2000230) |
| 0.7 | 15.5 | GO:0045717 | negative regulation of fatty acid biosynthetic process(GO:0045717) |
| 0.7 | 4.2 | GO:0009099 | branched-chain amino acid biosynthetic process(GO:0009082) leucine biosynthetic process(GO:0009098) valine biosynthetic process(GO:0009099) |
| 0.7 | 0.7 | GO:0050787 | detoxification of mercury ion(GO:0050787) |
| 0.7 | 13.5 | GO:0097186 | amelogenesis(GO:0097186) |
| 0.7 | 5.9 | GO:1903898 | negative regulation of PERK-mediated unfolded protein response(GO:1903898) negative regulation of endoplasmic reticulum stress-induced eIF2 alpha phosphorylation(GO:1903912) |
| 0.6 | 1.9 | GO:0061386 | soft palate development(GO:0060023) closure of optic fissure(GO:0061386) |
| 0.6 | 1.9 | GO:0061536 | glycine secretion(GO:0061536) glycine secretion, neurotransmission(GO:0061537) |
| 0.6 | 2.3 | GO:0009956 | radial pattern formation(GO:0009956) |
| 0.6 | 2.3 | GO:0034436 | glycoprotein transport(GO:0034436) |
| 0.5 | 16.4 | GO:0072378 | blood coagulation, fibrin clot formation(GO:0072378) |
| 0.5 | 1.6 | GO:0071676 | negative regulation of mononuclear cell migration(GO:0071676) |
| 0.5 | 1.6 | GO:0090341 | negative regulation of secretion of lysosomal enzymes(GO:0090341) |
| 0.5 | 2.0 | GO:0038165 | oncostatin-M-mediated signaling pathway(GO:0038165) |
| 0.5 | 8.5 | GO:2000194 | regulation of female gonad development(GO:2000194) |
| 0.5 | 6.2 | GO:2000427 | positive regulation of apoptotic cell clearance(GO:2000427) |
| 0.5 | 1.9 | GO:0045218 | zonula adherens maintenance(GO:0045218) |
| 0.5 | 1.4 | GO:0046066 | dGDP metabolic process(GO:0046066) |
| 0.4 | 2.2 | GO:0060356 | leucine import(GO:0060356) |
| 0.4 | 3.6 | GO:0045078 | positive regulation of interferon-gamma biosynthetic process(GO:0045078) |
| 0.4 | 4.4 | GO:0048251 | elastic fiber assembly(GO:0048251) |
| 0.4 | 2.3 | GO:0019418 | sulfide oxidation(GO:0019418) sulfide oxidation, using sulfide:quinone oxidoreductase(GO:0070221) |
| 0.4 | 3.7 | GO:0071550 | death-inducing signaling complex assembly(GO:0071550) positive regulation of sphingolipid biosynthetic process(GO:0090154) positive regulation of ceramide biosynthetic process(GO:2000304) |
| 0.4 | 1.5 | GO:0090362 | positive regulation of platelet-derived growth factor production(GO:0090362) |
| 0.4 | 1.8 | GO:0006651 | diacylglycerol biosynthetic process(GO:0006651) |
| 0.3 | 1.4 | GO:0033031 | positive regulation of neutrophil apoptotic process(GO:0033031) |
| 0.3 | 5.2 | GO:0006751 | glutathione catabolic process(GO:0006751) |
| 0.3 | 1.0 | GO:0070340 | detection of bacterial lipoprotein(GO:0042494) detection of triacyl bacterial lipopeptide(GO:0042495) detection of bacterial lipopeptide(GO:0070340) |
| 0.3 | 3.8 | GO:0099563 | modification of synaptic structure(GO:0099563) |
| 0.3 | 1.9 | GO:0045629 | negative regulation of T-helper 2 cell differentiation(GO:0045629) |
| 0.3 | 1.5 | GO:0060266 | respiratory burst involved in inflammatory response(GO:0002536) regulation of respiratory burst involved in inflammatory response(GO:0060264) negative regulation of respiratory burst involved in inflammatory response(GO:0060266) |
| 0.3 | 6.0 | GO:0006957 | complement activation, alternative pathway(GO:0006957) |
| 0.3 | 2.1 | GO:0036093 | male germ cell proliferation(GO:0002176) germ cell proliferation(GO:0036093) |
| 0.3 | 2.1 | GO:2000660 | negative regulation of interleukin-1-mediated signaling pathway(GO:2000660) |
| 0.3 | 0.8 | GO:0006428 | isoleucyl-tRNA aminoacylation(GO:0006428) |
| 0.3 | 0.8 | GO:0098758 | response to interleukin-8(GO:0098758) cellular response to interleukin-8(GO:0098759) |
| 0.2 | 3.2 | GO:0006782 | protoporphyrinogen IX biosynthetic process(GO:0006782) |
| 0.2 | 1.2 | GO:0032380 | regulation of intracellular lipid transport(GO:0032377) regulation of intracellular sterol transport(GO:0032380) regulation of intracellular cholesterol transport(GO:0032383) |
| 0.2 | 3.5 | GO:0006449 | regulation of translational termination(GO:0006449) |
| 0.2 | 1.1 | GO:1990086 | lens fiber cell apoptotic process(GO:1990086) |
| 0.2 | 7.5 | GO:0032461 | positive regulation of protein oligomerization(GO:0032461) |
| 0.2 | 0.6 | GO:0018894 | dibenzo-p-dioxin metabolic process(GO:0018894) |
| 0.2 | 8.5 | GO:0070306 | lens fiber cell differentiation(GO:0070306) |
| 0.2 | 1.1 | GO:1903301 | positive regulation of glucokinase activity(GO:0033133) positive regulation of hexokinase activity(GO:1903301) |
| 0.2 | 1.2 | GO:0070966 | nuclear-transcribed mRNA catabolic process, no-go decay(GO:0070966) |
| 0.2 | 2.6 | GO:0060272 | embryonic skeletal joint morphogenesis(GO:0060272) |
| 0.2 | 0.7 | GO:0035992 | tendon cell differentiation(GO:0035990) tendon formation(GO:0035992) |
| 0.2 | 2.3 | GO:0046325 | negative regulation of glucose import(GO:0046325) |
| 0.2 | 2.1 | GO:0045721 | negative regulation of gluconeogenesis(GO:0045721) |
| 0.2 | 1.2 | GO:0046549 | retinal cone cell differentiation(GO:0042670) retinal cone cell development(GO:0046549) |
| 0.2 | 0.3 | GO:0015811 | L-cystine transport(GO:0015811) |
| 0.2 | 0.9 | GO:0001554 | luteolysis(GO:0001554) |
| 0.1 | 3.8 | GO:0006337 | nucleosome disassembly(GO:0006337) |
| 0.1 | 0.6 | GO:0090677 | response to mycophenolic acid(GO:0071505) cellular response to mycophenolic acid(GO:0071506) metanephric glomerular mesangial cell development(GO:0072255) reversible differentiation(GO:0090677) cell dedifferentiation involved in phenotypic switching(GO:0090678) positive regulation of phenotypic switching(GO:1900241) regulation of vascular smooth muscle cell dedifferentiation(GO:1905174) positive regulation of vascular smooth muscle cell dedifferentiation(GO:1905176) vascular smooth muscle cell dedifferentiation(GO:1990936) |
| 0.1 | 21.4 | GO:0007156 | homophilic cell adhesion via plasma membrane adhesion molecules(GO:0007156) |
| 0.1 | 0.4 | GO:2000065 | negative regulation of aldosterone metabolic process(GO:0032345) negative regulation of aldosterone biosynthetic process(GO:0032348) regulation of anti-Mullerian hormone signaling pathway(GO:1902612) negative regulation of anti-Mullerian hormone signaling pathway(GO:1902613) anti-Mullerian hormone signaling pathway(GO:1990262) negative regulation of cortisol biosynthetic process(GO:2000065) |
| 0.1 | 1.0 | GO:0086024 | adrenergic receptor signaling pathway involved in positive regulation of heart rate(GO:0086024) |
| 0.1 | 1.0 | GO:0006564 | L-serine biosynthetic process(GO:0006564) |
| 0.1 | 2.1 | GO:0003334 | keratinocyte development(GO:0003334) |
| 0.1 | 0.6 | GO:0014050 | negative regulation of glutamate secretion(GO:0014050) |
| 0.1 | 4.6 | GO:0010862 | positive regulation of pathway-restricted SMAD protein phosphorylation(GO:0010862) |
| 0.1 | 1.3 | GO:0043922 | negative regulation by host of viral transcription(GO:0043922) positive regulation of cysteine-type endopeptidase activity involved in apoptotic signaling pathway(GO:2001269) |
| 0.1 | 0.4 | GO:0010728 | regulation of hydrogen peroxide biosynthetic process(GO:0010728) |
| 0.1 | 1.0 | GO:1903071 | positive regulation of ER-associated ubiquitin-dependent protein catabolic process(GO:1903071) |
| 0.1 | 1.2 | GO:0060712 | spongiotrophoblast layer development(GO:0060712) |
| 0.1 | 0.8 | GO:0033539 | fatty acid beta-oxidation using acyl-CoA dehydrogenase(GO:0033539) |
| 0.1 | 1.5 | GO:0006271 | DNA strand elongation involved in DNA replication(GO:0006271) |
| 0.1 | 0.6 | GO:0014809 | regulation of skeletal muscle contraction by regulation of release of sequestered calcium ion(GO:0014809) |
| 0.1 | 3.5 | GO:0042267 | natural killer cell mediated cytotoxicity(GO:0042267) |
| 0.1 | 2.6 | GO:0010107 | potassium ion import(GO:0010107) |
| 0.0 | 0.4 | GO:0042904 | 9-cis-retinoic acid biosynthetic process(GO:0042904) 9-cis-retinoic acid metabolic process(GO:0042905) |
| 0.0 | 1.3 | GO:0071157 | negative regulation of cell cycle arrest(GO:0071157) |
| 0.0 | 1.5 | GO:0043252 | sodium-independent organic anion transport(GO:0043252) |
| 0.0 | 0.1 | GO:0090427 | activation of meiosis(GO:0090427) |
| 0.0 | 0.5 | GO:0090005 | negative regulation of establishment of protein localization to plasma membrane(GO:0090005) |
| 0.0 | 1.4 | GO:0006418 | tRNA aminoacylation for protein translation(GO:0006418) |
| 0.0 | 2.2 | GO:0070373 | negative regulation of ERK1 and ERK2 cascade(GO:0070373) |
| 0.0 | 3.4 | GO:1990830 | response to leukemia inhibitory factor(GO:1990823) cellular response to leukemia inhibitory factor(GO:1990830) |
| 0.0 | 1.0 | GO:0007214 | gamma-aminobutyric acid signaling pathway(GO:0007214) |
| 0.0 | 0.2 | GO:0002291 | T cell activation via T cell receptor contact with antigen bound to MHC molecule on antigen presenting cell(GO:0002291) |
| 0.0 | 1.8 | GO:1900181 | negative regulation of protein localization to nucleus(GO:1900181) |
| 0.0 | 2.2 | GO:0048706 | embryonic skeletal system development(GO:0048706) |
| 0.0 | 0.1 | GO:1903826 | arginine transmembrane transport(GO:1903826) |
| 0.0 | 1.1 | GO:0030049 | muscle filament sliding(GO:0030049) actin-myosin filament sliding(GO:0033275) |
| 0.0 | 2.1 | GO:0034605 | cellular response to heat(GO:0034605) |
| 0.0 | 3.1 | GO:0006413 | translational initiation(GO:0006413) |
Gene overrepresentation in cellular_component category:
| Log-likelihood per target | Total log-likelihood | Term | Description |
|---|---|---|---|
| 4.2 | 33.5 | GO:0070552 | BRISC complex(GO:0070552) |
| 3.4 | 10.1 | GO:1990622 | CHOP-ATF3 complex(GO:1990622) |
| 1.9 | 5.8 | GO:0005850 | eukaryotic translation initiation factor 2 complex(GO:0005850) |
| 1.8 | 23.6 | GO:0005577 | fibrinogen complex(GO:0005577) |
| 1.2 | 4.6 | GO:0031838 | haptoglobin-hemoglobin complex(GO:0031838) |
| 0.9 | 11.4 | GO:0043203 | axon hillock(GO:0043203) |
| 0.9 | 6.6 | GO:0097452 | GAIT complex(GO:0097452) |
| 0.5 | 9.0 | GO:0031089 | platelet dense granule lumen(GO:0031089) |
| 0.5 | 4.4 | GO:0071953 | elastic fiber(GO:0071953) |
| 0.4 | 1.2 | GO:0034665 | integrin alpha1-beta1 complex(GO:0034665) |
| 0.3 | 5.9 | GO:0000164 | protein phosphatase type 1 complex(GO:0000164) |
| 0.3 | 1.0 | GO:0035354 | Toll-like receptor 1-Toll-like receptor 2 protein complex(GO:0035354) |
| 0.3 | 1.2 | GO:0031436 | BRCA1-BARD1 complex(GO:0031436) |
| 0.3 | 1.6 | GO:0043227 | membrane-bounded organelle(GO:0043227) |
| 0.2 | 2.2 | GO:0042567 | insulin-like growth factor ternary complex(GO:0042567) |
| 0.2 | 3.5 | GO:0005641 | nuclear envelope lumen(GO:0005641) |
| 0.2 | 1.0 | GO:1990037 | Lewy body core(GO:1990037) |
| 0.2 | 0.6 | GO:0032279 | asymmetric synapse(GO:0032279) |
| 0.2 | 1.9 | GO:0005915 | zonula adherens(GO:0005915) |
| 0.1 | 7.0 | GO:0009295 | nucleoid(GO:0009295) mitochondrial nucleoid(GO:0042645) |
| 0.1 | 6.6 | GO:0031904 | endosome lumen(GO:0031904) |
| 0.1 | 2.5 | GO:0000145 | exocyst(GO:0000145) |
| 0.1 | 2.3 | GO:0034361 | very-low-density lipoprotein particle(GO:0034361) triglyceride-rich lipoprotein particle(GO:0034385) |
| 0.1 | 0.7 | GO:0046581 | intercellular canaliculus(GO:0046581) |
| 0.1 | 18.9 | GO:0072562 | blood microparticle(GO:0072562) |
| 0.1 | 15.7 | GO:0042470 | melanosome(GO:0042470) pigment granule(GO:0048770) |
| 0.1 | 0.6 | GO:0030061 | mitochondrial crista(GO:0030061) |
| 0.1 | 8.5 | GO:0005791 | rough endoplasmic reticulum(GO:0005791) |
| 0.1 | 1.2 | GO:0042622 | photoreceptor outer segment membrane(GO:0042622) |
| 0.1 | 0.6 | GO:0016013 | syntrophin complex(GO:0016013) |
| 0.1 | 11.5 | GO:0032993 | protein-DNA complex(GO:0032993) |
| 0.1 | 11.1 | GO:0090575 | RNA polymerase II transcription factor complex(GO:0090575) |
| 0.1 | 0.8 | GO:0001533 | cornified envelope(GO:0001533) |
| 0.1 | 4.7 | GO:0005930 | axoneme(GO:0005930) ciliary plasm(GO:0097014) |
| 0.1 | 3.1 | GO:0035580 | specific granule lumen(GO:0035580) |
| 0.0 | 3.6 | GO:0005902 | microvillus(GO:0005902) |
| 0.0 | 1.1 | GO:0032982 | myosin filament(GO:0032982) |
| 0.0 | 6.2 | GO:0005802 | trans-Golgi network(GO:0005802) |
| 0.0 | 1.0 | GO:0030057 | desmosome(GO:0030057) |
| 0.0 | 2.3 | GO:0005758 | mitochondrial intermembrane space(GO:0005758) |
| 0.0 | 2.9 | GO:0005913 | cell-cell adherens junction(GO:0005913) |
| 0.0 | 4.0 | GO:0005923 | bicellular tight junction(GO:0005923) |
| 0.0 | 1.0 | GO:1902711 | GABA-A receptor complex(GO:1902711) |
| 0.0 | 3.5 | GO:0008076 | voltage-gated potassium channel complex(GO:0008076) potassium channel complex(GO:0034705) |
| 0.0 | 6.9 | GO:0043235 | receptor complex(GO:0043235) |
| 0.0 | 8.1 | GO:0005788 | endoplasmic reticulum lumen(GO:0005788) |
| 0.0 | 2.2 | GO:0032587 | ruffle membrane(GO:0032587) |
| 0.0 | 7.6 | GO:0005578 | proteinaceous extracellular matrix(GO:0005578) |
| 0.0 | 1.2 | GO:0005782 | peroxisomal matrix(GO:0005782) microbody lumen(GO:0031907) |
| 0.0 | 11.7 | GO:0015629 | actin cytoskeleton(GO:0015629) |
| 0.0 | 0.6 | GO:0044306 | neuron projection terminus(GO:0044306) |
| 0.0 | 1.0 | GO:0005891 | voltage-gated calcium channel complex(GO:0005891) |
| 0.0 | 6.3 | GO:0005759 | mitochondrial matrix(GO:0005759) |
| 0.0 | 1.0 | GO:0005901 | caveola(GO:0005901) |
| 0.0 | 3.6 | GO:0019898 | extrinsic component of membrane(GO:0019898) |
| 0.0 | 0.7 | GO:0031526 | brush border membrane(GO:0031526) |
| 0.0 | 0.1 | GO:0014731 | spectrin-associated cytoskeleton(GO:0014731) |
| 0.0 | 27.3 | GO:0070062 | extracellular exosome(GO:0070062) |
Gene overrepresentation in molecular_function category:
| Log-likelihood per target | Total log-likelihood | Term | Description |
|---|---|---|---|
| 4.8 | 33.5 | GO:0004372 | glycine hydroxymethyltransferase activity(GO:0004372) threonine aldolase activity(GO:0004793) L-allo-threonine aldolase activity(GO:0008732) |
| 3.7 | 11.0 | GO:0004829 | threonine-tRNA ligase activity(GO:0004829) |
| 3.4 | 13.5 | GO:0051916 | granulocyte colony-stimulating factor binding(GO:0051916) |
| 3.0 | 9.1 | GO:0016662 | cystathionine beta-synthase activity(GO:0004122) oxidoreductase activity, acting on other nitrogenous compounds as donors, cytochrome as acceptor(GO:0016662) nitrite reductase (NO-forming) activity(GO:0050421) carbon monoxide binding(GO:0070025) nitrite reductase activity(GO:0098809) |
| 2.4 | 12.0 | GO:0004830 | tryptophan-tRNA ligase activity(GO:0004830) |
| 2.4 | 7.1 | GO:0004613 | phosphoenolpyruvate carboxykinase activity(GO:0004611) phosphoenolpyruvate carboxykinase (GTP) activity(GO:0004613) |
| 2.3 | 7.0 | GO:0004087 | carbamoyl-phosphate synthase (ammonia) activity(GO:0004087) carbamoyl-phosphate synthase (glutamine-hydrolyzing) activity(GO:0004088) |
| 2.1 | 10.3 | GO:0005294 | neutral L-amino acid secondary active transmembrane transporter activity(GO:0005294) |
| 1.9 | 13.5 | GO:0015186 | L-glutamine transmembrane transporter activity(GO:0015186) |
| 1.8 | 9.0 | GO:0060230 | lipoprotein lipase activator activity(GO:0060230) |
| 1.8 | 5.3 | GO:0004817 | cysteine-tRNA ligase activity(GO:0004817) |
| 1.7 | 5.1 | GO:0004392 | heme oxygenase (decyclizing) activity(GO:0004392) |
| 1.6 | 6.2 | GO:0016841 | ammonia-lyase activity(GO:0016841) |
| 1.5 | 11.9 | GO:0001849 | complement component C1q binding(GO:0001849) |
| 1.4 | 5.5 | GO:0004735 | pyrroline-5-carboxylate reductase activity(GO:0004735) |
| 1.1 | 5.6 | GO:0004925 | prolactin receptor activity(GO:0004925) |
| 0.8 | 3.4 | GO:0004886 | 9-cis retinoic acid receptor activity(GO:0004886) |
| 0.8 | 14.3 | GO:0055106 | ubiquitin-protein transferase regulator activity(GO:0055106) |
| 0.8 | 4.6 | GO:0030492 | hemoglobin binding(GO:0030492) |
| 0.7 | 3.7 | GO:0043120 | tumor necrosis factor binding(GO:0043120) |
| 0.7 | 2.1 | GO:0005150 | interleukin-1, Type I receptor binding(GO:0005150) |
| 0.7 | 4.2 | GO:0004084 | branched-chain-amino-acid transaminase activity(GO:0004084) L-leucine transaminase activity(GO:0052654) L-valine transaminase activity(GO:0052655) L-isoleucine transaminase activity(GO:0052656) |
| 0.7 | 2.7 | GO:0019828 | glyceraldehyde-3-phosphate dehydrogenase (NAD+) (phosphorylating) activity(GO:0004365) aspartic-type endopeptidase inhibitor activity(GO:0019828) glyceraldehyde-3-phosphate dehydrogenase (NAD(P)+) (phosphorylating) activity(GO:0043891) |
| 0.7 | 2.0 | GO:0004924 | oncostatin-M receptor activity(GO:0004924) |
| 0.6 | 3.8 | GO:0003747 | translation release factor activity(GO:0003747) translation termination factor activity(GO:0008079) |
| 0.6 | 4.1 | GO:0070891 | lipoteichoic acid binding(GO:0070891) |
| 0.6 | 2.3 | GO:0038025 | glycoprotein transporter activity(GO:0034437) reelin receptor activity(GO:0038025) |
| 0.5 | 2.8 | GO:0050692 | DBD domain binding(GO:0050692) |
| 0.5 | 2.3 | GO:0030151 | molybdenum ion binding(GO:0030151) |
| 0.4 | 2.6 | GO:0015272 | ATP-activated inward rectifier potassium channel activity(GO:0015272) |
| 0.4 | 4.7 | GO:0008430 | selenium binding(GO:0008430) |
| 0.4 | 1.2 | GO:0070538 | oleic acid binding(GO:0070538) |
| 0.4 | 5.2 | GO:0016755 | transferase activity, transferring amino-acyl groups(GO:0016755) |
| 0.4 | 1.6 | GO:0032810 | sterol response element binding(GO:0032810) |
| 0.4 | 0.8 | GO:0019959 | interleukin-8 binding(GO:0019959) |
| 0.4 | 9.8 | GO:0001848 | complement binding(GO:0001848) |
| 0.4 | 2.5 | GO:0047894 | flavonol 3-sulfotransferase activity(GO:0047894) steroid sulfotransferase activity(GO:0050294) |
| 0.3 | 1.0 | GO:0035663 | Toll-like receptor 2 binding(GO:0035663) |
| 0.3 | 0.6 | GO:0070905 | serine binding(GO:0070905) |
| 0.3 | 4.0 | GO:0008140 | cAMP response element binding protein binding(GO:0008140) |
| 0.3 | 0.8 | GO:0004822 | isoleucine-tRNA ligase activity(GO:0004822) |
| 0.2 | 1.2 | GO:0098639 | collagen binding involved in cell-matrix adhesion(GO:0098639) |
| 0.2 | 13.8 | GO:0016504 | peptidase activator activity(GO:0016504) |
| 0.2 | 2.2 | GO:0005432 | calcium:sodium antiporter activity(GO:0005432) |
| 0.2 | 2.9 | GO:0005004 | GPI-linked ephrin receptor activity(GO:0005004) neurotrophin receptor activity(GO:0005030) |
| 0.2 | 1.1 | GO:0070095 | fructose-6-phosphate binding(GO:0070095) |
| 0.2 | 3.9 | GO:0035613 | RNA stem-loop binding(GO:0035613) |
| 0.2 | 2.2 | GO:0031995 | insulin-like growth factor II binding(GO:0031995) |
| 0.2 | 1.0 | GO:0004647 | phosphoserine phosphatase activity(GO:0004647) |
| 0.2 | 2.5 | GO:0019957 | C-C chemokine binding(GO:0019957) |
| 0.2 | 3.5 | GO:0032794 | GTPase activating protein binding(GO:0032794) |
| 0.2 | 0.5 | GO:0032427 | GBD domain binding(GO:0032427) |
| 0.1 | 1.6 | GO:0070700 | BMP receptor binding(GO:0070700) |
| 0.1 | 1.0 | GO:0005143 | interleukin-12 receptor binding(GO:0005143) |
| 0.1 | 12.8 | GO:0004867 | serine-type endopeptidase inhibitor activity(GO:0004867) |
| 0.1 | 9.1 | GO:0004869 | cysteine-type endopeptidase inhibitor activity(GO:0004869) |
| 0.1 | 3.1 | GO:0098641 | cadherin binding involved in cell-cell adhesion(GO:0098641) |
| 0.1 | 1.9 | GO:0008569 | ATP-dependent microtubule motor activity, minus-end-directed(GO:0008569) |
| 0.1 | 1.2 | GO:0008020 | G-protein coupled photoreceptor activity(GO:0008020) |
| 0.1 | 3.4 | GO:0030742 | GTP-dependent protein binding(GO:0030742) |
| 0.1 | 1.5 | GO:0048273 | MAP kinase tyrosine/serine/threonine phosphatase activity(GO:0017017) mitogen-activated protein kinase p38 binding(GO:0048273) |
| 0.1 | 1.3 | GO:0017110 | nucleoside-diphosphatase activity(GO:0017110) |
| 0.1 | 12.1 | GO:0005179 | hormone activity(GO:0005179) |
| 0.1 | 2.6 | GO:0008301 | DNA binding, bending(GO:0008301) |
| 0.1 | 3.8 | GO:0050699 | WW domain binding(GO:0050699) |
| 0.1 | 0.3 | GO:0004609 | phosphatidylserine decarboxylase activity(GO:0004609) L-phenylalanine aminotransferase activity(GO:0070546) L-phenylalanine:2-oxoglutarate aminotransferase activity(GO:0080130) |
| 0.1 | 0.3 | GO:0015184 | L-cystine transmembrane transporter activity(GO:0015184) |
| 0.1 | 1.0 | GO:0008503 | benzodiazepine receptor activity(GO:0008503) |
| 0.1 | 1.9 | GO:0004435 | phosphatidylinositol phospholipase C activity(GO:0004435) |
| 0.1 | 2.3 | GO:0001972 | retinoic acid binding(GO:0001972) |
| 0.1 | 5.0 | GO:0003743 | translation initiation factor activity(GO:0003743) |
| 0.1 | 0.7 | GO:0043225 | anion transmembrane-transporting ATPase activity(GO:0043225) |
| 0.1 | 0.6 | GO:0016176 | superoxide-generating NADPH oxidase activator activity(GO:0016176) |
| 0.1 | 6.3 | GO:0004222 | metalloendopeptidase activity(GO:0004222) |
| 0.1 | 2.3 | GO:0005158 | insulin receptor binding(GO:0005158) |
| 0.1 | 1.0 | GO:0031698 | beta-2 adrenergic receptor binding(GO:0031698) |
| 0.0 | 1.0 | GO:0015125 | bile acid transmembrane transporter activity(GO:0015125) |
| 0.0 | 1.3 | GO:0015464 | acetylcholine receptor activity(GO:0015464) |
| 0.0 | 1.6 | GO:0008135 | translation factor activity, RNA binding(GO:0008135) |
| 0.0 | 0.4 | GO:0004022 | alcohol dehydrogenase (NAD) activity(GO:0004022) |
| 0.0 | 4.7 | GO:0019888 | protein phosphatase regulator activity(GO:0019888) |
| 0.0 | 0.6 | GO:0017127 | cholesterol transporter activity(GO:0017127) |
| 0.0 | 2.1 | GO:0030971 | receptor tyrosine kinase binding(GO:0030971) |
| 0.0 | 6.1 | GO:0001078 | transcriptional repressor activity, RNA polymerase II core promoter proximal region sequence-specific binding(GO:0001078) |
| 0.0 | 3.2 | GO:0016765 | transferase activity, transferring alkyl or aryl (other than methyl) groups(GO:0016765) |
| 0.0 | 5.6 | GO:0005178 | integrin binding(GO:0005178) |
| 0.0 | 0.6 | GO:0017166 | vinculin binding(GO:0017166) |
| 0.0 | 2.5 | GO:0019003 | GDP binding(GO:0019003) |
| 0.0 | 1.1 | GO:0000146 | microfilament motor activity(GO:0000146) |
| 0.0 | 1.3 | GO:0031492 | nucleosomal DNA binding(GO:0031492) |
| 0.0 | 22.3 | GO:0005509 | calcium ion binding(GO:0005509) |
| 0.0 | 1.0 | GO:0044325 | ion channel binding(GO:0044325) |
| 0.0 | 0.4 | GO:0005328 | neurotransmitter:sodium symporter activity(GO:0005328) |
| 0.0 | 4.7 | GO:0008017 | microtubule binding(GO:0008017) |
| 0.0 | 1.2 | GO:0050681 | androgen receptor binding(GO:0050681) |
| 0.0 | 0.1 | GO:0015181 | arginine transmembrane transporter activity(GO:0015181) |
| 0.0 | 4.1 | GO:0030246 | carbohydrate binding(GO:0030246) |
| 0.0 | 1.3 | GO:0042826 | histone deacetylase binding(GO:0042826) |
| 0.0 | 5.2 | GO:0003682 | chromatin binding(GO:0003682) |
Gene overrepresentation in C2:CP category:
| Log-likelihood per target | Total log-likelihood | Term | Description |
|---|---|---|---|
| 0.5 | 21.7 | ST MYOCYTE AD PATHWAY | Myocyte Adrenergic Pathway is a specific case of the generalized Adrenergic Pathway. |
| 0.5 | 13.8 | PID INTEGRIN5 PATHWAY | Beta5 beta6 beta7 and beta8 integrin cell surface interactions |
| 0.4 | 16.4 | PID INTEGRIN2 PATHWAY | Beta2 integrin cell surface interactions |
| 0.2 | 14.6 | PID FRA PATHWAY | Validated transcriptional targets of AP1 family members Fra1 and Fra2 |
| 0.2 | 7.8 | PID RXR VDR PATHWAY | RXR and RAR heterodimerization with other nuclear receptor |
| 0.1 | 11.9 | PID ATF2 PATHWAY | ATF-2 transcription factor network |
| 0.1 | 2.0 | ST G ALPHA S PATHWAY | G alpha s Pathway |
| 0.1 | 3.7 | SA MMP CYTOKINE CONNECTION | Cytokines can induce activation of matrix metalloproteinases, which degrade extracellular matrix. |
| 0.1 | 7.1 | PID HNF3B PATHWAY | FOXA2 and FOXA3 transcription factor networks |
| 0.1 | 2.5 | PID P38 ALPHA BETA PATHWAY | Regulation of p38-alpha and p38-beta |
| 0.1 | 1.1 | SA REG CASCADE OF CYCLIN EXPR | Expression of cyclins regulates progression through the cell cycle by activating cyclin-dependent kinases. |
| 0.1 | 2.8 | PID INSULIN PATHWAY | Insulin Pathway |
| 0.1 | 1.2 | PID INTEGRIN CS PATHWAY | Integrin family cell surface interactions |
| 0.1 | 5.0 | PID PTP1B PATHWAY | Signaling events mediated by PTP1B |
| 0.1 | 2.1 | PID AMB2 NEUTROPHILS PATHWAY | amb2 Integrin signaling |
| 0.1 | 2.3 | PID REELIN PATHWAY | Reelin signaling pathway |
| 0.1 | 4.1 | PID IL6 7 PATHWAY | IL6-mediated signaling events |
| 0.1 | 1.0 | PID IL27 PATHWAY | IL27-mediated signaling events |
| 0.1 | 2.9 | PID SHP2 PATHWAY | SHP2 signaling |
| 0.1 | 1.8 | PID RAS PATHWAY | Regulation of Ras family activation |
| 0.1 | 6.9 | PID MYC ACTIV PATHWAY | Validated targets of C-MYC transcriptional activation |
| 0.1 | 2.1 | PID IL1 PATHWAY | IL1-mediated signaling events |
| 0.1 | 0.8 | ST INTERLEUKIN 4 PATHWAY | Interleukin 4 (IL-4) Pathway |
| 0.1 | 1.0 | PID TOLL ENDOGENOUS PATHWAY | Endogenous TLR signaling |
| 0.1 | 1.2 | PID CONE PATHWAY | Visual signal transduction: Cones |
| 0.0 | 3.4 | ST INTEGRIN SIGNALING PATHWAY | Integrin Signaling Pathway |
| 0.0 | 2.3 | PID HNF3A PATHWAY | FOXA1 transcription factor network |
| 0.0 | 11.0 | NABA ECM REGULATORS | Genes encoding enzymes and their regulators involved in the remodeling of the extracellular matrix |
| 0.0 | 2.1 | PID CDC42 REG PATHWAY | Regulation of CDC42 activity |
| 0.0 | 2.2 | PID NFAT TFPATHWAY | Calcineurin-regulated NFAT-dependent transcription in lymphocytes |
| 0.0 | 1.9 | PID ECADHERIN STABILIZATION PATHWAY | Stabilization and expansion of the E-cadherin adherens junction |
| 0.0 | 1.9 | PID IL12 2PATHWAY | IL12-mediated signaling events |
| 0.0 | 0.8 | PID IL8 CXCR1 PATHWAY | IL8- and CXCR1-mediated signaling events |
| 0.0 | 1.6 | PID P53 REGULATION PATHWAY | p53 pathway |
| 0.0 | 0.4 | ST WNT BETA CATENIN PATHWAY | Wnt/beta-catenin Pathway |
Gene overrepresentation in C2:CP:REACTOME category:
| Log-likelihood per target | Total log-likelihood | Term | Description |
|---|---|---|---|
| 1.6 | 14.3 | REACTOME NEGATIVE REGULATION OF THE PI3K AKT NETWORK | Genes involved in Negative regulation of the PI3K/AKT network |
| 0.9 | 21.3 | REACTOME P130CAS LINKAGE TO MAPK SIGNALING FOR INTEGRINS | Genes involved in p130Cas linkage to MAPK signaling for integrins |
| 0.8 | 30.5 | REACTOME CYTOSOLIC TRNA AMINOACYLATION | Genes involved in Cytosolic tRNA aminoacylation |
| 0.6 | 12.3 | REACTOME INITIAL TRIGGERING OF COMPLEMENT | Genes involved in Initial triggering of complement |
| 0.5 | 7.1 | REACTOME ABACAVIR TRANSPORT AND METABOLISM | Genes involved in Abacavir transport and metabolism |
| 0.5 | 9.1 | REACTOME INTRINSIC PATHWAY | Genes involved in Intrinsic Pathway |
| 0.5 | 19.3 | REACTOME AMINO ACID TRANSPORT ACROSS THE PLASMA MEMBRANE | Genes involved in Amino acid transport across the plasma membrane |
| 0.4 | 11.1 | REACTOME ACTIVATION OF GENES BY ATF4 | Genes involved in Activation of Genes by ATF4 |
| 0.4 | 9.0 | REACTOME REGULATION OF INSULIN LIKE GROWTH FACTOR IGF ACTIVITY BY INSULIN LIKE GROWTH FACTOR BINDING PROTEINS IGFBPS | Genes involved in Regulation of Insulin-like Growth Factor (IGF) Activity by Insulin-like Growth Factor Binding Proteins (IGFBPs) |
| 0.3 | 4.6 | REACTOME GLYCOPROTEIN HORMONES | Genes involved in Glycoprotein hormones |
| 0.3 | 8.3 | REACTOME METABOLISM OF PORPHYRINS | Genes involved in Metabolism of porphyrins |
| 0.3 | 11.7 | REACTOME SULFUR AMINO ACID METABOLISM | Genes involved in Sulfur amino acid metabolism |
| 0.3 | 6.4 | REACTOME AMINO ACID SYNTHESIS AND INTERCONVERSION TRANSAMINATION | Genes involved in Amino acid synthesis and interconversion (transamination) |
| 0.2 | 5.6 | REACTOME PROLACTIN RECEPTOR SIGNALING | Genes involved in Prolactin receptor signaling |
| 0.2 | 4.2 | REACTOME BRANCHED CHAIN AMINO ACID CATABOLISM | Genes involved in Branched-chain amino acid catabolism |
| 0.1 | 1.9 | REACTOME NA CL DEPENDENT NEUROTRANSMITTER TRANSPORTERS | Genes involved in Na+/Cl- dependent neurotransmitter transporters |
| 0.1 | 3.7 | REACTOME EXTRINSIC PATHWAY FOR APOPTOSIS | Genes involved in Extrinsic Pathway for Apoptosis |
| 0.1 | 2.3 | REACTOME SIGNAL ATTENUATION | Genes involved in Signal attenuation |
| 0.1 | 2.5 | REACTOME P38MAPK EVENTS | Genes involved in p38MAPK events |
| 0.1 | 1.1 | REACTOME CDC6 ASSOCIATION WITH THE ORC ORIGIN COMPLEX | Genes involved in CDC6 association with the ORC:origin complex |
| 0.1 | 2.5 | REACTOME CYTOSOLIC SULFONATION OF SMALL MOLECULES | Genes involved in Cytosolic sulfonation of small molecules |
| 0.1 | 7.5 | REACTOME TRANSCRIPTIONAL REGULATION OF WHITE ADIPOCYTE DIFFERENTIATION | Genes involved in Transcriptional Regulation of White Adipocyte Differentiation |
| 0.1 | 5.8 | REACTOME FORMATION OF THE TERNARY COMPLEX AND SUBSEQUENTLY THE 43S COMPLEX | Genes involved in Formation of the ternary complex, and subsequently, the 43S complex |
| 0.1 | 3.8 | REACTOME GLYCOLYSIS | Genes involved in Glycolysis |
| 0.1 | 1.2 | REACTOME ALPHA LINOLENIC ACID ALA METABOLISM | Genes involved in alpha-linolenic acid (ALA) metabolism |
| 0.1 | 2.6 | REACTOME INWARDLY RECTIFYING K CHANNELS | Genes involved in Inwardly rectifying K+ channels |
| 0.1 | 1.2 | REACTOME G PROTEIN ACTIVATION | Genes involved in G-protein activation |
| 0.1 | 1.9 | REACTOME ASSOCIATION OF TRIC CCT WITH TARGET PROTEINS DURING BIOSYNTHESIS | Genes involved in Association of TriC/CCT with target proteins during biosynthesis |
| 0.1 | 9.9 | REACTOME METABOLISM OF AMINO ACIDS AND DERIVATIVES | Genes involved in Metabolism of amino acids and derivatives |
| 0.1 | 1.2 | REACTOME OTHER SEMAPHORIN INTERACTIONS | Genes involved in Other semaphorin interactions |
| 0.1 | 1.0 | REACTOME APOPTOTIC CLEAVAGE OF CELL ADHESION PROTEINS | Genes involved in Apoptotic cleavage of cell adhesion proteins |
| 0.0 | 1.2 | REACTOME FANCONI ANEMIA PATHWAY | Genes involved in Fanconi Anemia pathway |
| 0.0 | 2.1 | REACTOME IL1 SIGNALING | Genes involved in Interleukin-1 signaling |
| 0.0 | 0.6 | REACTOME CLASS C 3 METABOTROPIC GLUTAMATE PHEROMONE RECEPTORS | Genes involved in Class C/3 (Metabotropic glutamate/pheromone receptors) |
| 0.0 | 0.4 | REACTOME BETA DEFENSINS | Genes involved in Beta defensins |
| 0.0 | 3.5 | REACTOME LOSS OF NLP FROM MITOTIC CENTROSOMES | Genes involved in Loss of Nlp from mitotic centrosomes |
| 0.0 | 5.9 | REACTOME FACTORS INVOLVED IN MEGAKARYOCYTE DEVELOPMENT AND PLATELET PRODUCTION | Genes involved in Factors involved in megakaryocyte development and platelet production |
| 0.0 | 4.1 | REACTOME TOLL RECEPTOR CASCADES | Genes involved in Toll Receptor Cascades |
| 0.0 | 1.0 | REACTOME DARPP 32 EVENTS | Genes involved in DARPP-32 events |
| 0.0 | 1.0 | REACTOME GABA A RECEPTOR ACTIVATION | Genes involved in GABA A receptor activation |
| 0.0 | 3.7 | REACTOME NONSENSE MEDIATED DECAY ENHANCED BY THE EXON JUNCTION COMPLEX | Genes involved in Nonsense Mediated Decay Enhanced by the Exon Junction Complex |
| 0.0 | 0.6 | REACTOME STEROID HORMONES | Genes involved in Steroid hormones |
| 0.0 | 0.7 | REACTOME ABC FAMILY PROTEINS MEDIATED TRANSPORT | Genes involved in ABC-family proteins mediated transport |
| 0.0 | 0.1 | REACTOME G BETA GAMMA SIGNALLING THROUGH PLC BETA | Genes involved in G beta:gamma signalling through PLC beta |