Project
GNF SymAtlas + NCI-60 cancer cell lines, comparison of cancers vs non-cancers, human (Su, 2004; Ross, 2000)
Navigation
Downloads
Results for DDIT3
Z-value: 0.75
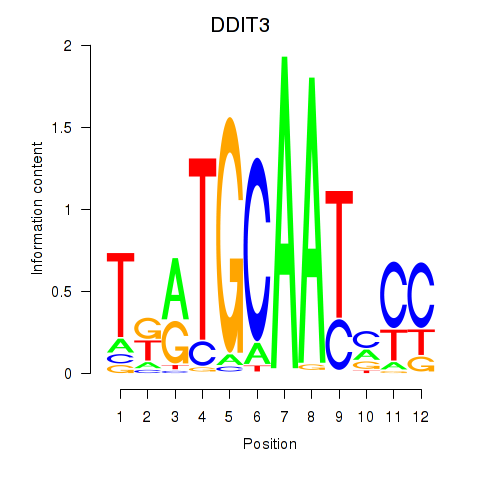
Motif logo
Transcription factors associated with DDIT3
| Gene Symbol | Gene ID | Gene Info |
|---|---|---|
|
DDIT3
|
ENSG00000175197.6 | DNA damage inducible transcript 3 |
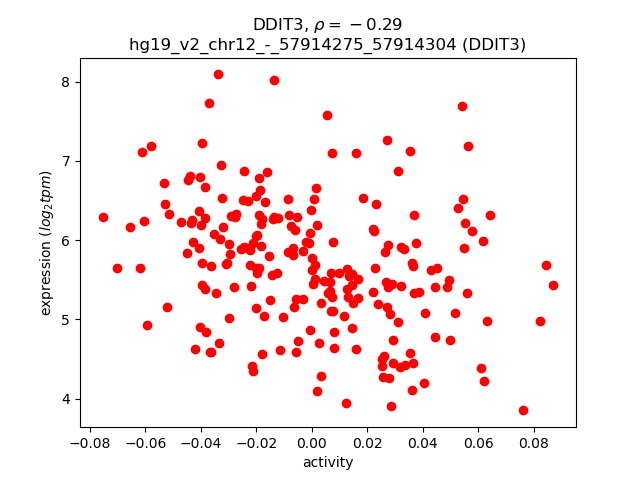
Activity-expression correlation:
| Gene | Promoter | Pearson corr. coef. | P-value | Plot |
|---|---|---|---|---|
| DDIT3 | hg19_v2_chr12_-_57914275_57914304 | -0.29 | 1.4e-05 | Click! |
Activity profile of DDIT3 motif
Sorted Z-values of DDIT3 motif
| Promoter | Log-likelihood | Transcript | Gene | Gene Info |
|---|---|---|---|---|
| chr10_-_17659234 | 11.81 |
ENST00000466335.1
|
PTPLA
|
protein tyrosine phosphatase-like (proline instead of catalytic arginine), member A |
| chr9_+_112542591 | 9.60 |
ENST00000483909.1
ENST00000314527.4 ENST00000413420.1 ENST00000302798.7 ENST00000555236.1 ENST00000510514.5 |
PALM2
PALM2-AKAP2
AKAP2
|
paralemmin 2 PALM2-AKAP2 readthrough A kinase (PRKA) anchor protein 2 |
| chr9_-_95055956 | 9.38 |
ENST00000375629.3
ENST00000447699.2 ENST00000375643.3 ENST00000395554.3 |
IARS
|
isoleucyl-tRNA synthetase |
| chr9_+_110045537 | 9.06 |
ENST00000358015.3
|
RAD23B
|
RAD23 homolog B (S. cerevisiae) |
| chr10_-_17659357 | 8.35 |
ENST00000326961.6
ENST00000361271.3 |
PTPLA
|
protein tyrosine phosphatase-like (proline instead of catalytic arginine), member A |
| chr9_+_112542572 | 8.29 |
ENST00000374530.3
|
PALM2-AKAP2
|
PALM2-AKAP2 readthrough |
| chr5_+_72143988 | 7.37 |
ENST00000506351.2
|
TNPO1
|
transportin 1 |
| chr3_+_157154578 | 7.10 |
ENST00000295927.3
|
PTX3
|
pentraxin 3, long |
| chr9_-_95056010 | 7.00 |
ENST00000443024.2
|
IARS
|
isoleucyl-tRNA synthetase |
| chr7_+_99006550 | 6.88 |
ENST00000222969.5
|
BUD31
|
BUD31 homolog (S. cerevisiae) |
| chr9_+_80912059 | 6.68 |
ENST00000347159.2
ENST00000376588.3 |
PSAT1
|
phosphoserine aminotransferase 1 |
| chr5_-_137878887 | 6.05 |
ENST00000507939.1
ENST00000572514.1 ENST00000499810.2 ENST00000360541.5 |
ETF1
|
eukaryotic translation termination factor 1 |
| chr7_+_99006232 | 5.89 |
ENST00000403633.2
|
BUD31
|
BUD31 homolog (S. cerevisiae) |
| chr19_+_12917364 | 5.89 |
ENST00000221486.4
|
RNASEH2A
|
ribonuclease H2, subunit A |
| chr19_+_33865218 | 5.84 |
ENST00000585933.2
|
CEBPG
|
CCAAT/enhancer binding protein (C/EBP), gamma |
| chr2_+_63816295 | 5.72 |
ENST00000539945.1
ENST00000544381.1 |
MDH1
|
malate dehydrogenase 1, NAD (soluble) |
| chr7_-_56101826 | 5.67 |
ENST00000421626.1
|
PSPH
|
phosphoserine phosphatase |
| chr2_-_161350305 | 5.65 |
ENST00000348849.3
|
RBMS1
|
RNA binding motif, single stranded interacting protein 1 |
| chr2_+_192141611 | 5.14 |
ENST00000392316.1
|
MYO1B
|
myosin IB |
| chr4_-_2935674 | 4.78 |
ENST00000514800.1
|
MFSD10
|
major facilitator superfamily domain containing 10 |
| chr13_-_24007815 | 4.74 |
ENST00000382298.3
|
SACS
|
spastic ataxia of Charlevoix-Saguenay (sacsin) |
| chr12_+_50144381 | 4.24 |
ENST00000552370.1
|
TMBIM6
|
transmembrane BAX inhibitor motif containing 6 |
| chr3_+_130569429 | 4.24 |
ENST00000505330.1
ENST00000504381.1 ENST00000507488.2 ENST00000393221.4 |
ATP2C1
|
ATPase, Ca++ transporting, type 2C, member 1 |
| chr17_-_30228678 | 3.93 |
ENST00000261708.4
|
UTP6
|
UTP6, small subunit (SSU) processome component, homolog (yeast) |
| chr10_+_60028818 | 3.70 |
ENST00000333926.5
|
CISD1
|
CDGSH iron sulfur domain 1 |
| chr5_+_118812294 | 3.69 |
ENST00000509514.1
|
HSD17B4
|
hydroxysteroid (17-beta) dehydrogenase 4 |
| chr10_-_116444371 | 3.58 |
ENST00000533213.2
ENST00000369252.4 |
ABLIM1
|
actin binding LIM protein 1 |
| chr2_+_63816087 | 3.54 |
ENST00000409908.1
ENST00000442225.1 ENST00000409476.1 ENST00000436321.1 |
MDH1
|
malate dehydrogenase 1, NAD (soluble) |
| chr11_+_34073195 | 3.38 |
ENST00000341394.4
|
CAPRIN1
|
cell cycle associated protein 1 |
| chr11_+_34073269 | 3.35 |
ENST00000389645.3
|
CAPRIN1
|
cell cycle associated protein 1 |
| chr5_+_118812237 | 3.20 |
ENST00000513628.1
|
HSD17B4
|
hydroxysteroid (17-beta) dehydrogenase 4 |
| chr3_+_38017264 | 3.19 |
ENST00000436654.1
|
CTDSPL
|
CTD (carboxy-terminal domain, RNA polymerase II, polypeptide A) small phosphatase-like |
| chr3_+_12392971 | 3.16 |
ENST00000287820.6
|
PPARG
|
peroxisome proliferator-activated receptor gamma |
| chr7_-_99006443 | 3.03 |
ENST00000350498.3
|
PDAP1
|
PDGFA associated protein 1 |
| chr3_+_44840679 | 2.99 |
ENST00000425755.1
|
KIF15
|
kinesin family member 15 |
| chr16_-_70323422 | 2.99 |
ENST00000261772.8
|
AARS
|
alanyl-tRNA synthetase |
| chr1_+_174844645 | 2.79 |
ENST00000486220.1
|
RABGAP1L
|
RAB GTPase activating protein 1-like |
| chr1_+_154229547 | 2.72 |
ENST00000428595.1
|
UBAP2L
|
ubiquitin associated protein 2-like |
| chr20_+_48807351 | 2.61 |
ENST00000303004.3
|
CEBPB
|
CCAAT/enhancer binding protein (C/EBP), beta |
| chr1_+_111770278 | 2.58 |
ENST00000369748.4
|
CHI3L2
|
chitinase 3-like 2 |
| chr1_-_44820880 | 2.52 |
ENST00000372257.2
ENST00000457571.1 ENST00000452396.1 |
ERI3
|
ERI1 exoribonuclease family member 3 |
| chr1_+_111770232 | 2.51 |
ENST00000369744.2
|
CHI3L2
|
chitinase 3-like 2 |
| chr12_-_52867569 | 2.46 |
ENST00000252250.6
|
KRT6C
|
keratin 6C |
| chr19_-_49258606 | 2.38 |
ENST00000310160.3
|
FUT1
|
fucosyltransferase 1 (galactoside 2-alpha-L-fucosyltransferase, H blood group) |
| chr19_-_6604094 | 2.37 |
ENST00000597430.2
|
CD70
|
CD70 molecule |
| chr11_-_8680383 | 2.31 |
ENST00000299550.6
|
TRIM66
|
tripartite motif containing 66 |
| chr5_+_112074029 | 2.28 |
ENST00000512211.2
|
APC
|
adenomatous polyposis coli |
| chr1_+_150954493 | 2.23 |
ENST00000368947.4
|
ANXA9
|
annexin A9 |
| chr22_+_31518938 | 1.94 |
ENST00000412985.1
ENST00000331075.5 ENST00000412277.2 ENST00000420017.1 ENST00000400294.2 ENST00000405300.1 ENST00000404390.3 |
INPP5J
|
inositol polyphosphate-5-phosphatase J |
| chr12_-_53074182 | 1.89 |
ENST00000252244.3
|
KRT1
|
keratin 1 |
| chr16_-_18908196 | 1.79 |
ENST00000565324.1
ENST00000561947.1 |
SMG1
|
SMG1 phosphatidylinositol 3-kinase-related kinase |
| chr2_-_216300784 | 1.76 |
ENST00000421182.1
ENST00000432072.2 ENST00000323926.6 ENST00000336916.4 ENST00000357867.4 ENST00000359671.1 ENST00000346544.3 ENST00000345488.5 ENST00000357009.2 ENST00000446046.1 ENST00000356005.4 ENST00000443816.1 ENST00000426059.1 ENST00000354785.4 |
FN1
|
fibronectin 1 |
| chr14_+_102276132 | 1.73 |
ENST00000350249.3
ENST00000557621.1 ENST00000556946.1 |
PPP2R5C
|
protein phosphatase 2, regulatory subunit B', gamma |
| chrX_-_133792480 | 1.62 |
ENST00000359237.4
|
PLAC1
|
placenta-specific 1 |
| chr12_-_25102252 | 1.54 |
ENST00000261192.7
|
BCAT1
|
branched chain amino-acid transaminase 1, cytosolic |
| chr10_-_103874692 | 1.47 |
ENST00000361198.5
|
LDB1
|
LIM domain binding 1 |
| chr10_-_92681033 | 1.45 |
ENST00000371697.3
|
ANKRD1
|
ankyrin repeat domain 1 (cardiac muscle) |
| chrX_+_9431324 | 1.39 |
ENST00000407597.2
ENST00000424279.1 ENST00000536365.1 ENST00000441088.1 ENST00000380961.1 ENST00000415293.1 |
TBL1X
|
transducin (beta)-like 1X-linked |
| chr16_+_56970567 | 1.33 |
ENST00000563911.1
|
HERPUD1
|
homocysteine-inducible, endoplasmic reticulum stress-inducible, ubiquitin-like domain member 1 |
| chr12_-_63328817 | 1.21 |
ENST00000228705.6
|
PPM1H
|
protein phosphatase, Mg2+/Mn2+ dependent, 1H |
| chr17_-_77813186 | 1.15 |
ENST00000448310.1
ENST00000269397.4 |
CBX4
|
chromobox homolog 4 |
| chr2_-_179672142 | 1.14 |
ENST00000342992.6
ENST00000360870.5 ENST00000460472.2 ENST00000589042.1 ENST00000591111.1 ENST00000342175.6 ENST00000359218.5 |
TTN
|
titin |
| chr17_+_4855053 | 0.76 |
ENST00000518175.1
|
ENO3
|
enolase 3 (beta, muscle) |
| chr1_+_169079823 | 0.71 |
ENST00000367813.3
|
ATP1B1
|
ATPase, Na+/K+ transporting, beta 1 polypeptide |
| chr12_-_25101920 | 0.65 |
ENST00000539780.1
ENST00000546285.1 ENST00000342945.5 |
BCAT1
|
branched chain amino-acid transaminase 1, cytosolic |
| chr9_+_70971815 | 0.58 |
ENST00000396392.1
ENST00000396396.1 |
PGM5
|
phosphoglucomutase 5 |
| chr8_-_93029865 | 0.57 |
ENST00000422361.2
|
RUNX1T1
|
runt-related transcription factor 1; translocated to, 1 (cyclin D-related) |
| chr5_-_66492562 | 0.50 |
ENST00000256447.4
|
CD180
|
CD180 molecule |
| chr3_+_190105909 | 0.33 |
ENST00000456423.1
|
CLDN16
|
claudin 16 |
| chrX_-_100129128 | 0.17 |
ENST00000372960.4
ENST00000372964.1 ENST00000217885.5 |
NOX1
|
NADPH oxidase 1 |
| chr1_-_67519782 | 0.16 |
ENST00000235345.5
|
SLC35D1
|
solute carrier family 35 (UDP-GlcA/UDP-GalNAc transporter), member D1 |
| chr20_+_54987305 | 0.11 |
ENST00000371336.3
ENST00000434344.1 |
CASS4
|
Cas scaffolding protein family member 4 |
| chr20_+_54987168 | 0.07 |
ENST00000360314.3
|
CASS4
|
Cas scaffolding protein family member 4 |
| chr5_-_54281407 | 0.07 |
ENST00000381403.4
|
ESM1
|
endothelial cell-specific molecule 1 |
Network of associatons between targets according to the STRING database.

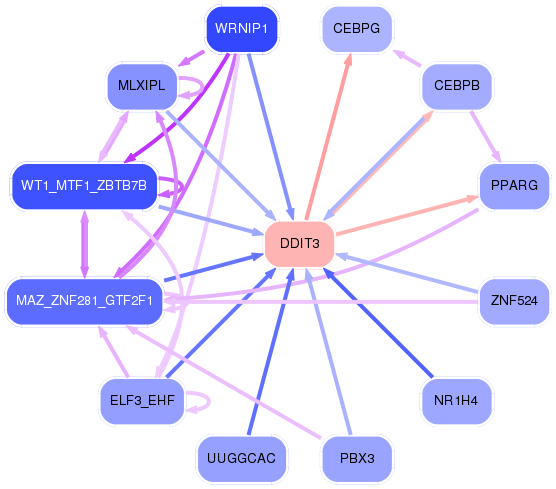
First level regulatory network of DDIT3
Gene Ontology Analysis
Gene overrepresentation in biological_process category:
| Log-likelihood per target | Total log-likelihood | Term | Description |
|---|---|---|---|
| 5.5 | 16.4 | GO:0006428 | isoleucyl-tRNA aminoacylation(GO:0006428) |
| 2.0 | 5.9 | GO:0043137 | DNA replication, removal of RNA primer(GO:0043137) |
| 1.6 | 12.8 | GO:2000825 | positive regulation of androgen receptor activity(GO:2000825) |
| 1.4 | 7.1 | GO:0052199 | negative regulation of catalytic activity in other organism involved in symbiotic interaction(GO:0052199) |
| 1.3 | 6.7 | GO:0042816 | vitamin B6 metabolic process(GO:0042816) |
| 1.1 | 6.9 | GO:0036111 | very long-chain fatty-acyl-CoA metabolic process(GO:0036111) |
| 1.0 | 3.0 | GO:0006419 | alanyl-tRNA aminoacylation(GO:0006419) |
| 0.8 | 3.2 | GO:2000230 | negative regulation of pancreatic stellate cell proliferation(GO:2000230) |
| 0.8 | 9.3 | GO:0006108 | malate metabolic process(GO:0006108) |
| 0.7 | 5.8 | GO:0043353 | enucleate erythrocyte differentiation(GO:0043353) |
| 0.7 | 4.2 | GO:0031438 | negative regulation of mRNA cleavage(GO:0031438) negative regulation of immunoglobulin secretion(GO:0051025) negative regulation of ribonuclease activity(GO:0060701) negative regulation of endoribonuclease activity(GO:0060702) negative regulation of mRNA endonucleolytic cleavage involved in unfolded protein response(GO:1904721) |
| 0.7 | 4.2 | GO:0032468 | Golgi calcium ion homeostasis(GO:0032468) |
| 0.6 | 1.8 | GO:0052047 | interaction with other organism via secreted substance involved in symbiotic interaction(GO:0052047) |
| 0.5 | 7.4 | GO:0006610 | ribosomal protein import into nucleus(GO:0006610) |
| 0.5 | 5.7 | GO:0006564 | L-serine biosynthetic process(GO:0006564) |
| 0.5 | 5.1 | GO:0006030 | chitin metabolic process(GO:0006030) chitin catabolic process(GO:0006032) |
| 0.5 | 2.7 | GO:0061484 | hematopoietic stem cell homeostasis(GO:0061484) |
| 0.4 | 6.1 | GO:0006449 | regulation of translational termination(GO:0006449) |
| 0.4 | 1.1 | GO:0030241 | skeletal muscle myosin thick filament assembly(GO:0030241) |
| 0.4 | 2.2 | GO:0009082 | branched-chain amino acid biosynthetic process(GO:0009082) leucine biosynthetic process(GO:0009098) valine biosynthetic process(GO:0009099) |
| 0.3 | 2.3 | GO:1904885 | beta-catenin destruction complex assembly(GO:1904885) |
| 0.3 | 4.7 | GO:0090084 | negative regulation of inclusion body assembly(GO:0090084) |
| 0.3 | 9.1 | GO:0000717 | nucleotide-excision repair, DNA duplex unwinding(GO:0000717) |
| 0.2 | 1.5 | GO:0046985 | positive regulation of hemoglobin biosynthetic process(GO:0046985) |
| 0.2 | 6.7 | GO:0061003 | positive regulation of dendritic spine morphogenesis(GO:0061003) |
| 0.2 | 2.6 | GO:1990440 | positive regulation of transcription from RNA polymerase II promoter in response to endoplasmic reticulum stress(GO:1990440) |
| 0.2 | 2.4 | GO:0042355 | fucose catabolic process(GO:0019317) L-fucose metabolic process(GO:0042354) L-fucose catabolic process(GO:0042355) |
| 0.2 | 0.7 | GO:1903288 | protein transport into plasma membrane raft(GO:0044861) positive regulation of potassium ion import(GO:1903288) |
| 0.2 | 3.7 | GO:0043457 | regulation of cellular respiration(GO:0043457) |
| 0.1 | 1.9 | GO:0001867 | complement activation, lectin pathway(GO:0001867) |
| 0.1 | 4.8 | GO:0015893 | drug transport(GO:0015893) |
| 0.1 | 1.9 | GO:0031115 | negative regulation of microtubule polymerization(GO:0031115) |
| 0.1 | 3.9 | GO:0000462 | maturation of SSU-rRNA from tricistronic rRNA transcript (SSU-rRNA, 5.8S rRNA, LSU-rRNA)(GO:0000462) |
| 0.1 | 0.5 | GO:0002322 | B cell proliferation involved in immune response(GO:0002322) |
| 0.1 | 1.6 | GO:0060712 | spongiotrophoblast layer development(GO:0060712) |
| 0.1 | 1.5 | GO:0043517 | positive regulation of DNA damage response, signal transduction by p53 class mediator(GO:0043517) |
| 0.1 | 16.5 | GO:0008360 | regulation of cell shape(GO:0008360) |
| 0.1 | 2.5 | GO:0045104 | intermediate filament cytoskeleton organization(GO:0045104) |
| 0.0 | 3.6 | GO:0030032 | lamellipodium assembly(GO:0030032) |
| 0.0 | 0.6 | GO:0019388 | galactose catabolic process(GO:0019388) |
| 0.0 | 5.1 | GO:0006892 | post-Golgi vesicle-mediated transport(GO:0006892) |
| 0.0 | 0.2 | GO:0045726 | regulation of integrin biosynthetic process(GO:0045113) positive regulation of integrin biosynthetic process(GO:0045726) |
| 0.0 | 2.8 | GO:0031338 | regulation of vesicle fusion(GO:0031338) |
| 0.0 | 3.0 | GO:0006890 | retrograde vesicle-mediated transport, Golgi to ER(GO:0006890) |
| 0.0 | 0.2 | GO:0006065 | UDP-glucuronate biosynthetic process(GO:0006065) |
| 0.0 | 0.3 | GO:1903830 | magnesium ion transmembrane transport(GO:1903830) |
| 0.0 | 3.2 | GO:2000134 | negative regulation of G1/S transition of mitotic cell cycle(GO:2000134) |
| 0.0 | 1.8 | GO:0032204 | regulation of telomere maintenance(GO:0032204) |
| 0.0 | 0.8 | GO:0061615 | NADH regeneration(GO:0006735) glycolytic process through fructose-6-phosphate(GO:0061615) glycolytic process through glucose-6-phosphate(GO:0061620) canonical glycolysis(GO:0061621) glucose catabolic process to pyruvate(GO:0061718) |
| 0.0 | 1.4 | GO:0016575 | histone deacetylation(GO:0016575) |
Gene overrepresentation in cellular_component category:
| Log-likelihood per target | Total log-likelihood | Term | Description |
|---|---|---|---|
| 1.0 | 3.0 | GO:0005873 | plus-end kinesin complex(GO:0005873) |
| 0.8 | 3.9 | GO:0034388 | Pwp2p-containing subcomplex of 90S preribosome(GO:0034388) |
| 0.8 | 16.4 | GO:0017101 | aminoacyl-tRNA synthetase multienzyme complex(GO:0017101) |
| 0.7 | 4.7 | GO:0070852 | cell body fiber(GO:0070852) |
| 0.5 | 9.1 | GO:0000109 | nucleotide-excision repair complex(GO:0000109) |
| 0.2 | 2.3 | GO:1990909 | Wnt signalosome(GO:1990909) |
| 0.2 | 2.7 | GO:0005671 | Ada2/Gcn5/Ada3 transcription activator complex(GO:0005671) |
| 0.1 | 1.8 | GO:0005577 | fibrinogen complex(GO:0005577) |
| 0.1 | 0.8 | GO:0000015 | phosphopyruvate hydratase complex(GO:0000015) |
| 0.1 | 6.9 | GO:0031907 | peroxisomal matrix(GO:0005782) microbody lumen(GO:0031907) |
| 0.1 | 6.7 | GO:0010494 | cytoplasmic stress granule(GO:0010494) |
| 0.1 | 4.4 | GO:0045095 | keratin filament(GO:0045095) |
| 0.1 | 7.1 | GO:1904724 | tertiary granule lumen(GO:1904724) |
| 0.1 | 1.1 | GO:0035102 | PRC1 complex(GO:0035102) |
| 0.1 | 6.3 | GO:0016459 | myosin complex(GO:0016459) |
| 0.1 | 10.5 | GO:0034399 | nuclear periphery(GO:0034399) |
| 0.1 | 12.8 | GO:0005681 | spliceosomal complex(GO:0005681) |
| 0.0 | 4.2 | GO:0001725 | stress fiber(GO:0001725) contractile actin filament bundle(GO:0097517) |
| 0.0 | 1.9 | GO:0043198 | dendritic shaft(GO:0043198) |
| 0.0 | 2.3 | GO:0016235 | aggresome(GO:0016235) |
| 0.0 | 0.7 | GO:0005890 | sodium:potassium-exchanging ATPase complex(GO:0005890) |
| 0.0 | 2.4 | GO:0032580 | Golgi cisterna membrane(GO:0032580) |
| 0.0 | 1.4 | GO:0005876 | spindle microtubule(GO:0005876) |
| 0.0 | 3.0 | GO:0101002 | ficolin-1-rich granule(GO:0101002) ficolin-1-rich granule lumen(GO:1904813) |
| 0.0 | 1.3 | GO:0031526 | brush border membrane(GO:0031526) |
| 0.0 | 3.7 | GO:0005741 | mitochondrial outer membrane(GO:0005741) |
| 0.0 | 0.2 | GO:0043020 | NADPH oxidase complex(GO:0043020) |
| 0.0 | 4.2 | GO:0043209 | myelin sheath(GO:0043209) |
| 0.0 | 2.8 | GO:0090575 | RNA polymerase II transcription factor complex(GO:0090575) |
Gene overrepresentation in molecular_function category:
| Log-likelihood per target | Total log-likelihood | Term | Description |
|---|---|---|---|
| 5.5 | 16.4 | GO:0004822 | isoleucine-tRNA ligase activity(GO:0004822) |
| 1.9 | 9.3 | GO:0030060 | L-malate dehydrogenase activity(GO:0030060) |
| 1.2 | 5.9 | GO:0004523 | RNA-DNA hybrid ribonuclease activity(GO:0004523) |
| 1.1 | 6.9 | GO:0033989 | 3alpha,7alpha,12alpha-trihydroxy-5beta-cholest-24-enoyl-CoA hydratase activity(GO:0033989) 17-beta-hydroxysteroid dehydrogenase (NAD+) activity(GO:0044594) |
| 1.1 | 5.7 | GO:0004647 | phosphoserine phosphatase activity(GO:0004647) |
| 1.0 | 6.1 | GO:0008079 | translation release factor activity(GO:0003747) translation termination factor activity(GO:0008079) |
| 1.0 | 3.0 | GO:0004813 | alanine-tRNA ligase activity(GO:0004813) |
| 0.9 | 7.1 | GO:0001849 | complement component C1q binding(GO:0001849) |
| 0.7 | 4.2 | GO:0060698 | endoribonuclease inhibitor activity(GO:0060698) |
| 0.5 | 1.5 | GO:0061629 | RNA polymerase II sequence-specific DNA binding transcription factor binding(GO:0061629) |
| 0.5 | 5.1 | GO:0004568 | chitinase activity(GO:0004568) chitin binding(GO:0008061) |
| 0.4 | 8.9 | GO:0008483 | transaminase activity(GO:0008483) |
| 0.4 | 4.8 | GO:0019534 | toxin transporter activity(GO:0019534) |
| 0.4 | 3.2 | GO:0050692 | DBD domain binding(GO:0050692) |
| 0.2 | 4.7 | GO:0070628 | proteasome binding(GO:0070628) |
| 0.2 | 5.1 | GO:0030898 | actin-dependent ATPase activity(GO:0030898) |
| 0.2 | 9.1 | GO:0031593 | polyubiquitin binding(GO:0031593) |
| 0.2 | 12.8 | GO:0030374 | ligand-dependent nuclear receptor transcription coactivator activity(GO:0030374) |
| 0.2 | 1.9 | GO:0004445 | inositol-polyphosphate 5-phosphatase activity(GO:0004445) phosphatidylinositol-3,4,5-trisphosphate 5-phosphatase activity(GO:0034485) |
| 0.2 | 7.4 | GO:0008139 | nuclear localization sequence binding(GO:0008139) |
| 0.2 | 3.7 | GO:0051537 | 2 iron, 2 sulfur cluster binding(GO:0051537) |
| 0.2 | 5.8 | GO:0008301 | DNA binding, bending(GO:0008301) |
| 0.2 | 2.4 | GO:0008417 | fucosyltransferase activity(GO:0008417) |
| 0.2 | 2.3 | GO:0045295 | gamma-catenin binding(GO:0045295) |
| 0.1 | 1.5 | GO:0030274 | LIM domain binding(GO:0030274) |
| 0.1 | 4.2 | GO:0005388 | calcium-transporting ATPase activity(GO:0005388) |
| 0.1 | 3.9 | GO:0030515 | snoRNA binding(GO:0030515) |
| 0.1 | 1.9 | GO:0030280 | structural constituent of epidermis(GO:0030280) |
| 0.1 | 0.8 | GO:0004634 | phosphopyruvate hydratase activity(GO:0004634) |
| 0.1 | 1.1 | GO:0031433 | telethonin binding(GO:0031433) |
| 0.1 | 2.6 | GO:0035259 | glucocorticoid receptor binding(GO:0035259) |
| 0.1 | 0.6 | GO:0004614 | phosphoglucomutase activity(GO:0004614) |
| 0.1 | 2.2 | GO:0015464 | acetylcholine receptor activity(GO:0015464) |
| 0.1 | 1.1 | GO:0019789 | SUMO transferase activity(GO:0019789) |
| 0.1 | 1.8 | GO:0042162 | telomeric DNA binding(GO:0042162) |
| 0.0 | 2.4 | GO:0005164 | tumor necrosis factor receptor binding(GO:0005164) |
| 0.0 | 0.7 | GO:0005391 | sodium:potassium-exchanging ATPase activity(GO:0005391) |
| 0.0 | 5.6 | GO:0003697 | single-stranded DNA binding(GO:0003697) |
| 0.0 | 0.2 | GO:0015252 | hydrogen ion channel activity(GO:0015252) |
| 0.0 | 0.3 | GO:0015095 | magnesium ion transmembrane transporter activity(GO:0015095) |
| 0.0 | 0.1 | GO:0005171 | hepatocyte growth factor receptor binding(GO:0005171) |
| 0.0 | 1.1 | GO:0016504 | peptidase activator activity(GO:0016504) |
| 0.0 | 0.2 | GO:0015165 | pyrimidine nucleotide-sugar transmembrane transporter activity(GO:0015165) |
| 0.0 | 4.4 | GO:0004721 | phosphoprotein phosphatase activity(GO:0004721) |
| 0.0 | 1.7 | GO:0003777 | microtubule motor activity(GO:0003777) |
| 0.0 | 2.8 | GO:0017137 | Rab GTPase binding(GO:0017137) |
| 0.0 | 1.2 | GO:0004527 | exonuclease activity(GO:0004527) |
Gene overrepresentation in C2:CP category:
| Log-likelihood per target | Total log-likelihood | Term | Description |
|---|---|---|---|
| 0.4 | 16.4 | ST INTERLEUKIN 4 PATHWAY | Interleukin 4 (IL-4) Pathway |
| 0.2 | 9.4 | ST MYOCYTE AD PATHWAY | Myocyte Adrenergic Pathway is a specific case of the generalized Adrenergic Pathway. |
| 0.1 | 3.2 | PID SMAD2 3PATHWAY | Regulation of cytoplasmic and nuclear SMAD2/3 signaling |
| 0.1 | 2.6 | PID IL3 PATHWAY | IL3-mediated signaling events |
| 0.1 | 3.2 | PID WNT NONCANONICAL PATHWAY | Noncanonical Wnt signaling pathway |
| 0.1 | 1.8 | PID LYMPH ANGIOGENESIS PATHWAY | VEGFR3 signaling in lymphatic endothelium |
| 0.0 | 3.3 | PID BETA CATENIN NUC PATHWAY | Regulation of nuclear beta catenin signaling and target gene transcription |
| 0.0 | 2.2 | PID MYC ACTIV PATHWAY | Validated targets of C-MYC transcriptional activation |
| 0.0 | 1.1 | PID RB 1PATHWAY | Regulation of retinoblastoma protein |
| 0.0 | 2.2 | NABA ECM AFFILIATED | Genes encoding proteins affiliated structurally or functionally to extracellular matrix proteins |
Gene overrepresentation in C2:CP:REACTOME category:
| Log-likelihood per target | Total log-likelihood | Term | Description |
|---|---|---|---|
| 0.5 | 19.4 | REACTOME CYTOSOLIC TRNA AMINOACYLATION | Genes involved in Cytosolic tRNA aminoacylation |
| 0.4 | 12.3 | REACTOME AMINO ACID SYNTHESIS AND INTERCONVERSION TRANSAMINATION | Genes involved in Amino acid synthesis and interconversion (transamination) |
| 0.4 | 7.4 | REACTOME DESTABILIZATION OF MRNA BY TRISTETRAPROLIN TTP | Genes involved in Destabilization of mRNA by Tristetraprolin (TTP) |
| 0.4 | 6.9 | REACTOME ALPHA LINOLENIC ACID ALA METABOLISM | Genes involved in alpha-linolenic acid (ALA) metabolism |
| 0.3 | 9.1 | REACTOME FORMATION OF INCISION COMPLEX IN GG NER | Genes involved in Formation of incision complex in GG-NER |
| 0.2 | 10.0 | REACTOME GLUCONEOGENESIS | Genes involved in Gluconeogenesis |
| 0.1 | 1.8 | REACTOME P130CAS LINKAGE TO MAPK SIGNALING FOR INTEGRINS | Genes involved in p130Cas linkage to MAPK signaling for integrins |
| 0.1 | 3.6 | REACTOME DCC MEDIATED ATTRACTIVE SIGNALING | Genes involved in DCC mediated attractive signaling |
| 0.1 | 3.0 | REACTOME KINESINS | Genes involved in Kinesins |
| 0.1 | 5.0 | REACTOME ION TRANSPORT BY P TYPE ATPASES | Genes involved in Ion transport by P-type ATPases |
| 0.1 | 2.2 | REACTOME BRANCHED CHAIN AMINO ACID CATABOLISM | Genes involved in Branched-chain amino acid catabolism |
| 0.1 | 7.2 | REACTOME TRANSCRIPTIONAL REGULATION OF WHITE ADIPOCYTE DIFFERENTIATION | Genes involved in Transcriptional Regulation of White Adipocyte Differentiation |
| 0.1 | 1.3 | REACTOME CTNNB1 PHOSPHORYLATION CASCADE | Genes involved in Beta-catenin phosphorylation cascade |
| 0.0 | 1.9 | REACTOME SYNTHESIS OF PIPS AT THE PLASMA MEMBRANE | Genes involved in Synthesis of PIPs at the plasma membrane |
| 0.0 | 7.8 | REACTOME NONSENSE MEDIATED DECAY ENHANCED BY THE EXON JUNCTION COMPLEX | Genes involved in Nonsense Mediated Decay Enhanced by the Exon Junction Complex |
| 0.0 | 1.5 | REACTOME PPARA ACTIVATES GENE EXPRESSION | Genes involved in PPARA Activates Gene Expression |