Project
GNF SymAtlas + NCI-60 cancer cell lines, comparison of cancers vs non-cancers, human (Su, 2004; Ross, 2000)
Navigation
Downloads
Results for DLX3_EVX1_MEOX1
Z-value: 1.10
Motif logo
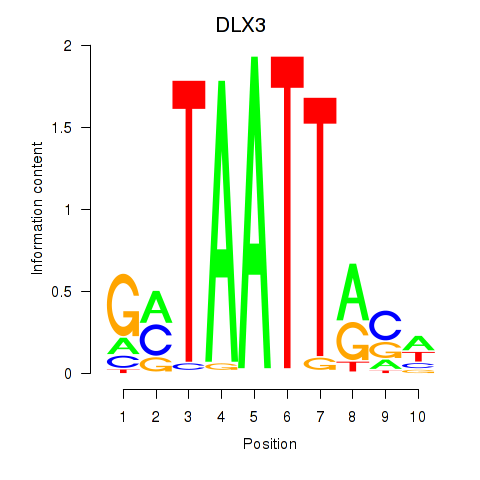

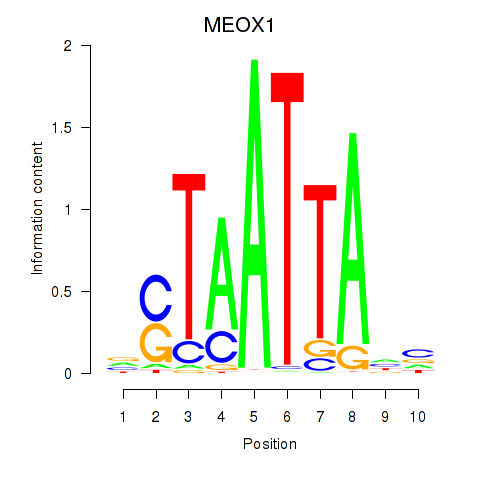
Transcription factors associated with DLX3_EVX1_MEOX1
| Gene Symbol | Gene ID | Gene Info |
|---|---|---|
|
DLX3
|
ENSG00000064195.7 | distal-less homeobox 3 |
|
EVX1
|
ENSG00000106038.8 | even-skipped homeobox 1 |
|
MEOX1
|
ENSG00000005102.8 | mesenchyme homeobox 1 |
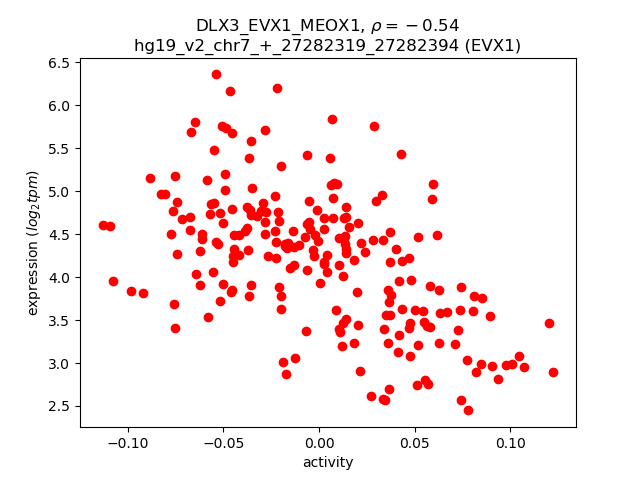
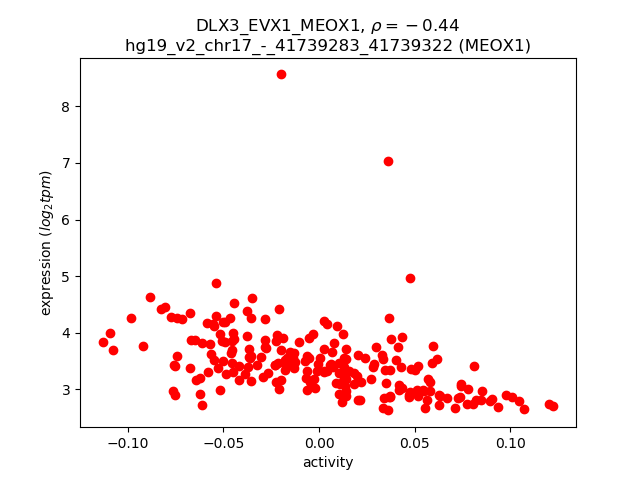
Activity-expression correlation:
| Gene | Promoter | Pearson corr. coef. | P-value | Plot |
|---|---|---|---|---|
| EVX1 | hg19_v2_chr7_+_27282319_27282394 | -0.54 | 4.8e-18 | Click! |
| MEOX1 | hg19_v2_chr17_-_41739283_41739322, hg19_v2_chr17_-_41738931_41739040 | -0.44 | 1.6e-11 | Click! |
Activity profile of DLX3_EVX1_MEOX1 motif
Sorted Z-values of DLX3_EVX1_MEOX1 motif
| Promoter | Log-likelihood | Transcript | Gene | Gene Info |
|---|---|---|---|---|
| chr18_-_33709268 | 24.36 |
ENST00000269187.5
ENST00000590986.1 ENST00000440549.2 |
SLC39A6
|
solute carrier family 39 (zinc transporter), member 6 |
| chr15_-_55563072 | 19.11 |
ENST00000567380.1
ENST00000565972.1 ENST00000569493.1 |
RAB27A
|
RAB27A, member RAS oncogene family |
| chr15_-_37393406 | 18.63 |
ENST00000338564.5
ENST00000558313.1 ENST00000340545.5 |
MEIS2
|
Meis homeobox 2 |
| chr8_-_101963677 | 16.33 |
ENST00000395956.3
ENST00000395953.2 |
YWHAZ
|
tyrosine 3-monooxygenase/tryptophan 5-monooxygenase activation protein, zeta |
| chr15_-_64673630 | 15.97 |
ENST00000558008.1
ENST00000559519.1 ENST00000380258.2 |
KIAA0101
|
KIAA0101 |
| chr15_-_55562479 | 15.58 |
ENST00000564609.1
|
RAB27A
|
RAB27A, member RAS oncogene family |
| chr8_-_101963482 | 15.36 |
ENST00000419477.2
|
YWHAZ
|
tyrosine 3-monooxygenase/tryptophan 5-monooxygenase activation protein, zeta |
| chr15_+_75080883 | 14.10 |
ENST00000567571.1
|
CSK
|
c-src tyrosine kinase |
| chr1_+_68150744 | 13.98 |
ENST00000370986.4
ENST00000370985.3 |
GADD45A
|
growth arrest and DNA-damage-inducible, alpha |
| chr12_+_28410128 | 13.49 |
ENST00000381259.1
ENST00000381256.1 |
CCDC91
|
coiled-coil domain containing 91 |
| chr12_-_56694142 | 13.25 |
ENST00000550655.1
ENST00000548567.1 ENST00000551430.2 ENST00000351328.3 |
CS
|
citrate synthase |
| chr16_-_29910853 | 11.86 |
ENST00000308713.5
|
SEZ6L2
|
seizure related 6 homolog (mouse)-like 2 |
| chr6_+_151646800 | 11.04 |
ENST00000354675.6
|
AKAP12
|
A kinase (PRKA) anchor protein 12 |
| chr1_-_197115818 | 9.96 |
ENST00000367409.4
ENST00000294732.7 |
ASPM
|
asp (abnormal spindle) homolog, microcephaly associated (Drosophila) |
| chr19_+_13049413 | 9.44 |
ENST00000316448.5
ENST00000588454.1 |
CALR
|
calreticulin |
| chr15_+_80351910 | 8.92 |
ENST00000261749.6
ENST00000561060.1 |
ZFAND6
|
zinc finger, AN1-type domain 6 |
| chr18_+_3447572 | 8.59 |
ENST00000548489.2
|
TGIF1
|
TGFB-induced factor homeobox 1 |
| chr6_+_52535878 | 8.21 |
ENST00000211314.4
|
TMEM14A
|
transmembrane protein 14A |
| chr7_+_116660246 | 8.11 |
ENST00000434836.1
ENST00000393443.1 ENST00000465133.1 ENST00000477742.1 ENST00000393447.4 ENST00000393444.3 |
ST7
|
suppression of tumorigenicity 7 |
| chr7_-_14029283 | 8.06 |
ENST00000433547.1
ENST00000405192.2 |
ETV1
|
ets variant 1 |
| chr7_-_99716952 | 7.83 |
ENST00000523306.1
ENST00000344095.4 ENST00000417349.1 ENST00000493322.1 ENST00000520135.1 ENST00000418432.2 ENST00000460673.2 ENST00000452041.1 ENST00000452438.2 ENST00000451699.1 ENST00000453269.2 |
TAF6
|
TAF6 RNA polymerase II, TATA box binding protein (TBP)-associated factor, 80kDa |
| chr5_-_148929848 | 7.48 |
ENST00000504676.1
ENST00000515435.1 |
CSNK1A1
|
casein kinase 1, alpha 1 |
| chr15_-_55562582 | 7.35 |
ENST00000396307.2
|
RAB27A
|
RAB27A, member RAS oncogene family |
| chr21_-_35899113 | 7.32 |
ENST00000492600.1
ENST00000481448.1 ENST00000381132.2 |
RCAN1
|
regulator of calcineurin 1 |
| chr2_+_171785012 | 7.27 |
ENST00000234160.4
|
GORASP2
|
golgi reassembly stacking protein 2, 55kDa |
| chr3_-_33686743 | 6.72 |
ENST00000333778.6
ENST00000539981.1 |
CLASP2
|
cytoplasmic linker associated protein 2 |
| chr15_-_64673665 | 6.62 |
ENST00000300035.4
|
KIAA0101
|
KIAA0101 |
| chr6_+_34204642 | 6.50 |
ENST00000347617.6
ENST00000401473.3 ENST00000311487.5 ENST00000447654.1 ENST00000395004.3 |
HMGA1
|
high mobility group AT-hook 1 |
| chr16_-_66864806 | 6.47 |
ENST00000566336.1
ENST00000394074.2 ENST00000563185.2 ENST00000359087.4 ENST00000379463.2 ENST00000565535.1 ENST00000290810.3 |
NAE1
|
NEDD8 activating enzyme E1 subunit 1 |
| chr3_+_159557637 | 6.41 |
ENST00000445224.2
|
SCHIP1
|
schwannomin interacting protein 1 |
| chrX_-_13835147 | 6.25 |
ENST00000493677.1
ENST00000355135.2 |
GPM6B
|
glycoprotein M6B |
| chr16_+_69345243 | 5.86 |
ENST00000254950.11
|
VPS4A
|
vacuolar protein sorting 4 homolog A (S. cerevisiae) |
| chr3_-_141747950 | 5.81 |
ENST00000497579.1
|
TFDP2
|
transcription factor Dp-2 (E2F dimerization partner 2) |
| chr20_+_3776371 | 5.80 |
ENST00000245960.5
|
CDC25B
|
cell division cycle 25B |
| chr7_-_99717463 | 5.77 |
ENST00000437822.2
|
TAF6
|
TAF6 RNA polymerase II, TATA box binding protein (TBP)-associated factor, 80kDa |
| chrX_-_118986911 | 5.67 |
ENST00000276201.2
ENST00000345865.2 |
UPF3B
|
UPF3 regulator of nonsense transcripts homolog B (yeast) |
| chr7_-_14028488 | 5.65 |
ENST00000405358.4
|
ETV1
|
ets variant 1 |
| chr11_-_107729887 | 5.57 |
ENST00000525815.1
|
SLC35F2
|
solute carrier family 35, member F2 |
| chr2_+_201754050 | 5.36 |
ENST00000426253.1
ENST00000416651.1 ENST00000454952.1 ENST00000409020.1 ENST00000359683.4 |
NIF3L1
|
NIF3 NGG1 interacting factor 3-like 1 (S. cerevisiae) |
| chr13_-_31191642 | 5.36 |
ENST00000405805.1
|
HMGB1
|
high mobility group box 1 |
| chr2_-_17981462 | 5.33 |
ENST00000402989.1
ENST00000428868.1 |
SMC6
|
structural maintenance of chromosomes 6 |
| chr4_+_174089904 | 5.30 |
ENST00000265000.4
|
GALNT7
|
UDP-N-acetyl-alpha-D-galactosamine:polypeptide N-acetylgalactosaminyltransferase 7 (GalNAc-T7) |
| chr5_+_115177178 | 5.22 |
ENST00000316788.7
|
AP3S1
|
adaptor-related protein complex 3, sigma 1 subunit |
| chr18_+_55888767 | 5.11 |
ENST00000431212.2
ENST00000586268.1 ENST00000587190.1 |
NEDD4L
|
neural precursor cell expressed, developmentally down-regulated 4-like, E3 ubiquitin protein ligase |
| chrX_-_77225135 | 5.09 |
ENST00000458128.1
|
PGAM4
|
phosphoglycerate mutase family member 4 |
| chr3_+_44840679 | 5.09 |
ENST00000425755.1
|
KIF15
|
kinesin family member 15 |
| chr2_+_201754135 | 4.96 |
ENST00000409357.1
ENST00000409129.2 |
NIF3L1
|
NIF3 NGG1 interacting factor 3-like 1 (S. cerevisiae) |
| chr8_+_110346546 | 4.82 |
ENST00000521662.1
ENST00000521688.1 ENST00000520147.1 |
ENY2
|
enhancer of yellow 2 homolog (Drosophila) |
| chr4_-_66536057 | 4.80 |
ENST00000273854.3
|
EPHA5
|
EPH receptor A5 |
| chr8_+_22424551 | 4.73 |
ENST00000523348.1
|
SORBS3
|
sorbin and SH3 domain containing 3 |
| chr1_-_68698197 | 4.70 |
ENST00000370973.2
ENST00000370971.1 |
WLS
|
wntless Wnt ligand secretion mediator |
| chr1_+_101003687 | 4.62 |
ENST00000315033.4
|
GPR88
|
G protein-coupled receptor 88 |
| chr1_-_68698222 | 4.61 |
ENST00000370976.3
ENST00000354777.2 ENST00000262348.4 ENST00000540432.1 |
WLS
|
wntless Wnt ligand secretion mediator |
| chr20_+_60174827 | 4.46 |
ENST00000543233.1
|
CDH4
|
cadherin 4, type 1, R-cadherin (retinal) |
| chr6_-_36515177 | 4.44 |
ENST00000229812.7
|
STK38
|
serine/threonine kinase 38 |
| chr6_+_39760129 | 4.41 |
ENST00000274867.4
|
DAAM2
|
dishevelled associated activator of morphogenesis 2 |
| chr13_-_46716969 | 4.41 |
ENST00000435666.2
|
LCP1
|
lymphocyte cytosolic protein 1 (L-plastin) |
| chr2_-_61697862 | 4.22 |
ENST00000398571.2
|
USP34
|
ubiquitin specific peptidase 34 |
| chr4_-_105416039 | 4.13 |
ENST00000394767.2
|
CXXC4
|
CXXC finger protein 4 |
| chr3_+_130569429 | 4.09 |
ENST00000505330.1
ENST00000504381.1 ENST00000507488.2 ENST00000393221.4 |
ATP2C1
|
ATPase, Ca++ transporting, type 2C, member 1 |
| chr4_-_66536196 | 4.02 |
ENST00000511294.1
|
EPHA5
|
EPH receptor A5 |
| chr13_-_95131923 | 4.01 |
ENST00000377028.5
ENST00000446125.1 |
DCT
|
dopachrome tautomerase |
| chr14_-_21737551 | 3.97 |
ENST00000554891.1
ENST00000555883.1 ENST00000553753.1 ENST00000555914.1 ENST00000557336.1 ENST00000555215.1 ENST00000556628.1 ENST00000555137.1 ENST00000556226.1 ENST00000555309.1 ENST00000556142.1 ENST00000554969.1 ENST00000554455.1 ENST00000556513.1 ENST00000557201.1 ENST00000420743.2 ENST00000557768.1 ENST00000553300.1 ENST00000554383.1 ENST00000554539.1 |
HNRNPC
|
heterogeneous nuclear ribonucleoprotein C (C1/C2) |
| chr4_-_139163491 | 3.88 |
ENST00000280612.5
|
SLC7A11
|
solute carrier family 7 (anionic amino acid transporter light chain, xc- system), member 11 |
| chr6_+_160211481 | 3.81 |
ENST00000367034.4
|
MRPL18
|
mitochondrial ribosomal protein L18 |
| chr2_-_86422095 | 3.80 |
ENST00000254636.5
|
IMMT
|
inner membrane protein, mitochondrial |
| chr17_-_77924627 | 3.75 |
ENST00000572862.1
ENST00000573782.1 ENST00000574427.1 ENST00000570373.1 ENST00000340848.7 ENST00000576768.1 |
TBC1D16
|
TBC1 domain family, member 16 |
| chr15_+_89631381 | 3.72 |
ENST00000352732.5
|
ABHD2
|
abhydrolase domain containing 2 |
| chr7_+_100860949 | 3.67 |
ENST00000305105.2
|
ZNHIT1
|
zinc finger, HIT-type containing 1 |
| chrX_-_16887963 | 3.67 |
ENST00000380084.4
|
RBBP7
|
retinoblastoma binding protein 7 |
| chr14_-_21737610 | 3.62 |
ENST00000320084.7
ENST00000449098.1 ENST00000336053.6 |
HNRNPC
|
heterogeneous nuclear ribonucleoprotein C (C1/C2) |
| chrX_-_23926004 | 3.53 |
ENST00000379226.4
ENST00000379220.3 |
APOO
|
apolipoprotein O |
| chr12_-_89746173 | 3.50 |
ENST00000308385.6
|
DUSP6
|
dual specificity phosphatase 6 |
| chr21_-_43346790 | 3.49 |
ENST00000329623.7
|
C2CD2
|
C2 calcium-dependent domain containing 2 |
| chrX_-_106243451 | 3.42 |
ENST00000355610.4
ENST00000535534.1 |
MORC4
|
MORC family CW-type zinc finger 4 |
| chr7_-_151217166 | 3.39 |
ENST00000496004.1
|
RHEB
|
Ras homolog enriched in brain |
| chr8_-_49834299 | 3.38 |
ENST00000396822.1
|
SNAI2
|
snail family zinc finger 2 |
| chr7_+_75931861 | 3.34 |
ENST00000248553.6
|
HSPB1
|
heat shock 27kDa protein 1 |
| chr3_-_47950745 | 3.28 |
ENST00000429422.1
|
MAP4
|
microtubule-associated protein 4 |
| chr10_+_114710211 | 3.19 |
ENST00000349937.2
ENST00000369397.4 |
TCF7L2
|
transcription factor 7-like 2 (T-cell specific, HMG-box) |
| chr1_+_230193521 | 3.11 |
ENST00000543760.1
|
GALNT2
|
UDP-N-acetyl-alpha-D-galactosamine:polypeptide N-acetylgalactosaminyltransferase 2 (GalNAc-T2) |
| chr10_+_85899196 | 3.09 |
ENST00000372134.3
|
GHITM
|
growth hormone inducible transmembrane protein |
| chr2_-_230786679 | 2.98 |
ENST00000543084.1
ENST00000343290.5 ENST00000389044.4 ENST00000283943.5 |
TRIP12
|
thyroid hormone receptor interactor 12 |
| chr15_-_31393910 | 2.96 |
ENST00000397795.2
ENST00000256552.6 ENST00000559179.1 |
TRPM1
|
transient receptor potential cation channel, subfamily M, member 1 |
| chr22_-_41682172 | 2.93 |
ENST00000356244.3
|
RANGAP1
|
Ran GTPase activating protein 1 |
| chr6_-_111804905 | 2.91 |
ENST00000358835.3
ENST00000435970.1 |
REV3L
|
REV3-like, polymerase (DNA directed), zeta, catalytic subunit |
| chr4_+_41614909 | 2.90 |
ENST00000509454.1
ENST00000396595.3 ENST00000381753.4 |
LIMCH1
|
LIM and calponin homology domains 1 |
| chr2_-_230786619 | 2.80 |
ENST00000389045.3
ENST00000409677.1 |
TRIP12
|
thyroid hormone receptor interactor 12 |
| chr4_+_41614720 | 2.70 |
ENST00000509277.1
|
LIMCH1
|
LIM and calponin homology domains 1 |
| chr2_-_37544209 | 2.70 |
ENST00000234179.2
|
PRKD3
|
protein kinase D3 |
| chr1_-_151431647 | 2.58 |
ENST00000368863.2
ENST00000409503.1 ENST00000491586.1 ENST00000533351.1 ENST00000540984.1 |
POGZ
|
pogo transposable element with ZNF domain |
| chr6_-_87804815 | 2.57 |
ENST00000369582.2
|
CGA
|
glycoprotein hormones, alpha polypeptide |
| chr1_+_236958554 | 2.51 |
ENST00000366577.5
ENST00000418145.2 |
MTR
|
5-methyltetrahydrofolate-homocysteine methyltransferase |
| chr5_-_142780280 | 2.50 |
ENST00000424646.2
|
NR3C1
|
nuclear receptor subfamily 3, group C, member 1 (glucocorticoid receptor) |
| chrM_+_12331 | 2.49 |
ENST00000361567.2
|
MT-ND5
|
mitochondrially encoded NADH dehydrogenase 5 |
| chr6_-_111927062 | 2.39 |
ENST00000359831.4
|
TRAF3IP2
|
TRAF3 interacting protein 2 |
| chr11_-_95657231 | 2.37 |
ENST00000409459.1
ENST00000352297.7 ENST00000393223.3 ENST00000346299.5 |
MTMR2
|
myotubularin related protein 2 |
| chr19_+_11071546 | 2.34 |
ENST00000358026.2
|
SMARCA4
|
SWI/SNF related, matrix associated, actin dependent regulator of chromatin, subfamily a, member 4 |
| chr3_+_111717600 | 2.32 |
ENST00000273368.4
|
TAGLN3
|
transgelin 3 |
| chr8_-_103424986 | 2.26 |
ENST00000521922.1
|
UBR5
|
ubiquitin protein ligase E3 component n-recognin 5 |
| chr15_+_96869165 | 2.23 |
ENST00000421109.2
|
NR2F2
|
nuclear receptor subfamily 2, group F, member 2 |
| chr3_-_47934234 | 2.21 |
ENST00000420772.2
|
MAP4
|
microtubule-associated protein 4 |
| chr17_-_27418537 | 2.18 |
ENST00000408971.2
|
TIAF1
|
TGFB1-induced anti-apoptotic factor 1 |
| chr14_+_22739823 | 2.15 |
ENST00000390464.2
|
TRAV38-1
|
T cell receptor alpha variable 38-1 |
| chr17_-_60142609 | 2.10 |
ENST00000397786.2
|
MED13
|
mediator complex subunit 13 |
| chr17_-_10017864 | 2.08 |
ENST00000323816.4
|
GAS7
|
growth arrest-specific 7 |
| chr8_-_49833978 | 2.06 |
ENST00000020945.1
|
SNAI2
|
snail family zinc finger 2 |
| chr3_+_111717511 | 2.06 |
ENST00000478951.1
ENST00000393917.2 |
TAGLN3
|
transgelin 3 |
| chr7_-_25019760 | 2.02 |
ENST00000352860.1
ENST00000353930.1 ENST00000431825.2 ENST00000313367.2 |
OSBPL3
|
oxysterol binding protein-like 3 |
| chr17_+_60536002 | 2.00 |
ENST00000582809.1
|
TLK2
|
tousled-like kinase 2 |
| chr15_+_80351977 | 1.95 |
ENST00000559157.1
ENST00000561012.1 ENST00000564367.1 ENST00000558494.1 |
ZFAND6
|
zinc finger, AN1-type domain 6 |
| chr12_+_15699286 | 1.94 |
ENST00000442921.2
ENST00000542557.1 ENST00000445537.2 ENST00000544244.1 |
PTPRO
|
protein tyrosine phosphatase, receptor type, O |
| chr4_+_169013666 | 1.88 |
ENST00000359299.3
|
ANXA10
|
annexin A10 |
| chr14_+_64680854 | 1.82 |
ENST00000458046.2
|
SYNE2
|
spectrin repeat containing, nuclear envelope 2 |
| chr12_-_10978957 | 1.76 |
ENST00000240619.2
|
TAS2R10
|
taste receptor, type 2, member 10 |
| chr3_+_111718173 | 1.76 |
ENST00000494932.1
|
TAGLN3
|
transgelin 3 |
| chr12_+_54378923 | 1.74 |
ENST00000303460.4
|
HOXC10
|
homeobox C10 |
| chr1_-_101491319 | 1.69 |
ENST00000342173.7
ENST00000488176.1 ENST00000370109.3 |
DPH5
|
diphthamide biosynthesis 5 |
| chr8_-_103424916 | 1.68 |
ENST00000220959.4
|
UBR5
|
ubiquitin protein ligase E3 component n-recognin 5 |
| chr10_-_48416849 | 1.66 |
ENST00000249598.1
|
GDF2
|
growth differentiation factor 2 |
| chr12_-_118628350 | 1.61 |
ENST00000537952.1
ENST00000537822.1 |
TAOK3
|
TAO kinase 3 |
| chr1_-_10532531 | 1.61 |
ENST00000377036.2
ENST00000377038.3 |
DFFA
|
DNA fragmentation factor, 45kDa, alpha polypeptide |
| chr6_+_46761118 | 1.52 |
ENST00000230588.4
|
MEP1A
|
meprin A, alpha (PABA peptide hydrolase) |
| chr1_-_67266939 | 1.51 |
ENST00000304526.2
|
INSL5
|
insulin-like 5 |
| chr2_-_224467093 | 1.50 |
ENST00000305409.2
|
SCG2
|
secretogranin II |
| chr6_-_55739542 | 1.50 |
ENST00000446683.2
|
BMP5
|
bone morphogenetic protein 5 |
| chr10_-_101690650 | 1.49 |
ENST00000543621.1
|
DNMBP
|
dynamin binding protein |
| chr10_+_35484793 | 1.46 |
ENST00000488741.1
ENST00000474931.1 ENST00000468236.1 ENST00000344351.5 ENST00000490511.1 |
CREM
|
cAMP responsive element modulator |
| chr1_-_151431909 | 1.46 |
ENST00000361398.3
ENST00000271715.2 |
POGZ
|
pogo transposable element with ZNF domain |
| chr1_-_190446759 | 1.28 |
ENST00000367462.3
|
BRINP3
|
bone morphogenetic protein/retinoic acid inducible neural-specific 3 |
| chr3_+_157828152 | 1.21 |
ENST00000476899.1
|
RSRC1
|
arginine/serine-rich coiled-coil 1 |
| chr22_-_30960876 | 1.14 |
ENST00000401975.1
ENST00000428682.1 ENST00000423299.1 |
GAL3ST1
|
galactose-3-O-sulfotransferase 1 |
| chr8_-_17533838 | 1.09 |
ENST00000400046.1
|
MTUS1
|
microtubule associated tumor suppressor 1 |
| chr12_-_121454148 | 1.03 |
ENST00000535367.1
ENST00000538296.1 ENST00000445832.3 ENST00000536407.2 ENST00000366211.2 ENST00000539736.1 ENST00000288757.3 ENST00000537817.1 |
C12orf43
|
chromosome 12 open reading frame 43 |
| chr3_+_115342349 | 1.02 |
ENST00000393780.3
|
GAP43
|
growth associated protein 43 |
| chr17_-_48785216 | 1.00 |
ENST00000285243.6
|
ANKRD40
|
ankyrin repeat domain 40 |
| chr12_-_53171128 | 0.99 |
ENST00000332411.2
|
KRT76
|
keratin 76 |
| chr6_-_109702885 | 0.99 |
ENST00000504373.1
|
CD164
|
CD164 molecule, sialomucin |
| chr8_-_103425047 | 0.99 |
ENST00000520539.1
|
UBR5
|
ubiquitin protein ligase E3 component n-recognin 5 |
| chr14_-_78083112 | 0.98 |
ENST00000216484.2
|
SPTLC2
|
serine palmitoyltransferase, long chain base subunit 2 |
| chr14_+_74034310 | 0.93 |
ENST00000538782.1
|
ACOT2
|
acyl-CoA thioesterase 2 |
| chr6_-_111927449 | 0.92 |
ENST00000368761.5
ENST00000392556.4 ENST00000340026.6 |
TRAF3IP2
|
TRAF3 interacting protein 2 |
| chr5_+_140625147 | 0.92 |
ENST00000231173.3
|
PCDHB15
|
protocadherin beta 15 |
| chrX_-_72434628 | 0.91 |
ENST00000536638.1
ENST00000373517.3 |
NAP1L2
|
nucleosome assembly protein 1-like 2 |
| chr5_-_16509101 | 0.91 |
ENST00000399793.2
|
FAM134B
|
family with sequence similarity 134, member B |
| chr3_-_195538760 | 0.88 |
ENST00000475231.1
|
MUC4
|
mucin 4, cell surface associated |
| chrX_+_105855160 | 0.87 |
ENST00000372544.2
ENST00000372548.4 |
CXorf57
|
chromosome X open reading frame 57 |
| chr15_+_64680003 | 0.84 |
ENST00000261884.3
|
TRIP4
|
thyroid hormone receptor interactor 4 |
| chr9_-_13165457 | 0.82 |
ENST00000542239.1
ENST00000538841.1 ENST00000433359.2 |
MPDZ
|
multiple PDZ domain protein |
| chr11_-_70672645 | 0.82 |
ENST00000423696.2
|
SHANK2
|
SH3 and multiple ankyrin repeat domains 2 |
| chr7_-_151217001 | 0.77 |
ENST00000262187.5
|
RHEB
|
Ras homolog enriched in brain |
| chr20_+_30697298 | 0.74 |
ENST00000398022.2
|
TM9SF4
|
transmembrane 9 superfamily protein member 4 |
| chr4_-_39979576 | 0.72 |
ENST00000303538.8
ENST00000503396.1 |
PDS5A
|
PDS5, regulator of cohesion maintenance, homolog A (S. cerevisiae) |
| chr12_-_14849470 | 0.72 |
ENST00000261170.3
|
GUCY2C
|
guanylate cyclase 2C (heat stable enterotoxin receptor) |
| chrX_-_100129128 | 0.67 |
ENST00000372960.4
ENST00000372964.1 ENST00000217885.5 |
NOX1
|
NADPH oxidase 1 |
| chr20_+_45947246 | 0.64 |
ENST00000599904.1
|
AL031666.2
|
HCG2018772; Uncharacterized protein; cDNA FLJ31609 fis, clone NT2RI2002852 |
| chr4_+_144354644 | 0.61 |
ENST00000512843.1
|
GAB1
|
GRB2-associated binding protein 1 |
| chr1_+_50575292 | 0.60 |
ENST00000371821.1
ENST00000371819.1 |
ELAVL4
|
ELAV like neuron-specific RNA binding protein 4 |
| chrX_+_7137475 | 0.57 |
ENST00000217961.4
|
STS
|
steroid sulfatase (microsomal), isozyme S |
| chr13_-_45010939 | 0.55 |
ENST00000261489.2
|
TSC22D1
|
TSC22 domain family, member 1 |
| chr4_-_87028478 | 0.54 |
ENST00000515400.1
ENST00000395157.3 |
MAPK10
|
mitogen-activated protein kinase 10 |
| chr20_+_18488137 | 0.48 |
ENST00000450074.1
ENST00000262544.2 ENST00000336714.3 ENST00000377475.3 |
SEC23B
|
Sec23 homolog B (S. cerevisiae) |
| chr1_-_94586651 | 0.47 |
ENST00000535735.1
ENST00000370225.3 |
ABCA4
|
ATP-binding cassette, sub-family A (ABC1), member 4 |
| chr2_-_99279928 | 0.47 |
ENST00000414521.2
|
MGAT4A
|
mannosyl (alpha-1,3-)-glycoprotein beta-1,4-N-acetylglucosaminyltransferase, isozyme A |
| chr20_+_18447771 | 0.44 |
ENST00000377603.4
|
POLR3F
|
polymerase (RNA) III (DNA directed) polypeptide F, 39 kDa |
| chr16_-_67517716 | 0.42 |
ENST00000290953.2
|
AGRP
|
agouti related protein homolog (mouse) |
| chr3_-_108248169 | 0.39 |
ENST00000273353.3
|
MYH15
|
myosin, heavy chain 15 |
| chr14_-_37051798 | 0.39 |
ENST00000258829.5
|
NKX2-8
|
NK2 homeobox 8 |
| chr5_+_174151536 | 0.38 |
ENST00000239243.6
ENST00000507785.1 |
MSX2
|
msh homeobox 2 |
| chr3_-_195538728 | 0.35 |
ENST00000349607.4
ENST00000346145.4 |
MUC4
|
mucin 4, cell surface associated |
| chr11_+_20620946 | 0.33 |
ENST00000525748.1
|
SLC6A5
|
solute carrier family 6 (neurotransmitter transporter), member 5 |
| chr12_-_68619586 | 0.30 |
ENST00000229134.4
|
IL26
|
interleukin 26 |
| chr4_-_155533787 | 0.30 |
ENST00000407946.1
ENST00000405164.1 ENST00000336098.3 ENST00000393846.2 ENST00000404648.3 ENST00000443553.1 |
FGG
|
fibrinogen gamma chain |
| chr4_-_74486217 | 0.28 |
ENST00000335049.5
ENST00000307439.5 |
RASSF6
|
Ras association (RalGDS/AF-6) domain family member 6 |
| chr2_-_55647057 | 0.28 |
ENST00000436346.1
|
CCDC88A
|
coiled-coil domain containing 88A |
| chr12_-_14133053 | 0.27 |
ENST00000609686.1
|
GRIN2B
|
glutamate receptor, ionotropic, N-methyl D-aspartate 2B |
| chr12_+_41831485 | 0.22 |
ENST00000539469.2
ENST00000298919.7 |
PDZRN4
|
PDZ domain containing ring finger 4 |
| chr11_-_102709441 | 0.22 |
ENST00000434103.1
|
MMP3
|
matrix metallopeptidase 3 (stromelysin 1, progelatinase) |
| chr3_+_152879985 | 0.20 |
ENST00000323534.2
|
RAP2B
|
RAP2B, member of RAS oncogene family |
| chr7_-_83824169 | 0.19 |
ENST00000265362.4
|
SEMA3A
|
sema domain, immunoglobulin domain (Ig), short basic domain, secreted, (semaphorin) 3A |
| chr3_-_151034734 | 0.16 |
ENST00000260843.4
|
GPR87
|
G protein-coupled receptor 87 |
| chr17_-_39677971 | 0.16 |
ENST00000393976.2
|
KRT15
|
keratin 15 |
| chr15_+_89631647 | 0.13 |
ENST00000569550.1
ENST00000565066.1 ENST00000565973.1 |
ABHD2
|
abhydrolase domain containing 2 |
| chr18_-_71959159 | 0.10 |
ENST00000494131.2
ENST00000397914.4 ENST00000340533.4 |
CYB5A
|
cytochrome b5 type A (microsomal) |
| chrX_-_110655306 | 0.10 |
ENST00000371993.2
|
DCX
|
doublecortin |
| chr8_+_32579341 | 0.07 |
ENST00000519240.1
ENST00000539990.1 |
NRG1
|
neuregulin 1 |
| chr15_-_68497657 | 0.07 |
ENST00000448060.2
ENST00000467889.1 |
CALML4
|
calmodulin-like 4 |
| chr7_+_73245193 | 0.06 |
ENST00000340958.2
|
CLDN4
|
claudin 4 |
| chr17_-_64225508 | 0.05 |
ENST00000205948.6
|
APOH
|
apolipoprotein H (beta-2-glycoprotein I) |
| chr6_-_111136513 | 0.04 |
ENST00000368911.3
|
CDK19
|
cyclin-dependent kinase 19 |
| chr2_-_207082748 | 0.03 |
ENST00000407325.2
ENST00000411719.1 |
GPR1
|
G protein-coupled receptor 1 |
| chr2_-_55646957 | 0.03 |
ENST00000263630.8
|
CCDC88A
|
coiled-coil domain containing 88A |
| chr12_-_86650077 | 0.03 |
ENST00000552808.2
ENST00000547225.1 |
MGAT4C
|
mannosyl (alpha-1,3-)-glycoprotein beta-1,4-N-acetylglucosaminyltransferase, isozyme C (putative) |
| chr17_-_33446735 | 0.03 |
ENST00000460118.2
ENST00000335858.7 |
RAD51D
|
RAD51 paralog D |
Network of associatons between targets according to the STRING database.

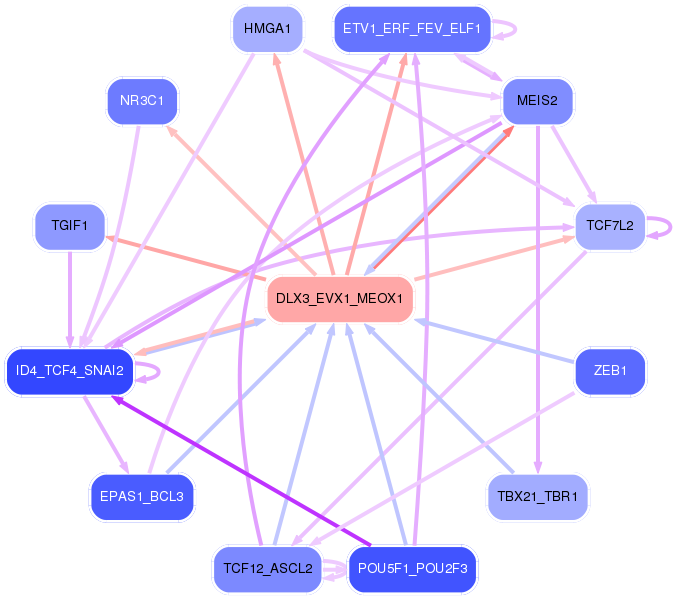
First level regulatory network of DLX3_EVX1_MEOX1
Gene Ontology Analysis
Gene overrepresentation in biological_process category:
| Log-likelihood per target | Total log-likelihood | Term | Description |
|---|---|---|---|
| 7.0 | 42.0 | GO:1903435 | positive regulation of constitutive secretory pathway(GO:1903435) |
| 3.1 | 9.3 | GO:0061357 | positive regulation of Wnt protein secretion(GO:0061357) |
| 2.8 | 14.1 | GO:0042997 | negative regulation of Golgi to plasma membrane protein transport(GO:0042997) |
| 2.7 | 2.7 | GO:0089700 | protein kinase D signaling(GO:0089700) |
| 2.4 | 24.4 | GO:0071578 | zinc II ion transmembrane import(GO:0071578) |
| 2.1 | 31.7 | GO:0090168 | Golgi reassembly(GO:0090168) |
| 2.0 | 5.9 | GO:0090611 | mitotic cytokinesis checkpoint(GO:0044878) ubiquitin-independent protein catabolic process via the multivesicular body sorting pathway(GO:0090611) |
| 1.8 | 5.4 | GO:0070563 | negative regulation of vitamin D receptor signaling pathway(GO:0070563) |
| 1.7 | 10.0 | GO:0051661 | maintenance of centrosome location(GO:0051661) |
| 1.6 | 6.5 | GO:0090402 | oncogene-induced cell senescence(GO:0090402) |
| 1.6 | 9.4 | GO:0002501 | peptide antigen assembly with MHC protein complex(GO:0002501) |
| 1.5 | 10.7 | GO:1901314 | negative regulation of histone ubiquitination(GO:0033183) negative regulation of protein K63-linked ubiquitination(GO:1900045) regulation of histone H2A K63-linked ubiquitination(GO:1901314) negative regulation of histone H2A K63-linked ubiquitination(GO:1901315) negative regulation of protein polyubiquitination(GO:1902915) |
| 1.3 | 5.4 | GO:0032072 | plasmacytoid dendritic cell activation(GO:0002270) T cell mediated immune response to tumor cell(GO:0002424) regulation of T cell mediated immune response to tumor cell(GO:0002840) regulation of restriction endodeoxyribonuclease activity(GO:0032072) negative regulation of apoptotic cell clearance(GO:2000426) |
| 1.3 | 6.5 | GO:0033314 | mitotic DNA replication checkpoint(GO:0033314) |
| 1.3 | 5.1 | GO:0043456 | regulation of pentose-phosphate shunt(GO:0043456) |
| 1.3 | 3.8 | GO:0035928 | rRNA import into mitochondrion(GO:0035928) |
| 1.2 | 3.5 | GO:1903224 | regulation of endodermal cell differentiation(GO:1903224) |
| 1.2 | 4.6 | GO:0061743 | motor learning(GO:0061743) |
| 1.1 | 13.5 | GO:0090160 | Golgi to lysosome transport(GO:0090160) |
| 1.1 | 7.5 | GO:1904885 | beta-catenin destruction complex assembly(GO:1904885) |
| 1.0 | 5.1 | GO:2001288 | positive regulation of caveolin-mediated endocytosis(GO:2001288) |
| 0.9 | 5.5 | GO:0051012 | microtubule sliding(GO:0051012) |
| 0.8 | 6.7 | GO:1903690 | negative regulation of wound healing, spreading of epidermal cells(GO:1903690) |
| 0.8 | 3.3 | GO:0099640 | axo-dendritic protein transport(GO:0099640) |
| 0.8 | 3.1 | GO:0018242 | protein O-linked glycosylation via serine(GO:0018242) |
| 0.8 | 14.0 | GO:0071850 | mitotic cell cycle arrest(GO:0071850) |
| 0.7 | 3.7 | GO:0070370 | heat acclimation(GO:0010286) cellular heat acclimation(GO:0070370) |
| 0.7 | 10.4 | GO:0010739 | positive regulation of protein kinase A signaling(GO:0010739) |
| 0.7 | 4.1 | GO:0007352 | zygotic specification of dorsal/ventral axis(GO:0007352) |
| 0.7 | 4.1 | GO:0032468 | Golgi calcium ion homeostasis(GO:0032468) |
| 0.6 | 1.9 | GO:0036058 | filtration diaphragm assembly(GO:0036058) slit diaphragm assembly(GO:0036060) |
| 0.6 | 6.2 | GO:0051581 | negative regulation of neurotransmitter uptake(GO:0051581) serotonin uptake(GO:0051610) regulation of serotonin uptake(GO:0051611) negative regulation of serotonin uptake(GO:0051612) |
| 0.6 | 2.4 | GO:2000645 | negative regulation of receptor catabolic process(GO:2000645) |
| 0.6 | 5.8 | GO:0007144 | female meiosis I(GO:0007144) |
| 0.6 | 4.0 | GO:0021847 | ventricular zone neuroblast division(GO:0021847) |
| 0.6 | 2.2 | GO:0009956 | radial pattern formation(GO:0009956) |
| 0.6 | 4.4 | GO:0009799 | determination of left/right symmetry(GO:0007368) specification of symmetry(GO:0009799) determination of bilateral symmetry(GO:0009855) |
| 0.5 | 1.6 | GO:1903625 | negative regulation of DNA catabolic process(GO:1903625) |
| 0.5 | 5.3 | GO:0000722 | telomere maintenance via recombination(GO:0000722) |
| 0.5 | 4.2 | GO:2000074 | regulation of type B pancreatic cell development(GO:2000074) |
| 0.5 | 4.8 | GO:0061179 | negative regulation of insulin secretion involved in cellular response to glucose stimulus(GO:0061179) |
| 0.5 | 2.3 | GO:0007068 | negative regulation of transcription during mitosis(GO:0007068) negative regulation of transcription from RNA polymerase II promoter during mitosis(GO:0007070) |
| 0.4 | 8.8 | GO:0032793 | positive regulation of CREB transcription factor activity(GO:0032793) |
| 0.4 | 10.9 | GO:0072663 | protein targeting to peroxisome(GO:0006625) protein localization to peroxisome(GO:0072662) establishment of protein localization to peroxisome(GO:0072663) |
| 0.4 | 1.2 | GO:0071676 | negative regulation of mononuclear cell migration(GO:0071676) |
| 0.4 | 1.9 | GO:2000253 | positive regulation of feeding behavior(GO:2000253) |
| 0.3 | 13.2 | GO:0006099 | tricarboxylic acid cycle(GO:0006099) |
| 0.3 | 1.0 | GO:1904502 | regulation of lipophagy(GO:1904502) positive regulation of lipophagy(GO:1904504) |
| 0.3 | 5.2 | GO:0099514 | anterograde synaptic vesicle transport(GO:0048490) synaptic vesicle cytoskeletal transport(GO:0099514) synaptic vesicle transport along microtubule(GO:0099517) |
| 0.3 | 8.1 | GO:0007638 | mechanosensory behavior(GO:0007638) |
| 0.3 | 7.6 | GO:0032211 | negative regulation of telomere maintenance via telomerase(GO:0032211) |
| 0.3 | 2.5 | GO:0043402 | glucocorticoid mediated signaling pathway(GO:0043402) |
| 0.3 | 4.0 | GO:0051382 | kinetochore assembly(GO:0051382) |
| 0.3 | 1.8 | GO:0031022 | nuclear migration along microfilament(GO:0031022) |
| 0.3 | 2.9 | GO:0046826 | negative regulation of protein export from nucleus(GO:0046826) |
| 0.3 | 4.4 | GO:0051639 | actin filament network formation(GO:0051639) |
| 0.3 | 18.5 | GO:0008542 | visual learning(GO:0008542) |
| 0.2 | 1.7 | GO:0021520 | spinal cord motor neuron cell fate specification(GO:0021520) |
| 0.2 | 2.0 | GO:0001672 | regulation of chromatin assembly or disassembly(GO:0001672) |
| 0.2 | 1.7 | GO:0017183 | peptidyl-diphthamide metabolic process(GO:0017182) peptidyl-diphthamide biosynthetic process from peptidyl-histidine(GO:0017183) |
| 0.2 | 3.9 | GO:0089711 | L-glutamate transmembrane transport(GO:0089711) |
| 0.2 | 3.7 | GO:0031063 | regulation of histone deacetylation(GO:0031063) |
| 0.2 | 4.2 | GO:0071108 | protein K48-linked deubiquitination(GO:0071108) |
| 0.2 | 0.4 | GO:0060364 | frontal suture morphogenesis(GO:0060364) |
| 0.2 | 7.3 | GO:0042407 | cristae formation(GO:0042407) |
| 0.2 | 0.9 | GO:2000035 | regulation of stem cell division(GO:2000035) |
| 0.2 | 3.0 | GO:0046548 | retinal rod cell development(GO:0046548) |
| 0.2 | 1.0 | GO:0016198 | axon choice point recognition(GO:0016198) |
| 0.2 | 0.7 | GO:0045112 | integrin biosynthetic process(GO:0045112) regulation of integrin biosynthetic process(GO:0045113) positive regulation of integrin biosynthetic process(GO:0045726) |
| 0.1 | 3.3 | GO:0002230 | positive regulation of defense response to virus by host(GO:0002230) |
| 0.1 | 2.5 | GO:0009086 | methionine biosynthetic process(GO:0009086) |
| 0.1 | 5.8 | GO:0000083 | regulation of transcription involved in G1/S transition of mitotic cell cycle(GO:0000083) |
| 0.1 | 1.1 | GO:0006682 | galactosylceramide biosynthetic process(GO:0006682) galactolipid biosynthetic process(GO:0019375) |
| 0.1 | 1.5 | GO:0048245 | eosinophil chemotaxis(GO:0048245) |
| 0.1 | 1.0 | GO:0048733 | sebaceous gland development(GO:0048733) |
| 0.1 | 6.5 | GO:0016266 | O-glycan processing(GO:0016266) |
| 0.1 | 2.9 | GO:0042276 | error-prone translesion synthesis(GO:0042276) |
| 0.1 | 3.0 | GO:0048240 | sperm capacitation(GO:0048240) |
| 0.1 | 3.7 | GO:0001919 | regulation of receptor recycling(GO:0001919) |
| 0.1 | 4.4 | GO:0070884 | regulation of calcineurin-NFAT signaling cascade(GO:0070884) |
| 0.1 | 5.4 | GO:0007157 | heterophilic cell-cell adhesion via plasma membrane cell adhesion molecules(GO:0007157) |
| 0.1 | 0.5 | GO:0007258 | JUN phosphorylation(GO:0007258) |
| 0.1 | 7.0 | GO:0009301 | snRNA transcription(GO:0009301) snRNA transcription from RNA polymerase II promoter(GO:0042795) |
| 0.1 | 0.3 | GO:1903566 | positive regulation of protein localization to cilium(GO:1903566) |
| 0.1 | 1.4 | GO:2000279 | negative regulation of DNA biosynthetic process(GO:2000279) |
| 0.1 | 5.7 | GO:0006369 | termination of RNA polymerase II transcription(GO:0006369) |
| 0.1 | 0.7 | GO:0007168 | receptor guanylyl cyclase signaling pathway(GO:0007168) |
| 0.1 | 1.8 | GO:0001580 | detection of chemical stimulus involved in sensory perception of bitter taste(GO:0001580) |
| 0.1 | 5.1 | GO:0006890 | retrograde vesicle-mediated transport, Golgi to ER(GO:0006890) |
| 0.1 | 0.7 | GO:0070072 | proton-transporting V-type ATPase complex assembly(GO:0070070) vacuolar proton-transporting V-type ATPase complex assembly(GO:0070072) |
| 0.1 | 2.6 | GO:0016486 | peptide hormone processing(GO:0016486) |
| 0.1 | 7.3 | GO:0007030 | Golgi organization(GO:0007030) |
| 0.1 | 4.2 | GO:0051496 | positive regulation of stress fiber assembly(GO:0051496) |
| 0.1 | 2.1 | GO:2000272 | negative regulation of receptor activity(GO:2000272) |
| 0.0 | 0.2 | GO:0048880 | sensory system development(GO:0048880) |
| 0.0 | 2.5 | GO:0006120 | mitochondrial electron transport, NADH to ubiquinone(GO:0006120) |
| 0.0 | 0.3 | GO:0015816 | glycine transport(GO:0015816) |
| 0.0 | 3.0 | GO:0043407 | negative regulation of MAP kinase activity(GO:0043407) |
| 0.0 | 0.8 | GO:0071625 | vocalization behavior(GO:0071625) |
| 0.0 | 1.6 | GO:0046329 | negative regulation of JNK cascade(GO:0046329) |
| 0.0 | 0.2 | GO:0010908 | regulation of heparan sulfate proteoglycan biosynthetic process(GO:0010908) positive regulation of heparan sulfate proteoglycan biosynthetic process(GO:0010909) canonical Wnt signaling pathway involved in positive regulation of epithelial to mesenchymal transition(GO:0044334) positive regulation of proteoglycan biosynthetic process(GO:1902730) |
| 0.0 | 0.9 | GO:0000038 | very long-chain fatty acid metabolic process(GO:0000038) |
| 0.0 | 2.0 | GO:0006687 | glycosphingolipid metabolic process(GO:0006687) |
| 0.0 | 0.7 | GO:0008156 | negative regulation of DNA replication(GO:0008156) |
| 0.0 | 0.2 | GO:0010727 | negative regulation of hydrogen peroxide metabolic process(GO:0010727) |
| 0.0 | 0.4 | GO:0006359 | regulation of transcription from RNA polymerase III promoter(GO:0006359) |
| 0.0 | 0.5 | GO:0006491 | N-glycan processing(GO:0006491) |
| 0.0 | 1.2 | GO:0000380 | alternative mRNA splicing, via spliceosome(GO:0000380) |
| 0.0 | 0.3 | GO:0090331 | negative regulation of platelet aggregation(GO:0090331) |
| 0.0 | 0.5 | GO:0045494 | photoreceptor cell maintenance(GO:0045494) |
| 0.0 | 0.6 | GO:0006397 | mRNA processing(GO:0006397) |
| 0.0 | 0.2 | GO:0032486 | Rap protein signal transduction(GO:0032486) establishment of endothelial intestinal barrier(GO:0090557) |
| 0.0 | 0.8 | GO:0030520 | intracellular estrogen receptor signaling pathway(GO:0030520) |
| 0.0 | 1.5 | GO:0035023 | regulation of Rho protein signal transduction(GO:0035023) |
Gene overrepresentation in cellular_component category:
| Log-likelihood per target | Total log-likelihood | Term | Description |
|---|---|---|---|
| 2.6 | 46.0 | GO:0033162 | melanosome membrane(GO:0033162) chitosome(GO:0045009) |
| 1.7 | 5.1 | GO:0005873 | plus-end kinesin complex(GO:0005873) |
| 1.4 | 10.0 | GO:0036449 | microtubule minus-end(GO:0036449) |
| 1.3 | 5.3 | GO:0030915 | Smc5-Smc6 complex(GO:0030915) |
| 1.2 | 9.4 | GO:0042824 | MHC class I peptide loading complex(GO:0042824) |
| 1.0 | 7.3 | GO:0061617 | MICOS complex(GO:0061617) |
| 0.8 | 4.8 | GO:0000124 | SAGA complex(GO:0000124) |
| 0.7 | 3.0 | GO:0035838 | growing cell tip(GO:0035838) |
| 0.7 | 13.6 | GO:0033276 | transcription factor TFTC complex(GO:0033276) |
| 0.7 | 6.7 | GO:0045180 | basal cortex(GO:0045180) |
| 0.7 | 26.2 | GO:0031258 | lamellipodium membrane(GO:0031258) |
| 0.6 | 7.5 | GO:0005847 | mRNA cleavage and polyadenylation specificity factor complex(GO:0005847) |
| 0.6 | 6.5 | GO:0035985 | senescence-associated heterochromatin focus(GO:0035985) |
| 0.5 | 2.9 | GO:0044614 | nuclear pore cytoplasmic filaments(GO:0044614) |
| 0.5 | 5.2 | GO:0030123 | AP-3 adaptor complex(GO:0030123) |
| 0.5 | 5.9 | GO:0000815 | ESCRT III complex(GO:0000815) |
| 0.3 | 9.3 | GO:0032839 | dendrite cytoplasm(GO:0032839) |
| 0.2 | 1.0 | GO:0031211 | serine C-palmitoyltransferase complex(GO:0017059) endoplasmic reticulum palmitoyltransferase complex(GO:0031211) |
| 0.2 | 3.0 | GO:0097524 | sperm plasma membrane(GO:0097524) |
| 0.2 | 4.4 | GO:0001891 | phagocytic cup(GO:0001891) |
| 0.2 | 2.9 | GO:0042575 | DNA polymerase complex(GO:0042575) |
| 0.2 | 1.0 | GO:0032584 | growth cone membrane(GO:0032584) |
| 0.2 | 5.1 | GO:0097228 | sperm principal piece(GO:0097228) |
| 0.2 | 5.7 | GO:0035145 | exon-exon junction complex(GO:0035145) |
| 0.2 | 1.7 | GO:0019907 | cyclin-dependent protein kinase activating kinase holoenzyme complex(GO:0019907) |
| 0.2 | 31.7 | GO:0042470 | melanosome(GO:0042470) pigment granule(GO:0048770) |
| 0.2 | 3.7 | GO:0000812 | Swr1 complex(GO:0000812) |
| 0.2 | 5.8 | GO:0005697 | telomerase holoenzyme complex(GO:0005697) |
| 0.1 | 3.7 | GO:0035098 | ESC/E(Z) complex(GO:0035098) |
| 0.1 | 2.0 | GO:0097038 | perinuclear endoplasmic reticulum(GO:0097038) |
| 0.1 | 12.0 | GO:0005791 | rough endoplasmic reticulum(GO:0005791) |
| 0.1 | 5.1 | GO:0005771 | multivesicular body(GO:0005771) |
| 0.1 | 0.7 | GO:0071438 | invadopodium membrane(GO:0071438) |
| 0.1 | 1.5 | GO:0031045 | dense core granule(GO:0031045) |
| 0.1 | 2.3 | GO:0071564 | npBAF complex(GO:0071564) |
| 0.1 | 3.8 | GO:0005762 | organellar large ribosomal subunit(GO:0000315) mitochondrial large ribosomal subunit(GO:0005762) |
| 0.1 | 3.3 | GO:1904115 | axon cytoplasm(GO:1904115) |
| 0.1 | 3.1 | GO:0030173 | integral component of Golgi membrane(GO:0030173) |
| 0.1 | 2.1 | GO:0016592 | mediator complex(GO:0016592) |
| 0.1 | 5.5 | GO:0097014 | axoneme(GO:0005930) ciliary plasm(GO:0097014) |
| 0.1 | 10.5 | GO:0031234 | extrinsic component of cytoplasmic side of plasma membrane(GO:0031234) |
| 0.1 | 13.5 | GO:0005802 | trans-Golgi network(GO:0005802) |
| 0.0 | 2.6 | GO:0043209 | myelin sheath(GO:0043209) |
| 0.0 | 0.2 | GO:0070369 | beta-catenin-TCF7L2 complex(GO:0070369) |
| 0.0 | 5.8 | GO:0005793 | endoplasmic reticulum-Golgi intermediate compartment(GO:0005793) |
| 0.0 | 0.8 | GO:0043220 | Schmidt-Lanterman incisure(GO:0043220) |
| 0.0 | 19.7 | GO:0016607 | nuclear speck(GO:0016607) |
| 0.0 | 2.5 | GO:0030964 | mitochondrial respiratory chain complex I(GO:0005747) NADH dehydrogenase complex(GO:0030964) respiratory chain complex I(GO:0045271) |
| 0.0 | 0.8 | GO:0005795 | Golgi stack(GO:0005795) |
| 0.0 | 0.9 | GO:0032391 | photoreceptor connecting cilium(GO:0032391) |
| 0.0 | 0.3 | GO:0005577 | fibrinogen complex(GO:0005577) |
| 0.0 | 4.2 | GO:0005796 | Golgi lumen(GO:0005796) |
| 0.0 | 4.8 | GO:0000922 | spindle pole(GO:0000922) |
| 0.0 | 2.0 | GO:0016328 | lateral plasma membrane(GO:0016328) |
| 0.0 | 17.6 | GO:0048471 | perinuclear region of cytoplasm(GO:0048471) |
| 0.0 | 0.7 | GO:0008074 | guanylate cyclase complex, soluble(GO:0008074) |
| 0.0 | 8.6 | GO:0005938 | cell cortex(GO:0005938) |
| 0.0 | 0.8 | GO:0001917 | photoreceptor inner segment(GO:0001917) |
| 0.0 | 15.4 | GO:0000139 | Golgi membrane(GO:0000139) |
| 0.0 | 0.5 | GO:0097381 | photoreceptor disc membrane(GO:0097381) |
| 0.0 | 0.3 | GO:0017146 | NMDA selective glutamate receptor complex(GO:0017146) |
| 0.0 | 2.4 | GO:0008021 | synaptic vesicle(GO:0008021) |
| 0.0 | 3.6 | GO:0005819 | spindle(GO:0005819) |
| 0.0 | 0.9 | GO:0031594 | neuromuscular junction(GO:0031594) |
| 0.0 | 0.4 | GO:0005666 | DNA-directed RNA polymerase III complex(GO:0005666) |
| 0.0 | 4.9 | GO:0000790 | nuclear chromatin(GO:0000790) |
| 0.0 | 0.2 | GO:0055038 | recycling endosome membrane(GO:0055038) |
| 0.0 | 3.0 | GO:0005769 | early endosome(GO:0005769) |
| 0.0 | 2.6 | GO:0045121 | membrane raft(GO:0045121) |
Gene overrepresentation in molecular_function category:
| Log-likelihood per target | Total log-likelihood | Term | Description |
|---|---|---|---|
| 2.6 | 13.2 | GO:0046912 | transferase activity, transferring acyl groups, acyl groups converted into alkyl on transfer(GO:0046912) |
| 1.6 | 42.0 | GO:0031489 | myosin V binding(GO:0031489) |
| 1.3 | 24.4 | GO:0005385 | zinc ion transmembrane transporter activity(GO:0005385) |
| 1.3 | 5.1 | GO:0004619 | bisphosphoglycerate mutase activity(GO:0004082) phosphoglycerate mutase activity(GO:0004619) 2,3-bisphosphoglycerate-dependent phosphoglycerate mutase activity(GO:0046538) |
| 1.2 | 7.3 | GO:0008597 | calcium-dependent protein serine/threonine phosphatase regulator activity(GO:0008597) |
| 1.2 | 9.4 | GO:0001849 | complement component C1q binding(GO:0001849) |
| 1.1 | 3.3 | GO:0008426 | protein kinase C inhibitor activity(GO:0008426) |
| 1.0 | 13.6 | GO:0017162 | aryl hydrocarbon receptor binding(GO:0017162) |
| 0.9 | 5.4 | GO:0010858 | calcium-dependent protein kinase regulator activity(GO:0010858) |
| 0.9 | 8.8 | GO:0005005 | transmembrane-ephrin receptor activity(GO:0005005) |
| 0.8 | 4.2 | GO:0005294 | neutral L-amino acid secondary active transmembrane transporter activity(GO:0005294) |
| 0.7 | 9.3 | GO:0031852 | mu-type opioid receptor binding(GO:0031852) |
| 0.7 | 4.0 | GO:0004167 | dopachrome isomerase activity(GO:0004167) |
| 0.6 | 5.1 | GO:0019871 | sodium channel inhibitor activity(GO:0019871) |
| 0.6 | 7.6 | GO:1990247 | N6-methyladenosine-containing RNA binding(GO:1990247) |
| 0.6 | 14.1 | GO:0034236 | protein kinase A catalytic subunit binding(GO:0034236) |
| 0.6 | 8.4 | GO:0004653 | polypeptide N-acetylgalactosaminyltransferase activity(GO:0004653) |
| 0.5 | 8.1 | GO:0008179 | adenylate cyclase binding(GO:0008179) |
| 0.5 | 2.5 | GO:0038051 | glucocorticoid receptor activity(GO:0004883) glucocorticoid-activated RNA polymerase II transcription factor binding transcription factor activity(GO:0038051) |
| 0.5 | 6.5 | GO:0008641 | small protein activating enzyme activity(GO:0008641) |
| 0.5 | 6.5 | GO:0042975 | peroxisome proliferator activated receptor binding(GO:0042975) |
| 0.3 | 3.8 | GO:0008097 | 5S rRNA binding(GO:0008097) |
| 0.3 | 4.9 | GO:0034450 | ubiquitin-ubiquitin ligase activity(GO:0034450) |
| 0.3 | 1.0 | GO:0004758 | serine C-palmitoyltransferase activity(GO:0004758) C-palmitoyltransferase activity(GO:0016454) |
| 0.3 | 2.5 | GO:0008172 | S-methyltransferase activity(GO:0008172) |
| 0.3 | 1.2 | GO:0030197 | extracellular matrix constituent, lubricant activity(GO:0030197) |
| 0.3 | 3.9 | GO:0047372 | acylglycerol lipase activity(GO:0047372) |
| 0.3 | 8.6 | GO:0070410 | co-SMAD binding(GO:0070410) |
| 0.3 | 6.7 | GO:0002162 | dystroglycan binding(GO:0002162) |
| 0.3 | 4.7 | GO:0017166 | vinculin binding(GO:0017166) |
| 0.2 | 10.9 | GO:0031593 | polyubiquitin binding(GO:0031593) |
| 0.2 | 3.5 | GO:0017017 | MAP kinase tyrosine/serine/threonine phosphatase activity(GO:0017017) |
| 0.2 | 4.4 | GO:0031435 | mitogen-activated protein kinase kinase kinase binding(GO:0031435) |
| 0.2 | 7.9 | GO:0046966 | thyroid hormone receptor binding(GO:0046966) |
| 0.2 | 2.4 | GO:0052629 | phosphatidylinositol-3,5-bisphosphate 3-phosphatase activity(GO:0052629) |
| 0.2 | 31.7 | GO:0044325 | ion channel binding(GO:0044325) |
| 0.2 | 1.5 | GO:0042056 | chemoattractant activity(GO:0042056) |
| 0.2 | 2.3 | GO:0030957 | Tat protein binding(GO:0030957) |
| 0.2 | 1.1 | GO:0001733 | galactosylceramide sulfotransferase activity(GO:0001733) galactose 3-O-sulfotransferase activity(GO:0050694) |
| 0.2 | 1.8 | GO:0033038 | bitter taste receptor activity(GO:0033038) |
| 0.2 | 5.7 | GO:0005487 | nucleocytoplasmic transporter activity(GO:0005487) |
| 0.1 | 4.1 | GO:0005388 | calcium-transporting ATPase activity(GO:0005388) |
| 0.1 | 0.8 | GO:0030160 | GKAP/Homer scaffold activity(GO:0030160) |
| 0.1 | 0.7 | GO:0015252 | hydrogen ion channel activity(GO:0015252) |
| 0.1 | 4.8 | GO:0030374 | ligand-dependent nuclear receptor transcription coactivator activity(GO:0030374) |
| 0.1 | 1.0 | GO:0035727 | lysophosphatidic acid binding(GO:0035727) |
| 0.1 | 2.9 | GO:0003887 | DNA-directed DNA polymerase activity(GO:0003887) |
| 0.1 | 1.5 | GO:0008140 | cAMP response element binding protein binding(GO:0008140) |
| 0.1 | 1.2 | GO:0070700 | BMP receptor binding(GO:0070700) |
| 0.1 | 0.5 | GO:0016909 | JUN kinase activity(GO:0004705) SAP kinase activity(GO:0016909) |
| 0.1 | 0.9 | GO:0016290 | palmitoyl-CoA hydrolase activity(GO:0016290) |
| 0.1 | 0.8 | GO:0016922 | ligand-dependent nuclear receptor binding(GO:0016922) |
| 0.1 | 3.7 | GO:0031491 | nucleosome binding(GO:0031491) |
| 0.1 | 2.9 | GO:0008536 | Ran GTPase binding(GO:0008536) |
| 0.1 | 3.7 | GO:0004407 | histone deacetylase activity(GO:0004407) |
| 0.1 | 4.4 | GO:0019003 | GDP binding(GO:0019003) |
| 0.1 | 1.9 | GO:0017147 | Wnt-protein binding(GO:0017147) |
| 0.1 | 2.0 | GO:0015248 | sterol transporter activity(GO:0015248) |
| 0.1 | 5.1 | GO:0003777 | microtubule motor activity(GO:0003777) |
| 0.1 | 4.2 | GO:0004843 | thiol-dependent ubiquitin-specific protease activity(GO:0004843) |
| 0.1 | 1.6 | GO:0044183 | protein binding involved in protein folding(GO:0044183) |
| 0.1 | 5.2 | GO:0008565 | protein transporter activity(GO:0008565) |
| 0.1 | 1.6 | GO:0004709 | MAP kinase kinase kinase activity(GO:0004709) |
| 0.0 | 13.7 | GO:0003714 | transcription corepressor activity(GO:0003714) |
| 0.0 | 2.5 | GO:0008137 | NADH dehydrogenase (ubiquinone) activity(GO:0008137) NADH dehydrogenase (quinone) activity(GO:0050136) |
| 0.0 | 1.9 | GO:0003774 | motor activity(GO:0003774) |
| 0.0 | 10.3 | GO:0051015 | actin filament binding(GO:0051015) |
| 0.0 | 0.3 | GO:0051959 | dynein light intermediate chain binding(GO:0051959) |
| 0.0 | 0.3 | GO:0004972 | NMDA glutamate receptor activity(GO:0004972) |
| 0.0 | 1.4 | GO:0005160 | transforming growth factor beta receptor binding(GO:0005160) |
| 0.0 | 7.2 | GO:0005516 | calmodulin binding(GO:0005516) |
| 0.0 | 1.9 | GO:0005544 | calcium-dependent phospholipid binding(GO:0005544) |
| 0.0 | 0.7 | GO:0004383 | guanylate cyclase activity(GO:0004383) |
| 0.0 | 2.6 | GO:0017048 | Rho GTPase binding(GO:0017048) |
| 0.0 | 3.0 | GO:0005262 | calcium channel activity(GO:0005262) |
| 0.0 | 3.7 | GO:0017137 | Rab GTPase binding(GO:0017137) |
| 0.0 | 4.9 | GO:0008022 | protein C-terminus binding(GO:0008022) |
| 0.0 | 4.0 | GO:0001047 | core promoter binding(GO:0001047) |
| 0.0 | 0.4 | GO:0001056 | RNA polymerase III activity(GO:0001056) |
| 0.0 | 5.1 | GO:0003779 | actin binding(GO:0003779) |
| 0.0 | 1.5 | GO:0005089 | Rho guanyl-nucleotide exchange factor activity(GO:0005089) |
| 0.0 | 0.3 | GO:0045499 | chemorepellent activity(GO:0045499) |
| 0.0 | 1.7 | GO:0004222 | metalloendopeptidase activity(GO:0004222) |
| 0.0 | 4.3 | GO:0031625 | ubiquitin protein ligase binding(GO:0031625) |
| 0.0 | 0.2 | GO:0070016 | armadillo repeat domain binding(GO:0070016) |
| 0.0 | 0.4 | GO:0005184 | neuropeptide hormone activity(GO:0005184) |
| 0.0 | 0.8 | GO:0001078 | transcriptional repressor activity, RNA polymerase II core promoter proximal region sequence-specific binding(GO:0001078) |
Gene overrepresentation in C2:CP category:
| Log-likelihood per target | Total log-likelihood | Term | Description |
|---|---|---|---|
| 1.1 | 54.4 | PID P38 MK2 PATHWAY | p38 signaling mediated by MAPKAP kinases |
| 0.4 | 15.6 | PID P38 MKK3 6PATHWAY | p38 MAPK signaling pathway |
| 0.3 | 7.5 | PID BETA CATENIN DEG PATHWAY | Degradation of beta catenin |
| 0.2 | 2.9 | PID RANBP2 PATHWAY | Sumoylation by RanBP2 regulates transcriptional repression |
| 0.2 | 8.8 | PID EPHA FWDPATHWAY | EPHA forward signaling |
| 0.2 | 12.5 | ST B CELL ANTIGEN RECEPTOR | B Cell Antigen Receptor |
| 0.2 | 5.4 | PID TOLL ENDOGENOUS PATHWAY | Endogenous TLR signaling |
| 0.1 | 8.2 | PID TCR CALCIUM PATHWAY | Calcium signaling in the CD4+ TCR pathway |
| 0.1 | 12.5 | PID TELOMERASE PATHWAY | Regulation of Telomerase |
| 0.1 | 8.0 | PID KIT PATHWAY | Signaling events mediated by Stem cell factor receptor (c-Kit) |
| 0.1 | 3.5 | ST ERK1 ERK2 MAPK PATHWAY | ERK1/ERK2 MAPK Pathway |
| 0.1 | 2.3 | PID ERB GENOMIC PATHWAY | Validated nuclear estrogen receptor beta network |
| 0.1 | 2.5 | ST WNT BETA CATENIN PATHWAY | Wnt/beta-catenin Pathway |
| 0.1 | 9.5 | PID SMAD2 3NUCLEAR PATHWAY | Regulation of nuclear SMAD2/3 signaling |
| 0.1 | 4.8 | PID TGFBR PATHWAY | TGF-beta receptor signaling |
| 0.1 | 5.2 | PID IL4 2PATHWAY | IL4-mediated signaling events |
| 0.1 | 1.7 | PID ALK1 PATHWAY | ALK1 signaling events |
| 0.1 | 4.2 | PID MTOR 4PATHWAY | mTOR signaling pathway |
| 0.1 | 5.8 | PID E2F PATHWAY | E2F transcription factor network |
| 0.1 | 3.4 | PID REG GR PATHWAY | Glucocorticoid receptor regulatory network |
| 0.0 | 1.6 | PID HIV NEF PATHWAY | HIV-1 Nef: Negative effector of Fas and TNF-alpha |
| 0.0 | 0.7 | PID RAC1 PATHWAY | RAC1 signaling pathway |
| 0.0 | 1.5 | PID CDC42 REG PATHWAY | Regulation of CDC42 activity |
| 0.0 | 1.0 | PID NCADHERIN PATHWAY | N-cadherin signaling events |
| 0.0 | 2.7 | PID CXCR4 PATHWAY | CXCR4-mediated signaling events |
| 0.0 | 0.4 | PID SYNDECAN 3 PATHWAY | Syndecan-3-mediated signaling events |
| 0.0 | 0.3 | PID REELIN PATHWAY | Reelin signaling pathway |
Gene overrepresentation in C2:CP:REACTOME category:
| Log-likelihood per target | Total log-likelihood | Term | Description |
|---|---|---|---|
| 1.6 | 24.4 | REACTOME ZINC TRANSPORTERS | Genes involved in Zinc transporters |
| 1.6 | 42.0 | REACTOME INSULIN SYNTHESIS AND PROCESSING | Genes involved in Insulin Synthesis and Processing |
| 1.2 | 31.7 | REACTOME DESTABILIZATION OF MRNA BY KSRP | Genes involved in Destabilization of mRNA by KSRP |
| 0.7 | 6.5 | REACTOME APOBEC3G MEDIATED RESISTANCE TO HIV1 INFECTION | Genes involved in APOBEC3G mediated resistance to HIV-1 infection |
| 0.7 | 9.4 | REACTOME ACTIVATION OF CHAPERONE GENES BY ATF6 ALPHA | Genes involved in Activation of Chaperone Genes by ATF6-alpha |
| 0.6 | 13.2 | REACTOME CITRIC ACID CYCLE TCA CYCLE | Genes involved in Citric acid cycle (TCA cycle) |
| 0.5 | 14.1 | REACTOME PD1 SIGNALING | Genes involved in PD-1 signaling |
| 0.4 | 3.5 | REACTOME ERKS ARE INACTIVATED | Genes involved in ERKs are inactivated |
| 0.3 | 7.0 | REACTOME APOPTOSIS INDUCED DNA FRAGMENTATION | Genes involved in Apoptosis induced DNA fragmentation |
| 0.3 | 7.5 | REACTOME CTNNB1 PHOSPHORYLATION CASCADE | Genes involved in Beta-catenin phosphorylation cascade |
| 0.3 | 5.8 | REACTOME CYCLIN A B1 ASSOCIATED EVENTS DURING G2 M TRANSITION | Genes involved in Cyclin A/B1 associated events during G2/M transition |
| 0.2 | 2.4 | REACTOME SYNTHESIS OF PIPS AT THE LATE ENDOSOME MEMBRANE | Genes involved in Synthesis of PIPs at the late endosome membrane |
| 0.2 | 5.9 | REACTOME ENDOSOMAL SORTING COMPLEX REQUIRED FOR TRANSPORT ESCRT | Genes involved in Endosomal Sorting Complex Required For Transport (ESCRT) |
| 0.2 | 9.6 | REACTOME O LINKED GLYCOSYLATION OF MUCINS | Genes involved in O-linked glycosylation of mucins |
| 0.2 | 13.6 | REACTOME RNA POL II TRANSCRIPTION PRE INITIATION AND PROMOTER OPENING | Genes involved in RNA Polymerase II Transcription Pre-Initiation And Promoter Opening |
| 0.2 | 4.2 | REACTOME REGULATION OF RHEB GTPASE ACTIVITY BY AMPK | Genes involved in Regulation of Rheb GTPase activity by AMPK |
| 0.2 | 5.1 | REACTOME KINESINS | Genes involved in Kinesins |
| 0.2 | 8.6 | REACTOME DOWNREGULATION OF SMAD2 3 SMAD4 TRANSCRIPTIONAL ACTIVITY | Genes involved in Downregulation of SMAD2/3:SMAD4 transcriptional activity |
| 0.2 | 2.6 | REACTOME GLYCOPROTEIN HORMONES | Genes involved in Glycoprotein hormones |
| 0.1 | 5.7 | REACTOME MRNA 3 END PROCESSING | Genes involved in mRNA 3'-end processing |
| 0.1 | 3.9 | REACTOME BASIGIN INTERACTIONS | Genes involved in Basigin interactions |
| 0.1 | 7.6 | REACTOME MRNA SPLICING | Genes involved in mRNA Splicing |
| 0.1 | 4.1 | REACTOME ION TRANSPORT BY P TYPE ATPASES | Genes involved in Ion transport by P-type ATPases |
| 0.1 | 2.2 | REACTOME ADHERENS JUNCTIONS INTERACTIONS | Genes involved in Adherens junctions interactions |
| 0.1 | 4.7 | REACTOME SMOOTH MUSCLE CONTRACTION | Genes involved in Smooth Muscle Contraction |
| 0.1 | 5.2 | REACTOME GOLGI ASSOCIATED VESICLE BIOGENESIS | Genes involved in Golgi Associated Vesicle Biogenesis |
| 0.1 | 2.5 | REACTOME SULFUR AMINO ACID METABOLISM | Genes involved in Sulfur amino acid metabolism |
| 0.1 | 3.7 | REACTOME DEPOSITION OF NEW CENPA CONTAINING NUCLEOSOMES AT THE CENTROMERE | Genes involved in Deposition of New CENPA-containing Nucleosomes at the Centromere |
| 0.0 | 2.5 | REACTOME BMAL1 CLOCK NPAS2 ACTIVATES CIRCADIAN EXPRESSION | Genes involved in BMAL1:CLOCK/NPAS2 Activates Circadian Expression |
| 0.0 | 0.5 | REACTOME ACTIVATION OF THE AP1 FAMILY OF TRANSCRIPTION FACTORS | Genes involved in Activation of the AP-1 family of transcription factors |
| 0.0 | 0.6 | REACTOME THE ACTIVATION OF ARYLSULFATASES | Genes involved in The activation of arylsulfatases |
| 0.0 | 2.9 | REACTOME LATE PHASE OF HIV LIFE CYCLE | Genes involved in Late Phase of HIV Life Cycle |
| 0.0 | 3.3 | REACTOME DESTABILIZATION OF MRNA BY AUF1 HNRNP D0 | Genes involved in Destabilization of mRNA by AUF1 (hnRNP D0) |
| 0.0 | 0.4 | REACTOME RNA POL III CHAIN ELONGATION | Genes involved in RNA Polymerase III Chain Elongation |
| 0.0 | 1.8 | REACTOME MEIOTIC SYNAPSIS | Genes involved in Meiotic Synapsis |
| 0.0 | 1.1 | REACTOME GLYCOSPHINGOLIPID METABOLISM | Genes involved in Glycosphingolipid metabolism |
| 0.0 | 0.6 | REACTOME TRANSCRIPTIONAL REGULATION OF WHITE ADIPOCYTE DIFFERENTIATION | Genes involved in Transcriptional Regulation of White Adipocyte Differentiation |
| 0.0 | 5.8 | REACTOME ANTIGEN PROCESSING UBIQUITINATION PROTEASOME DEGRADATION | Genes involved in Antigen processing: Ubiquitination & Proteasome degradation |
| 0.0 | 1.0 | REACTOME SPHINGOLIPID METABOLISM | Genes involved in Sphingolipid metabolism |
| 0.0 | 2.9 | REACTOME DNA REPAIR | Genes involved in DNA Repair |
| 0.0 | 0.3 | REACTOME NA CL DEPENDENT NEUROTRANSMITTER TRANSPORTERS | Genes involved in Na+/Cl- dependent neurotransmitter transporters |
| 0.0 | 0.6 | REACTOME SIGNALING BY CONSTITUTIVELY ACTIVE EGFR | Genes involved in Signaling by constitutively active EGFR |
| 0.0 | 0.3 | REACTOME RAS ACTIVATION UOPN CA2 INFUX THROUGH NMDA RECEPTOR | Genes involved in Ras activation uopn Ca2+ infux through NMDA receptor |
| 0.0 | 0.2 | REACTOME SEMA3A PLEXIN REPULSION SIGNALING BY INHIBITING INTEGRIN ADHESION | Genes involved in SEMA3A-Plexin repulsion signaling by inhibiting Integrin adhesion |
| 0.0 | 0.3 | REACTOME COMMON PATHWAY | Genes involved in Common Pathway |