Project
GNF SymAtlas + NCI-60 cancer cell lines, comparison of cancers vs non-cancers, human (Su, 2004; Ross, 2000)
Navigation
Downloads
Results for DLX5
Z-value: 0.04
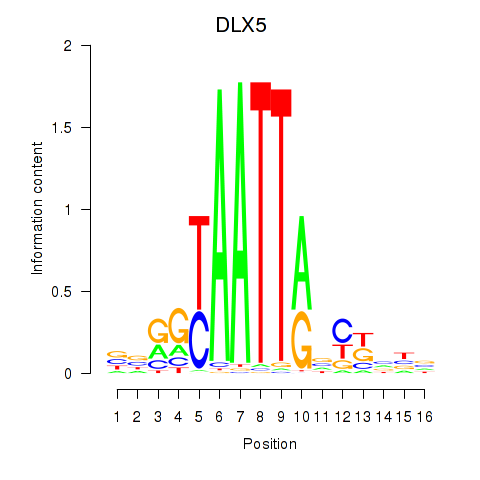
Motif logo
Transcription factors associated with DLX5
| Gene Symbol | Gene ID | Gene Info |
|---|---|---|
|
DLX5
|
ENSG00000105880.4 | distal-less homeobox 5 |
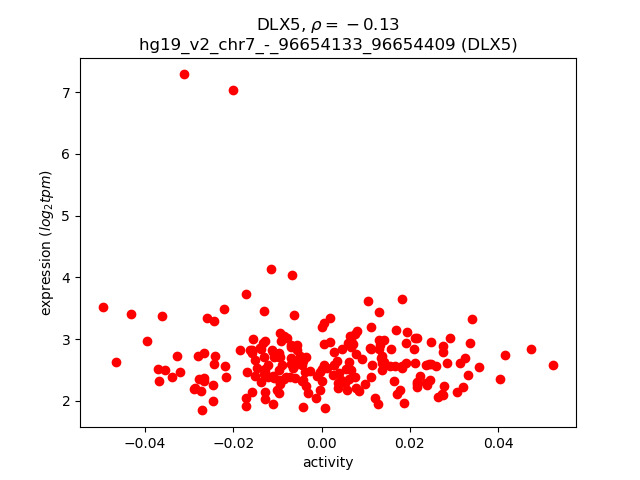
Activity-expression correlation:
| Gene | Promoter | Pearson corr. coef. | P-value | Plot |
|---|---|---|---|---|
| DLX5 | hg19_v2_chr7_-_96654133_96654409 | -0.13 | 6.1e-02 | Click! |
Activity profile of DLX5 motif
Sorted Z-values of DLX5 motif
| Promoter | Log-likelihood | Transcript | Gene | Gene Info |
|---|---|---|---|---|
| chr4_-_74853897 | 3.18 |
ENST00000296028.3
|
PPBP
|
pro-platelet basic protein (chemokine (C-X-C motif) ligand 7) |
| chr3_-_105588231 | 3.01 |
ENST00000545639.1
ENST00000394027.3 ENST00000438603.1 ENST00000447441.1 ENST00000443752.1 |
CBLB
|
Cbl proto-oncogene B, E3 ubiquitin protein ligase |
| chr15_+_89631647 | 2.42 |
ENST00000569550.1
ENST00000565066.1 ENST00000565973.1 |
ABHD2
|
abhydrolase domain containing 2 |
| chr7_-_86849883 | 2.37 |
ENST00000433078.1
|
TMEM243
|
transmembrane protein 243, mitochondrial |
| chr2_+_30369859 | 1.75 |
ENST00000402003.3
|
YPEL5
|
yippee-like 5 (Drosophila) |
| chrX_-_16887963 | 1.72 |
ENST00000380084.4
|
RBBP7
|
retinoblastoma binding protein 7 |
| chr12_+_54378923 | 1.72 |
ENST00000303460.4
|
HOXC10
|
homeobox C10 |
| chr7_+_100770328 | 1.70 |
ENST00000223095.4
ENST00000445463.2 |
SERPINE1
|
serpin peptidase inhibitor, clade E (nexin, plasminogen activator inhibitor type 1), member 1 |
| chr3_+_186560476 | 1.47 |
ENST00000320741.2
ENST00000444204.2 |
ADIPOQ
|
adiponectin, C1Q and collagen domain containing |
| chr3_+_186560462 | 1.46 |
ENST00000412955.2
|
ADIPOQ
|
adiponectin, C1Q and collagen domain containing |
| chr2_+_30369807 | 1.44 |
ENST00000379520.3
ENST00000379519.3 ENST00000261353.4 |
YPEL5
|
yippee-like 5 (Drosophila) |
| chr18_-_33709268 | 1.27 |
ENST00000269187.5
ENST00000590986.1 ENST00000440549.2 |
SLC39A6
|
solute carrier family 39 (zinc transporter), member 6 |
| chr2_+_196313239 | 1.23 |
ENST00000413290.1
|
AC064834.1
|
AC064834.1 |
| chr2_-_183387283 | 1.19 |
ENST00000435564.1
|
PDE1A
|
phosphodiesterase 1A, calmodulin-dependent |
| chr4_-_143767428 | 1.17 |
ENST00000513000.1
ENST00000509777.1 ENST00000503927.1 |
INPP4B
|
inositol polyphosphate-4-phosphatase, type II, 105kDa |
| chr2_-_183387064 | 1.12 |
ENST00000536095.1
ENST00000331935.6 ENST00000358139.2 ENST00000456212.1 |
PDE1A
|
phosphodiesterase 1A, calmodulin-dependent |
| chr3_+_158519654 | 1.05 |
ENST00000415822.2
ENST00000392813.4 ENST00000264266.8 |
MFSD1
|
major facilitator superfamily domain containing 1 |
| chr12_-_50616382 | 0.86 |
ENST00000552783.1
|
LIMA1
|
LIM domain and actin binding 1 |
| chr11_+_818902 | 0.82 |
ENST00000336615.4
|
PNPLA2
|
patatin-like phospholipase domain containing 2 |
| chrX_+_100645812 | 0.79 |
ENST00000427805.2
ENST00000553110.3 ENST00000392994.3 ENST00000409338.1 ENST00000409170.3 |
RPL36A
RPL36A-HNRNPH2
|
ribosomal protein L36a RPL36A-HNRNPH2 readthrough |
| chr4_-_105416039 | 0.71 |
ENST00000394767.2
|
CXXC4
|
CXXC finger protein 4 |
| chr12_-_53171128 | 0.67 |
ENST00000332411.2
|
KRT76
|
keratin 76 |
| chr4_-_7069760 | 0.64 |
ENST00000264954.4
|
GRPEL1
|
GrpE-like 1, mitochondrial (E. coli) |
| chr19_-_14785698 | 0.60 |
ENST00000344373.4
ENST00000595472.1 |
EMR3
|
egf-like module containing, mucin-like, hormone receptor-like 3 |
| chr12_+_7014126 | 0.59 |
ENST00000415834.1
ENST00000436789.1 |
LRRC23
|
leucine rich repeat containing 23 |
| chr2_-_183387430 | 0.53 |
ENST00000410103.1
|
PDE1A
|
phosphodiesterase 1A, calmodulin-dependent |
| chr8_-_22526597 | 0.53 |
ENST00000519513.1
ENST00000276416.6 ENST00000520292.1 ENST00000522268.1 |
BIN3
|
bridging integrator 3 |
| chr19_-_14785674 | 0.52 |
ENST00000253673.5
|
EMR3
|
egf-like module containing, mucin-like, hormone receptor-like 3 |
| chr19_-_14785622 | 0.51 |
ENST00000443157.2
|
EMR3
|
egf-like module containing, mucin-like, hormone receptor-like 3 |
| chr4_+_151503077 | 0.49 |
ENST00000317605.4
|
MAB21L2
|
mab-21-like 2 (C. elegans) |
| chr7_-_99716952 | 0.48 |
ENST00000523306.1
ENST00000344095.4 ENST00000417349.1 ENST00000493322.1 ENST00000520135.1 ENST00000418432.2 ENST00000460673.2 ENST00000452041.1 ENST00000452438.2 ENST00000451699.1 ENST00000453269.2 |
TAF6
|
TAF6 RNA polymerase II, TATA box binding protein (TBP)-associated factor, 80kDa |
| chr6_-_112194484 | 0.46 |
ENST00000518295.1
ENST00000484067.2 ENST00000229470.5 ENST00000356013.2 ENST00000368678.4 ENST00000523238.1 ENST00000354650.3 |
FYN
|
FYN oncogene related to SRC, FGR, YES |
| chr11_-_102709441 | 0.44 |
ENST00000434103.1
|
MMP3
|
matrix metallopeptidase 3 (stromelysin 1, progelatinase) |
| chr14_-_24711470 | 0.44 |
ENST00000559969.1
|
TINF2
|
TERF1 (TRF1)-interacting nuclear factor 2 |
| chr3_-_52567792 | 0.38 |
ENST00000307092.4
ENST00000422318.2 ENST00000459839.1 |
NT5DC2
|
5'-nucleotidase domain containing 2 |
| chr14_-_24711865 | 0.33 |
ENST00000399423.4
ENST00000267415.7 |
TINF2
|
TERF1 (TRF1)-interacting nuclear factor 2 |
| chr1_-_23670752 | 0.31 |
ENST00000302271.6
ENST00000426846.2 ENST00000427764.2 ENST00000606561.1 ENST00000374616.3 |
HNRNPR
|
heterogeneous nuclear ribonucleoprotein R |
| chr14_-_24711806 | 0.30 |
ENST00000540705.1
ENST00000538777.1 ENST00000558566.1 ENST00000559019.1 |
TINF2
|
TERF1 (TRF1)-interacting nuclear factor 2 |
| chr4_-_66536057 | 0.30 |
ENST00000273854.3
|
EPHA5
|
EPH receptor A5 |
| chr11_+_76092353 | 0.30 |
ENST00000530460.1
ENST00000321844.4 |
RP11-111M22.2
|
Homo sapiens putative uncharacterized protein FLJ37770-like (LOC100506127), mRNA. |
| chr1_-_23670817 | 0.28 |
ENST00000478691.1
|
HNRNPR
|
heterogeneous nuclear ribonucleoprotein R |
| chr4_-_66536196 | 0.28 |
ENST00000511294.1
|
EPHA5
|
EPH receptor A5 |
| chr1_-_23670813 | 0.27 |
ENST00000374612.1
|
HNRNPR
|
heterogeneous nuclear ribonucleoprotein R |
| chr14_+_22739823 | 0.27 |
ENST00000390464.2
|
TRAV38-1
|
T cell receptor alpha variable 38-1 |
| chr11_+_73498898 | 0.26 |
ENST00000535529.1
ENST00000497094.2 ENST00000411840.2 ENST00000535277.1 ENST00000398483.3 ENST00000542303.1 |
MRPL48
|
mitochondrial ribosomal protein L48 |
| chr17_-_37009882 | 0.25 |
ENST00000378096.3
ENST00000394332.1 ENST00000394333.1 ENST00000577407.1 ENST00000479035.2 |
RPL23
|
ribosomal protein L23 |
| chr1_-_78444776 | 0.24 |
ENST00000370767.1
ENST00000421641.1 |
FUBP1
|
far upstream element (FUSE) binding protein 1 |
| chr12_+_52695617 | 0.22 |
ENST00000293525.5
|
KRT86
|
keratin 86 |
| chr6_-_33160231 | 0.21 |
ENST00000395194.1
ENST00000457788.1 ENST00000341947.2 ENST00000357486.1 ENST00000374714.1 ENST00000374713.1 ENST00000395197.1 ENST00000374712.1 ENST00000361917.1 ENST00000374708.4 |
COL11A2
|
collagen, type XI, alpha 2 |
| chr13_-_36788718 | 0.18 |
ENST00000317764.6
ENST00000379881.3 |
SOHLH2
|
spermatogenesis and oogenesis specific basic helix-loop-helix 2 |
| chr1_+_160160346 | 0.18 |
ENST00000368078.3
|
CASQ1
|
calsequestrin 1 (fast-twitch, skeletal muscle) |
| chr13_-_36050819 | 0.18 |
ENST00000379919.4
|
MAB21L1
|
mab-21-like 1 (C. elegans) |
| chr9_+_34646624 | 0.17 |
ENST00000450095.2
ENST00000556278.1 |
GALT
GALT
|
galactose-1-phosphate uridylyltransferase Uncharacterized protein |
| chr2_-_220118631 | 0.17 |
ENST00000248437.4
|
TUBA4A
|
tubulin, alpha 4a |
| chr22_-_30960876 | 0.17 |
ENST00000401975.1
ENST00000428682.1 ENST00000423299.1 |
GAL3ST1
|
galactose-3-O-sulfotransferase 1 |
| chr1_+_54569968 | 0.17 |
ENST00000391366.1
|
AL161915.1
|
Uncharacterized protein |
| chr3_-_105587879 | 0.16 |
ENST00000264122.4
ENST00000403724.1 ENST00000405772.1 |
CBLB
|
Cbl proto-oncogene B, E3 ubiquitin protein ligase |
| chr5_-_20575959 | 0.16 |
ENST00000507958.1
|
CDH18
|
cadherin 18, type 2 |
| chr15_+_89164520 | 0.15 |
ENST00000332810.3
|
AEN
|
apoptosis enhancing nuclease |
| chr9_+_34646651 | 0.14 |
ENST00000378842.3
|
GALT
|
galactose-1-phosphate uridylyltransferase |
| chr7_-_14029283 | 0.14 |
ENST00000433547.1
ENST00000405192.2 |
ETV1
|
ets variant 1 |
| chr11_-_26743546 | 0.13 |
ENST00000280467.6
ENST00000396005.3 |
SLC5A12
|
solute carrier family 5 (sodium/monocarboxylate cotransporter), member 12 |
| chr1_-_78444738 | 0.13 |
ENST00000436586.2
ENST00000370768.2 |
FUBP1
|
far upstream element (FUSE) binding protein 1 |
| chr1_+_160160283 | 0.13 |
ENST00000368079.3
|
CASQ1
|
calsequestrin 1 (fast-twitch, skeletal muscle) |
| chr19_+_58570605 | 0.12 |
ENST00000359978.6
ENST00000401053.4 ENST00000439855.2 ENST00000313434.5 ENST00000511556.1 ENST00000506786.1 |
ZNF135
|
zinc finger protein 135 |
| chr11_-_102651343 | 0.10 |
ENST00000279441.4
ENST00000539681.1 |
MMP10
|
matrix metallopeptidase 10 (stromelysin 2) |
| chr4_-_8873531 | 0.10 |
ENST00000400677.3
|
HMX1
|
H6 family homeobox 1 |
| chr1_-_150669500 | 0.08 |
ENST00000271732.3
|
GOLPH3L
|
golgi phosphoprotein 3-like |
| chr12_+_81110684 | 0.07 |
ENST00000228644.3
|
MYF5
|
myogenic factor 5 |
| chr19_+_36605850 | 0.07 |
ENST00000221855.3
|
TBCB
|
tubulin folding cofactor B |
| chr12_-_10978957 | 0.06 |
ENST00000240619.2
|
TAS2R10
|
taste receptor, type 2, member 10 |
| chr15_+_89631381 | 0.06 |
ENST00000352732.5
|
ABHD2
|
abhydrolase domain containing 2 |
| chr9_+_116225999 | 0.05 |
ENST00000317613.6
|
RGS3
|
regulator of G-protein signaling 3 |
| chr5_-_58571935 | 0.04 |
ENST00000503258.1
|
PDE4D
|
phosphodiesterase 4D, cAMP-specific |
| chr4_-_39979576 | 0.03 |
ENST00000303538.8
ENST00000503396.1 |
PDS5A
|
PDS5, regulator of cohesion maintenance, homolog A (S. cerevisiae) |
| chr1_-_150669604 | 0.02 |
ENST00000427665.1
ENST00000540514.1 |
GOLPH3L
|
golgi phosphoprotein 3-like |
| chr11_-_71823715 | 0.01 |
ENST00000545944.1
ENST00000502597.2 |
ANAPC15
|
anaphase promoting complex subunit 15 |
| chr12_+_7014064 | 0.01 |
ENST00000443597.2
|
LRRC23
|
leucine rich repeat containing 23 |
| chr12_+_7013897 | 0.00 |
ENST00000007969.8
ENST00000323702.5 |
LRRC23
|
leucine rich repeat containing 23 |
| chr2_-_172290482 | 0.00 |
ENST00000442541.1
ENST00000392599.2 ENST00000375258.4 |
METTL8
|
methyltransferase like 8 |
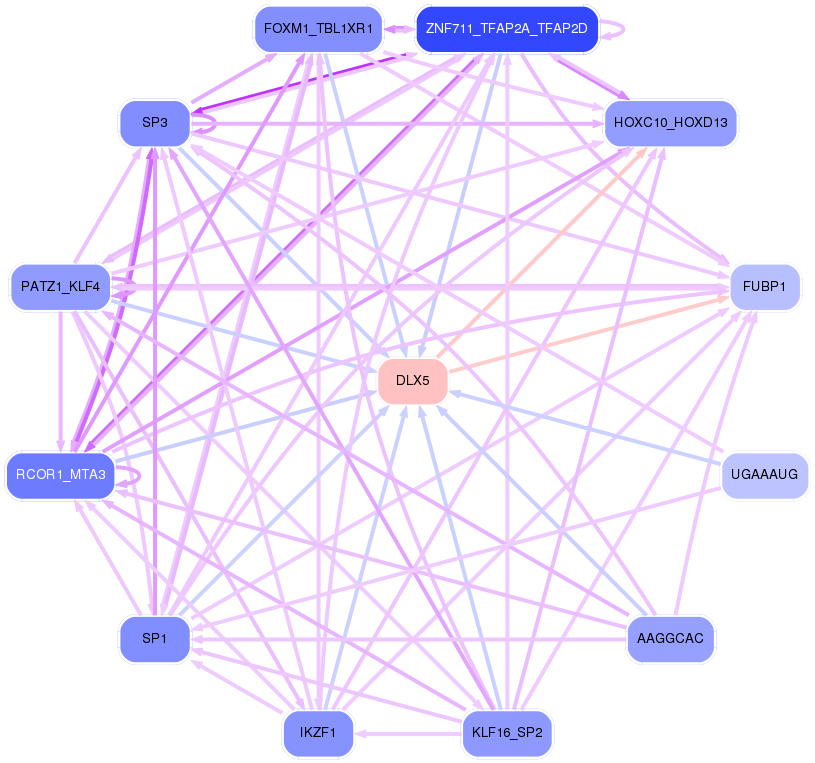
Network of associatons between targets according to the STRING database.

First level regulatory network of DLX5
Gene Ontology Analysis
Gene overrepresentation in biological_process category:
| Log-likelihood per target | Total log-likelihood | Term | Description |
|---|---|---|---|
| 1.0 | 2.9 | GO:2000532 | renal albumin absorption(GO:0097018) regulation of renal albumin absorption(GO:2000532) regulation of platelet-derived growth factor receptor-alpha signaling pathway(GO:2000583) negative regulation of platelet-derived growth factor receptor-alpha signaling pathway(GO:2000584) |
| 0.6 | 1.7 | GO:2000097 | chronological cell aging(GO:0001300) regulation of smooth muscle cell-matrix adhesion(GO:2000097) |
| 0.3 | 1.7 | GO:0010286 | heat acclimation(GO:0010286) cellular heat acclimation(GO:0070370) |
| 0.3 | 3.2 | GO:0007175 | negative regulation of epidermal growth factor-activated receptor activity(GO:0007175) |
| 0.2 | 1.7 | GO:0021520 | spinal cord motor neuron cell fate specification(GO:0021520) |
| 0.2 | 1.1 | GO:0010836 | negative regulation of protein ADP-ribosylation(GO:0010836) |
| 0.2 | 2.8 | GO:0046069 | cGMP catabolic process(GO:0046069) |
| 0.2 | 3.2 | GO:0002523 | leukocyte migration involved in inflammatory response(GO:0002523) |
| 0.1 | 1.3 | GO:0071578 | zinc II ion transmembrane import(GO:0071578) |
| 0.1 | 0.7 | GO:0007352 | zygotic specification of dorsal/ventral axis(GO:0007352) |
| 0.1 | 0.3 | GO:0006258 | UDP-glucose catabolic process(GO:0006258) galactose catabolic process via UDP-galactose(GO:0033499) |
| 0.1 | 2.5 | GO:0048240 | sperm capacitation(GO:0048240) |
| 0.1 | 0.5 | GO:1902951 | negative regulation of dendritic spine maintenance(GO:1902951) |
| 0.1 | 0.8 | GO:0010891 | negative regulation of sequestering of triglyceride(GO:0010891) |
| 0.1 | 0.7 | GO:0048733 | sebaceous gland development(GO:0048733) |
| 0.1 | 0.5 | GO:0009826 | unidimensional cell growth(GO:0009826) |
| 0.1 | 0.2 | GO:0060023 | soft palate development(GO:0060023) |
| 0.1 | 0.3 | GO:0072717 | cellular response to actinomycin D(GO:0072717) |
| 0.0 | 0.6 | GO:0030150 | protein import into mitochondrial matrix(GO:0030150) |
| 0.0 | 0.4 | GO:0010727 | negative regulation of hydrogen peroxide metabolic process(GO:0010727) |
| 0.0 | 0.9 | GO:0061157 | mRNA destabilization(GO:0061157) |
| 0.0 | 0.3 | GO:0014894 | response to muscle inactivity involved in regulation of muscle adaptation(GO:0014877) response to denervation involved in regulation of muscle adaptation(GO:0014894) |
| 0.0 | 0.6 | GO:0032793 | positive regulation of CREB transcription factor activity(GO:0032793) |
| 0.0 | 0.5 | GO:0010172 | embryonic body morphogenesis(GO:0010172) |
| 0.0 | 0.2 | GO:0019375 | galactosylceramide biosynthetic process(GO:0006682) galactolipid biosynthetic process(GO:0019375) |
| 0.0 | 1.2 | GO:0036092 | phosphatidylinositol-3-phosphate biosynthetic process(GO:0036092) |
| 0.0 | 0.9 | GO:0030835 | negative regulation of actin filament depolymerization(GO:0030835) |
| 0.0 | 0.1 | GO:0015727 | lactate transport(GO:0015727) lactate transmembrane transport(GO:0035873) |
Gene overrepresentation in cellular_component category:
| Log-likelihood per target | Total log-likelihood | Term | Description |
|---|---|---|---|
| 0.2 | 1.1 | GO:0010370 | perinucleolar chromocenter(GO:0010370) |
| 0.2 | 1.7 | GO:0019907 | cyclin-dependent protein kinase activating kinase holoenzyme complex(GO:0019907) |
| 0.2 | 2.5 | GO:0097524 | sperm plasma membrane(GO:0097524) |
| 0.2 | 0.6 | GO:0001405 | presequence translocase-associated import motor(GO:0001405) |
| 0.1 | 6.4 | GO:1904724 | tertiary granule lumen(GO:1904724) |
| 0.1 | 1.7 | GO:0035098 | ESC/E(Z) complex(GO:0035098) |
| 0.0 | 0.3 | GO:0014802 | terminal cisterna(GO:0014802) |
| 0.0 | 1.3 | GO:0031258 | lamellipodium membrane(GO:0031258) |
| 0.0 | 3.1 | GO:0005581 | collagen trimer(GO:0005581) |
| 0.0 | 0.9 | GO:0045095 | keratin filament(GO:0045095) |
| 0.0 | 1.7 | GO:0031093 | platelet alpha granule lumen(GO:0031093) |
| 0.0 | 0.3 | GO:0033276 | transcription factor TFTC complex(GO:0033276) |
| 0.0 | 0.9 | GO:0032154 | cleavage furrow(GO:0032154) cell surface furrow(GO:0097610) |
Gene overrepresentation in molecular_function category:
| Log-likelihood per target | Total log-likelihood | Term | Description |
|---|---|---|---|
| 0.4 | 2.8 | GO:0048101 | calcium- and calmodulin-regulated 3',5'-cyclic-GMP phosphodiesterase activity(GO:0048101) |
| 0.2 | 1.2 | GO:0016316 | phosphatidylinositol-3,4-bisphosphate 4-phosphatase activity(GO:0016316) inositol-1,3,4-trisphosphate 4-phosphatase activity(GO:0017161) phosphatidylinositol-4,5-bisphosphate 4-phosphatase activity(GO:0034597) inositol-3,4-bisphosphate 4-phosphatase activity(GO:0052828) |
| 0.2 | 2.9 | GO:0033691 | sialic acid binding(GO:0033691) |
| 0.2 | 3.2 | GO:0045236 | CXCR chemokine receptor binding(GO:0045236) |
| 0.2 | 2.5 | GO:0047372 | acylglycerol lipase activity(GO:0047372) |
| 0.1 | 0.8 | GO:0004465 | lipoprotein lipase activity(GO:0004465) |
| 0.1 | 0.5 | GO:0042610 | CD8 receptor binding(GO:0042610) |
| 0.1 | 1.3 | GO:0005385 | zinc ion transmembrane transporter activity(GO:0005385) |
| 0.1 | 0.3 | GO:0070180 | large ribosomal subunit rRNA binding(GO:0070180) |
| 0.1 | 0.6 | GO:0005005 | transmembrane-ephrin receptor activity(GO:0005005) |
| 0.1 | 0.6 | GO:0000774 | adenyl-nucleotide exchange factor activity(GO:0000774) |
| 0.0 | 2.9 | GO:0001784 | phosphotyrosine binding(GO:0001784) |
| 0.0 | 0.4 | GO:0008253 | 5'-nucleotidase activity(GO:0008253) |
| 0.0 | 0.5 | GO:0017162 | aryl hydrocarbon receptor binding(GO:0017162) |
| 0.0 | 0.2 | GO:0030020 | extracellular matrix structural constituent conferring tensile strength(GO:0030020) |
| 0.0 | 1.7 | GO:0004407 | histone deacetylase activity(GO:0004407) |
| 0.0 | 0.3 | GO:0070569 | uridylyltransferase activity(GO:0070569) |
| 0.0 | 0.2 | GO:0001733 | galactosylceramide sulfotransferase activity(GO:0001733) galactose 3-O-sulfotransferase activity(GO:0050694) |
| 0.0 | 1.1 | GO:0042162 | telomeric DNA binding(GO:0042162) |
| 0.0 | 0.9 | GO:0003785 | actin monomer binding(GO:0003785) |
| 0.0 | 0.5 | GO:0008093 | cytoskeletal adaptor activity(GO:0008093) |
| 0.0 | 1.7 | GO:0004867 | serine-type endopeptidase inhibitor activity(GO:0004867) |
| 0.0 | 0.1 | GO:0015129 | lactate transmembrane transporter activity(GO:0015129) |
Gene overrepresentation in C2:CP category:
| Log-likelihood per target | Total log-likelihood | Term | Description |
|---|---|---|---|
| 0.1 | 3.2 | PID CD40 PATHWAY | CD40/CD40L signaling |
| 0.0 | 2.1 | PID UPA UPAR PATHWAY | Urokinase-type plasminogen activator (uPA) and uPAR-mediated signaling |
| 0.0 | 2.8 | PID TELOMERASE PATHWAY | Regulation of Telomerase |
| 0.0 | 1.0 | PID EPHA FWDPATHWAY | EPHA forward signaling |
| 0.0 | 0.7 | ST WNT BETA CATENIN PATHWAY | Wnt/beta-catenin Pathway |
| 0.0 | 0.9 | PID ECADHERIN STABILIZATION PATHWAY | Stabilization and expansion of the E-cadherin adherens junction |
| 0.0 | 2.9 | NABA ECM GLYCOPROTEINS | Genes encoding structural ECM glycoproteins |
Gene overrepresentation in C2:CP:REACTOME category:
| Log-likelihood per target | Total log-likelihood | Term | Description |
|---|---|---|---|
| 0.1 | 1.1 | REACTOME PACKAGING OF TELOMERE ENDS | Genes involved in Packaging Of Telomere Ends |
| 0.1 | 1.3 | REACTOME ZINC TRANSPORTERS | Genes involved in Zinc transporters |
| 0.1 | 1.2 | REACTOME SYNTHESIS OF PIPS AT THE EARLY ENDOSOME MEMBRANE | Genes involved in Synthesis of PIPs at the early endosome membrane |
| 0.1 | 2.8 | REACTOME CGMP EFFECTS | Genes involved in cGMP effects |
| 0.1 | 3.6 | REACTOME ANTIGEN ACTIVATES B CELL RECEPTOR LEADING TO GENERATION OF SECOND MESSENGERS | Genes involved in Antigen Activates B Cell Receptor Leading to Generation of Second Messengers |
| 0.0 | 3.2 | REACTOME CHEMOKINE RECEPTORS BIND CHEMOKINES | Genes involved in Chemokine receptors bind chemokines |
| 0.0 | 2.9 | REACTOME TRANSCRIPTIONAL REGULATION OF WHITE ADIPOCYTE DIFFERENTIATION | Genes involved in Transcriptional Regulation of White Adipocyte Differentiation |
| 0.0 | 1.7 | REACTOME BMAL1 CLOCK NPAS2 ACTIVATES CIRCADIAN EXPRESSION | Genes involved in BMAL1:CLOCK/NPAS2 Activates Circadian Expression |
| 0.0 | 1.5 | REACTOME DEPOSITION OF NEW CENPA CONTAINING NUCLEOSOMES AT THE CENTROMERE | Genes involved in Deposition of New CENPA-containing Nucleosomes at the Centromere |
| 0.0 | 0.5 | REACTOME DEGRADATION OF THE EXTRACELLULAR MATRIX | Genes involved in Degradation of the extracellular matrix |
| 0.0 | 1.6 | REACTOME CLASS B 2 SECRETIN FAMILY RECEPTORS | Genes involved in Class B/2 (Secretin family receptors) |