Project
GNF SymAtlas + NCI-60 cancer cell lines, comparison of cancers vs non-cancers, human (Su, 2004; Ross, 2000)
Navigation
Downloads
Results for ELF2_GABPA_ELF5
Z-value: 1.36
Motif logo
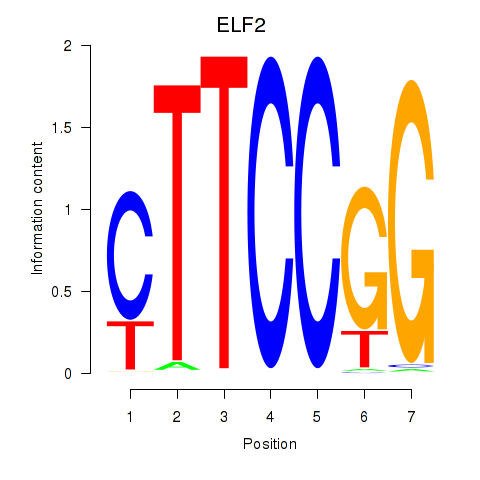
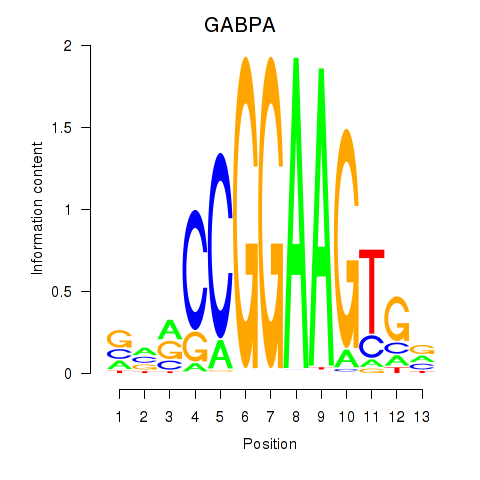
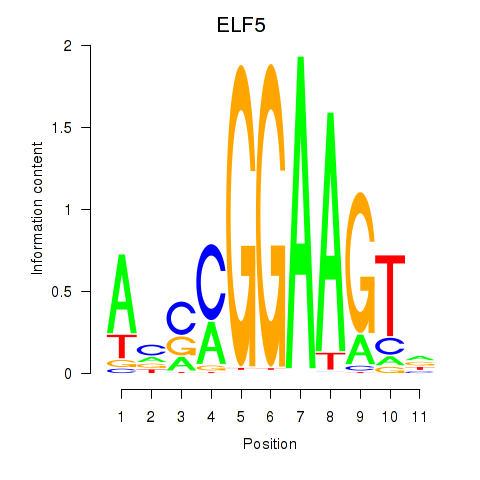
Transcription factors associated with ELF2_GABPA_ELF5
| Gene Symbol | Gene ID | Gene Info |
|---|---|---|
|
ELF2
|
ENSG00000109381.15 | E74 like ETS transcription factor 2 |
|
GABPA
|
ENSG00000154727.6 | GA binding protein transcription factor subunit alpha |
|
ELF5
|
ENSG00000135374.5 | E74 like ETS transcription factor 5 |
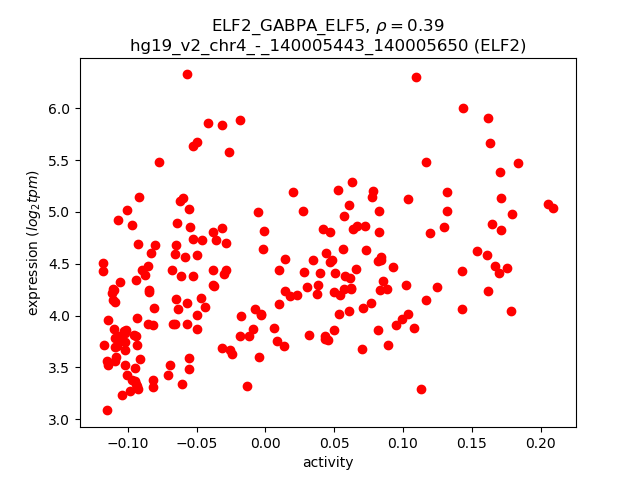
Activity-expression correlation:
| Gene | Promoter | Pearson corr. coef. | P-value | Plot |
|---|---|---|---|---|
| ELF2 | hg19_v2_chr4_-_140005443_140005650 | 0.39 | 3.4e-09 | Click! |
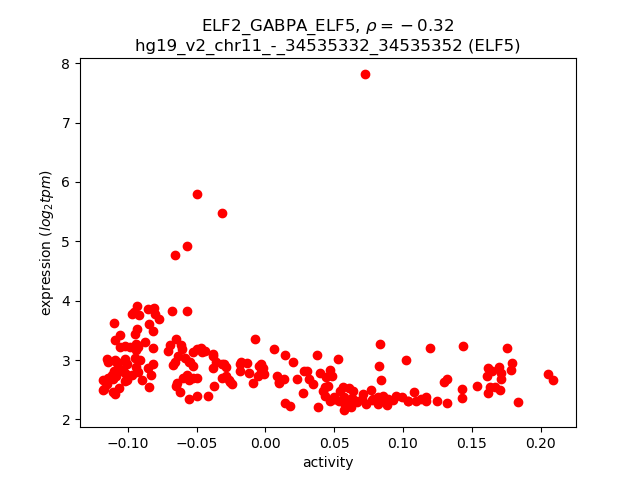
| ELF5 | hg19_v2_chr11_-_34535332_34535352 | -0.32 | 1.3e-06 | Click! |
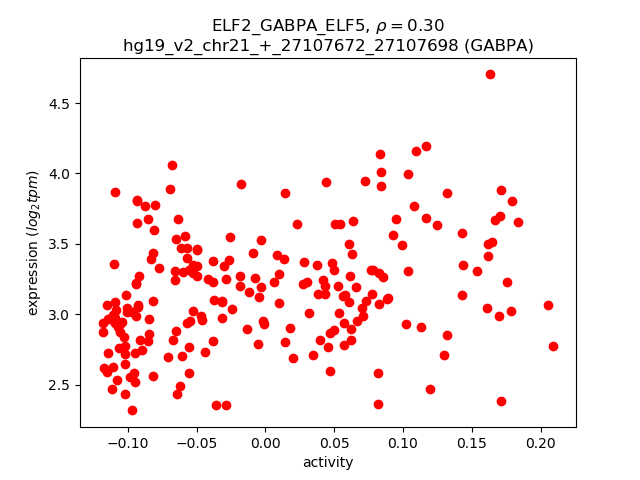
| GABPA | hg19_v2_chr21_+_27107672_27107698 | 0.30 | 5.7e-06 | Click! |
Activity profile of ELF2_GABPA_ELF5 motif
Sorted Z-values of ELF2_GABPA_ELF5 motif
| Promoter | Log-likelihood | Transcript | Gene | Gene Info |
|---|---|---|---|---|
| chr1_+_32687971 | 250.23 |
ENST00000373586.1
|
EIF3I
|
eukaryotic translation initiation factor 3, subunit I |
| chr20_-_49575058 | 227.86 |
ENST00000371584.4
ENST00000371583.5 ENST00000413082.1 |
DPM1
|
dolichyl-phosphate mannosyltransferase polypeptide 1, catalytic subunit |
| chr12_-_110888103 | 205.96 |
ENST00000426440.1
ENST00000228825.7 |
ARPC3
|
actin related protein 2/3 complex, subunit 3, 21kDa |
| chr14_-_69864993 | 203.36 |
ENST00000555373.1
|
ERH
|
enhancer of rudimentary homolog (Drosophila) |
| chr2_-_73964447 | 198.19 |
ENST00000272424.5
ENST00000409716.2 ENST00000318190.7 |
TPRKB
|
TP53RK binding protein |
| chr12_+_69080734 | 184.07 |
ENST00000378905.2
|
NUP107
|
nucleoporin 107kDa |
| chr1_+_40506392 | 163.00 |
ENST00000414893.1
ENST00000414281.1 ENST00000420216.1 ENST00000372792.2 ENST00000372798.1 ENST00000340450.3 ENST00000372805.3 ENST00000435719.1 ENST00000427843.1 ENST00000417287.1 ENST00000424977.1 ENST00000446031.1 |
CAP1
|
CAP, adenylate cyclase-associated protein 1 (yeast) |
| chr7_+_141438393 | 155.66 |
ENST00000484178.1
ENST00000473783.1 ENST00000481508.1 |
SSBP1
|
single-stranded DNA binding protein 1, mitochondrial |
| chr5_+_110074685 | 154.37 |
ENST00000355943.3
ENST00000447245.2 |
SLC25A46
|
solute carrier family 25, member 46 |
| chr19_-_10450287 | 150.78 |
ENST00000589261.1
ENST00000590569.1 ENST00000589580.1 ENST00000589249.1 |
ICAM3
|
intercellular adhesion molecule 3 |
| chr20_-_2451395 | 150.40 |
ENST00000339610.6
ENST00000381342.2 ENST00000438552.2 |
SNRPB
|
small nuclear ribonucleoprotein polypeptides B and B1 |
| chr10_+_12238171 | 142.39 |
ENST00000378900.2
ENST00000442050.1 |
CDC123
|
cell division cycle 123 |
| chr13_-_31191642 | 142.10 |
ENST00000405805.1
|
HMGB1
|
high mobility group box 1 |
| chr18_+_657733 | 138.60 |
ENST00000323250.5
ENST00000323224.7 |
TYMS
|
thymidylate synthetase |
| chr20_-_49575081 | 136.74 |
ENST00000371588.5
ENST00000371582.4 |
DPM1
|
dolichyl-phosphate mannosyltransferase polypeptide 1, catalytic subunit |
| chr7_-_5569588 | 133.94 |
ENST00000417101.1
|
ACTB
|
actin, beta |
| chr2_+_198380763 | 133.60 |
ENST00000448447.2
ENST00000409360.1 |
MOB4
|
MOB family member 4, phocein |
| chr2_+_65454863 | 132.38 |
ENST00000260641.5
|
ACTR2
|
ARP2 actin-related protein 2 homolog (yeast) |
| chr3_-_131221790 | 131.73 |
ENST00000512877.1
ENST00000264995.3 ENST00000511168.1 ENST00000425847.2 |
MRPL3
|
mitochondrial ribosomal protein L3 |
| chr22_-_36924944 | 131.70 |
ENST00000405442.1
ENST00000402116.1 |
EIF3D
|
eukaryotic translation initiation factor 3, subunit D |
| chr7_-_7680601 | 131.55 |
ENST00000396682.2
|
RPA3
|
replication protein A3, 14kDa |
| chr22_+_24951436 | 131.53 |
ENST00000215829.3
|
SNRPD3
|
small nuclear ribonucleoprotein D3 polypeptide 18kDa |
| chr1_+_203830703 | 129.90 |
ENST00000414487.2
|
SNRPE
|
small nuclear ribonucleoprotein polypeptide E |
| chr22_-_36925186 | 129.79 |
ENST00000541106.1
ENST00000455547.1 ENST00000432675.1 |
EIF3D
|
eukaryotic translation initiation factor 3, subunit D |
| chr1_+_40505891 | 128.01 |
ENST00000372797.3
ENST00000372802.1 ENST00000449311.1 |
CAP1
|
CAP, adenylate cyclase-associated protein 1 (yeast) |
| chr2_+_65454926 | 127.68 |
ENST00000542850.1
ENST00000377982.4 |
ACTR2
|
ARP2 actin-related protein 2 homolog (yeast) |
| chr11_-_67169253 | 126.47 |
ENST00000527663.1
ENST00000312989.7 |
PPP1CA
|
protein phosphatase 1, catalytic subunit, alpha isozyme |
| chr11_-_67169265 | 125.84 |
ENST00000358239.4
ENST00000376745.4 |
PPP1CA
|
protein phosphatase 1, catalytic subunit, alpha isozyme |
| chr10_-_43892668 | 123.16 |
ENST00000544000.1
|
HNRNPF
|
heterogeneous nuclear ribonucleoprotein F |
| chr10_+_43278217 | 120.88 |
ENST00000374518.5
|
BMS1
|
BMS1 ribosome biogenesis factor |
| chr10_+_12237924 | 120.74 |
ENST00000429258.2
ENST00000281141.4 |
CDC123
|
cell division cycle 123 |
| chrX_-_153775426 | 120.64 |
ENST00000393562.2
|
G6PD
|
glucose-6-phosphate dehydrogenase |
| chr2_-_37458749 | 120.13 |
ENST00000234170.5
|
CEBPZ
|
CCAAT/enhancer binding protein (C/EBP), zeta |
| chr5_+_167913450 | 118.72 |
ENST00000231572.3
ENST00000538719.1 |
RARS
|
arginyl-tRNA synthetase |
| chr11_+_32605350 | 118.61 |
ENST00000531120.1
ENST00000524896.1 ENST00000323213.5 |
EIF3M
|
eukaryotic translation initiation factor 3, subunit M |
| chr4_+_71554196 | 117.14 |
ENST00000254803.2
|
UTP3
|
UTP3, small subunit (SSU) processome component, homolog (S. cerevisiae) |
| chr1_+_84944926 | 117.02 |
ENST00000370656.1
ENST00000370654.5 |
RPF1
|
ribosome production factor 1 homolog (S. cerevisiae) |
| chr17_+_57784997 | 116.39 |
ENST00000537567.1
ENST00000539763.1 ENST00000587945.1 ENST00000536180.1 ENST00000589823.2 ENST00000592106.1 ENST00000591315.1 ENST00000545362.1 |
VMP1
|
vacuole membrane protein 1 |
| chr2_-_230786619 | 116.17 |
ENST00000389045.3
ENST00000409677.1 |
TRIP12
|
thyroid hormone receptor interactor 12 |
| chr2_-_99952769 | 115.70 |
ENST00000409434.1
ENST00000434323.1 ENST00000264255.3 |
TXNDC9
|
thioredoxin domain containing 9 |
| chr14_+_35761580 | 115.70 |
ENST00000553809.1
ENST00000555764.1 ENST00000556506.1 |
PSMA6
|
proteasome (prosome, macropain) subunit, alpha type, 6 |
| chr11_+_75110530 | 115.59 |
ENST00000531188.1
ENST00000530164.1 ENST00000422465.2 ENST00000278572.6 ENST00000534440.1 ENST00000527446.1 ENST00000526608.1 ENST00000527273.1 ENST00000524851.1 |
RPS3
|
ribosomal protein S3 |
| chr21_-_33984888 | 114.14 |
ENST00000382549.4
ENST00000540881.1 |
C21orf59
|
chromosome 21 open reading frame 59 |
| chr21_-_33985127 | 113.96 |
ENST00000290155.3
|
C21orf59
|
chromosome 21 open reading frame 59 |
| chr5_-_140700322 | 113.64 |
ENST00000313368.5
|
TAF7
|
TAF7 RNA polymerase II, TATA box binding protein (TBP)-associated factor, 55kDa |
| chr11_-_64084959 | 113.52 |
ENST00000535750.1
ENST00000535126.1 ENST00000539854.1 ENST00000308774.2 |
TRMT112
|
tRNA methyltransferase 11-2 homolog (S. cerevisiae) |
| chr1_-_165738072 | 112.73 |
ENST00000481278.1
|
TMCO1
|
transmembrane and coiled-coil domains 1 |
| chr10_-_43904235 | 111.88 |
ENST00000356053.3
|
HNRNPF
|
heterogeneous nuclear ribonucleoprotein F |
| chr11_-_64085533 | 111.75 |
ENST00000544844.1
|
TRMT112
|
tRNA methyltransferase 11-2 homolog (S. cerevisiae) |
| chr20_+_16710606 | 111.66 |
ENST00000377943.5
ENST00000246071.6 |
SNRPB2
|
small nuclear ribonucleoprotein polypeptide B |
| chr1_+_93811438 | 111.53 |
ENST00000370272.4
ENST00000370267.1 |
DR1
|
down-regulator of transcription 1, TBP-binding (negative cofactor 2) |
| chr21_-_33984865 | 111.30 |
ENST00000458138.1
|
C21orf59
|
chromosome 21 open reading frame 59 |
| chr19_+_13261216 | 111.05 |
ENST00000587885.1
ENST00000292433.3 |
IER2
|
immediate early response 2 |
| chr12_+_69979113 | 110.63 |
ENST00000299300.6
|
CCT2
|
chaperonin containing TCP1, subunit 2 (beta) |
| chr21_-_33984456 | 110.00 |
ENST00000431216.1
ENST00000553001.1 ENST00000440966.1 |
AP000275.65
C21orf59
|
Uncharacterized protein chromosome 21 open reading frame 59 |
| chr7_+_141438118 | 109.76 |
ENST00000265304.6
ENST00000498107.1 ENST00000467681.1 ENST00000465582.1 ENST00000463093.1 |
SSBP1
|
single-stranded DNA binding protein 1, mitochondrial |
| chr17_-_57784755 | 109.48 |
ENST00000537860.1
ENST00000393038.2 ENST00000409433.2 |
PTRH2
|
peptidyl-tRNA hydrolase 2 |
| chr16_+_30087288 | 109.04 |
ENST00000279387.7
ENST00000562664.1 ENST00000562222.1 |
PPP4C
|
protein phosphatase 4, catalytic subunit |
| chr19_-_51875894 | 109.03 |
ENST00000600427.1
ENST00000595217.1 ENST00000221978.5 |
NKG7
|
natural killer cell group 7 sequence |
| chr8_-_55014415 | 108.27 |
ENST00000522007.1
ENST00000521898.1 ENST00000518546.1 ENST00000316963.3 |
LYPLA1
|
lysophospholipase I |
| chr3_-_186524234 | 108.09 |
ENST00000418288.1
ENST00000296273.2 |
RFC4
|
replication factor C (activator 1) 4, 37kDa |
| chr14_+_35761540 | 107.49 |
ENST00000261479.4
|
PSMA6
|
proteasome (prosome, macropain) subunit, alpha type, 6 |
| chr12_-_112856623 | 107.43 |
ENST00000551291.2
|
RPL6
|
ribosomal protein L6 |
| chr2_+_118572226 | 107.22 |
ENST00000263239.2
|
DDX18
|
DEAD (Asp-Glu-Ala-Asp) box polypeptide 18 |
| chr3_-_64009102 | 107.16 |
ENST00000478185.1
ENST00000482510.1 ENST00000497323.1 ENST00000492933.1 ENST00000295901.4 |
PSMD6
|
proteasome (prosome, macropain) 26S subunit, non-ATPase, 6 |
| chr17_-_8113542 | 106.69 |
ENST00000578549.1
ENST00000535053.1 ENST00000582368.1 |
AURKB
|
aurora kinase B |
| chr11_+_62529008 | 106.57 |
ENST00000301788.7
ENST00000533442.1 |
POLR2G
|
polymerase (RNA) II (DNA directed) polypeptide G |
| chr6_-_31704282 | 106.46 |
ENST00000375784.3
ENST00000375779.2 |
CLIC1
|
chloride intracellular channel 1 |
| chr6_-_31926629 | 104.93 |
ENST00000375425.5
ENST00000426722.1 ENST00000441998.1 ENST00000444811.2 ENST00000375429.3 |
NELFE
|
negative elongation factor complex member E |
| chr1_-_155990580 | 104.88 |
ENST00000531917.1
ENST00000480567.1 ENST00000526212.1 ENST00000529008.1 ENST00000496742.1 ENST00000295702.4 |
SSR2
|
signal sequence receptor, beta (translocon-associated protein beta) |
| chr5_+_892745 | 104.39 |
ENST00000166345.3
|
TRIP13
|
thyroid hormone receptor interactor 13 |
| chr7_+_5085452 | 103.50 |
ENST00000353796.3
ENST00000396912.1 ENST00000396904.2 |
RBAK
RBAK-RBAKDN
|
RB-associated KRAB zinc finger RBAK-RBAKDN readthrough |
| chr11_+_65770227 | 103.39 |
ENST00000527348.1
|
BANF1
|
barrier to autointegration factor 1 |
| chr11_-_58345569 | 102.48 |
ENST00000528954.1
ENST00000528489.1 |
LPXN
|
leupaxin |
| chr10_-_43904608 | 102.42 |
ENST00000337970.3
|
HNRNPF
|
heterogeneous nuclear ribonucleoprotein F |
| chr18_+_3247413 | 102.28 |
ENST00000579226.1
ENST00000217652.3 |
MYL12A
|
myosin, light chain 12A, regulatory, non-sarcomeric |
| chr22_+_24951949 | 101.82 |
ENST00000402849.1
|
SNRPD3
|
small nuclear ribonucleoprotein D3 polypeptide 18kDa |
| chr19_+_30097181 | 100.84 |
ENST00000586420.1
ENST00000221770.3 ENST00000392279.3 ENST00000590688.1 |
POP4
|
processing of precursor 4, ribonuclease P/MRP subunit (S. cerevisiae) |
| chrX_+_118602363 | 100.65 |
ENST00000317881.8
|
SLC25A5
|
solute carrier family 25 (mitochondrial carrier; adenine nucleotide translocator), member 5 |
| chr14_+_57735614 | 99.74 |
ENST00000261558.3
|
AP5M1
|
adaptor-related protein complex 5, mu 1 subunit |
| chr6_-_31510181 | 99.71 |
ENST00000458640.1
ENST00000396172.1 ENST00000417556.2 |
DDX39B
|
DEAD (Asp-Glu-Ala-Asp) box polypeptide 39B |
| chr17_+_57784826 | 99.11 |
ENST00000262291.4
|
VMP1
|
vacuole membrane protein 1 |
| chr5_+_271752 | 98.79 |
ENST00000505221.1
ENST00000509581.1 ENST00000507528.1 |
PDCD6
|
programmed cell death 6 |
| chr11_+_65769946 | 98.06 |
ENST00000533166.1
|
BANF1
|
barrier to autointegration factor 1 |
| chr20_+_3190006 | 96.52 |
ENST00000380113.3
ENST00000455664.2 ENST00000399838.3 |
ITPA
|
inosine triphosphatase (nucleoside triphosphate pyrophosphatase) |
| chr3_-_49142504 | 96.42 |
ENST00000306125.6
ENST00000420147.2 |
QARS
|
glutaminyl-tRNA synthetase |
| chr19_+_50180317 | 95.64 |
ENST00000534465.1
|
PRMT1
|
protein arginine methyltransferase 1 |
| chr6_-_31509714 | 95.53 |
ENST00000456662.1
ENST00000431908.1 ENST00000456976.1 ENST00000428450.1 ENST00000453105.2 ENST00000418897.1 ENST00000415382.2 ENST00000449074.2 ENST00000419020.1 ENST00000428098.1 |
DDX39B
|
DEAD (Asp-Glu-Ala-Asp) box polypeptide 39B |
| chr8_-_121457332 | 95.52 |
ENST00000518918.1
|
MRPL13
|
mitochondrial ribosomal protein L13 |
| chr18_+_3247779 | 94.72 |
ENST00000578611.1
ENST00000583449.1 |
MYL12A
|
myosin, light chain 12A, regulatory, non-sarcomeric |
| chr14_-_71107921 | 94.28 |
ENST00000553982.1
ENST00000500016.1 |
CTD-2540L5.5
CTD-2540L5.6
|
CTD-2540L5.5 CTD-2540L5.6 |
| chr3_-_119396193 | 93.91 |
ENST00000484810.1
ENST00000497116.1 ENST00000261070.2 |
COX17
|
COX17 cytochrome c oxidase copper chaperone |
| chr1_-_20987889 | 93.47 |
ENST00000415136.2
|
DDOST
|
dolichyl-diphosphooligosaccharide--protein glycosyltransferase subunit (non-catalytic) |
| chr1_-_153518270 | 93.34 |
ENST00000354332.4
ENST00000368716.4 |
S100A4
|
S100 calcium binding protein A4 |
| chr19_+_35645618 | 92.50 |
ENST00000392218.2
ENST00000543307.1 ENST00000392219.2 ENST00000541435.2 ENST00000590686.1 ENST00000342879.3 ENST00000588699.1 |
FXYD5
|
FXYD domain containing ion transport regulator 5 |
| chr3_-_49142178 | 92.01 |
ENST00000452739.1
ENST00000414533.1 ENST00000417025.1 |
QARS
|
glutaminyl-tRNA synthetase |
| chr4_-_100815525 | 91.64 |
ENST00000226522.8
ENST00000499666.2 |
LAMTOR3
|
late endosomal/lysosomal adaptor, MAPK and MTOR activator 3 |
| chr6_-_41909191 | 91.48 |
ENST00000512426.1
ENST00000372987.4 |
CCND3
|
cyclin D3 |
| chrX_+_21958814 | 91.46 |
ENST00000379404.1
ENST00000415881.2 |
SMS
|
spermine synthase |
| chr2_-_55496174 | 91.31 |
ENST00000417363.1
ENST00000412530.1 ENST00000394600.3 ENST00000366137.2 ENST00000420637.1 |
MTIF2
|
mitochondrial translational initiation factor 2 |
| chr15_+_78833105 | 91.26 |
ENST00000558341.1
ENST00000559437.1 |
PSMA4
|
proteasome (prosome, macropain) subunit, alpha type, 4 |
| chr2_+_201936707 | 90.54 |
ENST00000433898.1
ENST00000454214.1 |
NDUFB3
|
NADH dehydrogenase (ubiquinone) 1 beta subcomplex, 3, 12kDa |
| chr11_-_14541872 | 90.35 |
ENST00000419365.2
ENST00000530457.1 ENST00000532256.1 ENST00000533068.1 |
PSMA1
|
proteasome (prosome, macropain) subunit, alpha type, 1 |
| chr16_-_30204987 | 89.93 |
ENST00000569282.1
ENST00000567436.1 |
BOLA2B
|
bolA family member 2B |
| chr15_-_65282232 | 89.75 |
ENST00000416889.2
|
SPG21
|
spastic paraplegia 21 (autosomal recessive, Mast syndrome) |
| chr17_+_1944790 | 89.63 |
ENST00000575162.1
|
DPH1
|
diphthamide biosynthesis 1 |
| chr16_-_67969888 | 89.49 |
ENST00000574576.2
|
PSMB10
|
proteasome (prosome, macropain) subunit, beta type, 10 |
| chr12_+_7079944 | 89.21 |
ENST00000261406.6
|
EMG1
|
EMG1 N1-specific pseudouridine methyltransferase |
| chr19_-_45927622 | 88.84 |
ENST00000300853.3
ENST00000589165.1 |
ERCC1
|
excision repair cross-complementing rodent repair deficiency, complementation group 1 (includes overlapping antisense sequence) |
| chr15_+_78833071 | 88.57 |
ENST00000559365.1
|
PSMA4
|
proteasome (prosome, macropain) subunit, alpha type, 4 |
| chr11_-_64013288 | 88.53 |
ENST00000542235.1
|
PPP1R14B
|
protein phosphatase 1, regulatory (inhibitor) subunit 14B |
| chr11_-_88070920 | 88.35 |
ENST00000524463.1
ENST00000227266.5 |
CTSC
|
cathepsin C |
| chr6_-_32812420 | 88.21 |
ENST00000374881.2
|
PSMB8
|
proteasome (prosome, macropain) subunit, beta type, 8 |
| chr3_+_151986709 | 88.09 |
ENST00000495875.2
ENST00000493459.1 ENST00000324210.5 ENST00000459747.1 |
MBNL1
|
muscleblind-like splicing regulator 1 |
| chr18_+_19192228 | 87.84 |
ENST00000300413.5
ENST00000579618.1 ENST00000582475.1 |
SNRPD1
|
small nuclear ribonucleoprotein D1 polypeptide 16kDa |
| chr6_-_2842087 | 87.66 |
ENST00000537185.1
|
SERPINB1
|
serpin peptidase inhibitor, clade B (ovalbumin), member 1 |
| chr19_-_10446449 | 87.40 |
ENST00000592439.1
|
ICAM3
|
intercellular adhesion molecule 3 |
| chr19_+_9938562 | 87.15 |
ENST00000586895.1
ENST00000358666.3 ENST00000590068.1 ENST00000593087.1 |
UBL5
|
ubiquitin-like 5 |
| chr4_+_41937131 | 86.85 |
ENST00000504986.1
ENST00000508448.1 ENST00000513702.1 ENST00000325094.5 |
TMEM33
|
transmembrane protein 33 |
| chr1_+_24018269 | 86.57 |
ENST00000374550.3
|
RPL11
|
ribosomal protein L11 |
| chr1_+_40723779 | 86.39 |
ENST00000372759.3
|
ZMPSTE24
|
zinc metallopeptidase STE24 |
| chr8_-_67974552 | 85.11 |
ENST00000357849.4
|
COPS5
|
COP9 signalosome subunit 5 |
| chr1_-_20987851 | 84.92 |
ENST00000464364.1
ENST00000602624.2 |
DDOST
|
dolichyl-diphosphooligosaccharide--protein glycosyltransferase subunit (non-catalytic) |
| chr2_+_201754050 | 84.83 |
ENST00000426253.1
ENST00000416651.1 ENST00000454952.1 ENST00000409020.1 ENST00000359683.4 |
NIF3L1
|
NIF3 NGG1 interacting factor 3-like 1 (S. cerevisiae) |
| chrX_+_100646190 | 84.63 |
ENST00000471855.1
|
RPL36A
|
ribosomal protein L36a |
| chr19_+_35645817 | 84.14 |
ENST00000423817.3
|
FXYD5
|
FXYD domain containing ion transport regulator 5 |
| chr7_+_102988082 | 83.77 |
ENST00000292644.3
ENST00000544811.1 |
PSMC2
|
proteasome (prosome, macropain) 26S subunit, ATPase, 2 |
| chr1_-_43638168 | 83.54 |
ENST00000431635.2
|
EBNA1BP2
|
EBNA1 binding protein 2 |
| chr16_-_12009833 | 83.39 |
ENST00000420576.2
|
GSPT1
|
G1 to S phase transition 1 |
| chr20_+_388935 | 83.25 |
ENST00000382181.2
ENST00000400247.3 |
RBCK1
|
RanBP-type and C3HC4-type zinc finger containing 1 |
| chr10_-_27443155 | 83.06 |
ENST00000427324.1
ENST00000326799.3 |
YME1L1
|
YME1-like 1 ATPase |
| chr2_-_55496344 | 83.04 |
ENST00000403721.1
ENST00000263629.4 |
MTIF2
|
mitochondrial translational initiation factor 2 |
| chr6_+_30035307 | 83.04 |
ENST00000376765.2
ENST00000376763.1 |
PPP1R11
|
protein phosphatase 1, regulatory (inhibitor) subunit 11 |
| chr11_+_65769550 | 82.88 |
ENST00000312175.2
ENST00000445560.2 ENST00000530204.1 |
BANF1
|
barrier to autointegration factor 1 |
| chr12_+_69979210 | 82.86 |
ENST00000544368.2
|
CCT2
|
chaperonin containing TCP1, subunit 2 (beta) |
| chr12_-_112847108 | 82.81 |
ENST00000549847.1
|
RPL6
|
ribosomal protein L6 |
| chr3_+_160117087 | 82.56 |
ENST00000357388.3
|
SMC4
|
structural maintenance of chromosomes 4 |
| chr11_-_65655906 | 82.31 |
ENST00000533045.1
ENST00000338369.2 ENST00000357519.4 |
FIBP
|
fibroblast growth factor (acidic) intracellular binding protein |
| chr15_-_65282274 | 82.09 |
ENST00000204566.2
|
SPG21
|
spastic paraplegia 21 (autosomal recessive, Mast syndrome) |
| chr15_-_101835110 | 81.95 |
ENST00000560496.1
|
SNRPA1
|
small nuclear ribonucleoprotein polypeptide A' |
| chr6_-_32811771 | 81.65 |
ENST00000395339.3
ENST00000374882.3 |
PSMB8
|
proteasome (prosome, macropain) subunit, beta type, 8 |
| chr3_-_133380731 | 81.45 |
ENST00000260810.5
|
TOPBP1
|
topoisomerase (DNA) II binding protein 1 |
| chr11_-_64013663 | 81.10 |
ENST00000392210.2
|
PPP1R14B
|
protein phosphatase 1, regulatory (inhibitor) subunit 14B |
| chr2_+_201754135 | 81.01 |
ENST00000409357.1
ENST00000409129.2 |
NIF3L1
|
NIF3 NGG1 interacting factor 3-like 1 (S. cerevisiae) |
| chr12_-_66563786 | 80.77 |
ENST00000542724.1
|
TMBIM4
|
transmembrane BAX inhibitor motif containing 4 |
| chr15_+_78832747 | 80.71 |
ENST00000560217.1
ENST00000044462.7 ENST00000559082.1 ENST00000559948.1 ENST00000413382.2 ENST00000559146.1 ENST00000558281.1 |
PSMA4
|
proteasome (prosome, macropain) subunit, alpha type, 4 |
| chr10_+_51371390 | 80.47 |
ENST00000478381.1
ENST00000451577.2 ENST00000374098.2 ENST00000374097.2 |
TIMM23B
|
translocase of inner mitochondrial membrane 23 homolog B (yeast) |
| chr5_-_140070897 | 80.28 |
ENST00000448240.1
ENST00000438307.2 ENST00000415192.2 ENST00000457527.2 ENST00000307633.3 ENST00000507746.1 ENST00000431330.2 |
HARS
|
histidyl-tRNA synthetase |
| chr8_-_55014336 | 79.86 |
ENST00000343231.6
|
LYPLA1
|
lysophospholipase I |
| chr9_+_116037922 | 79.43 |
ENST00000374198.4
|
PRPF4
|
pre-mRNA processing factor 4 |
| chr7_+_30634297 | 79.19 |
ENST00000389266.3
|
GARS
|
glycyl-tRNA synthetase |
| chr22_-_29949634 | 79.12 |
ENST00000397872.1
ENST00000397871.1 ENST00000440771.1 |
THOC5
|
THO complex 5 |
| chr12_-_498620 | 79.04 |
ENST00000399788.2
ENST00000382815.4 |
KDM5A
|
lysine (K)-specific demethylase 5A |
| chr17_+_73008755 | 78.65 |
ENST00000584208.1
ENST00000301585.5 |
ICT1
|
immature colon carcinoma transcript 1 |
| chr5_-_150284351 | 78.07 |
ENST00000427179.1
|
ZNF300
|
zinc finger protein 300 |
| chr7_+_99006550 | 78.02 |
ENST00000222969.5
|
BUD31
|
BUD31 homolog (S. cerevisiae) |
| chr16_-_85833160 | 77.99 |
ENST00000435200.2
|
EMC8
|
ER membrane protein complex subunit 8 |
| chr4_-_10118348 | 77.57 |
ENST00000502702.1
|
WDR1
|
WD repeat domain 1 |
| chr6_+_32811885 | 77.37 |
ENST00000458296.1
ENST00000413039.1 ENST00000429600.1 ENST00000412095.1 ENST00000415067.1 ENST00000395330.1 |
TAPSAR1
PSMB9
|
TAP1 and PSMB8 antisense RNA 1 proteasome (prosome, macropain) subunit, beta type, 9 |
| chr5_+_271733 | 76.51 |
ENST00000264933.4
|
PDCD6
|
programmed cell death 6 |
| chr21_-_46340884 | 76.17 |
ENST00000302347.5
ENST00000517819.1 |
ITGB2
|
integrin, beta 2 (complement component 3 receptor 3 and 4 subunit) |
| chr3_+_142720366 | 76.03 |
ENST00000493782.1
ENST00000397933.2 ENST00000473835.2 ENST00000493598.2 |
U2SURP
|
U2 snRNP-associated SURP domain containing |
| chr7_-_99698338 | 75.92 |
ENST00000354230.3
ENST00000425308.1 |
MCM7
|
minichromosome maintenance complex component 7 |
| chr10_+_75504105 | 75.89 |
ENST00000535742.1
ENST00000546025.1 ENST00000345254.4 ENST00000540668.1 ENST00000339365.2 ENST00000411652.2 |
SEC24C
|
SEC24 family member C |
| chr15_-_64455404 | 75.30 |
ENST00000300026.3
|
PPIB
|
peptidylprolyl isomerase B (cyclophilin B) |
| chr16_-_29465668 | 75.27 |
ENST00000569622.1
|
RP11-345J4.5
|
BolA-like protein 2 |
| chr1_-_63988846 | 75.19 |
ENST00000283568.8
ENST00000371092.3 ENST00000271002.10 |
ITGB3BP
|
integrin beta 3 binding protein (beta3-endonexin) |
| chr6_+_30034865 | 74.88 |
ENST00000376772.3
|
PPP1R11
|
protein phosphatase 1, regulatory (inhibitor) subunit 11 |
| chr4_-_120988229 | 74.77 |
ENST00000296509.6
|
MAD2L1
|
MAD2 mitotic arrest deficient-like 1 (yeast) |
| chr1_+_24019099 | 74.44 |
ENST00000443624.1
ENST00000458455.1 |
RPL11
|
ribosomal protein L11 |
| chr4_-_10118573 | 74.23 |
ENST00000382452.2
ENST00000382451.2 |
WDR1
|
WD repeat domain 1 |
| chr5_+_68530668 | 74.10 |
ENST00000506563.1
|
CDK7
|
cyclin-dependent kinase 7 |
| chr7_-_54826920 | 73.90 |
ENST00000395535.3
ENST00000352861.4 |
SEC61G
|
Sec61 gamma subunit |
| chr2_+_122494676 | 73.79 |
ENST00000455432.1
|
TSN
|
translin |
| chr15_+_75074410 | 73.62 |
ENST00000439220.2
|
CSK
|
c-src tyrosine kinase |
| chr11_+_118889142 | 73.50 |
ENST00000533632.1
|
TRAPPC4
|
trafficking protein particle complex 4 |
| chr1_-_108742957 | 73.33 |
ENST00000565488.1
|
SLC25A24
|
solute carrier family 25 (mitochondrial carrier; phosphate carrier), member 24 |
| chr1_+_32479430 | 73.29 |
ENST00000327300.7
ENST00000492989.1 |
KHDRBS1
|
KH domain containing, RNA binding, signal transduction associated 1 |
| chr11_+_118230287 | 73.06 |
ENST00000252108.3
ENST00000431736.2 |
UBE4A
|
ubiquitination factor E4A |
| chr12_+_51632638 | 72.84 |
ENST00000549732.2
|
DAZAP2
|
DAZ associated protein 2 |
| chr5_-_176778523 | 72.61 |
ENST00000513877.1
ENST00000515209.1 ENST00000514458.1 ENST00000502560.1 |
LMAN2
|
lectin, mannose-binding 2 |
| chr14_-_21979428 | 72.09 |
ENST00000538267.1
ENST00000298717.4 |
METTL3
|
methyltransferase like 3 |
| chr1_-_159894319 | 72.02 |
ENST00000320307.4
|
TAGLN2
|
transgelin 2 |
| chr7_+_44240520 | 71.96 |
ENST00000496112.1
ENST00000223369.2 |
YKT6
|
YKT6 v-SNARE homolog (S. cerevisiae) |
| chr15_-_83736091 | 71.92 |
ENST00000261721.4
|
BTBD1
|
BTB (POZ) domain containing 1 |
| chr11_-_57298187 | 71.89 |
ENST00000525158.1
ENST00000257245.4 ENST00000525587.1 |
TIMM10
|
translocase of inner mitochondrial membrane 10 homolog (yeast) |
| chr19_-_10450328 | 71.67 |
ENST00000160262.5
|
ICAM3
|
intercellular adhesion molecule 3 |
| chr15_+_66161802 | 71.49 |
ENST00000566233.1
ENST00000565075.1 ENST00000435304.2 |
RAB11A
|
RAB11A, member RAS oncogene family |
| chr20_-_33872518 | 70.49 |
ENST00000374436.3
|
EIF6
|
eukaryotic translation initiation factor 6 |
| chr7_-_102119342 | 70.38 |
ENST00000393794.3
ENST00000292614.5 |
POLR2J
|
polymerase (RNA) II (DNA directed) polypeptide J, 13.3kDa |
| chr1_-_20987982 | 70.37 |
ENST00000375048.3
|
DDOST
|
dolichyl-diphosphooligosaccharide--protein glycosyltransferase subunit (non-catalytic) |
| chr9_-_88969303 | 70.30 |
ENST00000277141.6
ENST00000375963.3 |
ZCCHC6
|
zinc finger, CCHC domain containing 6 |
| chr7_+_2281843 | 70.28 |
ENST00000356714.1
ENST00000397049.1 |
NUDT1
|
nudix (nucleoside diphosphate linked moiety X)-type motif 1 |
| chr9_-_2844058 | 70.07 |
ENST00000397885.2
|
KIAA0020
|
KIAA0020 |
| chr12_-_121019165 | 70.00 |
ENST00000341039.2
ENST00000357500.4 |
POP5
|
processing of precursor 5, ribonuclease P/MRP subunit (S. cerevisiae) |
| chr2_-_230786679 | 70.00 |
ENST00000543084.1
ENST00000343290.5 ENST00000389044.4 ENST00000283943.5 |
TRIP12
|
thyroid hormone receptor interactor 12 |
| chr6_+_22569784 | 70.00 |
ENST00000510882.2
|
HDGFL1
|
hepatoma derived growth factor-like 1 |
| chr15_+_44092784 | 69.92 |
ENST00000458412.1
|
HYPK
|
huntingtin interacting protein K |
| chr20_-_33872548 | 69.76 |
ENST00000374443.3
|
EIF6
|
eukaryotic translation initiation factor 6 |
| chr16_-_85833109 | 69.72 |
ENST00000253457.3
|
EMC8
|
ER membrane protein complex subunit 8 |
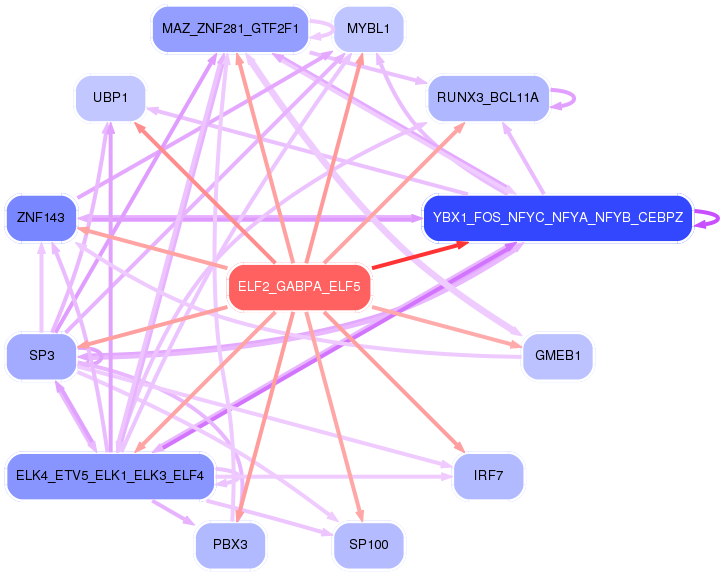
Network of associatons between targets according to the STRING database.

First level regulatory network of ELF2_GABPA_ELF5
Gene Ontology Analysis
Gene overrepresentation in biological_process category:
| Log-likelihood per target | Total log-likelihood | Term | Description |
|---|---|---|---|
| 92.0 | 276.1 | GO:0001732 | formation of cytoplasmic translation initiation complex(GO:0001732) |
| 91.6 | 274.7 | GO:0016344 | meiotic chromosome movement towards spindle pole(GO:0016344) |
| 75.4 | 377.2 | GO:0019348 | dolichol metabolic process(GO:0019348) |
| 72.4 | 217.3 | GO:0051086 | chaperone mediated protein folding independent of cofactor(GO:0051086) |
| 71.5 | 357.5 | GO:0042997 | negative regulation of Golgi to plasma membrane protein transport(GO:0042997) |
| 69.6 | 208.7 | GO:0090149 | mitochondrial membrane fission(GO:0090149) |
| 64.8 | 194.5 | GO:0006425 | glutaminyl-tRNA aminoacylation(GO:0006425) |
| 63.1 | 252.3 | GO:0036496 | regulation of translational initiation by eIF2 alpha dephosphorylation(GO:0036496) |
| 62.5 | 187.4 | GO:0006597 | spermine biosynthetic process(GO:0006597) |
| 61.8 | 247.3 | GO:0018364 | peptidyl-glutamine methylation(GO:0018364) |
| 58.9 | 176.6 | GO:0046586 | regulation of calcium-dependent cell-cell adhesion(GO:0046586) |
| 58.3 | 233.2 | GO:0006235 | dTTP biosynthetic process(GO:0006235) pyrimidine deoxyribonucleoside triphosphate biosynthetic process(GO:0009212) |
| 57.0 | 171.1 | GO:0044878 | mitotic cytokinesis checkpoint(GO:0044878) |
| 56.1 | 224.6 | GO:0042247 | morphogenesis of follicular epithelium(GO:0016333) establishment or maintenance of polarity of follicular epithelium(GO:0016334) establishment of planar polarity of follicular epithelium(GO:0042247) |
| 55.8 | 167.3 | GO:0006427 | histidyl-tRNA aminoacylation(GO:0006427) |
| 54.3 | 271.5 | GO:0000973 | posttranscriptional tethering of RNA polymerase II gene DNA at nuclear periphery(GO:0000973) |
| 53.5 | 214.1 | GO:1902626 | assembly of large subunit precursor of preribosome(GO:1902626) |
| 52.4 | 209.7 | GO:0010796 | regulation of multivesicular body size(GO:0010796) |
| 51.3 | 154.0 | GO:1903722 | regulation of centriole elongation(GO:1903722) |
| 49.2 | 49.2 | GO:0090611 | ubiquitin-independent protein catabolic process via the multivesicular body sorting pathway(GO:0090611) |
| 49.2 | 147.5 | GO:0009051 | pentose-phosphate shunt, oxidative branch(GO:0009051) |
| 46.3 | 185.1 | GO:0032218 | riboflavin transport(GO:0032218) |
| 44.4 | 177.6 | GO:0036228 | protein targeting to nuclear inner membrane(GO:0036228) |
| 41.3 | 124.0 | GO:0006617 | SRP-dependent cotranslational protein targeting to membrane, signal sequence recognition(GO:0006617) |
| 40.3 | 161.0 | GO:2000434 | regulation of protein neddylation(GO:2000434) negative regulation of protein neddylation(GO:2000435) |
| 39.9 | 159.5 | GO:0006203 | dGTP catabolic process(GO:0006203) |
| 39.3 | 275.4 | GO:1900045 | negative regulation of histone ubiquitination(GO:0033183) negative regulation of protein K63-linked ubiquitination(GO:1900045) regulation of histone H2A K63-linked ubiquitination(GO:1901314) negative regulation of histone H2A K63-linked ubiquitination(GO:1901315) negative regulation of protein polyubiquitination(GO:1902915) |
| 38.7 | 116.0 | GO:0002184 | cytoplasmic translational termination(GO:0002184) |
| 38.6 | 193.1 | GO:0032079 | positive regulation of endodeoxyribonuclease activity(GO:0032079) |
| 38.1 | 152.4 | GO:0002270 | plasmacytoid dendritic cell activation(GO:0002270) T cell mediated immune response to tumor cell(GO:0002424) regulation of T cell mediated immune response to tumor cell(GO:0002840) regulation of restriction endodeoxyribonuclease activity(GO:0032072) negative regulation of apoptotic cell clearance(GO:2000426) |
| 37.5 | 112.5 | GO:1902822 | regulation of late endosome to lysosome transport(GO:1902822) |
| 36.8 | 110.4 | GO:0015846 | polyamine transport(GO:0015846) |
| 36.4 | 109.3 | GO:0000354 | cis assembly of pre-catalytic spliceosome(GO:0000354) |
| 36.4 | 109.3 | GO:0000972 | transcription-dependent tethering of RNA polymerase II gene DNA at nuclear periphery(GO:0000972) |
| 36.4 | 218.7 | GO:0030948 | negative regulation of vascular endothelial growth factor receptor signaling pathway(GO:0030948) |
| 35.8 | 107.4 | GO:1903595 | positive regulation of histamine secretion by mast cell(GO:1903595) |
| 35.4 | 212.5 | GO:0046985 | positive regulation of hemoglobin biosynthetic process(GO:0046985) |
| 35.2 | 176.2 | GO:0075525 | viral translational termination-reinitiation(GO:0075525) |
| 35.2 | 211.0 | GO:1904431 | positive regulation of t-circle formation(GO:1904431) |
| 34.8 | 34.8 | GO:0046984 | regulation of hemoglobin biosynthetic process(GO:0046984) |
| 34.2 | 102.5 | GO:0006420 | arginyl-tRNA aminoacylation(GO:0006420) |
| 33.9 | 339.0 | GO:0051096 | positive regulation of helicase activity(GO:0051096) |
| 33.0 | 231.1 | GO:1903679 | regulation of cap-independent translational initiation(GO:1903677) positive regulation of cap-independent translational initiation(GO:1903679) regulation of cytoplasmic translational initiation(GO:1904688) positive regulation of cytoplasmic translational initiation(GO:1904690) |
| 32.8 | 131.2 | GO:0035752 | lysosomal lumen pH elevation(GO:0035752) |
| 32.8 | 65.6 | GO:0046070 | dGTP metabolic process(GO:0046070) |
| 32.8 | 98.4 | GO:2001162 | regulation of histone H3-K79 methylation(GO:2001160) positive regulation of histone H3-K79 methylation(GO:2001162) |
| 32.3 | 129.0 | GO:0046116 | queuosine biosynthetic process(GO:0008616) queuosine metabolic process(GO:0046116) |
| 32.2 | 96.7 | GO:0006616 | SRP-dependent cotranslational protein targeting to membrane, translocation(GO:0006616) |
| 32.2 | 96.5 | GO:0009146 | purine nucleoside triphosphate catabolic process(GO:0009146) |
| 31.8 | 190.8 | GO:0015866 | ADP transport(GO:0015866) |
| 31.8 | 95.3 | GO:0002084 | protein depalmitoylation(GO:0002084) |
| 31.6 | 63.3 | GO:0002188 | translation reinitiation(GO:0002188) |
| 31.4 | 503.0 | GO:0043248 | proteasome assembly(GO:0043248) |
| 31.0 | 31.0 | GO:0006283 | transcription-coupled nucleotide-excision repair(GO:0006283) |
| 30.1 | 120.3 | GO:0046833 | positive regulation of RNA export from nucleus(GO:0046833) |
| 30.0 | 89.9 | GO:0000912 | assembly of actomyosin apparatus involved in cytokinesis(GO:0000912) actomyosin contractile ring assembly(GO:0000915) actomyosin contractile ring organization(GO:0044837) |
| 29.9 | 239.6 | GO:0050859 | negative regulation of B cell receptor signaling pathway(GO:0050859) |
| 29.7 | 59.4 | GO:1903772 | regulation of viral budding via host ESCRT complex(GO:1903772) |
| 29.5 | 118.0 | GO:0015960 | diadenosine polyphosphate biosynthetic process(GO:0015960) diadenosine tetraphosphate metabolic process(GO:0015965) diadenosine tetraphosphate biosynthetic process(GO:0015966) |
| 29.5 | 88.4 | GO:0015883 | FAD transport(GO:0015883) FAD transmembrane transport(GO:0035350) |
| 29.4 | 88.2 | GO:1903371 | regulation of endoplasmic reticulum tubular network organization(GO:1903371) |
| 29.3 | 205.1 | GO:0016074 | snoRNA metabolic process(GO:0016074) |
| 29.1 | 29.1 | GO:2001181 | positive regulation of interleukin-10 secretion(GO:2001181) |
| 28.9 | 115.6 | GO:0071461 | cellular response to redox state(GO:0071461) |
| 28.8 | 86.4 | GO:0030327 | prenylated protein catabolic process(GO:0030327) |
| 28.6 | 114.3 | GO:0006051 | mannosamine metabolic process(GO:0006050) N-acetylmannosamine metabolic process(GO:0006051) |
| 28.4 | 85.3 | GO:0042256 | mature ribosome assembly(GO:0042256) |
| 28.4 | 255.5 | GO:2000002 | negative regulation of DNA damage checkpoint(GO:2000002) |
| 28.3 | 226.4 | GO:0010032 | meiotic chromosome condensation(GO:0010032) |
| 28.3 | 1386.4 | GO:0000387 | spliceosomal snRNP assembly(GO:0000387) |
| 28.2 | 84.7 | GO:0070668 | regulation of mast cell proliferation(GO:0070666) positive regulation of mast cell proliferation(GO:0070668) |
| 28.1 | 84.3 | GO:0051083 | 'de novo' cotranslational protein folding(GO:0051083) |
| 27.8 | 27.8 | GO:1904868 | telomerase catalytic core complex assembly(GO:1904868) regulation of telomerase catalytic core complex assembly(GO:1904882) positive regulation of telomerase catalytic core complex assembly(GO:1904884) |
| 27.7 | 83.2 | GO:0006435 | threonyl-tRNA aminoacylation(GO:0006435) |
| 27.7 | 27.7 | GO:0006513 | protein monoubiquitination(GO:0006513) |
| 27.2 | 27.2 | GO:0036480 | neuron intrinsic apoptotic signaling pathway in response to oxidative stress(GO:0036480) positive regulation of oxidative stress-induced neuron death(GO:1903223) regulation of oxidative stress-induced neuron intrinsic apoptotic signaling pathway(GO:1903376) positive regulation of oxidative stress-induced neuron intrinsic apoptotic signaling pathway(GO:1903378) |
| 26.2 | 209.6 | GO:0006659 | phosphatidylserine biosynthetic process(GO:0006659) |
| 26.1 | 130.3 | GO:1900262 | regulation of DNA-directed DNA polymerase activity(GO:1900262) positive regulation of DNA-directed DNA polymerase activity(GO:1900264) |
| 25.5 | 25.5 | GO:0000965 | mitochondrial RNA 3'-end processing(GO:0000965) |
| 25.1 | 75.3 | GO:1901873 | regulation of post-translational protein modification(GO:1901873) |
| 25.0 | 199.9 | GO:0034982 | mitochondrial protein processing(GO:0034982) |
| 25.0 | 2321.9 | GO:0006521 | regulation of cellular amino acid metabolic process(GO:0006521) |
| 24.9 | 124.4 | GO:0032511 | late endosome to vacuole transport via multivesicular body sorting pathway(GO:0032511) |
| 24.7 | 49.4 | GO:0045903 | positive regulation of translational fidelity(GO:0045903) |
| 24.5 | 24.5 | GO:0051126 | negative regulation of Arp2/3 complex-mediated actin nucleation(GO:0034316) negative regulation of actin nucleation(GO:0051126) |
| 24.4 | 97.4 | GO:0007144 | female meiosis I(GO:0007144) |
| 24.3 | 72.8 | GO:0033341 | regulation of collagen binding(GO:0033341) |
| 24.3 | 291.1 | GO:0015074 | DNA integration(GO:0015074) |
| 24.0 | 24.0 | GO:0071480 | cellular response to gamma radiation(GO:0071480) |
| 23.2 | 139.5 | GO:0070475 | rRNA base methylation(GO:0070475) |
| 22.6 | 67.9 | GO:0019474 | L-lysine catabolic process to acetyl-CoA(GO:0019474) L-lysine catabolic process(GO:0019477) L-lysine metabolic process(GO:0046440) |
| 22.1 | 44.1 | GO:0043096 | purine nucleobase salvage(GO:0043096) |
| 22.0 | 88.0 | GO:0032790 | ribosome disassembly(GO:0032790) |
| 21.6 | 432.6 | GO:0000460 | maturation of 5.8S rRNA(GO:0000460) |
| 21.3 | 192.0 | GO:0045039 | protein import into mitochondrial inner membrane(GO:0045039) |
| 21.2 | 169.9 | GO:0085020 | protein K6-linked ubiquitination(GO:0085020) |
| 21.2 | 106.0 | GO:0006613 | cotranslational protein targeting to membrane(GO:0006613) |
| 20.9 | 62.8 | GO:1902568 | positive regulation of eosinophil degranulation(GO:0043311) positive regulation of eosinophil activation(GO:1902568) |
| 20.8 | 207.8 | GO:1903944 | regulation of hepatocyte apoptotic process(GO:1903943) negative regulation of hepatocyte apoptotic process(GO:1903944) |
| 20.7 | 62.2 | GO:0070902 | mitochondrial tRNA pseudouridine synthesis(GO:0070902) |
| 20.6 | 164.4 | GO:2000210 | positive regulation of anoikis(GO:2000210) |
| 20.5 | 61.6 | GO:0052250 | modulation of signal transduction in other organism(GO:0044501) modulation by symbiont of host signal transduction pathway(GO:0052027) modulation of signal transduction in other organism involved in symbiotic interaction(GO:0052250) modulation by symbiont of host I-kappaB kinase/NF-kappaB cascade(GO:0085032) |
| 20.3 | 61.0 | GO:0036089 | cleavage furrow formation(GO:0036089) |
| 20.3 | 81.2 | GO:0006432 | phenylalanyl-tRNA aminoacylation(GO:0006432) |
| 20.0 | 140.2 | GO:0000290 | deadenylation-dependent decapping of nuclear-transcribed mRNA(GO:0000290) |
| 19.9 | 59.7 | GO:0033140 | negative regulation of peptidyl-serine phosphorylation of STAT protein(GO:0033140) |
| 19.8 | 79.0 | GO:0031064 | negative regulation of histone deacetylation(GO:0031064) |
| 19.6 | 78.2 | GO:0006049 | UDP-N-acetylglucosamine catabolic process(GO:0006049) |
| 19.5 | 58.6 | GO:0034124 | regulation of MyD88-dependent toll-like receptor signaling pathway(GO:0034124) |
| 19.5 | 78.1 | GO:0030242 | pexophagy(GO:0030242) |
| 19.4 | 58.2 | GO:0031120 | snRNA pseudouridine synthesis(GO:0031120) |
| 19.3 | 270.3 | GO:0000478 | endonucleolytic cleavage involved in rRNA processing(GO:0000478) |
| 19.2 | 134.5 | GO:1903895 | negative regulation of IRE1-mediated unfolded protein response(GO:1903895) |
| 19.2 | 115.3 | GO:0019060 | intracellular transport of viral protein in host cell(GO:0019060) symbiont intracellular protein transport in host(GO:0030581) intracellular protein transport in other organism involved in symbiotic interaction(GO:0051708) |
| 19.2 | 57.6 | GO:0039513 | modulation by virus of host molecular function(GO:0039506) suppression by virus of host molecular function(GO:0039507) suppression by virus of host catalytic activity(GO:0039513) modulation by virus of host catalytic activity(GO:0039516) suppression by virus of host cysteine-type endopeptidase activity involved in apoptotic process(GO:0039650) negative regulation by symbiont of host catalytic activity(GO:0052053) negative regulation by symbiont of host molecular function(GO:0052056) modulation by symbiont of host catalytic activity(GO:0052148) |
| 19.2 | 441.0 | GO:0000028 | ribosomal small subunit assembly(GO:0000028) |
| 19.2 | 38.3 | GO:1901656 | glycoside transport(GO:1901656) |
| 19.1 | 114.7 | GO:0010792 | DNA double-strand break processing involved in repair via single-strand annealing(GO:0010792) |
| 19.1 | 95.3 | GO:1903588 | negative regulation of blood vessel endothelial cell proliferation involved in sprouting angiogenesis(GO:1903588) |
| 18.7 | 56.0 | GO:1902463 | protein localization to cell leading edge(GO:1902463) |
| 18.5 | 18.5 | GO:1903959 | regulation of anion transmembrane transport(GO:1903959) |
| 18.5 | 55.5 | GO:0046294 | formaldehyde catabolic process(GO:0046294) |
| 18.5 | 74.0 | GO:1903298 | regulation of hypoxia-induced intrinsic apoptotic signaling pathway(GO:1903297) negative regulation of hypoxia-induced intrinsic apoptotic signaling pathway(GO:1903298) |
| 18.4 | 36.9 | GO:1904751 | positive regulation of protein localization to nucleolus(GO:1904751) |
| 18.3 | 182.7 | GO:0006268 | DNA unwinding involved in DNA replication(GO:0006268) |
| 18.3 | 109.6 | GO:0061086 | negative regulation of histone H3-K27 methylation(GO:0061086) |
| 18.1 | 72.5 | GO:0006556 | S-adenosylmethionine biosynthetic process(GO:0006556) |
| 18.0 | 269.8 | GO:0033523 | histone H2B ubiquitination(GO:0033523) |
| 17.9 | 53.7 | GO:2000687 | negative regulation of rubidium ion transport(GO:2000681) negative regulation of rubidium ion transmembrane transporter activity(GO:2000687) |
| 17.9 | 17.9 | GO:1902527 | positive regulation of protein monoubiquitination(GO:1902527) |
| 17.9 | 804.9 | GO:0009452 | 7-methylguanosine RNA capping(GO:0009452) RNA capping(GO:0036260) |
| 17.8 | 17.8 | GO:0046102 | inosine metabolic process(GO:0046102) |
| 17.5 | 280.0 | GO:0006295 | nucleotide-excision repair, preincision complex stabilization(GO:0006293) nucleotide-excision repair, DNA incision, 3'-to lesion(GO:0006295) |
| 17.4 | 261.0 | GO:0030150 | protein import into mitochondrial matrix(GO:0030150) |
| 17.4 | 52.2 | GO:1903377 | negative regulation of oxidative stress-induced neuron intrinsic apoptotic signaling pathway(GO:1903377) |
| 17.3 | 138.7 | GO:0006983 | ER overload response(GO:0006983) |
| 17.2 | 51.7 | GO:0035521 | monoubiquitinated histone deubiquitination(GO:0035521) monoubiquitinated histone H2A deubiquitination(GO:0035522) |
| 17.1 | 51.4 | GO:0039534 | negative regulation of MDA-5 signaling pathway(GO:0039534) |
| 17.1 | 342.1 | GO:0043101 | purine-containing compound salvage(GO:0043101) |
| 17.1 | 119.7 | GO:0045048 | protein insertion into ER membrane(GO:0045048) |
| 17.1 | 51.3 | GO:0006624 | vacuolar protein processing(GO:0006624) |
| 17.0 | 17.0 | GO:0045053 | protein retention in Golgi apparatus(GO:0045053) |
| 17.0 | 84.8 | GO:0046391 | 5-phosphoribose 1-diphosphate biosynthetic process(GO:0006015) 5-phosphoribose 1-diphosphate metabolic process(GO:0046391) |
| 16.8 | 50.4 | GO:0000379 | tRNA-type intron splice site recognition and cleavage(GO:0000379) |
| 16.6 | 83.1 | GO:0071964 | regulation of unidimensional cell growth(GO:0051510) negative regulation of unidimensional cell growth(GO:0051511) establishment of cell polarity regulating cell shape(GO:0071964) regulation of establishment or maintenance of cell polarity regulating cell shape(GO:2000769) positive regulation of establishment or maintenance of cell polarity regulating cell shape(GO:2000771) regulation of establishment of cell polarity regulating cell shape(GO:2000782) positive regulation of establishment of cell polarity regulating cell shape(GO:2000784) regulation of barbed-end actin filament capping(GO:2000812) positive regulation of barbed-end actin filament capping(GO:2000814) |
| 16.5 | 99.2 | GO:0098501 | polynucleotide dephosphorylation(GO:0098501) |
| 16.5 | 66.1 | GO:0046121 | deoxyribonucleoside catabolic process(GO:0046121) |
| 16.4 | 131.2 | GO:0033211 | adiponectin-activated signaling pathway(GO:0033211) |
| 16.4 | 81.8 | GO:1904154 | positive regulation of retrograde protein transport, ER to cytosol(GO:1904154) |
| 16.3 | 48.9 | GO:0033313 | meiotic cell cycle checkpoint(GO:0033313) |
| 16.3 | 260.4 | GO:0060546 | negative regulation of necroptotic process(GO:0060546) |
| 16.2 | 16.2 | GO:0006404 | RNA import into nucleus(GO:0006404) |
| 16.2 | 64.7 | GO:0000957 | mitochondrial RNA catabolic process(GO:0000957) regulation of mitochondrial RNA catabolic process(GO:0000960) |
| 16.1 | 32.2 | GO:0032056 | positive regulation of translation in response to stress(GO:0032056) |
| 16.1 | 16.1 | GO:0060613 | fat pad development(GO:0060613) |
| 16.1 | 32.1 | GO:2000653 | regulation of genetic imprinting(GO:2000653) |
| 16.0 | 79.8 | GO:0018230 | peptidyl-L-cysteine S-palmitoylation(GO:0018230) peptidyl-S-diacylglycerol-L-cysteine biosynthetic process from peptidyl-cysteine(GO:0018231) |
| 15.9 | 15.9 | GO:0019918 | peptidyl-arginine methylation, to symmetrical-dimethyl arginine(GO:0019918) |
| 15.8 | 79.0 | GO:0048478 | replication fork protection(GO:0048478) |
| 15.8 | 47.3 | GO:0044376 | RNA polymerase II complex import to nucleus(GO:0044376) RNA polymerase III complex localization to nucleus(GO:1990022) |
| 15.7 | 47.1 | GO:0097327 | response to antineoplastic agent(GO:0097327) |
| 15.7 | 94.1 | GO:0030174 | regulation of DNA-dependent DNA replication initiation(GO:0030174) |
| 15.6 | 78.2 | GO:0010710 | regulation of collagen catabolic process(GO:0010710) |
| 15.6 | 31.2 | GO:1900368 | regulation of RNA interference(GO:1900368) negative regulation of RNA interference(GO:1900369) |
| 15.6 | 1464.7 | GO:0002181 | cytoplasmic translation(GO:0002181) |
| 15.6 | 171.4 | GO:1900363 | regulation of mRNA polyadenylation(GO:1900363) |
| 15.5 | 665.7 | GO:0070979 | protein K11-linked ubiquitination(GO:0070979) |
| 15.4 | 61.7 | GO:0016240 | autophagosome docking(GO:0016240) |
| 15.2 | 76.2 | GO:0071475 | cellular hyperosmotic salinity response(GO:0071475) |
| 15.1 | 45.4 | GO:0002439 | chronic inflammatory response to antigenic stimulus(GO:0002439) |
| 15.0 | 120.2 | GO:0051001 | negative regulation of nitric-oxide synthase activity(GO:0051001) |
| 15.0 | 254.7 | GO:1904872 | regulation of telomerase RNA localization to Cajal body(GO:1904872) |
| 14.9 | 104.6 | GO:0006226 | dUMP biosynthetic process(GO:0006226) |
| 14.8 | 59.3 | GO:0043335 | protein unfolding(GO:0043335) |
| 14.6 | 73.2 | GO:0090151 | establishment of protein localization to mitochondrial membrane(GO:0090151) |
| 14.6 | 102.0 | GO:0046826 | negative regulation of protein export from nucleus(GO:0046826) |
| 14.6 | 989.6 | GO:0070125 | mitochondrial translational elongation(GO:0070125) |
| 14.4 | 57.5 | GO:0071492 | cellular response to UV-A(GO:0071492) |
| 14.4 | 71.9 | GO:0002378 | immunoglobulin biosynthetic process(GO:0002378) |
| 14.3 | 86.0 | GO:2000567 | memory T cell activation(GO:0035709) regulation of memory T cell activation(GO:2000567) positive regulation of memory T cell activation(GO:2000568) |
| 14.3 | 157.4 | GO:0000462 | maturation of SSU-rRNA from tricistronic rRNA transcript (SSU-rRNA, 5.8S rRNA, LSU-rRNA)(GO:0000462) |
| 14.2 | 198.1 | GO:2000675 | negative regulation of type B pancreatic cell apoptotic process(GO:2000675) |
| 14.1 | 56.4 | GO:0001189 | RNA polymerase I transcriptional preinitiation complex assembly(GO:0001188) RNA polymerase I transcriptional preinitiation complex assembly at the promoter for the nuclear large rRNA transcript(GO:0001189) |
| 13.9 | 41.8 | GO:0000738 | DNA catabolic process, exonucleolytic(GO:0000738) |
| 13.8 | 41.5 | GO:0002949 | tRNA threonylcarbamoyladenosine modification(GO:0002949) |
| 13.8 | 41.4 | GO:0006267 | pre-replicative complex assembly involved in nuclear cell cycle DNA replication(GO:0006267) pre-replicative complex assembly(GO:0036388) pre-replicative complex assembly involved in cell cycle DNA replication(GO:1902299) |
| 13.7 | 41.2 | GO:2000298 | regulation of Rho-dependent protein serine/threonine kinase activity(GO:2000298) |
| 13.7 | 27.4 | GO:0033031 | positive regulation of neutrophil apoptotic process(GO:0033031) |
| 13.7 | 218.9 | GO:0000338 | protein deneddylation(GO:0000338) |
| 13.7 | 287.0 | GO:0045948 | positive regulation of translational initiation(GO:0045948) |
| 13.7 | 95.7 | GO:0045079 | negative regulation of chemokine biosynthetic process(GO:0045079) |
| 13.6 | 40.9 | GO:0002906 | mature B cell apoptotic process(GO:0002901) regulation of mature B cell apoptotic process(GO:0002905) negative regulation of mature B cell apoptotic process(GO:0002906) |
| 13.6 | 27.2 | GO:1900110 | negative regulation of histone H3-K9 dimethylation(GO:1900110) |
| 13.6 | 68.0 | GO:1904798 | positive regulation of core promoter binding(GO:1904798) |
| 13.6 | 68.0 | GO:0033314 | mitotic DNA replication checkpoint(GO:0033314) |
| 13.5 | 40.6 | GO:2000232 | positive regulation of ribosome biogenesis(GO:0090070) regulation of rRNA processing(GO:2000232) positive regulation of rRNA processing(GO:2000234) |
| 13.5 | 1025.1 | GO:0071349 | interleukin-12-mediated signaling pathway(GO:0035722) cellular response to interleukin-12(GO:0071349) |
| 13.3 | 119.6 | GO:0045338 | farnesyl diphosphate metabolic process(GO:0045338) |
| 13.2 | 13.2 | GO:0034447 | very-low-density lipoprotein particle clearance(GO:0034447) |
| 13.1 | 52.3 | GO:0006842 | tricarboxylic acid transport(GO:0006842) citrate transport(GO:0015746) |
| 13.1 | 65.3 | GO:0018158 | protein oxidation(GO:0018158) |
| 12.9 | 258.8 | GO:0032515 | negative regulation of phosphoprotein phosphatase activity(GO:0032515) |
| 12.8 | 115.3 | GO:1901838 | positive regulation of transcription of nuclear large rRNA transcript from RNA polymerase I promoter(GO:1901838) |
| 12.8 | 51.1 | GO:0042278 | purine nucleoside metabolic process(GO:0042278) |
| 12.8 | 38.3 | GO:0010286 | heat acclimation(GO:0010286) cellular heat acclimation(GO:0070370) |
| 12.7 | 12.7 | GO:0032829 | regulation of CD4-positive, CD25-positive, alpha-beta regulatory T cell differentiation(GO:0032829) positive regulation of CD4-positive, CD25-positive, alpha-beta regulatory T cell differentiation(GO:0032831) |
| 12.7 | 12.7 | GO:1903093 | regulation of protein K48-linked deubiquitination(GO:1903093) negative regulation of protein K48-linked deubiquitination(GO:1903094) negative regulation of ubiquitin-specific protease activity(GO:2000157) |
| 12.6 | 126.1 | GO:2000680 | rubidium ion transport(GO:0035826) regulation of rubidium ion transport(GO:2000680) |
| 12.6 | 37.8 | GO:0007057 | spindle assembly involved in female meiosis I(GO:0007057) |
| 12.6 | 37.8 | GO:1902416 | positive regulation of mRNA binding(GO:1902416) |
| 12.6 | 37.8 | GO:1902445 | regulation of mitochondrial membrane permeability involved in programmed necrotic cell death(GO:1902445) |
| 12.6 | 37.7 | GO:0018211 | protein C-linked glycosylation(GO:0018103) peptidyl-tryptophan modification(GO:0018211) protein C-linked glycosylation via tryptophan(GO:0018317) protein C-linked glycosylation via 2'-alpha-mannosyl-L-tryptophan(GO:0018406) |
| 12.6 | 37.7 | GO:0006428 | isoleucyl-tRNA aminoacylation(GO:0006428) |
| 12.5 | 50.0 | GO:0072402 | response to cell cycle checkpoint signaling(GO:0072396) response to DNA integrity checkpoint signaling(GO:0072402) response to DNA damage checkpoint signaling(GO:0072423) |
| 12.5 | 87.5 | GO:0016255 | attachment of GPI anchor to protein(GO:0016255) |
| 12.4 | 260.3 | GO:0006465 | signal peptide processing(GO:0006465) |
| 12.4 | 37.1 | GO:0006423 | cysteinyl-tRNA aminoacylation(GO:0006423) |
| 12.4 | 86.5 | GO:0035437 | protein retention in ER lumen(GO:0006621) maintenance of protein localization in endoplasmic reticulum(GO:0035437) |
| 12.3 | 245.8 | GO:0090110 | cargo loading into COPII-coated vesicle(GO:0090110) |
| 12.2 | 12.2 | GO:0021997 | neural plate axis specification(GO:0021997) |
| 12.2 | 73.3 | GO:1903758 | regulation of transcription from RNA polymerase II promoter by histone modification(GO:1903756) negative regulation of transcription from RNA polymerase II promoter by histone modification(GO:1903758) |
| 12.2 | 61.1 | GO:0006436 | tryptophanyl-tRNA aminoacylation(GO:0006436) |
| 12.2 | 206.8 | GO:0032802 | low-density lipoprotein particle receptor catabolic process(GO:0032802) |
| 12.1 | 60.6 | GO:0061085 | regulation of histone H3-K27 methylation(GO:0061085) |
| 12.1 | 121.0 | GO:0015939 | pantothenate metabolic process(GO:0015939) |
| 12.0 | 48.1 | GO:0035964 | COPI-coated vesicle budding(GO:0035964) Golgi transport vesicle coating(GO:0048200) COPI coating of Golgi vesicle(GO:0048205) |
| 12.0 | 156.1 | GO:0030422 | production of siRNA involved in RNA interference(GO:0030422) |
| 11.9 | 512.3 | GO:0042273 | ribosomal large subunit biogenesis(GO:0042273) |
| 11.8 | 47.4 | GO:0002290 | gamma-delta T cell activation involved in immune response(GO:0002290) negative regulation of interferon-beta secretion(GO:0035548) regulation of gamma-delta T cell activation involved in immune response(GO:2001191) positive regulation of gamma-delta T cell activation involved in immune response(GO:2001193) |
| 11.8 | 165.4 | GO:0051315 | attachment of mitotic spindle microtubules to kinetochore(GO:0051315) |
| 11.8 | 35.4 | GO:1903031 | regulation of microtubule plus-end binding(GO:1903031) positive regulation of microtubule plus-end binding(GO:1903033) |
| 11.8 | 11.8 | GO:0051224 | negative regulation of protein transport(GO:0051224) |
| 11.8 | 11.8 | GO:0050653 | chondroitin sulfate proteoglycan biosynthetic process, polysaccharide chain biosynthetic process(GO:0050653) |
| 11.6 | 11.6 | GO:0034427 | nuclear-transcribed mRNA catabolic process, exonucleolytic, 3'-5'(GO:0034427) |
| 11.5 | 34.6 | GO:0009120 | deoxyribonucleoside metabolic process(GO:0009120) |
| 11.5 | 80.6 | GO:1902455 | negative regulation of stem cell population maintenance(GO:1902455) |
| 11.4 | 22.9 | GO:1902966 | regulation of protein localization to early endosome(GO:1902965) positive regulation of protein localization to early endosome(GO:1902966) |
| 11.4 | 34.3 | GO:0042351 | GDP-L-fucose biosynthetic process(GO:0042350) 'de novo' GDP-L-fucose biosynthetic process(GO:0042351) |
| 11.4 | 856.4 | GO:0045047 | protein targeting to ER(GO:0045047) |
| 11.4 | 45.5 | GO:0046452 | dihydrofolate metabolic process(GO:0046452) |
| 11.3 | 169.5 | GO:0006516 | glycoprotein catabolic process(GO:0006516) |
| 11.2 | 44.9 | GO:0033182 | regulation of histone ubiquitination(GO:0033182) |
| 11.2 | 22.4 | GO:0046292 | formaldehyde metabolic process(GO:0046292) |
| 11.2 | 44.8 | GO:0006391 | transcription initiation from mitochondrial promoter(GO:0006391) |
| 11.2 | 33.5 | GO:0070901 | mitochondrial tRNA methylation(GO:0070901) |
| 11.2 | 11.2 | GO:0042180 | cellular ketone metabolic process(GO:0042180) |
| 11.1 | 66.9 | GO:0007386 | compartment pattern specification(GO:0007386) |
| 11.1 | 156.0 | GO:0070389 | chaperone cofactor-dependent protein refolding(GO:0070389) |
| 11.1 | 77.9 | GO:0071550 | death-inducing signaling complex assembly(GO:0071550) |
| 11.1 | 33.3 | GO:0051685 | maintenance of ER location(GO:0051685) |
| 11.1 | 166.2 | GO:0006415 | translational termination(GO:0006415) |
| 11.0 | 11.0 | GO:0070341 | fat cell proliferation(GO:0070341) regulation of fat cell proliferation(GO:0070344) negative regulation of fat cell proliferation(GO:0070345) |
| 10.9 | 21.9 | GO:1904796 | regulation of core promoter binding(GO:1904796) |
| 10.9 | 87.6 | GO:1900623 | regulation of monocyte aggregation(GO:1900623) positive regulation of monocyte aggregation(GO:1900625) |
| 10.9 | 32.7 | GO:1902544 | regulation of DNA N-glycosylase activity(GO:1902544) |
| 10.9 | 21.8 | GO:0071030 | nuclear mRNA surveillance of spliceosomal pre-mRNA splicing(GO:0071030) nuclear retention of pre-mRNA at the site of transcription(GO:0071033) nuclear retention of unspliced pre-mRNA at the site of transcription(GO:0071048) |
| 10.9 | 43.6 | GO:0006740 | NADPH regeneration(GO:0006740) |
| 10.9 | 32.6 | GO:1901355 | response to rapamycin(GO:1901355) |
| 10.9 | 130.3 | GO:0010528 | regulation of transposition(GO:0010528) negative regulation of transposition(GO:0010529) |
| 10.8 | 43.3 | GO:0033600 | negative regulation of mammary gland epithelial cell proliferation(GO:0033600) |
| 10.8 | 54.0 | GO:0006933 | negative regulation of cell adhesion involved in substrate-bound cell migration(GO:0006933) |
| 10.8 | 118.3 | GO:0060628 | regulation of ER to Golgi vesicle-mediated transport(GO:0060628) |
| 10.7 | 107.4 | GO:0031584 | activation of phospholipase D activity(GO:0031584) |
| 10.7 | 10.7 | GO:0010482 | epidermal cell division(GO:0010481) regulation of epidermal cell division(GO:0010482) |
| 10.6 | 84.9 | GO:0001887 | selenium compound metabolic process(GO:0001887) |
| 10.6 | 74.3 | GO:1990592 | protein polyufmylation(GO:1990564) protein K69-linked ufmylation(GO:1990592) |
| 10.6 | 392.5 | GO:0042407 | cristae formation(GO:0042407) |
| 10.6 | 21.1 | GO:0042776 | mitochondrial ATP synthesis coupled proton transport(GO:0042776) |
| 10.5 | 168.7 | GO:0001682 | tRNA 5'-leader removal(GO:0001682) |
| 10.5 | 84.3 | GO:0061179 | negative regulation of insulin secretion involved in cellular response to glucose stimulus(GO:0061179) |
| 10.5 | 21.1 | GO:0070601 | centromeric sister chromatid cohesion(GO:0070601) |
| 10.5 | 42.1 | GO:0032383 | regulation of intracellular lipid transport(GO:0032377) regulation of intracellular sterol transport(GO:0032380) regulation of intracellular cholesterol transport(GO:0032383) |
| 10.4 | 125.3 | GO:0000920 | cell separation after cytokinesis(GO:0000920) |
| 10.4 | 51.9 | GO:0032487 | regulation of Rap protein signal transduction(GO:0032487) |
| 10.4 | 341.9 | GO:0006221 | pyrimidine nucleotide biosynthetic process(GO:0006221) |
| 10.4 | 10.4 | GO:0008589 | regulation of smoothened signaling pathway(GO:0008589) |
| 10.4 | 31.1 | GO:1901253 | regulation of intracellular transport of viral material(GO:1901252) negative regulation of intracellular transport of viral material(GO:1901253) |
| 10.3 | 51.6 | GO:0071460 | cellular response to cell-matrix adhesion(GO:0071460) |
| 10.3 | 41.3 | GO:0030037 | actin filament reorganization involved in cell cycle(GO:0030037) |
| 10.3 | 92.5 | GO:0045835 | negative regulation of meiotic nuclear division(GO:0045835) |
| 10.2 | 726.4 | GO:0097031 | NADH dehydrogenase complex assembly(GO:0010257) mitochondrial respiratory chain complex I assembly(GO:0032981) mitochondrial respiratory chain complex I biogenesis(GO:0097031) |
| 10.2 | 61.2 | GO:1903435 | positive regulation of constitutive secretory pathway(GO:1903435) |
| 10.0 | 30.1 | GO:0006422 | aspartyl-tRNA aminoacylation(GO:0006422) |
| 10.0 | 20.0 | GO:0001923 | B-1 B cell differentiation(GO:0001923) |
| 10.0 | 49.9 | GO:0009440 | cyanate metabolic process(GO:0009439) cyanate catabolic process(GO:0009440) |
| 10.0 | 29.9 | GO:0006167 | AMP biosynthetic process(GO:0006167) |
| 9.9 | 29.7 | GO:2000254 | male germ cell proliferation(GO:0002176) germ cell proliferation(GO:0036093) regulation of male germ cell proliferation(GO:2000254) |
| 9.9 | 39.6 | GO:1901804 | glucosylceramide catabolic process(GO:0006680) beta-glucoside metabolic process(GO:1901804) beta-glucoside catabolic process(GO:1901805) positive regulation of neuronal action potential(GO:1904457) |
| 9.9 | 19.7 | GO:1901164 | negative regulation of trophoblast cell migration(GO:1901164) |
| 9.7 | 29.1 | GO:1900245 | positive regulation of MDA-5 signaling pathway(GO:1900245) |
| 9.6 | 19.1 | GO:0003162 | atrioventricular node development(GO:0003162) |
| 9.6 | 38.3 | GO:0090170 | regulation of Golgi inheritance(GO:0090170) |
| 9.5 | 38.1 | GO:0090385 | phagosome-lysosome fusion(GO:0090385) |
| 9.4 | 217.3 | GO:0051439 | regulation of ubiquitin-protein ligase activity involved in mitotic cell cycle(GO:0051439) |
| 9.4 | 47.2 | GO:0015862 | uridine transport(GO:0015862) |
| 9.4 | 28.2 | GO:0071421 | manganese ion transmembrane transport(GO:0071421) |
| 9.3 | 37.1 | GO:0002296 | T-helper 1 cell lineage commitment(GO:0002296) |
| 9.3 | 27.8 | GO:0061198 | fungiform papilla formation(GO:0061198) |
| 9.2 | 9.2 | GO:2000523 | regulation of T cell costimulation(GO:2000523) positive regulation of T cell costimulation(GO:2000525) |
| 9.2 | 73.6 | GO:0035268 | protein mannosylation(GO:0035268) |
| 9.1 | 36.4 | GO:0043366 | beta selection(GO:0043366) |
| 9.1 | 353.5 | GO:0045737 | positive regulation of cyclin-dependent protein serine/threonine kinase activity(GO:0045737) |
| 9.1 | 18.1 | GO:0032687 | negative regulation of interferon-alpha production(GO:0032687) |
| 9.0 | 27.0 | GO:1900127 | positive regulation of hyaluronan biosynthetic process(GO:1900127) |
| 9.0 | 9.0 | GO:0048280 | vesicle fusion with Golgi apparatus(GO:0048280) |
| 9.0 | 9.0 | GO:0002011 | morphogenesis of an epithelial sheet(GO:0002011) |
| 9.0 | 62.9 | GO:0072718 | response to cisplatin(GO:0072718) |
| 8.9 | 17.9 | GO:0046504 | ether lipid biosynthetic process(GO:0008611) glycerol ether biosynthetic process(GO:0046504) ether biosynthetic process(GO:1901503) |
| 8.9 | 26.6 | GO:1903973 | negative regulation of macrophage colony-stimulating factor signaling pathway(GO:1902227) negative regulation of response to macrophage colony-stimulating factor(GO:1903970) negative regulation of cellular response to macrophage colony-stimulating factor stimulus(GO:1903973) |
| 8.9 | 35.5 | GO:0003366 | cell-matrix adhesion involved in ameboidal cell migration(GO:0003366) |
| 8.9 | 79.7 | GO:0034975 | protein folding in endoplasmic reticulum(GO:0034975) |
| 8.8 | 79.3 | GO:1902969 | mitotic DNA replication(GO:1902969) |
| 8.8 | 8.8 | GO:0032212 | positive regulation of telomere maintenance via telomerase(GO:0032212) |
| 8.8 | 35.2 | GO:1903593 | regulation of histamine secretion by mast cell(GO:1903593) |
| 8.8 | 52.6 | GO:0070934 | CRD-mediated mRNA stabilization(GO:0070934) |
| 8.8 | 87.7 | GO:0071044 | histone mRNA catabolic process(GO:0071044) |
| 8.8 | 35.1 | GO:1904844 | response to L-glutamine(GO:1904844) cellular response to L-glutamine(GO:1904845) |
| 8.7 | 34.9 | GO:0030047 | actin modification(GO:0030047) |
| 8.7 | 43.3 | GO:1904977 | lymphatic endothelial cell migration(GO:1904977) |
| 8.6 | 43.2 | GO:0033753 | ribosomal subunit export from nucleus(GO:0000054) ribosomal large subunit export from nucleus(GO:0000055) ribosome localization(GO:0033750) establishment of ribosome localization(GO:0033753) |
| 8.6 | 664.5 | GO:0006413 | translational initiation(GO:0006413) |
| 8.6 | 17.2 | GO:1904715 | negative regulation of chaperone-mediated autophagy(GO:1904715) |
| 8.6 | 25.7 | GO:1900224 | positive regulation of nodal signaling pathway involved in determination of lateral mesoderm left/right asymmetry(GO:1900224) |
| 8.5 | 8.5 | GO:2000196 | positive regulation of female gonad development(GO:2000196) |
| 8.5 | 42.6 | GO:0006104 | succinyl-CoA metabolic process(GO:0006104) |
| 8.5 | 17.0 | GO:0072321 | chaperone-mediated protein transport(GO:0072321) |
| 8.5 | 8.5 | GO:0061010 | gall bladder development(GO:0061010) |
| 8.5 | 110.2 | GO:0016180 | snRNA processing(GO:0016180) |
| 8.5 | 33.9 | GO:0015986 | energy coupled proton transport, down electrochemical gradient(GO:0015985) ATP synthesis coupled proton transport(GO:0015986) |
| 8.4 | 25.3 | GO:0042727 | flavin-containing compound biosynthetic process(GO:0042727) |
| 8.4 | 168.7 | GO:0006123 | mitochondrial electron transport, cytochrome c to oxygen(GO:0006123) |
| 8.4 | 42.1 | GO:2000035 | regulation of stem cell division(GO:2000035) |
| 8.4 | 41.9 | GO:0043154 | negative regulation of cysteine-type endopeptidase activity involved in apoptotic process(GO:0043154) |
| 8.4 | 58.5 | GO:1904321 | response to forskolin(GO:1904321) cellular response to forskolin(GO:1904322) |
| 8.3 | 16.7 | GO:1901185 | negative regulation of epidermal growth factor receptor signaling pathway(GO:0042059) negative regulation of ERBB signaling pathway(GO:1901185) |
| 8.3 | 8.3 | GO:0042700 | luteinizing hormone signaling pathway(GO:0042700) |
| 8.3 | 24.9 | GO:0009304 | tRNA transcription(GO:0009304) 5S class rRNA transcription from RNA polymerase III type 1 promoter(GO:0042791) tRNA transcription from RNA polymerase III promoter(GO:0042797) |
| 8.3 | 132.4 | GO:0040015 | negative regulation of multicellular organism growth(GO:0040015) |
| 8.3 | 49.6 | GO:0002638 | negative regulation of immunoglobulin production(GO:0002638) |
| 8.2 | 8.2 | GO:0019087 | transformation of host cell by virus(GO:0019087) |
| 8.2 | 49.3 | GO:0051013 | microtubule severing(GO:0051013) |
| 8.2 | 106.4 | GO:0006851 | mitochondrial calcium ion transport(GO:0006851) |
| 8.1 | 32.6 | GO:0051292 | nuclear pore complex assembly(GO:0051292) |
| 8.1 | 560.1 | GO:0045454 | cell redox homeostasis(GO:0045454) |
| 8.1 | 145.2 | GO:0000291 | nuclear-transcribed mRNA catabolic process, exonucleolytic(GO:0000291) |
| 8.0 | 32.1 | GO:0008612 | peptidyl-lysine modification to peptidyl-hypusine(GO:0008612) |
| 8.0 | 24.1 | GO:0019417 | sulfur oxidation(GO:0019417) |
| 8.0 | 48.0 | GO:0010940 | positive regulation of necrotic cell death(GO:0010940) |
| 8.0 | 40.0 | GO:0070863 | positive regulation of protein exit from endoplasmic reticulum(GO:0070863) |
| 8.0 | 104.0 | GO:0070911 | global genome nucleotide-excision repair(GO:0070911) |
| 8.0 | 32.0 | GO:0050689 | negative regulation of defense response to virus by host(GO:0050689) |
| 8.0 | 318.2 | GO:0010501 | RNA secondary structure unwinding(GO:0010501) |
| 7.9 | 7.9 | GO:0071712 | ER-associated misfolded protein catabolic process(GO:0071712) |
| 7.8 | 39.2 | GO:0044351 | macropinocytosis(GO:0044351) |
| 7.8 | 23.3 | GO:0071789 | spindle pole body duplication(GO:0030474) nuclear pore distribution(GO:0031081) spindle pole body organization(GO:0051300) nuclear pore localization(GO:0051664) spindle pole body localization(GO:0070631) establishment of spindle pole body localization(GO:0070632) spindle pole body localization to nuclear envelope(GO:0071789) establishment of spindle pole body localization to nuclear envelope(GO:0071790) |
| 7.7 | 7.7 | GO:1903630 | regulation of aminoacyl-tRNA ligase activity(GO:1903630) |
| 7.7 | 69.3 | GO:0050862 | positive regulation of T cell receptor signaling pathway(GO:0050862) |
| 7.7 | 23.1 | GO:0030997 | regulation of centriole-centriole cohesion(GO:0030997) |
| 7.6 | 38.1 | GO:1904016 | response to Thyroglobulin triiodothyronine(GO:1904016) |
| 7.6 | 76.2 | GO:1903265 | positive regulation of tumor necrosis factor-mediated signaling pathway(GO:1903265) |
| 7.6 | 68.3 | GO:0044818 | mitotic G2/M transition checkpoint(GO:0044818) |
| 7.5 | 15.1 | GO:0032077 | positive regulation of deoxyribonuclease activity(GO:0032077) |
| 7.5 | 30.0 | GO:0006390 | transcription from mitochondrial promoter(GO:0006390) |
| 7.5 | 15.0 | GO:0003221 | right ventricular cardiac muscle tissue morphogenesis(GO:0003221) |
| 7.5 | 22.4 | GO:0006269 | DNA replication, synthesis of RNA primer(GO:0006269) |
| 7.4 | 22.3 | GO:0002441 | histamine production involved in inflammatory response(GO:0002349) histamine secretion involved in inflammatory response(GO:0002441) histamine secretion by mast cell(GO:0002553) |
| 7.4 | 119.0 | GO:0002523 | leukocyte migration involved in inflammatory response(GO:0002523) |
| 7.4 | 81.5 | GO:0060263 | regulation of respiratory burst(GO:0060263) |
| 7.4 | 44.3 | GO:0045716 | positive regulation of low-density lipoprotein particle receptor biosynthetic process(GO:0045716) |
| 7.3 | 29.3 | GO:0001672 | regulation of chromatin assembly or disassembly(GO:0001672) |
| 7.3 | 43.9 | GO:1902035 | positive regulation of hematopoietic stem cell proliferation(GO:1902035) |
| 7.3 | 21.9 | GO:2001137 | positive regulation of endocytic recycling(GO:2001137) |
| 7.3 | 21.9 | GO:0019242 | methylglyoxal biosynthetic process(GO:0019242) |
| 7.3 | 538.3 | GO:0048208 | vesicle targeting, rough ER to cis-Golgi(GO:0048207) COPII vesicle coating(GO:0048208) |
| 7.3 | 43.5 | GO:0090161 | Golgi ribbon formation(GO:0090161) |
| 7.2 | 64.7 | GO:0034723 | DNA replication-dependent nucleosome assembly(GO:0006335) DNA replication-dependent nucleosome organization(GO:0034723) |
| 7.2 | 143.3 | GO:0016254 | preassembly of GPI anchor in ER membrane(GO:0016254) |
| 7.2 | 21.5 | GO:0045876 | positive regulation of sister chromatid cohesion(GO:0045876) |
| 7.1 | 35.7 | GO:0051792 | medium-chain fatty acid biosynthetic process(GO:0051792) |
| 7.1 | 135.5 | GO:0031163 | iron-sulfur cluster assembly(GO:0016226) metallo-sulfur cluster assembly(GO:0031163) |
| 7.1 | 42.7 | GO:0036111 | very long-chain fatty-acyl-CoA metabolic process(GO:0036111) |
| 7.1 | 7.1 | GO:0070671 | response to interleukin-12(GO:0070671) |
| 7.1 | 35.3 | GO:1902903 | late endosomal microautophagy(GO:0061738) regulation of fibril organization(GO:1902903) |
| 7.0 | 14.0 | GO:0014900 | regulation of muscle hyperplasia(GO:0014738) muscle hyperplasia(GO:0014900) |
| 7.0 | 27.8 | GO:0016479 | negative regulation of transcription from RNA polymerase I promoter(GO:0016479) |
| 6.9 | 48.2 | GO:2000483 | negative regulation of interleukin-8 secretion(GO:2000483) |
| 6.9 | 41.3 | GO:0044387 | negative regulation of protein kinase activity by regulation of protein phosphorylation(GO:0044387) |
| 6.8 | 20.5 | GO:0002752 | cell surface pattern recognition receptor signaling pathway(GO:0002752) |
| 6.8 | 20.5 | GO:0046900 | tetrahydrofolylpolyglutamate metabolic process(GO:0046900) |
| 6.8 | 6.8 | GO:0090086 | negative regulation of protein deubiquitination(GO:0090086) |
| 6.8 | 339.7 | GO:0045071 | negative regulation of viral genome replication(GO:0045071) |
| 6.8 | 33.9 | GO:1903527 | positive regulation of membrane tubulation(GO:1903527) |
| 6.8 | 74.3 | GO:0051601 | exocyst localization(GO:0051601) |
| 6.7 | 20.2 | GO:0042450 | arginine biosynthetic process via ornithine(GO:0042450) |
| 6.7 | 46.7 | GO:0038203 | TORC2 signaling(GO:0038203) |
| 6.6 | 33.0 | GO:0009838 | abscission(GO:0009838) |
| 6.6 | 52.8 | GO:0051014 | actin filament severing(GO:0051014) |
| 6.6 | 26.3 | GO:0010216 | maintenance of DNA methylation(GO:0010216) |
| 6.6 | 6.6 | GO:0018243 | protein O-linked glycosylation via threonine(GO:0018243) |
| 6.6 | 6.6 | GO:0034135 | regulation of toll-like receptor 2 signaling pathway(GO:0034135) |
| 6.5 | 183.1 | GO:0032008 | positive regulation of TOR signaling(GO:0032008) |
| 6.5 | 58.7 | GO:0031936 | negative regulation of chromatin silencing(GO:0031936) |
| 6.5 | 52.1 | GO:0060059 | embryonic retina morphogenesis in camera-type eye(GO:0060059) |
| 6.5 | 6.5 | GO:0033023 | mast cell homeostasis(GO:0033023) mast cell apoptotic process(GO:0033024) regulation of mast cell apoptotic process(GO:0033025) |
| 6.4 | 12.9 | GO:0045091 | single stranded viral RNA replication via double stranded DNA intermediate(GO:0039692) regulation of single stranded viral RNA replication via double stranded DNA intermediate(GO:0045091) |
| 6.4 | 6.4 | GO:0007185 | transmembrane receptor protein tyrosine phosphatase signaling pathway(GO:0007185) |
| 6.4 | 38.6 | GO:0017182 | peptidyl-diphthamide metabolic process(GO:0017182) peptidyl-diphthamide biosynthetic process from peptidyl-histidine(GO:0017183) |
| 6.3 | 31.7 | GO:0016998 | cell wall macromolecule catabolic process(GO:0016998) |
| 6.3 | 69.6 | GO:0018345 | protein palmitoylation(GO:0018345) |
| 6.3 | 44.3 | GO:0046618 | drug export(GO:0046618) |
| 6.3 | 18.8 | GO:0006121 | mitochondrial electron transport, succinate to ubiquinone(GO:0006121) |
| 6.3 | 50.0 | GO:0032506 | cytokinetic process(GO:0032506) |
| 6.2 | 37.5 | GO:0034134 | toll-like receptor 2 signaling pathway(GO:0034134) |
| 6.2 | 31.0 | GO:0042631 | cellular response to water deprivation(GO:0042631) |
| 6.2 | 37.2 | GO:0046898 | response to cycloheximide(GO:0046898) |
| 6.2 | 49.5 | GO:0043353 | enucleate erythrocyte differentiation(GO:0043353) |
| 6.2 | 12.4 | GO:1902570 | protein localization to nucleolus(GO:1902570) |
| 6.2 | 6.2 | GO:0040031 | snRNA modification(GO:0040031) |
| 6.2 | 30.8 | GO:0090204 | protein localization to nuclear pore(GO:0090204) |
| 6.2 | 12.3 | GO:0035616 | histone H2B conserved C-terminal lysine deubiquitination(GO:0035616) |
| 6.1 | 147.4 | GO:0042347 | negative regulation of NF-kappaB import into nucleus(GO:0042347) |
| 6.1 | 12.2 | GO:0090166 | Golgi disassembly(GO:0090166) |
| 6.1 | 12.2 | GO:1903333 | regulation of protein refolding(GO:0061083) negative regulation of protein refolding(GO:0061084) negative regulation of protein folding(GO:1903333) |
| 6.1 | 67.0 | GO:0048308 | organelle inheritance(GO:0048308) Golgi inheritance(GO:0048313) |
| 6.0 | 6.0 | GO:0030423 | targeting of mRNA for destruction involved in RNA interference(GO:0030423) siRNA loading onto RISC involved in RNA interference(GO:0035087) |
| 6.0 | 108.7 | GO:0047497 | establishment of mitochondrion localization, microtubule-mediated(GO:0034643) mitochondrion transport along microtubule(GO:0047497) |
| 6.0 | 11.9 | GO:1904925 | positive regulation of macromitophagy(GO:1901526) positive regulation of mitophagy in response to mitochondrial depolarization(GO:1904925) |
| 6.0 | 59.6 | GO:0045116 | protein neddylation(GO:0045116) |
| 5.9 | 41.5 | GO:0050713 | negative regulation of interleukin-1 beta secretion(GO:0050713) |
| 5.9 | 473.3 | GO:0070527 | platelet aggregation(GO:0070527) |
| 5.9 | 76.6 | GO:0097320 | membrane tubulation(GO:0097320) |
| 5.9 | 58.9 | GO:0045651 | positive regulation of macrophage differentiation(GO:0045651) |
| 5.9 | 23.5 | GO:0030259 | lipid glycosylation(GO:0030259) |
| 5.9 | 135.0 | GO:0070536 | protein K63-linked deubiquitination(GO:0070536) |
| 5.8 | 52.2 | GO:0045654 | positive regulation of megakaryocyte differentiation(GO:0045654) |
| 5.8 | 11.6 | GO:0002774 | Fc receptor mediated inhibitory signaling pathway(GO:0002774) |
| 5.8 | 121.1 | GO:0031468 | nuclear envelope reassembly(GO:0031468) |
| 5.7 | 22.9 | GO:0051490 | negative regulation of filopodium assembly(GO:0051490) |
| 5.7 | 125.9 | GO:0006825 | copper ion transport(GO:0006825) |
| 5.7 | 22.9 | GO:0032747 | positive regulation of interleukin-23 production(GO:0032747) |
| 5.7 | 392.9 | GO:0043488 | regulation of mRNA stability(GO:0043488) |
| 5.7 | 39.8 | GO:0010764 | negative regulation of fibroblast migration(GO:0010764) |
| 5.7 | 39.7 | GO:0090241 | negative regulation of histone H4 acetylation(GO:0090241) |
| 5.7 | 22.6 | GO:0039663 | fusion of virus membrane with host plasma membrane(GO:0019064) membrane fusion involved in viral entry into host cell(GO:0039663) multi-organism membrane fusion(GO:0044800) |
| 5.6 | 11.3 | GO:1901534 | positive regulation of hematopoietic progenitor cell differentiation(GO:1901534) |
| 5.6 | 1580.8 | GO:0000377 | RNA splicing, via transesterification reactions with bulged adenosine as nucleophile(GO:0000377) mRNA splicing, via spliceosome(GO:0000398) |
| 5.6 | 123.1 | GO:1902857 | positive regulation of nonmotile primary cilium assembly(GO:1902857) |
| 5.6 | 72.4 | GO:0050766 | positive regulation of phagocytosis(GO:0050766) |
| 5.5 | 16.6 | GO:0016139 | glycoside catabolic process(GO:0016139) |
| 5.5 | 16.6 | GO:0042790 | transcription of nuclear large rRNA transcript from RNA polymerase I promoter(GO:0042790) |
| 5.5 | 11.0 | GO:0007171 | activation of transmembrane receptor protein tyrosine kinase activity(GO:0007171) |
| 5.5 | 5.5 | GO:0046726 | positive regulation by virus of viral protein levels in host cell(GO:0046726) |
| 5.5 | 11.0 | GO:0043653 | mitochondrial fragmentation involved in apoptotic process(GO:0043653) |
| 5.4 | 16.3 | GO:0051684 | maintenance of Golgi location(GO:0051684) |
| 5.4 | 10.7 | GO:0009886 | post-embryonic morphogenesis(GO:0009886) post-embryonic organ morphogenesis(GO:0048563) |
| 5.4 | 32.1 | GO:0030490 | maturation of SSU-rRNA(GO:0030490) |
| 5.3 | 5.3 | GO:2000645 | negative regulation of receptor catabolic process(GO:2000645) |
| 5.3 | 90.5 | GO:0042340 | keratan sulfate catabolic process(GO:0042340) |
| 5.3 | 26.6 | GO:0009303 | rRNA transcription(GO:0009303) |
| 5.3 | 16.0 | GO:0045084 | positive regulation of interleukin-12 biosynthetic process(GO:0045084) |
| 5.3 | 15.9 | GO:0090283 | regulation of protein glycosylation in Golgi(GO:0090283) |
| 5.3 | 52.8 | GO:0034498 | early endosome to Golgi transport(GO:0034498) |
| 5.3 | 47.4 | GO:0018344 | protein geranylgeranylation(GO:0018344) |
| 5.3 | 231.9 | GO:0007190 | activation of adenylate cyclase activity(GO:0007190) |
| 5.3 | 21.1 | GO:0035879 | plasma membrane lactate transport(GO:0035879) |
| 5.3 | 31.6 | GO:0042866 | pyruvate biosynthetic process(GO:0042866) |
| 5.3 | 15.8 | GO:0043105 | regulation of GTP cyclohydrolase I activity(GO:0043095) negative regulation of GTP cyclohydrolase I activity(GO:0043105) |
| 5.2 | 47.2 | GO:0018206 | peptidyl-methionine modification(GO:0018206) |
| 5.2 | 15.6 | GO:0032497 | detection of lipopolysaccharide(GO:0032497) |
| 5.1 | 5.1 | GO:1902566 | regulation of eosinophil activation(GO:1902566) |
| 5.1 | 154.0 | GO:0007029 | endoplasmic reticulum organization(GO:0007029) |
| 5.1 | 35.8 | GO:0098989 | NMDA selective glutamate receptor signaling pathway(GO:0098989) |
| 5.0 | 5.0 | GO:0032049 | phosphatidylglycerol biosynthetic process(GO:0006655) cardiolipin biosynthetic process(GO:0032049) |
| 5.0 | 5.0 | GO:0002590 | regulation of antigen processing and presentation of peptide antigen via MHC class I(GO:0002589) negative regulation of antigen processing and presentation of peptide antigen via MHC class I(GO:0002590) |
| 5.0 | 25.1 | GO:1904424 | regulation of GTP binding(GO:1904424) |
| 5.0 | 25.0 | GO:0032929 | negative regulation of superoxide anion generation(GO:0032929) |
| 5.0 | 9.9 | GO:0015920 | lipopolysaccharide transport(GO:0015920) |
| 4.9 | 14.8 | GO:0061502 | early endosome to recycling endosome transport(GO:0061502) |
| 4.9 | 9.9 | GO:0034214 | protein hexamerization(GO:0034214) |
| 4.9 | 9.8 | GO:1903978 | regulation of microglial cell activation(GO:1903978) |
| 4.9 | 9.8 | GO:0009147 | pyrimidine nucleoside triphosphate metabolic process(GO:0009147) |
| 4.8 | 9.7 | GO:0002353 | kinin cascade(GO:0002254) plasma kallikrein-kinin cascade(GO:0002353) |
| 4.8 | 29.0 | GO:0015742 | alpha-ketoglutarate transport(GO:0015742) |
| 4.8 | 38.6 | GO:0051382 | kinetochore assembly(GO:0051382) |
| 4.8 | 19.3 | GO:0030920 | N-terminal peptidyl-serine acetylation(GO:0017198) N-terminal peptidyl-glutamic acid acetylation(GO:0018002) peptidyl-serine acetylation(GO:0030920) |
| 4.8 | 230.9 | GO:1990090 | cellular response to nerve growth factor stimulus(GO:1990090) |
| 4.8 | 14.4 | GO:1902992 | negative regulation of amyloid precursor protein catabolic process(GO:1902992) |
| 4.8 | 19.2 | GO:0061643 | chemorepulsion of dopaminergic neuron axon(GO:0036518) chemorepulsion of axon(GO:0061643) |
| 4.7 | 4.7 | GO:0032878 | regulation of establishment or maintenance of cell polarity(GO:0032878) |
| 4.7 | 47.4 | GO:0034067 | protein localization to Golgi apparatus(GO:0034067) |
| 4.7 | 47.2 | GO:1900086 | regulation of peptidyl-tyrosine autophosphorylation(GO:1900084) positive regulation of peptidyl-tyrosine autophosphorylation(GO:1900086) |
| 4.7 | 18.9 | GO:0010756 | positive regulation of plasminogen activation(GO:0010756) |
| 4.7 | 56.2 | GO:0007172 | signal complex assembly(GO:0007172) |
| 4.7 | 379.1 | GO:0002220 | innate immune response activating cell surface receptor signaling pathway(GO:0002220) |
| 4.7 | 51.4 | GO:0019388 | galactose catabolic process(GO:0019388) |
| 4.6 | 4.6 | GO:0097113 | AMPA glutamate receptor clustering(GO:0097113) glutamate receptor clustering(GO:0097688) |
| 4.6 | 9.2 | GO:1902680 | positive regulation of RNA biosynthetic process(GO:1902680) |
| 4.6 | 9.2 | GO:0044275 | cellular carbohydrate catabolic process(GO:0044275) |
| 4.6 | 41.2 | GO:1903027 | regulation of opsonization(GO:1903027) |
| 4.6 | 45.6 | GO:0045793 | positive regulation of cell size(GO:0045793) |
| 4.6 | 31.9 | GO:0006296 | nucleotide-excision repair, DNA incision, 5'-to lesion(GO:0006296) |
| 4.5 | 13.6 | GO:0043137 | DNA replication, Okazaki fragment processing(GO:0033567) DNA replication, removal of RNA primer(GO:0043137) |
| 4.5 | 13.6 | GO:0038043 | interleukin-5-mediated signaling pathway(GO:0038043) |
| 4.5 | 45.1 | GO:0002480 | antigen processing and presentation of exogenous peptide antigen via MHC class I, TAP-independent(GO:0002480) |
| 4.5 | 44.9 | GO:0045579 | positive regulation of B cell differentiation(GO:0045579) |
| 4.4 | 31.1 | GO:0000733 | DNA strand renaturation(GO:0000733) |
| 4.4 | 13.3 | GO:0050861 | positive regulation of B cell receptor signaling pathway(GO:0050861) |
| 4.4 | 30.9 | GO:0051599 | response to hydrostatic pressure(GO:0051599) |
| 4.4 | 79.2 | GO:0035641 | locomotory exploration behavior(GO:0035641) |
| 4.3 | 17.3 | GO:1903224 | regulation of endodermal cell differentiation(GO:1903224) negative regulation of gastrulation(GO:2000542) |
| 4.3 | 25.9 | GO:0006065 | UDP-glucuronate biosynthetic process(GO:0006065) |
| 4.3 | 30.2 | GO:0015712 | hexose phosphate transport(GO:0015712) glucose-6-phosphate transport(GO:0015760) |
| 4.3 | 8.6 | GO:0033152 | immunoglobulin V(D)J recombination(GO:0033152) |
| 4.3 | 25.8 | GO:0019367 | fatty acid elongation, saturated fatty acid(GO:0019367) fatty acid elongation, unsaturated fatty acid(GO:0019368) fatty acid elongation, monounsaturated fatty acid(GO:0034625) fatty acid elongation, polyunsaturated fatty acid(GO:0034626) |
| 4.3 | 68.4 | GO:0007220 | Notch receptor processing(GO:0007220) |
| 4.3 | 8.5 | GO:0002370 | natural killer cell cytokine production(GO:0002370) regulation of natural killer cell cytokine production(GO:0002727) |
| 4.3 | 17.0 | GO:0030538 | embryonic genitalia morphogenesis(GO:0030538) |
| 4.2 | 46.7 | GO:0060124 | positive regulation of growth hormone secretion(GO:0060124) |
| 4.2 | 25.4 | GO:0045357 | interferon-beta biosynthetic process(GO:0045350) regulation of interferon-beta biosynthetic process(GO:0045357) positive regulation of interferon-beta biosynthetic process(GO:0045359) |
| 4.2 | 42.3 | GO:0060056 | mammary gland involution(GO:0060056) |
| 4.2 | 134.7 | GO:0000188 | inactivation of MAPK activity(GO:0000188) |
| 4.2 | 25.1 | GO:0048227 | plasma membrane to endosome transport(GO:0048227) |
| 4.2 | 12.6 | GO:0060743 | epithelial cell maturation involved in prostate gland development(GO:0060743) |
| 4.2 | 4.2 | GO:0050917 | sensory perception of sweet taste(GO:0050916) sensory perception of umami taste(GO:0050917) |
| 4.1 | 8.3 | GO:0061030 | epithelial cell differentiation involved in mammary gland alveolus development(GO:0061030) |
| 4.1 | 20.7 | GO:0032464 | positive regulation of protein homooligomerization(GO:0032464) |
| 4.1 | 16.6 | GO:0006474 | N-terminal protein amino acid acetylation(GO:0006474) |
| 4.1 | 49.6 | GO:0016578 | histone deubiquitination(GO:0016578) |
| 4.1 | 20.6 | GO:1904693 | midbrain morphogenesis(GO:1904693) |
| 4.1 | 8.2 | GO:0042796 | snRNA transcription from RNA polymerase III promoter(GO:0042796) |
| 4.1 | 24.5 | GO:0045064 | T-helper 2 cell differentiation(GO:0045064) |
| 4.1 | 8.2 | GO:0061724 | lipophagy(GO:0061724) regulation of lipophagy(GO:1904502) positive regulation of lipophagy(GO:1904504) |
| 4.1 | 24.4 | GO:0043418 | homocysteine catabolic process(GO:0043418) |
| 4.1 | 32.6 | GO:0070200 | establishment of protein localization to telomere(GO:0070200) |
| 4.1 | 8.1 | GO:0010693 | negative regulation of alkaline phosphatase activity(GO:0010693) |
| 4.1 | 4.1 | GO:1990481 | mRNA pseudouridine synthesis(GO:1990481) |
| 4.1 | 48.7 | GO:2000271 | positive regulation of fibroblast apoptotic process(GO:2000271) |
| 4.1 | 20.3 | GO:0035520 | monoubiquitinated protein deubiquitination(GO:0035520) |
| 4.0 | 16.2 | GO:0036229 | glutamine secretion(GO:0010585) L-glutamine import(GO:0036229) L-glutamine import into cell(GO:1903803) |
| 4.0 | 12.1 | GO:0090155 | negative regulation of sphingolipid biosynthetic process(GO:0090155) negative regulation of ceramide biosynthetic process(GO:1900060) |
| 4.0 | 72.4 | GO:0051290 | protein heterotetramerization(GO:0051290) |
| 4.0 | 28.1 | GO:0008216 | spermidine metabolic process(GO:0008216) |
| 4.0 | 12.0 | GO:0060715 | syncytiotrophoblast cell differentiation involved in labyrinthine layer development(GO:0060715) |
| 4.0 | 71.9 | GO:0046341 | CDP-diacylglycerol metabolic process(GO:0046341) |
| 4.0 | 23.9 | GO:0051974 | negative regulation of telomerase activity(GO:0051974) |
| 4.0 | 19.9 | GO:0035965 | cardiolipin acyl-chain remodeling(GO:0035965) |
| 4.0 | 203.1 | GO:0018279 | protein N-linked glycosylation via asparagine(GO:0018279) |
| 4.0 | 4.0 | GO:0002351 | serotonin production involved in inflammatory response(GO:0002351) serotonin secretion involved in inflammatory response(GO:0002442) serotonin secretion by platelet(GO:0002554) |
| 4.0 | 23.9 | GO:0060011 | Sertoli cell proliferation(GO:0060011) |
| 4.0 | 39.7 | GO:0071578 | zinc II ion transmembrane import(GO:0071578) |
| 4.0 | 7.9 | GO:0071072 | negative regulation of phospholipid biosynthetic process(GO:0071072) |
| 3.9 | 15.8 | GO:0046598 | positive regulation of viral entry into host cell(GO:0046598) |
| 3.9 | 98.3 | GO:0006418 | tRNA aminoacylation for protein translation(GO:0006418) |
| 3.9 | 15.7 | GO:0039530 | MDA-5 signaling pathway(GO:0039530) |
| 3.9 | 11.8 | GO:0090160 | Golgi to lysosome transport(GO:0090160) |
| 3.9 | 62.8 | GO:0043304 | regulation of mast cell activation involved in immune response(GO:0033006) regulation of mast cell degranulation(GO:0043304) |
| 3.9 | 7.8 | GO:1902044 | regulation of Fas signaling pathway(GO:1902044) |
| 3.9 | 23.5 | GO:0006307 | DNA dealkylation involved in DNA repair(GO:0006307) |
| 3.9 | 7.8 | GO:0008356 | asymmetric cell division(GO:0008356) |
| 3.9 | 27.2 | GO:0031648 | protein destabilization(GO:0031648) |
| 3.9 | 34.9 | GO:0046007 | negative regulation of activated T cell proliferation(GO:0046007) |
| 3.9 | 19.4 | GO:2000270 | negative regulation of fibroblast apoptotic process(GO:2000270) |
| 3.9 | 19.3 | GO:0060741 | prostate gland stromal morphogenesis(GO:0060741) |
| 3.8 | 53.7 | GO:0035855 | megakaryocyte development(GO:0035855) |
| 3.8 | 194.9 | GO:0038061 | NIK/NF-kappaB signaling(GO:0038061) |
| 3.8 | 3.8 | GO:0035166 | post-embryonic hemopoiesis(GO:0035166) |
| 3.8 | 117.7 | GO:0090383 | phagosome acidification(GO:0090383) |
| 3.8 | 11.3 | GO:0002418 | immune response to tumor cell(GO:0002418) |
| 3.8 | 56.6 | GO:0031639 | plasminogen activation(GO:0031639) |
| 3.8 | 18.9 | GO:1903232 | melanosome assembly(GO:1903232) |
| 3.8 | 41.5 | GO:0002315 | marginal zone B cell differentiation(GO:0002315) |
| 3.8 | 11.3 | GO:0030099 | myeloid cell differentiation(GO:0030099) |
| 3.8 | 60.1 | GO:0098969 | neurotransmitter receptor transport to plasma membrane(GO:0098877) neurotransmitter receptor transport to postsynaptic membrane(GO:0098969) establishment of protein localization to postsynaptic membrane(GO:1903540) |
| 3.7 | 63.4 | GO:0000002 | mitochondrial genome maintenance(GO:0000002) |
| 3.7 | 14.9 | GO:0055011 | atrial cardiac muscle cell differentiation(GO:0055011) atrial cardiac muscle cell development(GO:0055014) |
| 3.7 | 7.4 | GO:0032237 | activation of store-operated calcium channel activity(GO:0032237) positive regulation of store-operated calcium channel activity(GO:1901341) |
| 3.7 | 26.0 | GO:0035986 | senescence-associated heterochromatin focus assembly(GO:0035986) |
| 3.7 | 37.1 | GO:0070534 | protein K63-linked ubiquitination(GO:0070534) |
| 3.7 | 7.4 | GO:0035507 | regulation of myosin-light-chain-phosphatase activity(GO:0035507) |
| 3.7 | 18.5 | GO:0098728 | germ-line stem cell division(GO:0042078) male germ-line stem cell asymmetric division(GO:0048133) germline stem cell asymmetric division(GO:0098728) |
| 3.7 | 25.8 | GO:0044130 | negative regulation of growth of symbiont in host(GO:0044130) |
| 3.7 | 158.2 | GO:0043171 | peptide catabolic process(GO:0043171) |
| 3.7 | 25.7 | GO:1904380 | endoplasmic reticulum mannose trimming(GO:1904380) |
| 3.7 | 58.6 | GO:0050690 | regulation of defense response to virus by virus(GO:0050690) |
| 3.7 | 11.0 | GO:0072656 | maintenance of protein location in mitochondrion(GO:0072656) |
| 3.7 | 25.6 | GO:0032486 | Rap protein signal transduction(GO:0032486) |
| 3.6 | 90.7 | GO:0009235 | cobalamin metabolic process(GO:0009235) |
| 3.6 | 18.0 | GO:0000722 | telomere maintenance via recombination(GO:0000722) |
| 3.6 | 10.8 | GO:0017186 | peptidyl-pyroglutamic acid biosynthetic process, using glutaminyl-peptide cyclotransferase(GO:0017186) |
| 3.6 | 14.3 | GO:0021691 | cerebellar Purkinje cell layer maturation(GO:0021691) |
| 3.6 | 103.7 | GO:0030433 | ER-associated ubiquitin-dependent protein catabolic process(GO:0030433) |
| 3.5 | 343.3 | GO:0008380 | RNA splicing(GO:0008380) |
| 3.5 | 3.5 | GO:0061034 | olfactory bulb mitral cell layer development(GO:0061034) |
| 3.5 | 28.0 | GO:0001542 | ovulation from ovarian follicle(GO:0001542) |
| 3.5 | 17.5 | GO:0060020 | Bergmann glial cell differentiation(GO:0060020) |
| 3.5 | 55.6 | GO:0006337 | nucleosome disassembly(GO:0006337) |
| 3.5 | 24.3 | GO:1900029 | positive regulation of ruffle assembly(GO:1900029) |
| 3.5 | 24.3 | GO:0000012 | single strand break repair(GO:0000012) |
| 3.4 | 6.9 | GO:0002384 | hepatic immune response(GO:0002384) |
| 3.4 | 10.3 | GO:0035624 | receptor transactivation(GO:0035624) |
| 3.4 | 27.4 | GO:0048387 | negative regulation of retinoic acid receptor signaling pathway(GO:0048387) |
| 3.4 | 3.4 | GO:0051595 | response to methylglyoxal(GO:0051595) |
| 3.4 | 6.8 | GO:0044065 | regulation of respiratory system process(GO:0044065) |
| 3.4 | 95.4 | GO:0007077 | mitotic nuclear envelope disassembly(GO:0007077) |
| 3.4 | 6.8 | GO:0002347 | response to tumor cell(GO:0002347) |
| 3.4 | 27.1 | GO:0010592 | positive regulation of lamellipodium assembly(GO:0010592) |
| 3.4 | 10.1 | GO:0002880 | microglial cell activation involved in immune response(GO:0002282) chronic inflammatory response to non-antigenic stimulus(GO:0002545) regulation of chronic inflammatory response to non-antigenic stimulus(GO:0002880) negative regulation of chronic inflammatory response to non-antigenic stimulus(GO:0002881) |
| 3.4 | 26.9 | GO:0071404 | cellular response to low-density lipoprotein particle stimulus(GO:0071404) |
| 3.4 | 43.7 | GO:0006002 | fructose 6-phosphate metabolic process(GO:0006002) |
| 3.4 | 20.2 | GO:0031935 | regulation of chromatin silencing(GO:0031935) |
| 3.4 | 70.4 | GO:0006119 | oxidative phosphorylation(GO:0006119) |
| 3.4 | 23.5 | GO:0071223 | response to lipoteichoic acid(GO:0070391) cellular response to lipoteichoic acid(GO:0071223) |
| 3.3 | 26.7 | GO:0006384 | transcription initiation from RNA polymerase III promoter(GO:0006384) |
| 3.3 | 9.9 | GO:0046166 | glyceraldehyde-3-phosphate biosynthetic process(GO:0046166) |
| 3.3 | 16.5 | GO:0032876 | negative regulation of DNA endoreduplication(GO:0032876) |
| 3.3 | 32.7 | GO:0006610 | ribosomal protein import into nucleus(GO:0006610) |
| 3.3 | 13.1 | GO:0060155 | platelet dense granule organization(GO:0060155) |
| 3.3 | 71.6 | GO:0006903 | vesicle targeting(GO:0006903) |
| 3.2 | 6.5 | GO:0043382 | regulation of memory T cell differentiation(GO:0043380) positive regulation of memory T cell differentiation(GO:0043382) |
| 3.2 | 155.3 | GO:0006891 | intra-Golgi vesicle-mediated transport(GO:0006891) |
| 3.2 | 19.4 | GO:0046604 | positive regulation of mitotic centrosome separation(GO:0046604) |
| 3.2 | 9.7 | GO:0090219 | negative regulation of lipid kinase activity(GO:0090219) |
| 3.2 | 3.2 | GO:0010039 | response to iron ion(GO:0010039) |
| 3.2 | 6.4 | GO:0090270 | fibroblast growth factor production(GO:0090269) regulation of fibroblast growth factor production(GO:0090270) |
| 3.2 | 69.6 | GO:0043968 | histone H2A acetylation(GO:0043968) |
| 3.2 | 19.0 | GO:0042699 | follicle-stimulating hormone signaling pathway(GO:0042699) |
| 3.1 | 15.7 | GO:0033089 | positive regulation of T cell differentiation in thymus(GO:0033089) positive regulation of thymocyte aggregation(GO:2000400) |
| 3.1 | 25.2 | GO:1900223 | positive regulation of beta-amyloid clearance(GO:1900223) |
| 3.1 | 12.5 | GO:1902766 | skeletal muscle satellite cell migration(GO:1902766) |
| 3.1 | 3.1 | GO:0031291 | Ran protein signal transduction(GO:0031291) |
| 3.1 | 21.7 | GO:0014066 | regulation of phosphatidylinositol 3-kinase signaling(GO:0014066) |
| 3.1 | 12.4 | GO:0031666 | positive regulation of lipopolysaccharide-mediated signaling pathway(GO:0031666) |
| 3.1 | 12.4 | GO:0006183 | GTP biosynthetic process(GO:0006183) |
| 3.1 | 21.7 | GO:0051561 | positive regulation of mitochondrial calcium ion concentration(GO:0051561) |
| 3.1 | 9.3 | GO:0051661 | maintenance of centrosome location(GO:0051661) |
| 3.1 | 3.1 | GO:0019346 | homoserine metabolic process(GO:0009092) transsulfuration(GO:0019346) |
| 3.1 | 6.2 | GO:0021764 | amygdala development(GO:0021764) |
| 3.1 | 9.2 | GO:0086054 | pulmonary valve formation(GO:0003193) atrial ventricular junction remodeling(GO:0003294) foramen ovale closure(GO:0035922) atrial cardiac muscle cell to AV node cell communication by electrical coupling(GO:0086044) bundle of His cell to Purkinje myocyte communication by electrical coupling(GO:0086054) Purkinje myocyte to ventricular cardiac muscle cell communication by electrical coupling(GO:0086055) regulation of Purkinje myocyte action potential(GO:0098906) vasomotion(GO:1990029) |
| 3.1 | 52.2 | GO:0007213 | G-protein coupled acetylcholine receptor signaling pathway(GO:0007213) |
| 3.1 | 12.3 | GO:2000587 | negative regulation of platelet-derived growth factor receptor-beta signaling pathway(GO:2000587) |
| 3.0 | 12.2 | GO:0071352 | interleukin-2-mediated signaling pathway(GO:0038110) cellular response to interleukin-2(GO:0071352) |
| 3.0 | 15.2 | GO:0019511 | peptidyl-proline hydroxylation(GO:0019511) |
| 3.0 | 24.3 | GO:0061101 | neuroendocrine cell differentiation(GO:0061101) |
| 3.0 | 33.2 | GO:0032463 | negative regulation of protein homooligomerization(GO:0032463) |
| 3.0 | 39.1 | GO:0060632 | regulation of microtubule-based movement(GO:0060632) |
| 3.0 | 6.0 | GO:0060434 | bronchus morphogenesis(GO:0060434) |
| 3.0 | 23.8 | GO:0048386 | positive regulation of retinoic acid receptor signaling pathway(GO:0048386) |
| 3.0 | 20.8 | GO:0032488 | Cdc42 protein signal transduction(GO:0032488) |
| 3.0 | 8.9 | GO:0090261 | positive regulation of inclusion body assembly(GO:0090261) |
| 3.0 | 26.6 | GO:0060576 | intestinal epithelial cell development(GO:0060576) |
| 2.9 | 8.8 | GO:0090343 | positive regulation of cell aging(GO:0090343) |
| 2.9 | 8.8 | GO:0070562 | regulation of vitamin D receptor signaling pathway(GO:0070562) |
| 2.9 | 2.9 | GO:0051461 | positive regulation of corticotropin secretion(GO:0051461) |
| 2.9 | 14.6 | GO:0007076 | mitotic chromosome condensation(GO:0007076) |
| 2.9 | 2.9 | GO:0031397 | negative regulation of protein ubiquitination(GO:0031397) |
| 2.9 | 144.8 | GO:0007157 | heterophilic cell-cell adhesion via plasma membrane cell adhesion molecules(GO:0007157) |
| 2.9 | 2.9 | GO:0048709 | oligodendrocyte differentiation(GO:0048709) |
| 2.8 | 2.8 | GO:0051182 | coenzyme transport(GO:0051182) |
| 2.8 | 8.5 | GO:0046521 | sphingoid catabolic process(GO:0046521) |
| 2.8 | 22.5 | GO:0035562 | negative regulation of chromatin binding(GO:0035562) |
| 2.8 | 14.0 | GO:0032516 | positive regulation of phosphoprotein phosphatase activity(GO:0032516) |
| 2.8 | 5.6 | GO:0009048 | dosage compensation(GO:0007549) dosage compensation by inactivation of X chromosome(GO:0009048) |
| 2.8 | 39.0 | GO:0006488 | dolichol-linked oligosaccharide biosynthetic process(GO:0006488) |
| 2.8 | 22.3 | GO:0015816 | glycine transport(GO:0015816) |
| 2.8 | 27.8 | GO:0051016 | barbed-end actin filament capping(GO:0051016) |
| 2.8 | 5.5 | GO:0016095 | polyprenol catabolic process(GO:0016095) |
| 2.8 | 16.5 | GO:1903715 | regulation of aerobic respiration(GO:1903715) |
| 2.7 | 13.7 | GO:1903599 | positive regulation of mitophagy(GO:1903599) |
| 2.7 | 5.5 | GO:0032471 | negative regulation of endoplasmic reticulum calcium ion concentration(GO:0032471) |
| 2.7 | 16.4 | GO:1902591 | single-organism membrane budding(GO:1902591) |
| 2.7 | 46.3 | GO:0000185 | activation of MAPKKK activity(GO:0000185) |
| 2.7 | 24.3 | GO:0071340 | skeletal muscle acetylcholine-gated channel clustering(GO:0071340) |
| 2.7 | 2.7 | GO:0035627 | ceramide transport(GO:0035627) |
| 2.7 | 10.7 | GO:0043555 | regulation of translation in response to stress(GO:0043555) |
| 2.7 | 5.3 | GO:1901856 | negative regulation of cellular respiration(GO:1901856) |
| 2.6 | 7.8 | GO:1902715 | positive regulation of interferon-gamma secretion(GO:1902715) |
| 2.6 | 15.6 | GO:0010890 | positive regulation of sequestering of triglyceride(GO:0010890) |
| 2.6 | 10.3 | GO:0015793 | glycerol transport(GO:0015793) |
| 2.6 | 25.6 | GO:0006750 | glutathione biosynthetic process(GO:0006750) |
| 2.5 | 43.2 | GO:0051123 | RNA polymerase II transcriptional preinitiation complex assembly(GO:0051123) |
| 2.5 | 22.8 | GO:0032785 | negative regulation of DNA-templated transcription, elongation(GO:0032785) negative regulation of transcription elongation from RNA polymerase II promoter(GO:0034244) |
| 2.5 | 5.0 | GO:0032639 | TRAIL production(GO:0032639) regulation of TRAIL production(GO:0032679) positive regulation of TRAIL production(GO:0032759) |
| 2.5 | 17.6 | GO:2000304 | positive regulation of sphingolipid biosynthetic process(GO:0090154) positive regulation of ceramide biosynthetic process(GO:2000304) |
| 2.5 | 25.0 | GO:0097500 | receptor localization to nonmotile primary cilium(GO:0097500) |
| 2.5 | 39.9 | GO:0007176 | regulation of epidermal growth factor-activated receptor activity(GO:0007176) |
| 2.5 | 37.1 | GO:0008053 | mitochondrial fusion(GO:0008053) |
| 2.5 | 9.9 | GO:0002934 | desmosome organization(GO:0002934) |
| 2.5 | 2.5 | GO:0043985 | histone H4-R3 methylation(GO:0043985) |
| 2.5 | 12.3 | GO:0001705 | ectoderm formation(GO:0001705) ectodermal cell fate commitment(GO:0001712) |
| 2.4 | 36.7 | GO:0006607 | NLS-bearing protein import into nucleus(GO:0006607) |
| 2.4 | 24.4 | GO:1904886 | beta-catenin destruction complex disassembly(GO:1904886) |
| 2.4 | 16.9 | GO:1902031 | regulation of NADP metabolic process(GO:1902031) |
| 2.4 | 12.0 | GO:0035542 | regulation of SNARE complex assembly(GO:0035542) |
| 2.4 | 19.1 | GO:0043407 | negative regulation of MAP kinase activity(GO:0043407) |
| 2.4 | 2.4 | GO:0051683 | establishment of Golgi localization(GO:0051683) |
| 2.4 | 9.5 | GO:0034205 | beta-amyloid formation(GO:0034205) |
| 2.4 | 4.7 | GO:0072757 | cellular response to camptothecin(GO:0072757) |
| 2.4 | 7.1 | GO:0006642 | triglyceride mobilization(GO:0006642) |
| 2.4 | 9.5 | GO:1903301 | positive regulation of glucokinase activity(GO:0033133) positive regulation of hexokinase activity(GO:1903301) |
| 2.4 | 26.0 | GO:0032781 | positive regulation of ATPase activity(GO:0032781) |
| 2.4 | 21.2 | GO:0035360 | positive regulation of peroxisome proliferator activated receptor signaling pathway(GO:0035360) |
| 2.3 | 4.7 | GO:1902237 | positive regulation of endoplasmic reticulum stress-induced intrinsic apoptotic signaling pathway(GO:1902237) |
| 2.3 | 35.2 | GO:0032060 | bleb assembly(GO:0032060) |
| 2.3 | 4.7 | GO:1902474 | positive regulation of protein localization to synapse(GO:1902474) |
| 2.3 | 9.3 | GO:0071353 | cellular response to interleukin-4(GO:0071353) |
| 2.3 | 23.3 | GO:0021815 | modulation of microtubule cytoskeleton involved in cerebral cortex radial glia guided migration(GO:0021815) |
| 2.3 | 9.3 | GO:0071763 | nuclear membrane organization(GO:0071763) |
| 2.3 | 374.5 | GO:0006457 | protein folding(GO:0006457) |
| 2.3 | 4.6 | GO:0007266 | Rho protein signal transduction(GO:0007266) |
| 2.3 | 31.6 | GO:0009313 | oligosaccharide catabolic process(GO:0009313) |
| 2.3 | 9.0 | GO:0007613 | memory(GO:0007613) |
| 2.3 | 9.0 | GO:0014894 | response to muscle inactivity(GO:0014870) response to muscle inactivity involved in regulation of muscle adaptation(GO:0014877) response to denervation involved in regulation of muscle adaptation(GO:0014894) |
| 2.2 | 20.2 | GO:0043568 | positive regulation of insulin-like growth factor receptor signaling pathway(GO:0043568) |
| 2.2 | 2.2 | GO:2000618 | regulation of histone H4-K16 acetylation(GO:2000618) |
| 2.2 | 17.8 | GO:0043374 | CD8-positive, alpha-beta T cell differentiation(GO:0043374) |
| 2.2 | 8.9 | GO:0006054 | N-acetylneuraminate metabolic process(GO:0006054) |
| 2.2 | 33.0 | GO:0048853 | forebrain morphogenesis(GO:0048853) |
| 2.2 | 52.7 | GO:0005980 | glycogen catabolic process(GO:0005980) |
| 2.2 | 4.4 | GO:0060352 | cell adhesion molecule production(GO:0060352) |
| 2.2 | 6.5 | GO:0032252 | regulation of inositol 1,4,5-trisphosphate-sensitive calcium-release channel activity(GO:0031585) secretory granule localization(GO:0032252) |
| 2.2 | 8.7 | GO:1900017 | positive regulation of cytokine production involved in inflammatory response(GO:1900017) |
| 2.2 | 15.1 | GO:0030091 | protein repair(GO:0030091) |
| 2.2 | 64.8 | GO:0015721 | bile acid and bile salt transport(GO:0015721) |
| 2.2 | 21.5 | GO:0060333 | interferon-gamma-mediated signaling pathway(GO:0060333) |
| 2.1 | 10.7 | GO:0031914 | negative regulation of synaptic plasticity(GO:0031914) |
| 2.1 | 10.7 | GO:0031340 | positive regulation of vesicle fusion(GO:0031340) |
| 2.1 | 6.4 | GO:0010649 | regulation of cell communication by electrical coupling(GO:0010649) |
| 2.1 | 10.5 | GO:0002224 | toll-like receptor signaling pathway(GO:0002224) |
| 2.1 | 2.1 | GO:0045899 | positive regulation of RNA polymerase II transcriptional preinitiation complex assembly(GO:0045899) |
| 2.1 | 6.3 | GO:0032581 | ER-dependent peroxisome organization(GO:0032581) |
| 2.1 | 12.5 | GO:0035407 | histone H3-T11 phosphorylation(GO:0035407) |
| 2.1 | 24.7 | GO:0016071 | mRNA metabolic process(GO:0016071) |
| 2.0 | 6.1 | GO:0008626 | granzyme-mediated apoptotic signaling pathway(GO:0008626) |
| 2.0 | 10.2 | GO:0035247 | peptidyl-arginine omega-N-methylation(GO:0035247) |
| 2.0 | 40.4 | GO:0061003 | positive regulation of dendritic spine morphogenesis(GO:0061003) |
| 2.0 | 2.0 | GO:0048382 | mesendoderm development(GO:0048382) |
| 2.0 | 10.1 | GO:1904274 | tricellular tight junction assembly(GO:1904274) |
| 2.0 | 2.0 | GO:0046013 | T cell homeostatic proliferation(GO:0001777) regulation of T cell homeostatic proliferation(GO:0046013) |
| 2.0 | 30.0 | GO:0007019 | microtubule depolymerization(GO:0007019) |
| 2.0 | 8.0 | GO:0042357 | thiamine diphosphate metabolic process(GO:0042357) |
| 2.0 | 2.0 | GO:0032647 | regulation of interferon-alpha production(GO:0032647) |
| 2.0 | 9.9 | GO:0030263 | apoptotic chromosome condensation(GO:0030263) |
| 2.0 | 277.1 | GO:0043122 | regulation of I-kappaB kinase/NF-kappaB signaling(GO:0043122) |
| 2.0 | 11.8 | GO:0043162 | ubiquitin-dependent protein catabolic process via the multivesicular body sorting pathway(GO:0043162) |
| 2.0 | 19.5 | GO:0046579 | positive regulation of Ras protein signal transduction(GO:0046579) |
| 2.0 | 50.8 | GO:0061640 | cytoskeleton-dependent cytokinesis(GO:0061640) |
| 1.9 | 19.3 | GO:0010452 | histone H3-K36 methylation(GO:0010452) |
| 1.9 | 13.5 | GO:0006105 | succinate metabolic process(GO:0006105) |
| 1.9 | 55.2 | GO:2000249 | regulation of actin cytoskeleton reorganization(GO:2000249) |
| 1.9 | 15.2 | GO:0007080 | mitotic metaphase plate congression(GO:0007080) |
| 1.9 | 13.2 | GO:0051299 | mitotic centrosome separation(GO:0007100) centrosome separation(GO:0051299) |
| 1.9 | 30.1 | GO:0030520 | intracellular estrogen receptor signaling pathway(GO:0030520) |
| 1.9 | 5.6 | GO:0046532 | regulation of photoreceptor cell differentiation(GO:0046532) |
| 1.9 | 41.1 | GO:0048873 | homeostasis of number of cells within a tissue(GO:0048873) |
| 1.9 | 7.4 | GO:0032914 | positive regulation of transforming growth factor beta1 production(GO:0032914) |
| 1.9 | 3.7 | GO:0051451 | myoblast migration(GO:0051451) |
| 1.9 | 9.3 | GO:0006107 | oxaloacetate metabolic process(GO:0006107) |
| 1.9 | 14.8 | GO:0033028 | myeloid cell apoptotic process(GO:0033028) |
| 1.8 | 51.7 | GO:0006611 | protein export from nucleus(GO:0006611) |
| 1.8 | 5.5 | GO:0090031 | regulation of growth plate cartilage chondrocyte proliferation(GO:0003420) nitrate catabolic process(GO:0043602) nitric oxide catabolic process(GO:0046210) positive regulation of steroid hormone biosynthetic process(GO:0090031) |
| 1.8 | 3.6 | GO:0036148 | phosphatidylglycerol acyl-chain remodeling(GO:0036148) phosphatidylglycerol metabolic process(GO:0046471) |
| 1.8 | 1.8 | GO:0019184 | nonribosomal peptide biosynthetic process(GO:0019184) |
| 1.8 | 42.7 | GO:1900740 | regulation of protein insertion into mitochondrial membrane involved in apoptotic signaling pathway(GO:1900739) positive regulation of protein insertion into mitochondrial membrane involved in apoptotic signaling pathway(GO:1900740) |
| 1.8 | 10.7 | GO:0061038 | uterus morphogenesis(GO:0061038) |
| 1.8 | 24.8 | GO:1902894 | negative regulation of pri-miRNA transcription from RNA polymerase II promoter(GO:1902894) |
| 1.8 | 39.0 | GO:0017145 | stem cell division(GO:0017145) |
| 1.8 | 280.5 | GO:0050851 | antigen receptor-mediated signaling pathway(GO:0050851) |
| 1.8 | 17.6 | GO:1900034 | regulation of cellular response to heat(GO:1900034) |
| 1.7 | 1.7 | GO:0048293 | isotype switching to IgE isotypes(GO:0048289) regulation of isotype switching to IgE isotypes(GO:0048293) positive regulation of isotype switching to IgE isotypes(GO:0048295) |
| 1.7 | 8.5 | GO:0002335 | mature B cell differentiation(GO:0002335) |
| 1.7 | 8.5 | GO:2000172 | regulation of branching morphogenesis of a nerve(GO:2000172) |
| 1.7 | 28.4 | GO:0032480 | negative regulation of type I interferon production(GO:0032480) |
| 1.7 | 20.0 | GO:0006893 | Golgi to plasma membrane transport(GO:0006893) |
| 1.7 | 5.0 | GO:0030311 | poly-N-acetyllactosamine metabolic process(GO:0030309) poly-N-acetyllactosamine biosynthetic process(GO:0030311) |
| 1.7 | 5.0 | GO:0061635 | regulation of protein complex stability(GO:0061635) |
| 1.7 | 3.3 | GO:0001302 | replicative cell aging(GO:0001302) |
| 1.6 | 9.8 | GO:0090481 | pyrimidine nucleotide-sugar transmembrane transport(GO:0090481) |
| 1.6 | 18.0 | GO:0097186 | amelogenesis(GO:0097186) |
| 1.6 | 19.4 | GO:0015937 | coenzyme A biosynthetic process(GO:0015937) |
| 1.6 | 24.2 | GO:2000144 | positive regulation of DNA-templated transcription, initiation(GO:2000144) |
| 1.6 | 11.2 | GO:0007379 | segment specification(GO:0007379) |
| 1.6 | 8.0 | GO:0010624 | regulation of Schwann cell proliferation(GO:0010624) negative regulation of Schwann cell proliferation(GO:0010626) |
| 1.6 | 11.1 | GO:0070235 | regulation of activation-induced cell death of T cells(GO:0070235) negative regulation of activation-induced cell death of T cells(GO:0070236) |
| 1.6 | 23.8 | GO:0044804 | nucleophagy(GO:0044804) |
| 1.6 | 15.9 | GO:0003094 | glomerular filtration(GO:0003094) |
| 1.6 | 6.3 | GO:0000727 | double-strand break repair via break-induced replication(GO:0000727) |
| 1.6 | 10.9 | GO:0006880 | intracellular sequestering of iron ion(GO:0006880) sequestering of iron ion(GO:0097577) |
| 1.6 | 1.6 | GO:0045065 | cytotoxic T cell differentiation(GO:0045065) |
| 1.5 | 21.7 | GO:0007265 | Ras protein signal transduction(GO:0007265) |
| 1.5 | 13.8 | GO:0043518 | negative regulation of DNA damage response, signal transduction by p53 class mediator(GO:0043518) |
| 1.5 | 6.1 | GO:0040016 | embryonic cleavage(GO:0040016) |
| 1.5 | 12.2 | GO:0070995 | NADPH oxidation(GO:0070995) |
| 1.5 | 34.9 | GO:0006270 | DNA replication initiation(GO:0006270) |
| 1.5 | 105.9 | GO:0006635 | fatty acid beta-oxidation(GO:0006635) |
| 1.5 | 25.7 | GO:1901880 | negative regulation of protein depolymerization(GO:1901880) |
| 1.5 | 108.8 | GO:0050848 | regulation of calcium-mediated signaling(GO:0050848) |
| 1.5 | 23.9 | GO:1902036 | regulation of hematopoietic stem cell differentiation(GO:1902036) |
| 1.5 | 8.9 | GO:0033151 | V(D)J recombination(GO:0033151) |
| 1.5 | 11.9 | GO:0039529 | RIG-I signaling pathway(GO:0039529) |
| 1.5 | 7.4 | GO:0009137 | purine nucleoside diphosphate catabolic process(GO:0009137) purine ribonucleoside diphosphate catabolic process(GO:0009181) |
| 1.5 | 135.2 | GO:0038096 | immune response-regulating cell surface receptor signaling pathway involved in phagocytosis(GO:0002433) Fc-gamma receptor signaling pathway involved in phagocytosis(GO:0038096) |
| 1.5 | 7.3 | GO:0001880 | Mullerian duct regression(GO:0001880) |
| 1.5 | 5.9 | GO:0046836 | glycolipid transport(GO:0046836) |
| 1.5 | 16.1 | GO:0033689 | negative regulation of osteoblast proliferation(GO:0033689) |
| 1.5 | 448.7 | GO:0043312 | neutrophil activation involved in immune response(GO:0002283) neutrophil degranulation(GO:0043312) |
| 1.4 | 5.8 | GO:1904059 | regulation of locomotor rhythm(GO:1904059) |
| 1.4 | 2.9 | GO:0010986 | positive regulation of lipoprotein particle clearance(GO:0010986) |
| 1.4 | 44.5 | GO:0000079 | regulation of cyclin-dependent protein serine/threonine kinase activity(GO:0000079) |
| 1.4 | 2.9 | GO:1900748 | positive regulation of vascular endothelial growth factor signaling pathway(GO:1900748) |
| 1.4 | 8.5 | GO:1900037 | regulation of cellular response to hypoxia(GO:1900037) |
| 1.4 | 11.4 | GO:0061732 | mitochondrial acetyl-CoA biosynthetic process from pyruvate(GO:0061732) |
| 1.4 | 8.5 | GO:0070162 | adiponectin secretion(GO:0070162) regulation of adiponectin secretion(GO:0070163) |
| 1.4 | 11.2 | GO:0061718 | NADH regeneration(GO:0006735) glycolytic process through fructose-6-phosphate(GO:0061615) glycolytic process through glucose-6-phosphate(GO:0061620) canonical glycolysis(GO:0061621) glucose catabolic process to pyruvate(GO:0061718) |
| 1.4 | 8.3 | GO:0007018 | microtubule-based movement(GO:0007018) |
| 1.4 | 4.1 | GO:0044344 | cellular response to fibroblast growth factor stimulus(GO:0044344) |
| 1.4 | 1.4 | GO:0051030 | snRNA export from nucleus(GO:0006408) snRNA transport(GO:0051030) |
| 1.4 | 31.5 | GO:0043966 | histone H3 acetylation(GO:0043966) |
| 1.4 | 1.4 | GO:0010941 | regulation of cell death(GO:0010941) |
| 1.4 | 27.2 | GO:0034508 | centromere complex assembly(GO:0034508) |
| 1.4 | 9.5 | GO:0006729 | tetrahydrobiopterin biosynthetic process(GO:0006729) tetrahydrobiopterin metabolic process(GO:0046146) |
| 1.4 | 1.4 | GO:1903201 | regulation of oxidative stress-induced cell death(GO:1903201) |
| 1.4 | 9.5 | GO:2000785 | regulation of autophagosome assembly(GO:2000785) |
| 1.3 | 6.7 | GO:1902659 | regulation of glucose mediated signaling pathway(GO:1902659) |
| 1.3 | 8.0 | GO:0046475 | glycerophospholipid catabolic process(GO:0046475) |
| 1.3 | 4.0 | GO:0006591 | ornithine metabolic process(GO:0006591) |
| 1.3 | 30.6 | GO:0006487 | protein N-linked glycosylation(GO:0006487) |
| 1.3 | 2.6 | GO:0045647 | negative regulation of erythrocyte differentiation(GO:0045647) |
| 1.3 | 48.0 | GO:0051289 | protein homotetramerization(GO:0051289) |
| 1.3 | 9.0 | GO:0051415 | interphase microtubule nucleation by interphase microtubule organizing center(GO:0051415) microtubule nucleation by microtubule organizing center(GO:0051418) |
| 1.3 | 14.0 | GO:0002566 | somatic diversification of immune receptors via somatic mutation(GO:0002566) |
| 1.3 | 1.3 | GO:0042771 | intrinsic apoptotic signaling pathway in response to DNA damage by p53 class mediator(GO:0042771) |
| 1.3 | 3.8 | GO:0050747 | positive regulation of lipoprotein metabolic process(GO:0050747) |
| 1.3 | 1.3 | GO:0060462 | lung lobe development(GO:0060462) lung lobe morphogenesis(GO:0060463) |
| 1.2 | 11.2 | GO:0071847 | TNFSF11-mediated signaling pathway(GO:0071847) |
| 1.2 | 3.7 | GO:0036353 | histone H2A-K119 monoubiquitination(GO:0036353) |
| 1.2 | 57.9 | GO:0006338 | chromatin remodeling(GO:0006338) |
| 1.2 | 2.4 | GO:0061394 | regulation of transcription from RNA polymerase II promoter in response to arsenic-containing substance(GO:0061394) |
| 1.2 | 7.2 | GO:0048311 | mitochondrion distribution(GO:0048311) |
| 1.2 | 4.8 | GO:2001286 | regulation of caveolin-mediated endocytosis(GO:2001286) positive regulation of caveolin-mediated endocytosis(GO:2001288) |
| 1.2 | 11.9 | GO:0007096 | regulation of exit from mitosis(GO:0007096) |
| 1.2 | 4.6 | GO:0031547 | brain-derived neurotrophic factor receptor signaling pathway(GO:0031547) |
| 1.2 | 6.9 | GO:0000212 | meiotic spindle organization(GO:0000212) |
| 1.2 | 5.8 | GO:0097192 | signal transduction in absence of ligand(GO:0038034) extrinsic apoptotic signaling pathway in absence of ligand(GO:0097192) |
| 1.2 | 1.2 | GO:0035024 | negative regulation of Rho protein signal transduction(GO:0035024) |
| 1.1 | 1.1 | GO:0032930 | positive regulation of superoxide anion generation(GO:0032930) |
| 1.1 | 2.2 | GO:0019442 | tryptophan catabolic process to acetyl-CoA(GO:0019442) |
| 1.1 | 11.2 | GO:0051568 | histone H3-K4 methylation(GO:0051568) |
| 1.1 | 2.2 | GO:0031507 | heterochromatin assembly(GO:0031507) |
| 1.1 | 13.2 | GO:2000179 | positive regulation of neural precursor cell proliferation(GO:2000179) |
| 1.1 | 4.4 | GO:0033131 | regulation of glucokinase activity(GO:0033131) negative regulation of glucokinase activity(GO:0033132) regulation of hexokinase activity(GO:1903299) negative regulation of hexokinase activity(GO:1903300) |
| 1.1 | 2.2 | GO:0006828 | manganese ion transport(GO:0006828) |
| 1.1 | 16.4 | GO:0006622 | protein targeting to lysosome(GO:0006622) |
| 1.1 | 21.7 | GO:0046856 | phosphatidylinositol dephosphorylation(GO:0046856) |
| 1.1 | 3.3 | GO:0048701 | embryonic cranial skeleton morphogenesis(GO:0048701) |
| 1.1 | 31.4 | GO:0031581 | hemidesmosome assembly(GO:0031581) |
| 1.1 | 1.1 | GO:0010464 | mesenchymal cell proliferation(GO:0010463) regulation of mesenchymal cell proliferation(GO:0010464) |
| 1.1 | 4.3 | GO:0003409 | optic cup structural organization(GO:0003409) |
| 1.1 | 3.2 | GO:0097264 | self proteolysis(GO:0097264) |
| 1.1 | 2.1 | GO:1904996 | positive regulation of leukocyte adhesion to vascular endothelial cell(GO:1904996) |
| 1.1 | 1.1 | GO:0016191 | synaptic vesicle uncoating(GO:0016191) vesicle uncoating(GO:0072319) |
| 1.0 | 2.1 | GO:0044341 | sodium-dependent phosphate transport(GO:0044341) |
| 1.0 | 6.1 | GO:0032897 | negative regulation of viral transcription(GO:0032897) |
| 1.0 | 11.2 | GO:0050684 | regulation of mRNA processing(GO:0050684) |
| 1.0 | 1.0 | GO:0042993 | positive regulation of transcription factor import into nucleus(GO:0042993) |
| 1.0 | 3.9 | GO:0009144 | purine nucleoside triphosphate metabolic process(GO:0009144) |
| 1.0 | 13.8 | GO:0035065 | regulation of histone acetylation(GO:0035065) |
| 1.0 | 5.9 | GO:0045672 | positive regulation of osteoclast differentiation(GO:0045672) |
| 1.0 | 2.0 | GO:0035694 | mitochondrial protein catabolic process(GO:0035694) |
| 1.0 | 114.5 | GO:0008360 | regulation of cell shape(GO:0008360) |
| 1.0 | 75.9 | GO:0034728 | nucleosome organization(GO:0034728) |
| 1.0 | 5.8 | GO:0035897 | proteolysis in other organism(GO:0035897) |
| 1.0 | 3.9 | GO:0080182 | histone H3-K4 trimethylation(GO:0080182) |
| 1.0 | 2.9 | GO:0051712 | positive regulation of killing of cells of other organism(GO:0051712) |
| 1.0 | 65.5 | GO:0042787 | protein ubiquitination involved in ubiquitin-dependent protein catabolic process(GO:0042787) |
| 0.9 | 28.3 | GO:0051092 | positive regulation of NF-kappaB transcription factor activity(GO:0051092) |
| 0.9 | 36.7 | GO:0071277 | cellular response to calcium ion(GO:0071277) |
| 0.9 | 9.4 | GO:0006378 | mRNA polyadenylation(GO:0006378) RNA polyadenylation(GO:0043631) |
| 0.9 | 2.8 | GO:0048703 | embryonic viscerocranium morphogenesis(GO:0048703) |
| 0.9 | 3.6 | GO:0010499 | proteasomal ubiquitin-independent protein catabolic process(GO:0010499) |
| 0.9 | 2.7 | GO:0003341 | cilium movement(GO:0003341) |
| 0.9 | 9.1 | GO:0015014 | heparan sulfate proteoglycan biosynthetic process, polysaccharide chain biosynthetic process(GO:0015014) |
| 0.9 | 15.2 | GO:0048935 | peripheral nervous system neuron differentiation(GO:0048934) peripheral nervous system neuron development(GO:0048935) |
| 0.9 | 1.8 | GO:0060242 | contact inhibition(GO:0060242) |
| 0.9 | 2.6 | GO:0034196 | acylglycerol transport(GO:0034196) triglyceride transport(GO:0034197) |
| 0.9 | 8.8 | GO:0006363 | termination of RNA polymerase I transcription(GO:0006363) |
| 0.9 | 2.6 | GO:0010430 | fatty acid omega-oxidation(GO:0010430) |
| 0.9 | 8.5 | GO:0043153 | entrainment of circadian clock by photoperiod(GO:0043153) |
| 0.9 | 1.7 | GO:0035995 | detection of muscle stretch(GO:0035995) |
| 0.8 | 4.2 | GO:0032926 | negative regulation of activin receptor signaling pathway(GO:0032926) |
| 0.8 | 6.6 | GO:0018065 | protein-cofactor linkage(GO:0018065) |
| 0.8 | 3.3 | GO:0030728 | ovulation(GO:0030728) |
| 0.8 | 1.6 | GO:0003376 | sphingosine-1-phosphate signaling pathway(GO:0003376) sphingolipid mediated signaling pathway(GO:0090520) |
| 0.8 | 1.6 | GO:0048477 | oogenesis(GO:0048477) |
| 0.8 | 1.6 | GO:0000289 | nuclear-transcribed mRNA poly(A) tail shortening(GO:0000289) |
| 0.8 | 4.8 | GO:0038092 | nodal signaling pathway(GO:0038092) |
| 0.8 | 0.8 | GO:0097205 | renal filtration(GO:0097205) |
| 0.8 | 8.7 | GO:0017085 | response to insecticide(GO:0017085) |
| 0.8 | 18.9 | GO:0015893 | drug transport(GO:0015893) |
| 0.8 | 3.1 | GO:0001958 | endochondral ossification(GO:0001958) replacement ossification(GO:0036075) endochondral bone morphogenesis(GO:0060350) |
| 0.8 | 4.6 | GO:0042100 | B cell proliferation(GO:0042100) |
| 0.8 | 3.1 | GO:0060017 | parathyroid gland development(GO:0060017) |
| 0.8 | 17.4 | GO:1903578 | regulation of nucleoside metabolic process(GO:0009118) regulation of ATP metabolic process(GO:1903578) |
| 0.7 | 5.1 | GO:0009650 | UV protection(GO:0009650) |
| 0.7 | 2.9 | GO:0035411 | catenin import into nucleus(GO:0035411) |
| 0.7 | 2.1 | GO:1903054 | negative regulation of extracellular matrix assembly(GO:1901202) negative regulation of extracellular matrix organization(GO:1903054) |
| 0.7 | 2.1 | GO:0046958 | nonassociative learning(GO:0046958) |
| 0.7 | 0.7 | GO:0009635 | response to herbicide(GO:0009635) |
| 0.7 | 2.1 | GO:0032780 | negative regulation of ATPase activity(GO:0032780) |
| 0.7 | 2.8 | GO:0048014 | Tie signaling pathway(GO:0048014) negative regulation of positive chemotaxis(GO:0050928) |
| 0.7 | 0.7 | GO:0014065 | phosphatidylinositol 3-kinase signaling(GO:0014065) |
| 0.7 | 9.4 | GO:0035589 | G-protein coupled purinergic nucleotide receptor signaling pathway(GO:0035589) |
| 0.7 | 3.3 | GO:0032418 | lysosome localization(GO:0032418) |
| 0.7 | 5.3 | GO:0008635 | activation of cysteine-type endopeptidase activity involved in apoptotic process by cytochrome c(GO:0008635) |
| 0.7 | 3.3 | GO:0007289 | spermatid nucleus differentiation(GO:0007289) |
| 0.7 | 6.6 | GO:0031915 | positive regulation of synaptic plasticity(GO:0031915) |
| 0.7 | 2.6 | GO:0002415 | immunoglobulin transcytosis in epithelial cells mediated by polymeric immunoglobulin receptor(GO:0002415) |
| 0.6 | 4.5 | GO:0071447 | cellular response to hydroperoxide(GO:0071447) |
| 0.6 | 1.9 | GO:0070544 | histone H3-K36 demethylation(GO:0070544) |
| 0.6 | 14.6 | GO:0006582 | melanin metabolic process(GO:0006582) |
| 0.6 | 1.2 | GO:0051574 | positive regulation of histone H3-K9 methylation(GO:0051574) |
| 0.6 | 3.1 | GO:0001574 | ganglioside biosynthetic process(GO:0001574) |
| 0.6 | 5.5 | GO:0033227 | dsRNA transport(GO:0033227) |
| 0.6 | 11.6 | GO:0006099 | tricarboxylic acid cycle(GO:0006099) citrate metabolic process(GO:0006101) |
| 0.6 | 3.0 | GO:0060712 | spongiotrophoblast layer development(GO:0060712) |
| 0.6 | 1.2 | GO:0002577 | regulation of antigen processing and presentation(GO:0002577) |
| 0.6 | 0.6 | GO:0034138 | toll-like receptor 3 signaling pathway(GO:0034138) |
| 0.6 | 1.2 | GO:0061298 | retina vasculature development in camera-type eye(GO:0061298) |
| 0.6 | 5.8 | GO:0038003 | opioid receptor signaling pathway(GO:0038003) |
| 0.6 | 2.9 | GO:0060044 | negative regulation of cardiac muscle cell proliferation(GO:0060044) |
| 0.6 | 2.9 | GO:0006333 | chromatin assembly or disassembly(GO:0006333) |
| 0.6 | 1.1 | GO:0031268 | pseudopodium organization(GO:0031268) |
| 0.6 | 3.4 | GO:0001676 | long-chain fatty acid metabolic process(GO:0001676) |
| 0.6 | 3.9 | GO:0090630 | activation of GTPase activity(GO:0090630) |
| 0.6 | 1.7 | GO:0042418 | epinephrine biosynthetic process(GO:0042418) |
| 0.5 | 1.1 | GO:0003289 | septum secundum development(GO:0003285) atrial septum primum morphogenesis(GO:0003289) embryonic heart tube anterior/posterior pattern specification(GO:0035054) |
| 0.5 | 0.5 | GO:0002644 | negative regulation of tolerance induction(GO:0002644) |
| 0.5 | 5.4 | GO:0045540 | regulation of cholesterol biosynthetic process(GO:0045540) |
| 0.5 | 1.1 | GO:0021520 | spinal cord motor neuron cell fate specification(GO:0021520) |
| 0.5 | 1.1 | GO:0090344 | negative regulation of cell aging(GO:0090344) |
| 0.5 | 5.3 | GO:0007216 | G-protein coupled glutamate receptor signaling pathway(GO:0007216) |
| 0.5 | 3.7 | GO:0031444 | slow-twitch skeletal muscle fiber contraction(GO:0031444) |
| 0.5 | 2.6 | GO:0046785 | microtubule polymerization(GO:0046785) |
| 0.5 | 2.6 | GO:0090032 | negative regulation of glucocorticoid metabolic process(GO:0031944) negative regulation of glucocorticoid biosynthetic process(GO:0031947) negative regulation of hormone biosynthetic process(GO:0032353) negative regulation of steroid hormone biosynthetic process(GO:0090032) |
| 0.5 | 1.5 | GO:0032310 | prostaglandin secretion(GO:0032310) |
| 0.5 | 7.6 | GO:0048268 | clathrin coat assembly(GO:0048268) |
| 0.5 | 8.0 | GO:0051865 | protein autoubiquitination(GO:0051865) |
| 0.5 | 4.1 | GO:0019375 | galactosylceramide biosynthetic process(GO:0006682) galactolipid biosynthetic process(GO:0019375) |
| 0.5 | 31.4 | GO:0002576 | platelet degranulation(GO:0002576) |
| 0.5 | 5.0 | GO:0050732 | negative regulation of peptidyl-tyrosine phosphorylation(GO:0050732) |
| 0.4 | 4.5 | GO:1904707 | positive regulation of vascular smooth muscle cell proliferation(GO:1904707) |
| 0.4 | 3.1 | GO:0051491 | positive regulation of filopodium assembly(GO:0051491) |
| 0.4 | 12.7 | GO:0008637 | apoptotic mitochondrial changes(GO:0008637) |
| 0.4 | 7.4 | GO:0006308 | DNA catabolic process(GO:0006308) |
| 0.4 | 2.2 | GO:1903385 | regulation of homophilic cell adhesion(GO:1903385) |
| 0.4 | 1.7 | GO:0072350 | tricarboxylic acid metabolic process(GO:0072350) |
| 0.4 | 13.7 | GO:0007030 | Golgi organization(GO:0007030) |
| 0.4 | 0.9 | GO:0071109 | superior temporal gyrus development(GO:0071109) |
| 0.4 | 1.3 | GO:1900383 | regulation of synaptic plasticity by receptor localization to synapse(GO:1900383) |
| 0.4 | 0.4 | GO:0010744 | positive regulation of macrophage derived foam cell differentiation(GO:0010744) |
| 0.4 | 1.7 | GO:0035720 | intraciliary anterograde transport(GO:0035720) |
| 0.4 | 0.4 | GO:0009794 | regulation of mitotic cell cycle, embryonic(GO:0009794) mitotic cell cycle, embryonic(GO:0045448) |
| 0.4 | 0.8 | GO:0006549 | isoleucine metabolic process(GO:0006549) isoleucine catabolic process(GO:0006550) |
| 0.4 | 1.6 | GO:0034334 | adherens junction maintenance(GO:0034334) |
| 0.4 | 1.2 | GO:0060672 | epithelial cell differentiation involved in embryonic placenta development(GO:0060671) epithelial cell morphogenesis involved in placental branching(GO:0060672) |
| 0.4 | 0.8 | GO:0042421 | norepinephrine biosynthetic process(GO:0042421) |
| 0.4 | 2.2 | GO:0070875 | positive regulation of glycogen biosynthetic process(GO:0045725) positive regulation of glycogen metabolic process(GO:0070875) |
| 0.4 | 1.8 | GO:0007598 | blood coagulation, extrinsic pathway(GO:0007598) |
| 0.4 | 0.4 | GO:1900133 | renal response to blood flow involved in circulatory renin-angiotensin regulation of systemic arterial blood pressure(GO:0001999) renin secretion into blood stream(GO:0002001) regulation of renin secretion into blood stream(GO:1900133) |
| 0.4 | 1.1 | GO:0010455 | positive regulation of cell fate commitment(GO:0010455) |
| 0.4 | 1.4 | GO:0061146 | mucosal-associated lymphoid tissue development(GO:0048537) Peyer's patch development(GO:0048541) Peyer's patch morphogenesis(GO:0061146) |
| 0.4 | 1.1 | GO:0015936 | coenzyme A metabolic process(GO:0015936) |
| 0.3 | 0.7 | GO:0043038 | amino acid activation(GO:0043038) tRNA aminoacylation(GO:0043039) |
| 0.3 | 0.7 | GO:0015791 | polyol transport(GO:0015791) |
| 0.3 | 2.9 | GO:0016925 | protein sumoylation(GO:0016925) |
| 0.3 | 1.3 | GO:0051283 | sequestering of calcium ion(GO:0051208) release of sequestered calcium ion into cytosol(GO:0051209) regulation of sequestering of calcium ion(GO:0051282) negative regulation of sequestering of calcium ion(GO:0051283) |
| 0.3 | 4.0 | GO:0030865 | cortical cytoskeleton organization(GO:0030865) cortical actin cytoskeleton organization(GO:0030866) |
| 0.3 | 2.1 | GO:0051026 | chiasma assembly(GO:0051026) |
| 0.3 | 0.3 | GO:0002251 | organ or tissue specific immune response(GO:0002251) mucosal immune response(GO:0002385) |
| 0.3 | 0.6 | GO:0035994 | response to muscle stretch(GO:0035994) |
| 0.3 | 2.0 | GO:1903206 | negative regulation of hydrogen peroxide-induced cell death(GO:1903206) |
| 0.3 | 0.3 | GO:0014823 | response to activity(GO:0014823) |
| 0.3 | 2.0 | GO:0061430 | bone trabecula morphogenesis(GO:0061430) |
| 0.3 | 3.9 | GO:0006068 | ethanol catabolic process(GO:0006068) |
| 0.3 | 0.5 | GO:0061289 | cell-cell signaling involved in kidney development(GO:0060995) Wnt signaling pathway involved in kidney development(GO:0061289) canonical Wnt signaling pathway involved in metanephric kidney development(GO:0061290) cell-cell signaling involved in metanephros development(GO:0072204) |
| 0.3 | 4.7 | GO:0042531 | positive regulation of tyrosine phosphorylation of STAT protein(GO:0042531) |
| 0.2 | 0.7 | GO:0048250 | mitochondrial iron ion transport(GO:0048250) |
| 0.2 | 6.7 | GO:0031100 | organ regeneration(GO:0031100) |
| 0.2 | 1.0 | GO:0042940 | D-amino acid transport(GO:0042940) |
| 0.2 | 2.2 | GO:0009226 | nucleotide-sugar biosynthetic process(GO:0009226) |
| 0.2 | 0.2 | GO:0046683 | response to organophosphorus(GO:0046683) |
| 0.2 | 0.7 | GO:0033194 | response to hydroperoxide(GO:0033194) |
| 0.2 | 0.9 | GO:1903901 | negative regulation of viral life cycle(GO:1903901) |
| 0.2 | 0.9 | GO:0048706 | embryonic skeletal system development(GO:0048706) |
| 0.2 | 1.8 | GO:0035306 | positive regulation of dephosphorylation(GO:0035306) positive regulation of protein dephosphorylation(GO:0035307) |
| 0.2 | 0.6 | GO:0061304 | retinal blood vessel morphogenesis(GO:0061304) |
| 0.2 | 1.5 | GO:0046697 | decidualization(GO:0046697) |
| 0.2 | 0.6 | GO:0021564 | vagus nerve development(GO:0021564) |
| 0.2 | 8.9 | GO:0007193 | adenylate cyclase-inhibiting G-protein coupled receptor signaling pathway(GO:0007193) |
| 0.2 | 2.0 | GO:0019079 | viral genome replication(GO:0019079) |
| 0.2 | 0.2 | GO:0071257 | cellular response to electrical stimulus(GO:0071257) |
| 0.2 | 0.2 | GO:0090382 | phagosome maturation(GO:0090382) |
| 0.2 | 0.9 | GO:1902946 | protein localization to early endosome(GO:1902946) |
| 0.2 | 1.3 | GO:1901186 | positive regulation of ERBB signaling pathway(GO:1901186) |
| 0.2 | 0.4 | GO:2000504 | positive regulation of blood vessel remodeling(GO:2000504) |
| 0.2 | 0.5 | GO:0007512 | adult heart development(GO:0007512) |
| 0.2 | 3.3 | GO:0046339 | diacylglycerol metabolic process(GO:0046339) |
| 0.2 | 0.5 | GO:0045602 | negative regulation of endothelial cell differentiation(GO:0045602) |
| 0.2 | 1.0 | GO:0035609 | C-terminal protein deglutamylation(GO:0035609) |
| 0.2 | 0.7 | GO:0009082 | branched-chain amino acid biosynthetic process(GO:0009082) leucine biosynthetic process(GO:0009098) valine biosynthetic process(GO:0009099) |
| 0.2 | 2.3 | GO:0090162 | establishment of epithelial cell polarity(GO:0090162) |
| 0.2 | 0.7 | GO:1903831 | acetylcholine receptor signaling pathway(GO:0095500) postsynaptic signal transduction(GO:0098926) signal transduction involved in cellular response to ammonium ion(GO:1903831) response to acetylcholine(GO:1905144) cellular response to acetylcholine(GO:1905145) |
| 0.2 | 2.9 | GO:0019731 | antibacterial humoral response(GO:0019731) |
| 0.1 | 0.8 | GO:0045577 | regulation of B cell differentiation(GO:0045577) |
| 0.1 | 0.1 | GO:0071609 | chemokine (C-C motif) ligand 5 production(GO:0071609) |
| 0.1 | 0.4 | GO:0031053 | primary miRNA processing(GO:0031053) |
| 0.1 | 0.5 | GO:0006705 | mineralocorticoid biosynthetic process(GO:0006705) mineralocorticoid metabolic process(GO:0008212) |
| 0.1 | 1.2 | GO:0006833 | water transport(GO:0006833) |
| 0.1 | 0.7 | GO:0016242 | negative regulation of macroautophagy(GO:0016242) |
| 0.1 | 0.2 | GO:1902177 | positive regulation of oxidative stress-induced intrinsic apoptotic signaling pathway(GO:1902177) |
| 0.1 | 0.9 | GO:0090190 | positive regulation of branching involved in ureteric bud morphogenesis(GO:0090190) |
| 0.1 | 0.9 | GO:0000186 | activation of MAPKK activity(GO:0000186) |
| 0.1 | 0.7 | GO:0035825 | reciprocal meiotic recombination(GO:0007131) reciprocal DNA recombination(GO:0035825) |
| 0.1 | 0.8 | GO:0002074 | extraocular skeletal muscle development(GO:0002074) |
| 0.1 | 0.4 | GO:0030299 | intestinal cholesterol absorption(GO:0030299) intestinal lipid absorption(GO:0098856) |
| 0.1 | 0.9 | GO:0048246 | macrophage chemotaxis(GO:0048246) |
| 0.1 | 0.6 | GO:0035728 | response to hepatocyte growth factor(GO:0035728) |
| 0.1 | 1.7 | GO:0045599 | negative regulation of fat cell differentiation(GO:0045599) |
| 0.1 | 0.5 | GO:0042769 | DNA damage response, detection of DNA damage(GO:0042769) |
| 0.1 | 0.4 | GO:0038169 | somatostatin receptor signaling pathway(GO:0038169) somatostatin signaling pathway(GO:0038170) |
| 0.1 | 1.0 | GO:0042136 | neurotransmitter biosynthetic process(GO:0042136) |
| 0.1 | 1.2 | GO:0007520 | myoblast fusion(GO:0007520) |
| 0.1 | 0.6 | GO:0010608 | posttranscriptional regulation of gene expression(GO:0010608) |
| 0.1 | 0.4 | GO:0046600 | negative regulation of centriole replication(GO:0046600) |
| 0.1 | 0.2 | GO:0070932 | histone H3 deacetylation(GO:0070932) |
| 0.1 | 0.2 | GO:0046137 | negative regulation of vitamin metabolic process(GO:0046137) |
| 0.1 | 0.3 | GO:0006383 | transcription from RNA polymerase III promoter(GO:0006383) |
| 0.1 | 1.0 | GO:0001541 | ovarian follicle development(GO:0001541) |
| 0.1 | 0.2 | GO:0014063 | negative regulation of serotonin secretion(GO:0014063) |
| 0.1 | 0.4 | GO:0035860 | glial cell-derived neurotrophic factor receptor signaling pathway(GO:0035860) |
| 0.1 | 0.3 | GO:0016127 | cholesterol catabolic process(GO:0006707) sterol catabolic process(GO:0016127) |
| 0.1 | 0.5 | GO:0000271 | polysaccharide biosynthetic process(GO:0000271) |
| 0.0 | 0.1 | GO:0042182 | ketone catabolic process(GO:0042182) |
| 0.0 | 0.4 | GO:0002076 | osteoblast development(GO:0002076) |
| 0.0 | 0.5 | GO:0032332 | positive regulation of chondrocyte differentiation(GO:0032332) |
| 0.0 | 0.3 | GO:0016048 | detection of temperature stimulus(GO:0016048) sensory perception of temperature stimulus(GO:0050951) |
| 0.0 | 0.2 | GO:0001701 | in utero embryonic development(GO:0001701) |
| 0.0 | 0.1 | GO:0010642 | negative regulation of platelet-derived growth factor receptor signaling pathway(GO:0010642) |
| 0.0 | 0.1 | GO:0015886 | heme transport(GO:0015886) |
| 0.0 | 0.1 | GO:0043011 | myeloid dendritic cell differentiation(GO:0043011) |
Gene overrepresentation in cellular_component category:
| Log-likelihood per target | Total log-likelihood | Term | Description |
|---|---|---|---|
| 129.7 | 389.1 | GO:0033185 | dolichol-phosphate-mannose synthase complex(GO:0033185) |
| 87.2 | 784.6 | GO:0071541 | eukaryotic translation initiation factor 3 complex, eIF3m(GO:0071541) |
| 76.3 | 610.8 | GO:0034715 | pICln-Sm protein complex(GO:0034715) |
| 64.9 | 649.4 | GO:0034709 | methylosome(GO:0034709) |
| 58.0 | 696.2 | GO:0019773 | proteasome core complex, alpha-subunit complex(GO:0019773) |
| 57.0 | 455.6 | GO:1990111 | spermatoproteasome complex(GO:1990111) |
| 51.0 | 306.2 | GO:1902560 | GMP reductase complex(GO:1902560) |
| 48.3 | 193.0 | GO:0070985 | TFIIK complex(GO:0070985) |
| 46.6 | 279.5 | GO:0071817 | MMXD complex(GO:0071817) |
| 46.5 | 186.2 | GO:0071001 | U4/U6 snRNP(GO:0071001) |
| 46.0 | 230.1 | GO:0000408 | EKC/KEOPS complex(GO:0000408) |
| 44.9 | 224.6 | GO:0042643 | actomyosin, actin portion(GO:0042643) |
| 40.9 | 122.6 | GO:0071159 | NF-kappaB complex(GO:0071159) |
| 39.5 | 118.4 | GO:0005850 | eukaryotic translation initiation factor 2 complex(GO:0005850) |
| 38.8 | 465.2 | GO:0031595 | nuclear proteasome complex(GO:0031595) |
| 38.7 | 116.0 | GO:0018444 | translation release factor complex(GO:0018444) |
| 38.5 | 269.3 | GO:0005787 | signal peptidase complex(GO:0005787) |
| 38.2 | 152.7 | GO:0019907 | cyclin-dependent protein kinase activating kinase holoenzyme complex(GO:0019907) |
| 38.1 | 304.7 | GO:0005786 | signal recognition particle, endoplasmic reticulum targeting(GO:0005786) |
| 37.1 | 111.4 | GO:0030289 | protein phosphatase 4 complex(GO:0030289) |
| 36.6 | 219.4 | GO:0005688 | U6 snRNP(GO:0005688) |
| 35.9 | 35.9 | GO:0098857 | membrane raft(GO:0045121) membrane microdomain(GO:0098857) |
| 35.4 | 35.4 | GO:0030981 | cortical microtubule cytoskeleton(GO:0030981) |
| 34.4 | 171.8 | GO:0071986 | Ragulator complex(GO:0071986) |
| 34.0 | 170.0 | GO:0034666 | integrin alpha2-beta1 complex(GO:0034666) |
| 33.8 | 101.4 | GO:0034455 | t-UTP complex(GO:0034455) |
| 33.7 | 674.5 | GO:0005838 | proteasome regulatory particle(GO:0005838) |
| 33.3 | 233.1 | GO:1990726 | Lsm1-7-Pat1 complex(GO:1990726) |
| 33.1 | 298.2 | GO:0072546 | ER membrane protein complex(GO:0072546) |
| 32.2 | 610.9 | GO:0005885 | Arp2/3 protein complex(GO:0005885) |
| 30.8 | 215.9 | GO:0000172 | ribonuclease MRP complex(GO:0000172) |
| 29.5 | 177.2 | GO:0098560 | cytoplasmic side of late endosome membrane(GO:0098560) |
| 28.8 | 288.1 | GO:0072357 | PTW/PP1 phosphatase complex(GO:0072357) |
| 27.7 | 857.7 | GO:0030687 | preribosome, large subunit precursor(GO:0030687) |
| 27.2 | 81.6 | GO:0042765 | GPI-anchor transamidase complex(GO:0042765) |
| 27.1 | 324.7 | GO:0008250 | oligosaccharyltransferase complex(GO:0008250) |
| 27.0 | 405.7 | GO:0005686 | U2 snRNP(GO:0005686) |
| 26.6 | 133.1 | GO:0098837 | postsynaptic recycling endosome(GO:0098837) |
| 25.8 | 129.2 | GO:0032021 | NELF complex(GO:0032021) |
| 25.8 | 541.8 | GO:0017101 | aminoacyl-tRNA synthetase multienzyme complex(GO:0017101) |
| 25.8 | 128.9 | GO:0034688 | integrin alphaM-beta2 complex(GO:0034688) |
| 25.6 | 102.6 | GO:0072379 | BAT3 complex(GO:0071818) ER membrane insertion complex(GO:0072379) |
| 25.3 | 151.8 | GO:0031429 | box H/ACA snoRNP complex(GO:0031429) box H/ACA RNP complex(GO:0072588) box H/ACA scaRNP complex(GO:0072589) box H/ACA telomerase RNP complex(GO:0090661) |
| 24.9 | 323.2 | GO:0002199 | zona pellucida receptor complex(GO:0002199) |
| 24.6 | 73.8 | GO:0031372 | UBC13-MMS2 complex(GO:0031372) |
| 24.2 | 72.5 | GO:0048269 | methionine adenosyltransferase complex(GO:0048269) |
| 24.0 | 72.0 | GO:0097441 | basilar dendrite(GO:0097441) |
| 24.0 | 24.0 | GO:0005687 | U4 snRNP(GO:0005687) |
| 23.6 | 236.5 | GO:0000796 | condensin complex(GO:0000796) |
| 23.3 | 163.4 | GO:0005663 | DNA replication factor C complex(GO:0005663) |
| 23.0 | 69.1 | GO:0036396 | MIS complex(GO:0036396) mRNA editing complex(GO:0045293) |
| 23.0 | 368.1 | GO:0005852 | eukaryotic translation initiation factor 3 complex(GO:0005852) |
| 22.8 | 113.8 | GO:0071797 | LUBAC complex(GO:0071797) |
| 22.4 | 111.9 | GO:0097149 | centralspindlin complex(GO:0097149) |
| 22.0 | 65.9 | GO:0035370 | UBC13-UEV1A complex(GO:0035370) |
| 21.9 | 87.7 | GO:0036502 | Derlin-1-VIMP complex(GO:0036502) |
| 21.5 | 150.3 | GO:0005742 | mitochondrial outer membrane translocase complex(GO:0005742) |
| 21.4 | 64.1 | GO:0005674 | transcription factor TFIIF complex(GO:0005674) |
| 21.3 | 127.8 | GO:0008537 | proteasome activator complex(GO:0008537) |
| 21.1 | 190.3 | GO:0019774 | proteasome core complex, beta-subunit complex(GO:0019774) |
| 20.7 | 145.0 | GO:0000110 | nucleotide-excision repair factor 1 complex(GO:0000110) |
| 20.3 | 81.4 | GO:0098592 | cytoplasmic side of apical plasma membrane(GO:0098592) |
| 20.1 | 240.7 | GO:0005744 | mitochondrial inner membrane presequence translocase complex(GO:0005744) |
| 19.2 | 307.6 | GO:0031080 | nuclear pore outer ring(GO:0031080) |
| 18.8 | 188.1 | GO:0097255 | R2TP complex(GO:0097255) |
| 18.4 | 92.2 | GO:0034388 | Pwp2p-containing subcomplex of 90S preribosome(GO:0034388) |
| 18.3 | 238.0 | GO:0042555 | MCM complex(GO:0042555) |
| 18.3 | 54.8 | GO:0034272 | phosphatidylinositol 3-kinase complex, class III, type I(GO:0034271) phosphatidylinositol 3-kinase complex, class III, type II(GO:0034272) |
| 17.9 | 107.5 | GO:0005784 | Sec61 translocon complex(GO:0005784) translocon complex(GO:0071256) |
| 17.9 | 393.9 | GO:0030127 | COPII vesicle coat(GO:0030127) |
| 17.2 | 310.4 | GO:0097342 | ripoptosome(GO:0097342) |
| 17.1 | 51.4 | GO:0030688 | preribosome, small subunit precursor(GO:0030688) |
| 17.1 | 153.6 | GO:0000439 | core TFIIH complex(GO:0000439) |
| 17.0 | 119.1 | GO:0016272 | prefoldin complex(GO:0016272) |
| 16.9 | 1813.2 | GO:0022625 | cytosolic large ribosomal subunit(GO:0022625) |
| 16.8 | 151.2 | GO:0030126 | COPI vesicle coat(GO:0030126) |
| 16.6 | 298.9 | GO:0005736 | DNA-directed RNA polymerase I complex(GO:0005736) |
| 16.6 | 215.3 | GO:0046540 | U4/U6 x U5 tri-snRNP complex(GO:0046540) |
| 16.0 | 160.4 | GO:0016593 | Cdc73/Paf1 complex(GO:0016593) |
| 15.9 | 63.7 | GO:0005846 | nuclear cap binding complex(GO:0005846) |
| 15.9 | 79.5 | GO:0045272 | plasma membrane respiratory chain complex I(GO:0045272) |
| 15.8 | 31.6 | GO:0071598 | neuronal ribonucleoprotein granule(GO:0071598) |
| 15.7 | 266.9 | GO:0030686 | 90S preribosome(GO:0030686) |
| 15.5 | 293.8 | GO:0034663 | endoplasmic reticulum chaperone complex(GO:0034663) |
| 15.4 | 230.9 | GO:0030684 | preribosome(GO:0030684) |
| 15.3 | 183.9 | GO:0030008 | TRAPP complex(GO:0030008) |
| 15.2 | 76.2 | GO:0043564 | Ku70:Ku80 complex(GO:0043564) |
| 15.0 | 119.9 | GO:0032133 | chromosome passenger complex(GO:0032133) |
| 14.8 | 74.2 | GO:0033503 | HULC complex(GO:0033503) |
| 14.6 | 131.0 | GO:0033588 | Elongator holoenzyme complex(GO:0033588) |
| 14.3 | 42.8 | GO:1902636 | kinociliary basal body(GO:1902636) |
| 14.2 | 56.7 | GO:0044611 | nuclear pore inner ring(GO:0044611) |
| 14.1 | 42.4 | GO:0071595 | Nem1-Spo7 phosphatase complex(GO:0071595) |
| 14.1 | 56.5 | GO:0000214 | tRNA-intron endonuclease complex(GO:0000214) |
| 14.0 | 126.1 | GO:0097487 | multivesicular body, internal vesicle(GO:0097487) |
| 14.0 | 181.9 | GO:0005662 | DNA replication factor A complex(GO:0005662) |
| 13.8 | 13.8 | GO:0000811 | GINS complex(GO:0000811) |
| 13.8 | 41.4 | GO:0036387 | nuclear pre-replicative complex(GO:0005656) pre-replicative complex(GO:0036387) |
| 13.7 | 95.7 | GO:0002178 | palmitoyltransferase complex(GO:0002178) |
| 13.7 | 95.7 | GO:0045252 | oxoglutarate dehydrogenase complex(GO:0045252) |
| 13.6 | 176.7 | GO:0000815 | ESCRT III complex(GO:0000815) |
| 13.6 | 54.3 | GO:0031436 | BRCA1-BARD1 complex(GO:0031436) |
| 13.6 | 257.7 | GO:0005665 | DNA-directed RNA polymerase II, core complex(GO:0005665) |
| 13.6 | 94.9 | GO:0070531 | BRCA1-A complex(GO:0070531) |
| 13.2 | 52.9 | GO:0070876 | SOSS complex(GO:0070876) |
| 13.2 | 356.6 | GO:0005763 | organellar small ribosomal subunit(GO:0000314) mitochondrial small ribosomal subunit(GO:0005763) |
| 13.1 | 144.1 | GO:0036452 | ESCRT complex(GO:0036452) |
| 13.1 | 182.9 | GO:0090543 | Flemming body(GO:0090543) |
| 13.1 | 65.3 | GO:0009368 | endopeptidase Clp complex(GO:0009368) |
| 13.0 | 519.7 | GO:0015934 | large ribosomal subunit(GO:0015934) |
| 12.9 | 142.1 | GO:0042105 | alpha-beta T cell receptor complex(GO:0042105) |
| 12.9 | 90.0 | GO:0005851 | eukaryotic translation initiation factor 2B complex(GO:0005851) |
| 12.8 | 89.8 | GO:0005854 | nascent polypeptide-associated complex(GO:0005854) |
| 12.8 | 128.3 | GO:0000506 | glycosylphosphatidylinositol-N-acetylglucosaminyltransferase (GPI-GnT) complex(GO:0000506) |
| 12.7 | 229.2 | GO:0005685 | U1 snRNP(GO:0005685) |
| 12.5 | 375.6 | GO:0005680 | anaphase-promoting complex(GO:0005680) |
| 12.5 | 87.4 | GO:0035692 | macrophage migration inhibitory factor receptor complex(GO:0035692) |
| 12.4 | 224.0 | GO:0000276 | mitochondrial proton-transporting ATP synthase complex, coupling factor F(o)(GO:0000276) |
| 12.3 | 49.4 | GO:0005968 | Rab-protein geranylgeranyltransferase complex(GO:0005968) |
| 12.3 | 147.9 | GO:0097433 | dense body(GO:0097433) |
| 12.3 | 85.9 | GO:0042719 | mitochondrial intermembrane space protein transporter complex(GO:0042719) |
| 12.2 | 48.9 | GO:0031510 | SUMO activating enzyme complex(GO:0031510) |
| 12.2 | 232.1 | GO:0036020 | endolysosome membrane(GO:0036020) |
| 12.2 | 122.1 | GO:0005845 | mRNA cap binding complex(GO:0005845) RNA cap binding complex(GO:0034518) |
| 12.0 | 84.2 | GO:0031298 | replication fork protection complex(GO:0031298) |
| 11.9 | 785.9 | GO:0015935 | small ribosomal subunit(GO:0015935) |
| 11.9 | 83.3 | GO:0035861 | site of double-strand break(GO:0035861) |
| 11.8 | 129.4 | GO:0019908 | nuclear cyclin-dependent protein kinase holoenzyme complex(GO:0019908) |
| 11.7 | 82.2 | GO:0000275 | mitochondrial proton-transporting ATP synthase complex, catalytic core F(1)(GO:0000275) |
| 11.7 | 70.3 | GO:0070435 | Shc-EGFR complex(GO:0070435) |
| 11.7 | 128.8 | GO:0030125 | clathrin vesicle coat(GO:0030125) |
| 11.6 | 92.9 | GO:0042382 | paraspeckles(GO:0042382) |
| 11.6 | 34.8 | GO:0031262 | Ndc80 complex(GO:0031262) |
| 11.5 | 80.3 | GO:0005956 | protein kinase CK2 complex(GO:0005956) |
| 11.4 | 34.3 | GO:0036513 | Derlin-1 retrotranslocation complex(GO:0036513) |
| 11.4 | 136.6 | GO:0072559 | NLRP3 inflammasome complex(GO:0072559) |
| 11.3 | 45.3 | GO:0002189 | ribose phosphate diphosphokinase complex(GO:0002189) |
| 11.2 | 44.8 | GO:0032044 | DSIF complex(GO:0032044) |
| 11.2 | 122.7 | GO:0045275 | mitochondrial respiratory chain complex III(GO:0005750) respiratory chain complex III(GO:0045275) |
| 11.0 | 143.0 | GO:0031618 | nuclear pericentric heterochromatin(GO:0031618) |
| 11.0 | 11.0 | GO:0000153 | cytoplasmic ubiquitin ligase complex(GO:0000153) |
| 11.0 | 87.7 | GO:0031465 | Cul4B-RING E3 ubiquitin ligase complex(GO:0031465) |
| 10.8 | 21.6 | GO:0090498 | extrinsic component of Golgi membrane(GO:0090498) |
| 10.8 | 75.5 | GO:0030870 | Mre11 complex(GO:0030870) |
| 10.8 | 21.5 | GO:0005905 | clathrin-coated pit(GO:0005905) |
| 10.7 | 53.7 | GO:0032449 | CBM complex(GO:0032449) |
| 10.6 | 42.5 | GO:0030663 | COPI-coated vesicle membrane(GO:0030663) |
| 10.4 | 10.4 | GO:0000939 | condensed chromosome inner kinetochore(GO:0000939) |
| 10.3 | 61.9 | GO:0031313 | extrinsic component of endosome membrane(GO:0031313) |
| 10.3 | 144.1 | GO:0001673 | male germ cell nucleus(GO:0001673) |
| 10.3 | 143.6 | GO:0044613 | nuclear pore central transport channel(GO:0044613) |
| 10.2 | 20.5 | GO:0000942 | condensed nuclear chromosome outer kinetochore(GO:0000942) |
| 10.2 | 61.1 | GO:0000015 | phosphopyruvate hydratase complex(GO:0000015) |
| 10.2 | 50.9 | GO:0035061 | interchromatin granule(GO:0035061) |
| 10.1 | 20.2 | GO:0000808 | origin recognition complex(GO:0000808) nuclear origin of replication recognition complex(GO:0005664) |
| 10.0 | 110.4 | GO:0070765 | gamma-secretase complex(GO:0070765) |
| 10.0 | 897.8 | GO:0071013 | catalytic step 2 spliceosome(GO:0071013) |
| 9.8 | 39.3 | GO:0098799 | outer mitochondrial membrane protein complex(GO:0098799) |
| 9.7 | 300.2 | GO:0030140 | trans-Golgi network transport vesicle(GO:0030140) |
| 9.5 | 408.6 | GO:0000307 | cyclin-dependent protein kinase holoenzyme complex(GO:0000307) |
| 9.5 | 483.0 | GO:0042645 | nucleoid(GO:0009295) mitochondrial nucleoid(GO:0042645) |
| 9.5 | 85.2 | GO:0005814 | centriole(GO:0005814) |
| 9.5 | 151.3 | GO:0033202 | Ino80 complex(GO:0031011) DNA helicase complex(GO:0033202) |
| 9.3 | 27.8 | GO:0031523 | Myb complex(GO:0031523) |
| 9.1 | 73.0 | GO:0032039 | integrator complex(GO:0032039) |
| 9.0 | 44.9 | GO:0030678 | mitochondrial ribonuclease P complex(GO:0030678) |
| 8.9 | 26.8 | GO:0005839 | proteasome core complex(GO:0005839) |
| 8.9 | 62.3 | GO:0000347 | THO complex(GO:0000347) THO complex part of transcription export complex(GO:0000445) |
| 8.9 | 88.9 | GO:0001739 | sex chromatin(GO:0001739) |
| 8.9 | 35.5 | GO:0034669 | integrin alpha4-beta7 complex(GO:0034669) |
| 8.9 | 894.8 | GO:0035578 | azurophil granule lumen(GO:0035578) |
| 8.8 | 35.0 | GO:0032301 | MutSalpha complex(GO:0032301) |
| 8.5 | 518.0 | GO:0005747 | mitochondrial respiratory chain complex I(GO:0005747) NADH dehydrogenase complex(GO:0030964) respiratory chain complex I(GO:0045271) |
| 8.5 | 76.1 | GO:0044194 | cytolytic granule(GO:0044194) |
| 8.4 | 58.6 | GO:0061617 | MICOS complex(GO:0061617) |
| 8.3 | 91.1 | GO:0000176 | nuclear exosome (RNase complex)(GO:0000176) |
| 8.1 | 32.5 | GO:0030532 | small nuclear ribonucleoprotein complex(GO:0030532) |
| 8.1 | 16.2 | GO:0044615 | nuclear pore nuclear basket(GO:0044615) |
| 8.1 | 32.3 | GO:0045273 | mitochondrial respiratory chain complex II, succinate dehydrogenase complex (ubiquinone)(GO:0005749) succinate dehydrogenase complex (ubiquinone)(GO:0045257) respiratory chain complex II(GO:0045273) succinate dehydrogenase complex(GO:0045281) fumarate reductase complex(GO:0045283) |
| 8.0 | 31.8 | GO:1990730 | VCP-NSFL1C complex(GO:1990730) |
| 8.0 | 620.1 | GO:0005681 | spliceosomal complex(GO:0005681) |
| 7.8 | 62.8 | GO:0000322 | storage vacuole(GO:0000322) |
| 7.8 | 7.8 | GO:0020003 | symbiont-containing vacuole(GO:0020003) symbiont-containing vacuole membrane(GO:0020005) |
| 7.8 | 101.5 | GO:0097136 | Bcl-2 family protein complex(GO:0097136) |
| 7.8 | 23.3 | GO:0070762 | nuclear pore transmembrane ring(GO:0070762) |
| 7.7 | 139.4 | GO:0001891 | phagocytic cup(GO:0001891) |
| 7.7 | 23.1 | GO:0035068 | micro-ribonucleoprotein complex(GO:0035068) |
| 7.7 | 69.1 | GO:0044233 | ER-mitochondrion membrane contact site(GO:0044233) |
| 7.5 | 37.4 | GO:1990425 | ryanodine receptor complex(GO:1990425) |
| 7.4 | 52.0 | GO:0071203 | WASH complex(GO:0071203) |
| 7.4 | 73.9 | GO:0005853 | eukaryotic translation elongation factor 1 complex(GO:0005853) |
| 7.2 | 43.5 | GO:0098554 | cytoplasmic side of endoplasmic reticulum membrane(GO:0098554) |
| 7.1 | 28.5 | GO:0043625 | delta DNA polymerase complex(GO:0043625) |
| 7.1 | 128.2 | GO:0070971 | endoplasmic reticulum exit site(GO:0070971) |
| 7.1 | 540.0 | GO:0033116 | endoplasmic reticulum-Golgi intermediate compartment membrane(GO:0033116) |
| 7.1 | 77.6 | GO:0005751 | mitochondrial respiratory chain complex IV(GO:0005751) |
| 7.1 | 49.4 | GO:0005753 | mitochondrial proton-transporting ATP synthase complex(GO:0005753) |
| 7.0 | 28.0 | GO:0070822 | Sin3-type complex(GO:0070822) |
| 7.0 | 195.4 | GO:0010494 | cytoplasmic stress granule(GO:0010494) |
| 6.8 | 440.5 | GO:0042582 | primary lysosome(GO:0005766) azurophil granule(GO:0042582) |
| 6.6 | 33.1 | GO:0030905 | retromer, tubulation complex(GO:0030905) |
| 6.6 | 13.2 | GO:0042627 | chylomicron(GO:0042627) |
| 6.6 | 79.4 | GO:0017119 | Golgi transport complex(GO:0017119) |
| 6.4 | 12.9 | GO:0009330 | DNA topoisomerase complex (ATP-hydrolyzing)(GO:0009330) |
| 6.4 | 19.3 | GO:0070939 | Dsl1p complex(GO:0070939) |
| 6.4 | 6.4 | GO:1904724 | tertiary granule lumen(GO:1904724) |
| 6.3 | 38.0 | GO:0032010 | phagolysosome(GO:0032010) |
| 6.3 | 897.1 | GO:0101002 | ficolin-1-rich granule(GO:0101002) ficolin-1-rich granule lumen(GO:1904813) |
| 6.3 | 213.1 | GO:0090544 | BAF-type complex(GO:0090544) |
| 6.1 | 18.2 | GO:1990393 | 3M complex(GO:1990393) |
| 6.1 | 48.5 | GO:0036057 | filtration diaphragm(GO:0036056) slit diaphragm(GO:0036057) |
| 6.0 | 24.2 | GO:0043541 | UDP-N-acetylglucosamine transferase complex(GO:0043541) |
| 6.0 | 402.7 | GO:0005643 | nuclear pore(GO:0005643) |
| 5.9 | 17.8 | GO:1990423 | RZZ complex(GO:1990423) |
| 5.9 | 275.3 | GO:0001772 | immunological synapse(GO:0001772) |
| 5.8 | 11.6 | GO:0055087 | Ski complex(GO:0055087) |
| 5.8 | 17.3 | GO:0005588 | collagen type V trimer(GO:0005588) |
| 5.7 | 120.4 | GO:0035098 | ESC/E(Z) complex(GO:0035098) |
| 5.7 | 244.0 | GO:0005840 | ribosome(GO:0005840) |
| 5.7 | 73.7 | GO:0016281 | eukaryotic translation initiation factor 4F complex(GO:0016281) |
| 5.6 | 61.3 | GO:0032585 | multivesicular body membrane(GO:0032585) |
| 5.5 | 22.1 | GO:0045323 | interleukin-1 receptor complex(GO:0045323) |
| 5.5 | 33.0 | GO:0032009 | early phagosome(GO:0032009) |
| 5.3 | 47.5 | GO:0016600 | flotillin complex(GO:0016600) |
| 5.2 | 5.2 | GO:1990462 | omegasome(GO:1990462) |
| 5.2 | 25.9 | GO:0001741 | XY body(GO:0001741) |
| 5.0 | 39.7 | GO:0030670 | phagocytic vesicle membrane(GO:0030670) |
| 5.0 | 624.2 | GO:0005795 | Golgi stack(GO:0005795) |
| 5.0 | 44.6 | GO:0097550 | transcriptional preinitiation complex(GO:0097550) |
| 4.9 | 44.1 | GO:0097413 | Lewy body(GO:0097413) |
| 4.7 | 9.5 | GO:0045259 | proton-transporting ATP synthase complex(GO:0045259) |
| 4.7 | 74.6 | GO:0030285 | integral component of synaptic vesicle membrane(GO:0030285) intrinsic component of synaptic vesicle membrane(GO:0098563) |
| 4.6 | 13.9 | GO:0071062 | alphav-beta3 integrin-vitronectin complex(GO:0071062) |
| 4.6 | 4.6 | GO:0044308 | axonal spine(GO:0044308) |
| 4.6 | 13.9 | GO:0000798 | nuclear cohesin complex(GO:0000798) |
| 4.6 | 55.4 | GO:0032045 | guanyl-nucleotide exchange factor complex(GO:0032045) |
| 4.6 | 13.8 | GO:0031415 | NatA complex(GO:0031415) |
| 4.5 | 17.8 | GO:0005971 | ribonucleoside-diphosphate reductase complex(GO:0005971) |
| 4.4 | 52.9 | GO:0097038 | perinuclear endoplasmic reticulum(GO:0097038) |
| 4.4 | 8.8 | GO:0005726 | perichromatin fibrils(GO:0005726) |
| 4.4 | 22.0 | GO:0005658 | alpha DNA polymerase:primase complex(GO:0005658) |
| 4.4 | 21.8 | GO:0005943 | phosphatidylinositol 3-kinase complex, class IA(GO:0005943) |
| 4.3 | 291.1 | GO:0005758 | mitochondrial intermembrane space(GO:0005758) |
| 4.3 | 30.2 | GO:0031264 | death-inducing signaling complex(GO:0031264) |
| 4.3 | 17.0 | GO:1990031 | pinceau fiber(GO:1990031) |
| 4.2 | 12.7 | GO:0034274 | Atg12-Atg5-Atg16 complex(GO:0034274) |
| 4.2 | 21.2 | GO:0043189 | NuA4 histone acetyltransferase complex(GO:0035267) H4/H2A histone acetyltransferase complex(GO:0043189) H4 histone acetyltransferase complex(GO:1902562) |
| 4.2 | 92.9 | GO:0098553 | integral component of lumenal side of endoplasmic reticulum membrane(GO:0071556) lumenal side of endoplasmic reticulum membrane(GO:0098553) |
| 4.2 | 8.4 | GO:0048237 | rough endoplasmic reticulum lumen(GO:0048237) |
| 4.2 | 235.1 | GO:0005871 | kinesin complex(GO:0005871) |
| 4.2 | 120.9 | GO:0016469 | proton-transporting two-sector ATPase complex(GO:0016469) |
| 4.1 | 41.3 | GO:0030134 | ER to Golgi transport vesicle(GO:0030134) |
| 4.1 | 8.2 | GO:0005826 | actomyosin contractile ring(GO:0005826) |
| 4.1 | 32.5 | GO:0045335 | phagocytic vesicle(GO:0045335) |
| 4.0 | 20.2 | GO:0030062 | mitochondrial tricarboxylic acid cycle enzyme complex(GO:0030062) |
| 4.0 | 20.2 | GO:0002193 | MAML1-RBP-Jkappa- ICN1 complex(GO:0002193) |
| 4.0 | 51.9 | GO:0031209 | SCAR complex(GO:0031209) |
| 3.9 | 321.9 | GO:0017053 | transcriptional repressor complex(GO:0017053) |
| 3.8 | 18.9 | GO:0071439 | clathrin complex(GO:0071439) |
| 3.8 | 3.8 | GO:0048188 | Set1C/COMPASS complex(GO:0048188) |
| 3.7 | 326.2 | GO:0048770 | melanosome(GO:0042470) pigment granule(GO:0048770) |
| 3.7 | 232.2 | GO:0032154 | cleavage furrow(GO:0032154) cell surface furrow(GO:0097610) |
| 3.7 | 115.3 | GO:0030173 | integral component of Golgi membrane(GO:0030173) |
| 3.7 | 84.5 | GO:0000930 | gamma-tubulin complex(GO:0000930) |
| 3.6 | 14.5 | GO:0005965 | protein farnesyltransferase complex(GO:0005965) |
| 3.6 | 378.0 | GO:0000932 | cytoplasmic mRNA processing body(GO:0000932) |
| 3.6 | 25.2 | GO:0070652 | HAUS complex(GO:0070652) |
| 3.5 | 17.6 | GO:0044754 | autolysosome(GO:0044754) |
| 3.5 | 125.7 | GO:0008180 | COP9 signalosome(GO:0008180) |
| 3.5 | 250.6 | GO:0070821 | tertiary granule membrane(GO:0070821) |
| 3.5 | 6.9 | GO:0000306 | extrinsic component of vacuolar membrane(GO:0000306) |
| 3.5 | 3.5 | GO:0000346 | transcription export complex(GO:0000346) |
| 3.4 | 20.7 | GO:1990589 | ATF4-CREB1 transcription factor complex(GO:1990589) |
| 3.4 | 27.5 | GO:0071144 | SMAD2-SMAD3 protein complex(GO:0071144) |
| 3.4 | 20.4 | GO:0071339 | MLL1/2 complex(GO:0044665) MLL1 complex(GO:0071339) |
| 3.4 | 10.1 | GO:0000940 | condensed chromosome outer kinetochore(GO:0000940) |
| 3.3 | 23.3 | GO:0072487 | MSL complex(GO:0072487) |
| 3.3 | 92.0 | GO:0031258 | lamellipodium membrane(GO:0031258) |
| 3.3 | 6.5 | GO:0016442 | RISC complex(GO:0016442) RNAi effector complex(GO:0031332) |
| 3.2 | 6.5 | GO:0002079 | inner acrosomal membrane(GO:0002079) |
| 3.2 | 19.4 | GO:0005869 | dynactin complex(GO:0005869) |
| 3.2 | 1057.6 | GO:0016607 | nuclear speck(GO:0016607) |
| 3.2 | 1223.5 | GO:0005635 | nuclear envelope(GO:0005635) |
| 3.1 | 15.6 | GO:0016589 | NURF complex(GO:0016589) |
| 3.1 | 12.5 | GO:0031010 | ISWI-type complex(GO:0031010) |
| 3.0 | 15.2 | GO:0043203 | axon hillock(GO:0043203) |
| 3.0 | 12.1 | GO:0030891 | VCB complex(GO:0030891) |
| 2.9 | 11.8 | GO:0031414 | N-terminal protein acetyltransferase complex(GO:0031414) |
| 2.9 | 126.3 | GO:0035579 | specific granule membrane(GO:0035579) |
| 2.9 | 29.1 | GO:0033256 | I-kappaB/NF-kappaB complex(GO:0033256) |
| 2.9 | 8.7 | GO:0001652 | granular component(GO:0001652) |
| 2.9 | 11.5 | GO:0046696 | lipopolysaccharide receptor complex(GO:0046696) |
| 2.9 | 5.7 | GO:0034687 | integrin alphaL-beta2 complex(GO:0034687) |
| 2.8 | 39.7 | GO:0031105 | septin complex(GO:0031105) |
| 2.8 | 5.7 | GO:0051233 | spindle midzone(GO:0051233) |
| 2.8 | 39.4 | GO:0030867 | rough endoplasmic reticulum membrane(GO:0030867) |
| 2.8 | 55.9 | GO:0005876 | spindle microtubule(GO:0005876) |
| 2.8 | 72.0 | GO:0099738 | cell cortex region(GO:0099738) |
| 2.7 | 8.2 | GO:0031362 | anchored component of external side of plasma membrane(GO:0031362) |
| 2.7 | 57.3 | GO:0000502 | proteasome complex(GO:0000502) |
| 2.7 | 171.0 | GO:0030176 | integral component of endoplasmic reticulum membrane(GO:0030176) |
| 2.7 | 8.1 | GO:0071748 | IgA immunoglobulin complex(GO:0071745) IgA immunoglobulin complex, circulating(GO:0071746) monomeric IgA immunoglobulin complex(GO:0071748) polymeric IgA immunoglobulin complex(GO:0071749) secretory IgA immunoglobulin complex(GO:0071751) |
| 2.7 | 239.0 | GO:0016605 | PML body(GO:0016605) |
| 2.7 | 642.4 | GO:0019866 | organelle inner membrane(GO:0019866) |
| 2.7 | 10.6 | GO:0019815 | B cell receptor complex(GO:0019815) |
| 2.6 | 7.9 | GO:0043190 | ATP-binding cassette (ABC) transporter complex(GO:0043190) |
| 2.6 | 36.6 | GO:0031932 | TORC2 complex(GO:0031932) TOR complex(GO:0038201) |
| 2.6 | 5.2 | GO:1905202 | 3-methylcrotonyl-CoA carboxylase complex, mitochondrial(GO:0002169) methylcrotonoyl-CoA carboxylase complex(GO:1905202) |
| 2.5 | 28.0 | GO:0044216 | other organism(GO:0044215) other organism cell(GO:0044216) other organism part(GO:0044217) |
| 2.4 | 60.8 | GO:0000159 | protein phosphatase type 2A complex(GO:0000159) |
| 2.3 | 21.1 | GO:0034464 | BBSome(GO:0034464) |
| 2.3 | 39.5 | GO:0002102 | podosome(GO:0002102) |
| 2.2 | 19.9 | GO:0042588 | zymogen granule(GO:0042588) |
| 2.2 | 6.6 | GO:0035354 | Toll-like receptor 1-Toll-like receptor 2 protein complex(GO:0035354) |
| 2.2 | 84.4 | GO:0045095 | keratin filament(GO:0045095) |
| 2.1 | 8.3 | GO:0030936 | collagen type XIII trimer(GO:0005600) transmembrane collagen trimer(GO:0030936) |
| 2.1 | 4.1 | GO:0072669 | tRNA-splicing ligase complex(GO:0072669) |
| 2.0 | 51.1 | GO:0070461 | SAGA-type complex(GO:0070461) |
| 1.9 | 250.2 | GO:0031968 | organelle outer membrane(GO:0031968) |
| 1.9 | 11.5 | GO:0097539 | ciliary transition fiber(GO:0097539) |
| 1.9 | 16.9 | GO:0030904 | retromer complex(GO:0030904) |
| 1.9 | 48.7 | GO:0045171 | intercellular bridge(GO:0045171) |
| 1.9 | 1.9 | GO:0097542 | ciliary tip(GO:0097542) |
| 1.9 | 5.6 | GO:0000803 | sex chromosome(GO:0000803) |
| 1.8 | 31.4 | GO:0005719 | nuclear euchromatin(GO:0005719) |
| 1.8 | 5.5 | GO:0005801 | cis-Golgi network(GO:0005801) |
| 1.8 | 14.6 | GO:0005610 | laminin-5 complex(GO:0005610) |
| 1.8 | 10.7 | GO:0032311 | angiogenin-PRI complex(GO:0032311) |
| 1.7 | 6.9 | GO:0005896 | interleukin-6 receptor complex(GO:0005896) |
| 1.7 | 1.7 | GO:0031371 | ubiquitin conjugating enzyme complex(GO:0031371) |
| 1.7 | 10.1 | GO:0061689 | tricellular tight junction(GO:0061689) |
| 1.7 | 58.5 | GO:0019814 | immunoglobulin complex(GO:0019814) |
| 1.7 | 5.0 | GO:0031088 | platelet dense granule membrane(GO:0031088) |
| 1.7 | 6.6 | GO:0070187 | telosome(GO:0070187) |
| 1.6 | 4.9 | GO:0070578 | RISC-loading complex(GO:0070578) |
| 1.6 | 14.8 | GO:0005964 | phosphorylase kinase complex(GO:0005964) |
| 1.6 | 316.9 | GO:0005765 | lysosomal membrane(GO:0005765) lytic vacuole membrane(GO:0098852) |
| 1.6 | 1.6 | GO:0031312 | extrinsic component of organelle membrane(GO:0031312) |
| 1.6 | 16.0 | GO:0035327 | transcriptionally active chromatin(GO:0035327) |
| 1.6 | 3.2 | GO:0070938 | contractile ring(GO:0070938) |
| 1.6 | 25.2 | GO:0043205 | microfibril(GO:0001527) fibril(GO:0043205) |
| 1.5 | 3679.6 | GO:0070062 | extracellular exosome(GO:0070062) |
| 1.4 | 21.1 | GO:0035580 | specific granule lumen(GO:0035580) |
| 1.4 | 4.2 | GO:0031201 | SNARE complex(GO:0031201) |
| 1.4 | 108.8 | GO:0005819 | spindle(GO:0005819) |
| 1.4 | 1.4 | GO:0042622 | photoreceptor outer segment membrane(GO:0042622) |
| 1.4 | 24.6 | GO:0005671 | Ada2/Gcn5/Ada3 transcription activator complex(GO:0005671) |
| 1.4 | 5.4 | GO:0045178 | basal part of cell(GO:0045178) |
| 1.3 | 5.1 | GO:0030669 | clathrin-coated endocytic vesicle membrane(GO:0030669) |
| 1.2 | 6.2 | GO:0000120 | RNA polymerase I transcription factor complex(GO:0000120) |
| 1.2 | 2.5 | GO:0032389 | MutLalpha complex(GO:0032389) |
| 1.2 | 44.1 | GO:0043198 | dendritic shaft(GO:0043198) |
| 1.2 | 5.9 | GO:0017146 | NMDA selective glutamate receptor complex(GO:0017146) |
| 1.2 | 13.0 | GO:0035985 | senescence-associated heterochromatin focus(GO:0035985) |
| 1.2 | 3.5 | GO:0032279 | asymmetric synapse(GO:0032279) |
| 1.1 | 3.4 | GO:0031528 | microvillus membrane(GO:0031528) |
| 1.1 | 12.1 | GO:0005844 | polysome(GO:0005844) |
| 1.1 | 7.6 | GO:0015629 | actin cytoskeleton(GO:0015629) |
| 1.1 | 40.8 | GO:0000777 | condensed chromosome kinetochore(GO:0000777) |
| 1.1 | 12.7 | GO:0005881 | cytoplasmic microtubule(GO:0005881) |
| 1.1 | 6.3 | GO:0005790 | smooth endoplasmic reticulum(GO:0005790) |
| 1.0 | 21.5 | GO:0016327 | apicolateral plasma membrane(GO:0016327) |
| 1.0 | 9.0 | GO:0042101 | T cell receptor complex(GO:0042101) |
| 1.0 | 18.7 | GO:0005834 | heterotrimeric G-protein complex(GO:0005834) |
| 0.9 | 6.6 | GO:0070033 | synaptobrevin 2-SNAP-25-syntaxin-1a-complexin II complex(GO:0070033) synaptobrevin 2-SNAP-25-syntaxin-3-complexin complex(GO:0070554) |
| 0.9 | 13.1 | GO:0097346 | INO80-type complex(GO:0097346) |
| 0.9 | 2.8 | GO:0034676 | integrin alpha6-beta4 complex(GO:0034676) |
| 0.9 | 41.8 | GO:0030175 | filopodium(GO:0030175) |
| 0.9 | 58.1 | GO:0000922 | spindle pole(GO:0000922) |
| 0.8 | 2.4 | GO:0005960 | glycine cleavage complex(GO:0005960) |
| 0.8 | 13.5 | GO:0000118 | histone deacetylase complex(GO:0000118) |
| 0.8 | 10.9 | GO:0005793 | endoplasmic reticulum-Golgi intermediate compartment(GO:0005793) |
| 0.8 | 35.7 | GO:0005903 | brush border(GO:0005903) |
| 0.8 | 3.8 | GO:1990907 | beta-catenin-TCF complex(GO:1990907) |
| 0.8 | 18.1 | GO:0005901 | caveola(GO:0005901) |
| 0.7 | 7.2 | GO:0034045 | pre-autophagosomal structure membrane(GO:0034045) |
| 0.7 | 11.1 | GO:0005657 | replication fork(GO:0005657) |
| 0.6 | 1.3 | GO:0042827 | platelet dense granule(GO:0042827) |
| 0.6 | 1.8 | GO:0031233 | intrinsic component of external side of plasma membrane(GO:0031233) |
| 0.6 | 7.1 | GO:0031430 | M band(GO:0031430) |
| 0.6 | 2.3 | GO:0001931 | uropod(GO:0001931) cell trailing edge(GO:0031254) |
| 0.6 | 9.0 | GO:0031902 | late endosome membrane(GO:0031902) |
| 0.6 | 5.0 | GO:0005605 | basal lamina(GO:0005605) |
| 0.5 | 5.9 | GO:0000145 | exocyst(GO:0000145) |
| 0.4 | 1.7 | GO:0071141 | SMAD protein complex(GO:0071141) |
| 0.4 | 2.9 | GO:0097228 | sperm principal piece(GO:0097228) |
| 0.4 | 1.2 | GO:0032541 | cortical endoplasmic reticulum(GO:0032541) |
| 0.4 | 0.8 | GO:0042584 | chromaffin granule membrane(GO:0042584) |
| 0.3 | 1.7 | GO:0034098 | VCP-NPL4-UFD1 AAA ATPase complex(GO:0034098) |
| 0.3 | 1.4 | GO:0031466 | Cul5-RING ubiquitin ligase complex(GO:0031466) |
| 0.2 | 27.0 | GO:0009897 | external side of plasma membrane(GO:0009897) |
| 0.2 | 3.3 | GO:0032982 | myosin filament(GO:0032982) |
| 0.2 | 7.2 | GO:0016363 | nuclear matrix(GO:0016363) |
| 0.2 | 0.9 | GO:0097443 | sorting endosome(GO:0097443) |
| 0.1 | 1.5 | GO:0005614 | interstitial matrix(GO:0005614) |
| 0.1 | 0.4 | GO:0033150 | perinuclear theca(GO:0033011) cytoskeletal calyx(GO:0033150) |
| 0.1 | 1.1 | GO:0031092 | platelet alpha granule membrane(GO:0031092) |
| 0.1 | 0.2 | GO:0071438 | invadopodium membrane(GO:0071438) |
| 0.1 | 0.7 | GO:0044322 | endoplasmic reticulum quality control compartment(GO:0044322) |
| 0.1 | 4.3 | GO:0031966 | mitochondrial membrane(GO:0031966) |
| 0.1 | 62.0 | GO:0005739 | mitochondrion(GO:0005739) |
| 0.1 | 0.4 | GO:0044292 | dendrite terminus(GO:0044292) |
Gene overrepresentation in molecular_function category:
| Log-likelihood per target | Total log-likelihood | Term | Description |
|---|---|---|---|
| 129.7 | 389.1 | GO:0004582 | dolichyl-phosphate beta-D-mannosyltransferase activity(GO:0004582) |
| 76.8 | 383.8 | GO:0071208 | histone pre-mRNA DCP binding(GO:0071208) |
| 64.8 | 194.5 | GO:0004819 | glutamine-tRNA ligase activity(GO:0004819) |
| 56.8 | 113.6 | GO:0061628 | H3K27me3 modified histone binding(GO:0061628) |
| 56.5 | 338.7 | GO:0030621 | U4 snRNA binding(GO:0030621) |
| 55.8 | 167.3 | GO:0004821 | histidine-tRNA ligase activity(GO:0004821) |
| 53.8 | 161.3 | GO:0008413 | 8-oxo-7,8-dihydroguanosine triphosphate pyrophosphatase activity(GO:0008413) 8-oxo-7,8-dihydrodeoxyguanosine triphosphate pyrophosphatase activity(GO:0035539) |
| 52.6 | 526.5 | GO:0070990 | snRNP binding(GO:0070990) |
| 51.3 | 153.8 | GO:0004492 | methylmalonyl-CoA decarboxylase activity(GO:0004492) |
| 51.0 | 306.2 | GO:0003920 | GMP reductase activity(GO:0003920) oxidoreductase activity, acting on NAD(P)H, nitrogenous group as acceptor(GO:0016657) |
| 48.3 | 96.5 | GO:0035529 | NADH pyrophosphatase activity(GO:0035529) |
| 48.3 | 144.8 | GO:0042134 | rRNA primary transcript binding(GO:0042134) |
| 46.3 | 185.1 | GO:0032217 | riboflavin transporter activity(GO:0032217) |
| 43.8 | 1313.2 | GO:0070003 | threonine-type endopeptidase activity(GO:0004298) threonine-type peptidase activity(GO:0070003) |
| 38.2 | 420.5 | GO:0036402 | proteasome-activating ATPase activity(GO:0036402) |
| 38.1 | 114.3 | GO:0045127 | N-acetylglucosamine kinase activity(GO:0045127) |
| 38.0 | 190.2 | GO:0008079 | translation release factor activity(GO:0003747) translation termination factor activity(GO:0008079) |
| 37.7 | 113.2 | GO:0036317 | tyrosyl-RNA phosphodiesterase activity(GO:0036317) 5'-tyrosyl-DNA phosphodiesterase activity(GO:0070260) |
| 37.1 | 111.4 | GO:0034511 | U3 snoRNA binding(GO:0034511) |
| 36.7 | 183.5 | GO:0043023 | ribosomal large subunit binding(GO:0043023) |
| 36.5 | 109.5 | GO:0004045 | aminoacyl-tRNA hydrolase activity(GO:0004045) |
| 35.4 | 283.4 | GO:0098599 | palmitoyl-(protein) hydrolase activity(GO:0008474) palmitoyl hydrolase activity(GO:0098599) |
| 35.1 | 105.2 | GO:0004345 | glucose-6-phosphate dehydrogenase activity(GO:0004345) |
| 34.2 | 102.5 | GO:0004814 | arginine-tRNA ligase activity(GO:0004814) |
| 33.9 | 304.7 | GO:0008312 | 7S RNA binding(GO:0008312) |
| 33.7 | 134.9 | GO:0070180 | large ribosomal subunit rRNA binding(GO:0070180) |
| 33.7 | 269.6 | GO:0070181 | small ribosomal subunit rRNA binding(GO:0070181) |
| 33.4 | 133.5 | GO:0050265 | RNA uridylyltransferase activity(GO:0050265) |
| 33.0 | 198.1 | GO:0010859 | calcium-dependent cysteine-type endopeptidase inhibitor activity(GO:0010859) |
| 32.7 | 327.1 | GO:0015450 | P-P-bond-hydrolysis-driven protein transmembrane transporter activity(GO:0015450) |
| 31.8 | 190.8 | GO:0005346 | adenine nucleotide transmembrane transporter activity(GO:0000295) purine ribonucleotide transmembrane transporter activity(GO:0005346) ATP transmembrane transporter activity(GO:0005347) purine nucleotide transmembrane transporter activity(GO:0015216) ADP transmembrane transporter activity(GO:0015217) |
| 31.5 | 189.0 | GO:0044020 | histone methyltransferase activity (H4-R3 specific)(GO:0044020) |
| 30.6 | 275.5 | GO:1990948 | ligase inhibitor activity(GO:0055104) ubiquitin ligase inhibitor activity(GO:1990948) |
| 30.3 | 30.3 | GO:0048256 | flap endonuclease activity(GO:0048256) |
| 29.6 | 326.1 | GO:0004576 | oligosaccharyl transferase activity(GO:0004576) |
| 29.6 | 118.4 | GO:0004307 | ethanolaminephosphotransferase activity(GO:0004307) |
| 29.5 | 88.4 | GO:0015230 | FAD transmembrane transporter activity(GO:0015230) |
| 29.4 | 88.1 | GO:0001069 | regulatory region RNA binding(GO:0001069) |
| 28.9 | 231.3 | GO:0004865 | protein serine/threonine phosphatase inhibitor activity(GO:0004865) |
| 28.8 | 633.4 | GO:0000339 | RNA cap binding(GO:0000339) |
| 28.7 | 200.6 | GO:0030620 | U2 snRNA binding(GO:0030620) |
| 27.8 | 111.3 | GO:0002060 | purine nucleobase binding(GO:0002060) |
| 27.7 | 83.2 | GO:0004829 | threonine-tRNA ligase activity(GO:0004829) |
| 27.2 | 81.6 | GO:0003923 | GPI-anchor transamidase activity(GO:0003923) |
| 26.8 | 26.8 | GO:0017057 | 6-phosphogluconolactonase activity(GO:0017057) |
| 26.1 | 78.4 | GO:0017130 | poly(C) RNA binding(GO:0017130) |
| 26.0 | 26.0 | GO:0070259 | tyrosyl-DNA phosphodiesterase activity(GO:0070259) |
| 25.8 | 129.0 | GO:0008479 | queuine tRNA-ribosyltransferase activity(GO:0008479) |
| 25.3 | 151.8 | GO:0034513 | box H/ACA snoRNA binding(GO:0034513) |
| 24.9 | 174.6 | GO:0061133 | endopeptidase activator activity(GO:0061133) |
| 23.7 | 94.9 | GO:0005046 | KDEL sequence binding(GO:0005046) |
| 23.0 | 183.7 | GO:0000405 | bubble DNA binding(GO:0000405) |
| 22.8 | 159.4 | GO:0047134 | protein-disulfide reductase activity(GO:0047134) |
| 22.3 | 490.5 | GO:0042609 | CD4 receptor binding(GO:0042609) |
| 22.0 | 66.1 | GO:0004139 | deoxyribose-phosphate aldolase activity(GO:0004139) |
| 21.9 | 21.9 | GO:0034739 | histone deacetylase activity (H4-K16 specific)(GO:0034739) |
| 21.8 | 130.5 | GO:0042296 | ISG15 transferase activity(GO:0042296) |
| 21.5 | 64.5 | GO:0017108 | 5'-flap endonuclease activity(GO:0017108) |
| 21.4 | 85.4 | GO:0008508 | bile acid:sodium symporter activity(GO:0008508) |
| 21.2 | 1359.0 | GO:0003743 | translation initiation factor activity(GO:0003743) |
| 20.9 | 83.5 | GO:0016230 | sphingomyelin phosphodiesterase activator activity(GO:0016230) |
| 20.8 | 83.3 | GO:0004774 | succinate-CoA ligase activity(GO:0004774) |
| 20.7 | 62.2 | GO:0004730 | pseudouridylate synthase activity(GO:0004730) |
| 20.6 | 82.3 | GO:0034648 | histone demethylase activity (H3-dimethyl-K4 specific)(GO:0034648) |
| 20.6 | 61.7 | GO:0016422 | mRNA (2'-O-methyladenosine-N6-)-methyltransferase activity(GO:0016422) |
| 20.3 | 101.7 | GO:0047844 | deoxycytidine deaminase activity(GO:0047844) |
| 20.3 | 81.2 | GO:0004826 | phenylalanine-tRNA ligase activity(GO:0004826) |
| 20.3 | 142.0 | GO:1990599 | 3' overhang single-stranded DNA endodeoxyribonuclease activity(GO:1990599) |
| 20.2 | 80.7 | GO:0016748 | succinyltransferase activity(GO:0016748) |
| 20.2 | 40.3 | GO:0048039 | ubiquinone binding(GO:0048039) |
| 19.8 | 138.8 | GO:0004704 | NF-kappaB-inducing kinase activity(GO:0004704) |
| 19.7 | 59.2 | GO:0032184 | SUMO polymer binding(GO:0032184) |
| 19.6 | 137.4 | GO:0061575 | cyclin-dependent protein serine/threonine kinase activator activity(GO:0061575) |
| 19.6 | 78.2 | GO:0003827 | alpha-1,3-mannosylglycoprotein 2-beta-N-acetylglucosaminyltransferase activity(GO:0003827) |
| 19.3 | 115.7 | GO:0019136 | deoxynucleoside kinase activity(GO:0019136) |
| 19.2 | 57.6 | GO:0098625 | methylselenol reductase activity(GO:0098625) methylseleninic acid reductase activity(GO:0098626) |
| 19.0 | 133.2 | GO:0050815 | phosphoserine binding(GO:0050815) |
| 18.9 | 113.3 | GO:0016531 | copper chaperone activity(GO:0016531) |
| 18.6 | 149.0 | GO:0043142 | single-stranded DNA-dependent ATPase activity(GO:0043142) |
| 18.5 | 74.2 | GO:0004594 | pantothenate kinase activity(GO:0004594) |
| 18.5 | 55.6 | GO:0000033 | alpha-1,3-mannosyltransferase activity(GO:0000033) |
| 18.5 | 535.9 | GO:0017056 | structural constituent of nuclear pore(GO:0017056) |
| 17.6 | 369.7 | GO:0001055 | RNA polymerase II activity(GO:0001055) |
| 17.5 | 227.6 | GO:1990247 | N6-methyladenosine-containing RNA binding(GO:1990247) |
| 17.0 | 101.7 | GO:0060698 | endoribonuclease inhibitor activity(GO:0060698) |
| 16.9 | 84.6 | GO:0098639 | collagen binding involved in cell-matrix adhesion(GO:0098639) |
| 16.9 | 118.2 | GO:0030369 | ICAM-3 receptor activity(GO:0030369) |
| 16.8 | 50.4 | GO:0000213 | tRNA-intron endonuclease activity(GO:0000213) |
| 16.4 | 213.1 | GO:1990825 | sequence-specific mRNA binding(GO:1990825) |
| 16.4 | 196.5 | GO:0031386 | protein tag(GO:0031386) |
| 16.2 | 259.7 | GO:0008179 | adenylate cyclase binding(GO:0008179) |
| 16.1 | 64.5 | GO:0051996 | farnesyl-diphosphate farnesyltransferase activity(GO:0004310) squalene synthase activity(GO:0051996) |
| 16.1 | 64.5 | GO:0004132 | dCMP deaminase activity(GO:0004132) |
| 15.9 | 159.2 | GO:0005094 | Rho GDP-dissociation inhibitor activity(GO:0005094) |
| 15.9 | 15.9 | GO:0035243 | protein-arginine omega-N symmetric methyltransferase activity(GO:0035243) |
| 15.6 | 109.0 | GO:0019784 | NEDD8-specific protease activity(GO:0019784) |
| 15.3 | 45.9 | GO:0008309 | double-stranded DNA exodeoxyribonuclease activity(GO:0008309) |
| 15.2 | 91.1 | GO:0043024 | ribosomal small subunit binding(GO:0043024) |
| 15.2 | 30.3 | GO:0046979 | TAP2 binding(GO:0046979) |
| 14.9 | 59.7 | GO:0098518 | polynucleotide phosphatase activity(GO:0098518) |
| 14.8 | 59.3 | GO:0044388 | small protein activating enzyme binding(GO:0044388) |
| 14.8 | 44.4 | GO:0004677 | DNA-dependent protein kinase activity(GO:0004677) |
| 14.8 | 29.6 | GO:0008192 | RNA guanylyltransferase activity(GO:0008192) |
| 14.7 | 102.8 | GO:0043208 | glycosphingolipid binding(GO:0043208) |
| 14.6 | 43.9 | GO:0004362 | glutathione-disulfide reductase activity(GO:0004362) |
| 14.6 | 131.1 | GO:0035174 | histone serine kinase activity(GO:0035174) |
| 14.5 | 72.5 | GO:0004663 | Rab geranylgeranyltransferase activity(GO:0004663) |
| 14.4 | 201.8 | GO:0016018 | cyclosporin A binding(GO:0016018) |
| 14.3 | 85.5 | GO:0023030 | MHC class Ib protein complex binding(GO:0023025) MHC class Ib protein binding, via antigen binding groove(GO:0023030) |
| 14.2 | 56.8 | GO:0004566 | beta-glucuronidase activity(GO:0004566) |
| 14.0 | 42.1 | GO:0004016 | adenylate cyclase activity(GO:0004016) guanylate cyclase activity(GO:0004383) |
| 14.0 | 56.0 | GO:0004809 | tRNA (guanine-N2-)-methyltransferase activity(GO:0004809) |
| 14.0 | 83.9 | GO:0051022 | GDP-dissociation inhibitor binding(GO:0051021) Rho GDP-dissociation inhibitor binding(GO:0051022) |
| 14.0 | 125.7 | GO:0001094 | TFIID-class transcription factor binding(GO:0001094) |
| 14.0 | 83.8 | GO:0061649 | ubiquitinated histone binding(GO:0061649) |
| 13.8 | 82.5 | GO:0015266 | protein channel activity(GO:0015266) |
| 13.7 | 109.9 | GO:0004563 | beta-N-acetylhexosaminidase activity(GO:0004563) |
| 13.6 | 40.8 | GO:0032089 | NACHT domain binding(GO:0032089) |
| 13.4 | 2787.3 | GO:0003735 | structural constituent of ribosome(GO:0003735) |
| 13.4 | 40.2 | GO:0004170 | dUTP diphosphatase activity(GO:0004170) |
| 13.3 | 307.0 | GO:0008353 | RNA polymerase II carboxy-terminal domain kinase activity(GO:0008353) |
| 13.3 | 26.6 | GO:0097677 | STAT family protein binding(GO:0097677) |
| 13.3 | 53.2 | GO:0061676 | importin-alpha family protein binding(GO:0061676) |
| 13.2 | 13.2 | GO:0019960 | C-X3-C chemokine binding(GO:0019960) |
| 13.2 | 52.8 | GO:0004169 | dolichyl-phosphate-mannose-protein mannosyltransferase activity(GO:0004169) |
| 13.1 | 564.8 | GO:0061650 | ubiquitin-like protein conjugating enzyme activity(GO:0061650) |
| 13.1 | 52.3 | GO:0015142 | citrate transmembrane transporter activity(GO:0015137) tricarboxylic acid transmembrane transporter activity(GO:0015142) |
| 13.1 | 26.1 | GO:0001132 | RNA polymerase II transcription factor activity, TBP-class protein binding, involved in preinitiation complex assembly(GO:0001129) RNA polymerase II transcription factor activity, TBP-class protein binding(GO:0001132) |
| 13.0 | 52.0 | GO:0004743 | pyruvate kinase activity(GO:0004743) |
| 12.9 | 219.3 | GO:0005537 | mannose binding(GO:0005537) |
| 12.9 | 205.8 | GO:0008266 | poly(U) RNA binding(GO:0008266) |
| 12.8 | 128.3 | GO:0017176 | phosphatidylinositol N-acetylglucosaminyltransferase activity(GO:0017176) |
| 12.8 | 192.2 | GO:0019706 | protein-cysteine S-palmitoyltransferase activity(GO:0019706) protein-cysteine S-acyltransferase activity(GO:0019707) |
| 12.8 | 64.0 | GO:0030348 | syntaxin-3 binding(GO:0030348) |
| 12.8 | 319.7 | GO:0008157 | protein phosphatase 1 binding(GO:0008157) |
| 12.8 | 38.3 | GO:0003881 | CDP-diacylglycerol-inositol 3-phosphatidyltransferase activity(GO:0003881) |
| 12.7 | 344.0 | GO:0017025 | TBP-class protein binding(GO:0017025) |
| 12.7 | 12.7 | GO:0036435 | K48-linked polyubiquitin binding(GO:0036435) |
| 12.6 | 50.6 | GO:0044378 | non-sequence-specific DNA binding, bending(GO:0044378) |
| 12.6 | 37.7 | GO:0004822 | isoleucine-tRNA ligase activity(GO:0004822) |
| 12.5 | 50.2 | GO:0033829 | O-fucosylpeptide 3-beta-N-acetylglucosaminyltransferase activity(GO:0033829) |
| 12.5 | 49.9 | GO:0016784 | 3-mercaptopyruvate sulfurtransferase activity(GO:0016784) |
| 12.4 | 37.1 | GO:0004817 | cysteine-tRNA ligase activity(GO:0004817) |
| 12.3 | 49.2 | GO:0031871 | proteinase activated receptor binding(GO:0031871) |
| 12.3 | 24.5 | GO:0071933 | Arp2/3 complex binding(GO:0071933) |
| 12.2 | 110.0 | GO:0046790 | virion binding(GO:0046790) |
| 12.2 | 61.1 | GO:0004830 | tryptophan-tRNA ligase activity(GO:0004830) |
| 12.0 | 72.1 | GO:1990829 | C-rich single-stranded DNA binding(GO:1990829) |
| 11.9 | 273.5 | GO:0034236 | protein kinase A catalytic subunit binding(GO:0034236) |
| 11.9 | 201.7 | GO:0043495 | protein anchor(GO:0043495) |
| 11.9 | 23.7 | GO:0070363 | mitochondrial light strand promoter sense binding(GO:0070363) |
| 11.8 | 82.4 | GO:0050733 | RS domain binding(GO:0050733) |
| 11.7 | 70.3 | GO:0048408 | epidermal growth factor binding(GO:0048408) |
| 11.7 | 35.1 | GO:0070538 | oleic acid binding(GO:0070538) |
| 11.7 | 46.6 | GO:0050220 | prostaglandin-E synthase activity(GO:0050220) |
| 11.6 | 23.2 | GO:0032143 | single thymine insertion binding(GO:0032143) |
| 11.6 | 58.0 | GO:0047179 | platelet-activating factor acetyltransferase activity(GO:0047179) |
| 11.6 | 255.0 | GO:0005095 | GTPase inhibitor activity(GO:0005095) |
| 11.6 | 139.0 | GO:0089720 | caspase binding(GO:0089720) |
| 11.5 | 34.4 | GO:0030984 | kininogen binding(GO:0030984) |
| 11.4 | 194.2 | GO:0004549 | tRNA-specific ribonuclease activity(GO:0004549) |
| 11.4 | 22.8 | GO:0000403 | Y-form DNA binding(GO:0000403) |
| 11.3 | 45.4 | GO:0008466 | glycogenin glucosyltransferase activity(GO:0008466) |
| 11.3 | 45.1 | GO:0030337 | DNA polymerase processivity factor activity(GO:0030337) |
| 11.2 | 67.4 | GO:0051575 | 5'-deoxyribose-5-phosphate lyase activity(GO:0051575) |
| 11.2 | 145.8 | GO:0030957 | Tat protein binding(GO:0030957) |
| 11.2 | 44.7 | GO:0008670 | 2,4-dienoyl-CoA reductase (NADPH) activity(GO:0008670) |
| 11.1 | 311.6 | GO:0005123 | death receptor binding(GO:0005123) |
| 11.1 | 166.6 | GO:0048027 | mRNA 5'-UTR binding(GO:0048027) |
| 11.0 | 55.1 | GO:0004161 | dimethylallyltranstransferase activity(GO:0004161) geranyltranstransferase activity(GO:0004337) |
| 11.0 | 88.0 | GO:0004176 | ATP-dependent peptidase activity(GO:0004176) |
| 11.0 | 87.6 | GO:0042975 | peroxisome proliferator activated receptor binding(GO:0042975) |
| 10.9 | 32.7 | GO:0043739 | G/U mismatch-specific uracil-DNA glycosylase activity(GO:0043739) |
| 10.9 | 21.8 | GO:0000386 | second spliceosomal transesterification activity(GO:0000386) |
| 10.9 | 32.6 | GO:0004450 | isocitrate dehydrogenase (NADP+) activity(GO:0004450) |
| 10.8 | 32.3 | GO:0008177 | succinate dehydrogenase (ubiquinone) activity(GO:0008177) |
| 10.7 | 559.0 | GO:0008137 | NADH dehydrogenase (ubiquinone) activity(GO:0008137) NADH dehydrogenase (quinone) activity(GO:0050136) |
| 10.7 | 32.1 | GO:0034038 | deoxyhypusine synthase activity(GO:0034038) |
| 10.7 | 106.6 | GO:0019237 | centromeric DNA binding(GO:0019237) |
| 10.7 | 10.7 | GO:0008426 | protein kinase C inhibitor activity(GO:0008426) |
| 10.6 | 116.5 | GO:0030515 | snoRNA binding(GO:0030515) |
| 10.6 | 52.8 | GO:0004656 | procollagen-proline 4-dioxygenase activity(GO:0004656) procollagen-proline dioxygenase activity(GO:0019798) |
| 10.6 | 42.2 | GO:0008187 | poly-pyrimidine tract binding(GO:0008187) |
| 10.6 | 31.7 | GO:0003978 | UDP-N-acetylglucosamine 4-epimerase activity(GO:0003974) UDP-glucose 4-epimerase activity(GO:0003978) |
| 10.5 | 42.1 | GO:0016936 | galactoside binding(GO:0016936) |
| 10.5 | 147.3 | GO:1990381 | ubiquitin-specific protease binding(GO:1990381) |
| 10.5 | 52.6 | GO:0043120 | tumor necrosis factor binding(GO:0043120) |
| 10.4 | 20.8 | GO:0000995 | transcription factor activity, core RNA polymerase III binding(GO:0000995) |
| 10.4 | 41.7 | GO:0000014 | single-stranded DNA endodeoxyribonuclease activity(GO:0000014) |
| 10.4 | 83.3 | GO:0008097 | 5S rRNA binding(GO:0008097) |
| 10.4 | 135.0 | GO:0050786 | RAGE receptor binding(GO:0050786) |
| 10.3 | 20.7 | GO:0019788 | NEDD8 transferase activity(GO:0019788) |
| 10.3 | 51.6 | GO:0033857 | diphosphoinositol-pentakisphosphate kinase activity(GO:0033857) |
| 10.2 | 61.1 | GO:0004634 | phosphopyruvate hydratase activity(GO:0004634) |
| 10.1 | 30.2 | GO:0015315 | hexose phosphate transmembrane transporter activity(GO:0015119) organophosphate:inorganic phosphate antiporter activity(GO:0015315) hexose-phosphate:inorganic phosphate antiporter activity(GO:0015526) glucose 6-phosphate:inorganic phosphate antiporter activity(GO:0061513) |
| 10.1 | 221.3 | GO:0008239 | dipeptidyl-peptidase activity(GO:0008239) |
| 10.0 | 140.4 | GO:0034450 | ubiquitin-ubiquitin ligase activity(GO:0034450) |
| 10.0 | 941.0 | GO:0003697 | single-stranded DNA binding(GO:0003697) |
| 9.9 | 29.7 | GO:0004694 | eukaryotic translation initiation factor 2alpha kinase activity(GO:0004694) |
| 9.9 | 39.6 | GO:0004348 | glucosylceramidase activity(GO:0004348) |
| 9.8 | 107.5 | GO:0019869 | chloride channel inhibitor activity(GO:0019869) |
| 9.7 | 19.4 | GO:0032422 | purine-rich negative regulatory element binding(GO:0032422) |
| 9.7 | 29.1 | GO:0004756 | selenide, water dikinase activity(GO:0004756) phosphotransferase activity, paired acceptors(GO:0016781) |
| 9.7 | 29.1 | GO:0032090 | Pyrin domain binding(GO:0032090) |
| 9.6 | 67.2 | GO:0001054 | RNA polymerase I activity(GO:0001054) |
| 9.6 | 19.2 | GO:0022884 | macromolecule transmembrane transporter activity(GO:0022884) |
| 9.6 | 28.7 | GO:0004917 | interleukin-7 receptor activity(GO:0004917) |
| 9.6 | 66.9 | GO:0004301 | epoxide hydrolase activity(GO:0004301) |
| 9.5 | 9.5 | GO:0001540 | beta-amyloid binding(GO:0001540) |
| 9.5 | 302.7 | GO:0070577 | lysine-acetylated histone binding(GO:0070577) |
| 9.4 | 28.3 | GO:0036033 | mediator complex binding(GO:0036033) |
| 9.4 | 37.5 | GO:0034988 | Fc-gamma receptor I complex binding(GO:0034988) |
| 9.4 | 37.4 | GO:0004727 | prenylated protein tyrosine phosphatase activity(GO:0004727) |
| 9.3 | 140.1 | GO:0032036 | myosin heavy chain binding(GO:0032036) |
| 9.3 | 390.9 | GO:0050699 | WW domain binding(GO:0050699) |
| 9.3 | 27.9 | GO:0098770 | FBXO family protein binding(GO:0098770) |
| 9.3 | 18.6 | GO:0003998 | acylphosphatase activity(GO:0003998) |
| 9.3 | 83.5 | GO:1990226 | histone methyltransferase binding(GO:1990226) |
| 9.2 | 202.3 | GO:0098748 | clathrin adaptor activity(GO:0035615) endocytic adaptor activity(GO:0098748) |
| 9.1 | 63.4 | GO:0017077 | oxidative phosphorylation uncoupler activity(GO:0017077) |
| 9.0 | 27.0 | GO:0031435 | mitogen-activated protein kinase kinase kinase binding(GO:0031435) |
| 9.0 | 45.0 | GO:0002046 | opsin binding(GO:0002046) |
| 9.0 | 17.9 | GO:0008469 | histone-arginine N-methyltransferase activity(GO:0008469) protein-arginine omega-N asymmetric methyltransferase activity(GO:0035242) |
| 8.9 | 169.7 | GO:0051400 | BH domain binding(GO:0051400) |
| 8.9 | 62.5 | GO:1904264 | ubiquitin protein ligase activity involved in ERAD pathway(GO:1904264) |
| 8.9 | 124.3 | GO:0005092 | GDP-dissociation inhibitor activity(GO:0005092) |
| 8.9 | 44.3 | GO:0015307 | drug:proton antiporter activity(GO:0015307) |
| 8.9 | 35.4 | GO:0016668 | oxidoreductase activity, acting on a sulfur group of donors, NAD(P) as acceptor(GO:0016668) |
| 8.7 | 34.7 | GO:0033743 | peptide-methionine (R)-S-oxide reductase activity(GO:0033743) |
| 8.6 | 43.2 | GO:0004699 | calcium-independent protein kinase C activity(GO:0004699) |
| 8.6 | 68.6 | GO:1901612 | cardiolipin binding(GO:1901612) |
| 8.5 | 67.8 | GO:0036042 | long-chain fatty acyl-CoA binding(GO:0036042) |
| 8.5 | 67.8 | GO:0030235 | nitric-oxide synthase regulator activity(GO:0030235) |
| 8.5 | 228.6 | GO:0046933 | proton-transporting ATP synthase activity, rotational mechanism(GO:0046933) |
| 8.5 | 16.9 | GO:0000828 | inositol-1,3,4,5,6-pentakisphosphate kinase activity(GO:0000827) inositol hexakisphosphate kinase activity(GO:0000828) inositol heptakisphosphate kinase activity(GO:0000829) inositol hexakisphosphate 5-kinase activity(GO:0000832) inositol hexakisphosphate 1-kinase activity(GO:0052723) inositol hexakisphosphate 3-kinase activity(GO:0052724) |
| 8.5 | 194.7 | GO:0004812 | aminoacyl-tRNA ligase activity(GO:0004812) ligase activity, forming carbon-oxygen bonds(GO:0016875) ligase activity, forming aminoacyl-tRNA and related compounds(GO:0016876) |
| 8.3 | 339.1 | GO:0046966 | thyroid hormone receptor binding(GO:0046966) |
| 8.2 | 49.3 | GO:0008568 | microtubule-severing ATPase activity(GO:0008568) |
| 8.2 | 41.1 | GO:0010997 | anaphase-promoting complex binding(GO:0010997) |
| 8.2 | 24.6 | GO:0051377 | mannose-ethanolamine phosphotransferase activity(GO:0051377) |
| 8.2 | 8.2 | GO:0050145 | nucleoside phosphate kinase activity(GO:0050145) |
| 8.2 | 32.8 | GO:0043262 | adenosine-diphosphatase activity(GO:0043262) |
| 8.1 | 80.8 | GO:0031730 | CCR5 chemokine receptor binding(GO:0031730) |
| 8.0 | 8.0 | GO:0032558 | adenyl deoxyribonucleotide binding(GO:0032558) dATP binding(GO:0032564) |
| 8.0 | 32.1 | GO:0051916 | granulocyte colony-stimulating factor binding(GO:0051916) |
| 8.0 | 47.9 | GO:0008553 | hydrogen-exporting ATPase activity, phosphorylative mechanism(GO:0008553) |
| 7.7 | 15.4 | GO:0042979 | ornithine decarboxylase activator activity(GO:0042978) ornithine decarboxylase regulator activity(GO:0042979) |
| 7.6 | 30.6 | GO:0052827 | inositol pentakisphosphate phosphatase activity(GO:0052827) |
| 7.6 | 15.3 | GO:0004611 | phosphoenolpyruvate carboxykinase activity(GO:0004611) phosphoenolpyruvate carboxykinase (GTP) activity(GO:0004613) |
| 7.6 | 152.4 | GO:0008327 | methyl-CpG binding(GO:0008327) |
| 7.5 | 52.6 | GO:0016618 | hydroxypyruvate reductase activity(GO:0016618) glyoxylate reductase (NADP) activity(GO:0030267) |
| 7.4 | 44.4 | GO:0035500 | MH2 domain binding(GO:0035500) |
| 7.3 | 29.4 | GO:0004448 | isocitrate dehydrogenase activity(GO:0004448) |
| 7.3 | 431.4 | GO:0019003 | GDP binding(GO:0019003) |
| 7.3 | 21.9 | GO:0004347 | glucose-6-phosphate isomerase activity(GO:0004347) |
| 7.3 | 29.1 | GO:0035650 | AP-1 adaptor complex binding(GO:0035650) |
| 7.3 | 246.6 | GO:0044183 | protein binding involved in protein folding(GO:0044183) |
| 7.3 | 7.3 | GO:0001727 | lipid kinase activity(GO:0001727) |
| 7.2 | 28.9 | GO:0015140 | malate transmembrane transporter activity(GO:0015140) |
| 7.1 | 42.7 | GO:0033989 | 3alpha,7alpha,12alpha-trihydroxy-5beta-cholest-24-enoyl-CoA hydratase activity(GO:0033989) 17-beta-hydroxysteroid dehydrogenase (NAD+) activity(GO:0044594) |
| 7.1 | 28.4 | GO:0016671 | oxidoreductase activity, acting on a sulfur group of donors, disulfide as acceptor(GO:0016671) |
| 7.1 | 78.1 | GO:0017070 | U6 snRNA binding(GO:0017070) |
| 7.1 | 63.6 | GO:0050700 | CARD domain binding(GO:0050700) |
| 7.0 | 7.0 | GO:0019961 | interferon binding(GO:0019961) |
| 6.9 | 172.1 | GO:0031489 | myosin V binding(GO:0031489) |
| 6.8 | 27.3 | GO:0033981 | D-dopachrome decarboxylase activity(GO:0033981) |
| 6.6 | 6.6 | GO:0008384 | IkappaB kinase activity(GO:0008384) |
| 6.6 | 46.5 | GO:0008429 | phosphatidylethanolamine binding(GO:0008429) |
| 6.6 | 39.8 | GO:0031543 | peptidyl-proline dioxygenase activity(GO:0031543) |
| 6.6 | 19.7 | GO:0004464 | leukotriene-C4 synthase activity(GO:0004464) |
| 6.5 | 39.1 | GO:0019776 | Atg8 ligase activity(GO:0019776) |
| 6.4 | 32.0 | GO:0047617 | acyl-CoA hydrolase activity(GO:0047617) |
| 6.2 | 49.8 | GO:0046703 | natural killer cell lectin-like receptor binding(GO:0046703) |
| 6.2 | 18.6 | GO:0004766 | spermidine synthase activity(GO:0004766) |
| 6.2 | 43.5 | GO:0035197 | siRNA binding(GO:0035197) |
| 6.2 | 43.4 | GO:0001730 | 2'-5'-oligoadenylate synthetase activity(GO:0001730) |
| 6.2 | 24.8 | GO:0000400 | four-way junction DNA binding(GO:0000400) |
| 6.2 | 37.1 | GO:0016802 | adenosylhomocysteinase activity(GO:0004013) trialkylsulfonium hydrolase activity(GO:0016802) |
| 6.2 | 308.6 | GO:0017112 | Rab guanyl-nucleotide exchange factor activity(GO:0017112) |
| 6.2 | 24.7 | GO:0016744 | transferase activity, transferring aldehyde or ketonic groups(GO:0016744) |
| 6.1 | 6.1 | GO:0004913 | interleukin-4 receptor activity(GO:0004913) |
| 6.1 | 169.5 | GO:0001671 | ATPase activator activity(GO:0001671) |
| 6.0 | 6.0 | GO:0046404 | ATP-dependent polydeoxyribonucleotide 5'-hydroxyl-kinase activity(GO:0046404) polydeoxyribonucleotide kinase activity(GO:0051733) ATP-dependent polynucleotide kinase activity(GO:0051734) |
| 6.0 | 107.9 | GO:0003756 | protein disulfide isomerase activity(GO:0003756) intramolecular oxidoreductase activity, transposing S-S bonds(GO:0016864) |
| 6.0 | 35.8 | GO:0047685 | amine sulfotransferase activity(GO:0047685) |
| 6.0 | 77.5 | GO:0003688 | DNA replication origin binding(GO:0003688) |
| 5.9 | 76.7 | GO:0051537 | 2 iron, 2 sulfur cluster binding(GO:0051537) |
| 5.9 | 118.0 | GO:0042288 | MHC class I protein binding(GO:0042288) |
| 5.8 | 40.6 | GO:0070087 | chromo shadow domain binding(GO:0070087) |
| 5.8 | 34.6 | GO:1990254 | keratin filament binding(GO:1990254) |
| 5.8 | 178.3 | GO:0031492 | nucleosomal DNA binding(GO:0031492) |
| 5.7 | 80.3 | GO:0016840 | carbon-nitrogen lyase activity(GO:0016840) |
| 5.7 | 17.1 | GO:0016434 | rRNA (cytosine) methyltransferase activity(GO:0016434) |
| 5.7 | 39.9 | GO:0004652 | polynucleotide adenylyltransferase activity(GO:0004652) |
| 5.7 | 11.4 | GO:1990837 | sequence-specific double-stranded DNA binding(GO:1990837) |
| 5.5 | 16.6 | GO:0016262 | protein N-acetylglucosaminyltransferase activity(GO:0016262) |
| 5.5 | 16.6 | GO:0001181 | transcription factor activity, core RNA polymerase I binding(GO:0001181) |
| 5.5 | 27.6 | GO:0004689 | phosphorylase kinase activity(GO:0004689) |
| 5.5 | 16.4 | GO:0004523 | RNA-DNA hybrid ribonuclease activity(GO:0004523) |
| 5.4 | 326.3 | GO:0008186 | ATP-dependent RNA helicase activity(GO:0004004) RNA-dependent ATPase activity(GO:0008186) |
| 5.4 | 16.3 | GO:0033858 | N-acetylgalactosamine kinase activity(GO:0033858) |
| 5.4 | 43.4 | GO:0005522 | profilin binding(GO:0005522) |
| 5.4 | 509.6 | GO:0043130 | ubiquitin binding(GO:0043130) |
| 5.4 | 10.8 | GO:0008263 | pyrimidine-specific mismatch base pair DNA N-glycosylase activity(GO:0008263) |
| 5.3 | 58.6 | GO:0004312 | fatty acid synthase activity(GO:0004312) |
| 5.3 | 69.3 | GO:0070628 | proteasome binding(GO:0070628) |
| 5.3 | 26.5 | GO:0017159 | pantetheine hydrolase activity(GO:0017159) |
| 5.3 | 116.6 | GO:0043021 | ribonucleoprotein complex binding(GO:0043021) |
| 5.3 | 31.7 | GO:0003796 | lysozyme activity(GO:0003796) |
| 5.3 | 15.9 | GO:1990404 | protein ADP-ribosylase activity(GO:1990404) |
| 5.3 | 31.7 | GO:0003872 | 6-phosphofructokinase activity(GO:0003872) |
| 5.3 | 47.5 | GO:0015035 | protein disulfide oxidoreductase activity(GO:0015035) |
| 5.3 | 47.4 | GO:0046976 | histone methyltransferase activity (H3-K27 specific)(GO:0046976) |
| 5.3 | 15.8 | GO:0044549 | GTP cyclohydrolase binding(GO:0044549) |
| 5.2 | 105.0 | GO:0070064 | proline-rich region binding(GO:0070064) |
| 5.2 | 99.7 | GO:0023026 | MHC class II protein complex binding(GO:0023026) |
| 5.2 | 15.7 | GO:0071566 | UFM1 activating enzyme activity(GO:0071566) |
| 5.2 | 15.6 | GO:0008330 | protein tyrosine/threonine phosphatase activity(GO:0008330) |
| 5.2 | 26.0 | GO:0016509 | long-chain-3-hydroxyacyl-CoA dehydrogenase activity(GO:0016509) |
| 5.2 | 93.3 | GO:0097602 | cullin family protein binding(GO:0097602) |
| 5.2 | 31.1 | GO:0036310 | annealing helicase activity(GO:0036310) |
| 5.2 | 36.2 | GO:0008379 | thioredoxin peroxidase activity(GO:0008379) |
| 5.2 | 82.4 | GO:0043422 | protein kinase B binding(GO:0043422) |
| 5.1 | 138.4 | GO:0005001 | transmembrane receptor protein tyrosine phosphatase activity(GO:0005001) transmembrane receptor protein phosphatase activity(GO:0019198) |
| 5.1 | 20.5 | GO:0042500 | aspartic endopeptidase activity, intramembrane cleaving(GO:0042500) |
| 5.1 | 15.3 | GO:0005457 | GDP-fucose transmembrane transporter activity(GO:0005457) purine nucleotide-sugar transmembrane transporter activity(GO:0036080) |
| 5.1 | 15.3 | GO:0030613 | oxidoreductase activity, acting on a sulfur group of donors, quinone or similar compound as acceptor(GO:0016672) oxidoreductase activity, acting on phosphorus or arsenic in donors(GO:0030613) oxidoreductase activity, acting on phosphorus or arsenic in donors, disulfide as acceptor(GO:0030614) glutathione dehydrogenase (ascorbate) activity(GO:0045174) methylarsonate reductase activity(GO:0050610) |
| 5.1 | 15.3 | GO:0003983 | UTP:glucose-1-phosphate uridylyltransferase activity(GO:0003983) UTP-monosaccharide-1-phosphate uridylyltransferase activity(GO:0051748) |
| 5.1 | 126.9 | GO:0005086 | ARF guanyl-nucleotide exchange factor activity(GO:0005086) |
| 5.0 | 40.4 | GO:0016721 | superoxide dismutase activity(GO:0004784) oxidoreductase activity, acting on superoxide radicals as acceptor(GO:0016721) |
| 5.0 | 15.1 | GO:0000990 | transcription factor activity, core RNA polymerase binding(GO:0000990) |
| 5.0 | 20.1 | GO:0050509 | N-acetylglucosaminyl-proteoglycan 4-beta-glucuronosyltransferase activity(GO:0050509) |
| 5.0 | 90.5 | GO:0031404 | chloride ion binding(GO:0031404) |
| 5.0 | 14.9 | GO:0071535 | RING-like zinc finger domain binding(GO:0071535) |
| 5.0 | 10.0 | GO:0005345 | purine nucleobase transmembrane transporter activity(GO:0005345) |
| 5.0 | 34.8 | GO:0004459 | lactate dehydrogenase activity(GO:0004457) L-lactate dehydrogenase activity(GO:0004459) |
| 4.9 | 9.8 | GO:0032552 | deoxyribonucleotide binding(GO:0032552) |
| 4.9 | 24.5 | GO:1990460 | leptin receptor binding(GO:1990460) |
| 4.9 | 24.5 | GO:0005384 | manganese ion transmembrane transporter activity(GO:0005384) |
| 4.9 | 39.1 | GO:0005375 | copper ion transmembrane transporter activity(GO:0005375) |
| 4.9 | 136.8 | GO:0000993 | RNA polymerase II core binding(GO:0000993) |
| 4.8 | 33.9 | GO:0001165 | RNA polymerase I upstream control element sequence-specific DNA binding(GO:0001165) |
| 4.8 | 101.6 | GO:0008242 | omega peptidase activity(GO:0008242) |
| 4.8 | 19.3 | GO:1990190 | peptide-glutamate-N-acetyltransferase activity(GO:1990190) |
| 4.8 | 19.1 | GO:0055077 | gap junction hemi-channel activity(GO:0055077) |
| 4.7 | 18.9 | GO:0003726 | double-stranded RNA adenosine deaminase activity(GO:0003726) |
| 4.7 | 542.1 | GO:0047485 | protein N-terminus binding(GO:0047485) |
| 4.7 | 47.1 | GO:0019534 | toxin transporter activity(GO:0019534) |
| 4.7 | 204.9 | GO:0004693 | cyclin-dependent protein serine/threonine kinase activity(GO:0004693) |
| 4.6 | 60.4 | GO:0031491 | nucleosome binding(GO:0031491) |
| 4.6 | 166.5 | GO:0003755 | peptidyl-prolyl cis-trans isomerase activity(GO:0003755) |
| 4.6 | 23.1 | GO:0030229 | very-low-density lipoprotein particle receptor activity(GO:0030229) |
| 4.6 | 13.8 | GO:0030628 | pre-mRNA 3'-splice site binding(GO:0030628) |
| 4.6 | 442.1 | GO:0008565 | protein transporter activity(GO:0008565) |
| 4.5 | 13.6 | GO:0004914 | interleukin-5 receptor activity(GO:0004914) |
| 4.5 | 35.6 | GO:0070878 | primary miRNA binding(GO:0070878) |
| 4.5 | 17.8 | GO:0004748 | ribonucleoside-diphosphate reductase activity, thioredoxin disulfide as acceptor(GO:0004748) oxidoreductase activity, acting on CH or CH2 groups, disulfide as acceptor(GO:0016728) ribonucleoside-diphosphate reductase activity(GO:0061731) |
| 4.4 | 44.3 | GO:0048156 | tau protein binding(GO:0048156) |
| 4.4 | 79.1 | GO:0017049 | GTP-Rho binding(GO:0017049) |
| 4.4 | 21.8 | GO:0043138 | 3'-5' DNA helicase activity(GO:0043138) |
| 4.4 | 43.5 | GO:0004022 | alcohol dehydrogenase (NAD) activity(GO:0004022) |
| 4.4 | 95.8 | GO:0036002 | pre-mRNA binding(GO:0036002) |
| 4.3 | 8.7 | GO:0016857 | racemase and epimerase activity, acting on carbohydrates and derivatives(GO:0016857) |
| 4.3 | 56.5 | GO:0019992 | diacylglycerol binding(GO:0019992) |
| 4.3 | 90.8 | GO:0070006 | metalloaminopeptidase activity(GO:0070006) |
| 4.3 | 8.6 | GO:0070644 | vitamin D response element binding(GO:0070644) |
| 4.3 | 17.2 | GO:0008449 | N-acetylglucosamine-6-sulfatase activity(GO:0008449) |
| 4.3 | 21.5 | GO:0004839 | ubiquitin activating enzyme activity(GO:0004839) |
| 4.3 | 8.6 | GO:0004167 | dopachrome isomerase activity(GO:0004167) |
| 4.3 | 76.8 | GO:0010857 | calcium-dependent protein serine/threonine kinase activity(GO:0009931) calcium-dependent protein kinase activity(GO:0010857) |
| 4.3 | 208.5 | GO:0035064 | methylated histone binding(GO:0035064) |
| 4.2 | 12.7 | GO:0048030 | disaccharide binding(GO:0048030) |
| 4.2 | 8.4 | GO:0070326 | very-low-density lipoprotein particle receptor binding(GO:0070326) |
| 4.2 | 75.7 | GO:0008093 | cytoskeletal adaptor activity(GO:0008093) |
| 4.2 | 46.0 | GO:0050321 | tau-protein kinase activity(GO:0050321) |
| 4.2 | 8.3 | GO:0016774 | phosphotransferase activity, carboxyl group as acceptor(GO:0016774) |
| 4.2 | 12.5 | GO:0008534 | oxidized purine nucleobase lesion DNA N-glycosylase activity(GO:0008534) |
| 4.1 | 153.5 | GO:0005484 | SNAP receptor activity(GO:0005484) |
| 4.1 | 173.1 | GO:0019212 | phosphatase inhibitor activity(GO:0019212) |
| 4.1 | 102.8 | GO:0001106 | RNA polymerase II transcription corepressor activity(GO:0001106) |
| 4.1 | 57.1 | GO:0030228 | lipoprotein particle receptor activity(GO:0030228) |
| 4.0 | 28.0 | GO:0004849 | uridine kinase activity(GO:0004849) |
| 3.9 | 19.6 | GO:0004095 | carnitine O-palmitoyltransferase activity(GO:0004095) |
| 3.9 | 47.1 | GO:0003680 | AT DNA binding(GO:0003680) |
| 3.9 | 70.1 | GO:0004177 | aminopeptidase activity(GO:0004177) |
| 3.9 | 11.7 | GO:0004758 | serine C-palmitoyltransferase activity(GO:0004758) C-palmitoyltransferase activity(GO:0016454) |
| 3.9 | 7.7 | GO:0016314 | phosphatidylinositol-3,4,5-trisphosphate 3-phosphatase activity(GO:0016314) |
| 3.9 | 223.7 | GO:0003725 | double-stranded RNA binding(GO:0003725) |
| 3.8 | 26.7 | GO:0030274 | LIM domain binding(GO:0030274) |
| 3.8 | 11.3 | GO:0004958 | prostaglandin F receptor activity(GO:0004958) |
| 3.8 | 56.3 | GO:0016538 | cyclin-dependent protein serine/threonine kinase regulator activity(GO:0016538) |
| 3.7 | 7.5 | GO:0050211 | procollagen galactosyltransferase activity(GO:0050211) |
| 3.7 | 788.0 | GO:0051015 | actin filament binding(GO:0051015) |
| 3.7 | 22.3 | GO:0015187 | glycine transmembrane transporter activity(GO:0015187) |
| 3.7 | 22.1 | GO:0019238 | cyclohydrolase activity(GO:0019238) |
| 3.7 | 14.7 | GO:0034481 | chondroitin sulfotransferase activity(GO:0034481) |
| 3.7 | 14.7 | GO:0008190 | eukaryotic initiation factor 4E binding(GO:0008190) |
| 3.6 | 58.1 | GO:0004550 | nucleoside diphosphate kinase activity(GO:0004550) |
| 3.6 | 105.3 | GO:0005547 | phosphatidylinositol-3,4,5-trisphosphate binding(GO:0005547) |
| 3.6 | 3.6 | GO:0097001 | ceramide binding(GO:0097001) |
| 3.6 | 14.4 | GO:0004850 | uridine phosphorylase activity(GO:0004850) |
| 3.6 | 28.7 | GO:0003857 | 3-hydroxyacyl-CoA dehydrogenase activity(GO:0003857) |
| 3.6 | 10.8 | GO:0016603 | glutaminyl-peptide cyclotransferase activity(GO:0016603) |
| 3.6 | 39.5 | GO:0004726 | non-membrane spanning protein tyrosine phosphatase activity(GO:0004726) |
| 3.6 | 114.5 | GO:0030374 | ligand-dependent nuclear receptor transcription coactivator activity(GO:0030374) |
| 3.6 | 3.6 | GO:0005294 | neutral L-amino acid secondary active transmembrane transporter activity(GO:0005294) |
| 3.5 | 7.1 | GO:0010698 | acetyltransferase activator activity(GO:0010698) |
| 3.5 | 21.1 | GO:0008121 | ubiquinol-cytochrome-c reductase activity(GO:0008121) oxidoreductase activity, acting on diphenols and related substances as donors, cytochrome as acceptor(GO:0016681) |
| 3.5 | 96.9 | GO:1901505 | carbohydrate derivative transporter activity(GO:1901505) |
| 3.4 | 10.3 | GO:0050528 | acyloxyacyl hydrolase activity(GO:0050528) |
| 3.4 | 30.5 | GO:0008603 | cAMP-dependent protein kinase regulator activity(GO:0008603) |
| 3.4 | 10.1 | GO:0016495 | C-X3-C chemokine receptor activity(GO:0016495) |
| 3.4 | 57.2 | GO:0016814 | hydrolase activity, acting on carbon-nitrogen (but not peptide) bonds, in cyclic amidines(GO:0016814) |
| 3.3 | 9.9 | GO:0019834 | phospholipase A2 inhibitor activity(GO:0019834) |
| 3.3 | 88.6 | GO:0005540 | hyaluronic acid binding(GO:0005540) |
| 3.1 | 22.0 | GO:0001191 | transcriptional repressor activity, RNA polymerase II transcription factor binding(GO:0001191) |
| 3.1 | 25.1 | GO:0034594 | phosphatidylinositol-3,4,5-trisphosphate 5-phosphatase activity(GO:0034485) phosphatidylinositol trisphosphate phosphatase activity(GO:0034594) |
| 3.1 | 25.0 | GO:0004470 | malic enzyme activity(GO:0004470) |
| 3.1 | 3.1 | GO:0099609 | microtubule lateral binding(GO:0099609) |
| 3.1 | 12.4 | GO:0003938 | IMP dehydrogenase activity(GO:0003938) |
| 3.1 | 18.5 | GO:0010314 | phosphatidylinositol-5-phosphate binding(GO:0010314) |
| 3.1 | 27.7 | GO:0019213 | deacetylase activity(GO:0019213) |
| 3.0 | 33.4 | GO:0032395 | MHC class II receptor activity(GO:0032395) |
| 3.0 | 9.1 | GO:0045155 | electron transporter, transferring electrons from CoQH2-cytochrome c reductase complex and cytochrome c oxidase complex activity(GO:0045155) |
| 3.0 | 15.0 | GO:0003988 | acetyl-CoA C-acyltransferase activity(GO:0003988) |
| 3.0 | 77.7 | GO:0001965 | G-protein alpha-subunit binding(GO:0001965) |
| 3.0 | 50.7 | GO:0042974 | retinoic acid receptor binding(GO:0042974) |
| 3.0 | 20.9 | GO:0004920 | interleukin-10 receptor activity(GO:0004920) |
| 3.0 | 6.0 | GO:0005026 | transforming growth factor beta receptor activity, type II(GO:0005026) |
| 3.0 | 3197.5 | GO:0003723 | RNA binding(GO:0003723) |
| 3.0 | 67.9 | GO:0030296 | protein tyrosine kinase activator activity(GO:0030296) |
| 2.9 | 66.8 | GO:0017134 | fibroblast growth factor binding(GO:0017134) |
| 2.9 | 8.7 | GO:0047696 | beta-adrenergic receptor kinase activity(GO:0047696) |
| 2.8 | 2.8 | GO:0051185 | coenzyme transporter activity(GO:0051185) |
| 2.8 | 42.3 | GO:0004143 | diacylglycerol kinase activity(GO:0004143) |
| 2.8 | 11.3 | GO:0070051 | fibrinogen binding(GO:0070051) |
| 2.8 | 30.9 | GO:0004128 | cytochrome-b5 reductase activity, acting on NAD(P)H(GO:0004128) |
| 2.8 | 14.0 | GO:0032407 | mismatch repair complex binding(GO:0032404) MutSalpha complex binding(GO:0032407) |
| 2.7 | 8.2 | GO:0004796 | thromboxane-A synthase activity(GO:0004796) 12-hydroxyheptadecatrienoic acid synthase activity(GO:0036134) |
| 2.7 | 8.2 | GO:0004719 | protein-L-isoaspartate (D-aspartate) O-methyltransferase activity(GO:0004719) |
| 2.7 | 30.1 | GO:0016922 | ligand-dependent nuclear receptor binding(GO:0016922) |
| 2.7 | 26.9 | GO:0046527 | glucosyltransferase activity(GO:0046527) |
| 2.7 | 45.7 | GO:0036442 | hydrogen-exporting ATPase activity(GO:0036442) proton-transporting ATPase activity, rotational mechanism(GO:0046961) |
| 2.7 | 10.7 | GO:0008428 | ribonuclease inhibitor activity(GO:0008428) |
| 2.7 | 2.7 | GO:0034191 | apolipoprotein A-I receptor binding(GO:0034191) |
| 2.7 | 8.0 | GO:0016846 | carbon-sulfur lyase activity(GO:0016846) |
| 2.7 | 34.6 | GO:0098641 | cadherin binding involved in cell-cell adhesion(GO:0098641) |
| 2.6 | 68.5 | GO:0031210 | phosphatidylcholine binding(GO:0031210) |
| 2.6 | 36.3 | GO:0031957 | very long-chain fatty acid-CoA ligase activity(GO:0031957) |
| 2.6 | 18.1 | GO:0047894 | flavonol 3-sulfotransferase activity(GO:0047894) |
| 2.6 | 20.7 | GO:1990763 | arrestin family protein binding(GO:1990763) |
| 2.6 | 5.1 | GO:0015093 | ferrous iron transmembrane transporter activity(GO:0015093) |
| 2.5 | 38.2 | GO:0004653 | polypeptide N-acetylgalactosaminyltransferase activity(GO:0004653) |
| 2.5 | 12.7 | GO:0005134 | interleukin-2 receptor binding(GO:0005134) |
| 2.5 | 38.1 | GO:0000149 | SNARE binding(GO:0000149) |
| 2.5 | 5.0 | GO:0048406 | nerve growth factor binding(GO:0048406) |
| 2.5 | 66.6 | GO:0016675 | cytochrome-c oxidase activity(GO:0004129) heme-copper terminal oxidase activity(GO:0015002) oxidoreductase activity, acting on a heme group of donors(GO:0016675) oxidoreductase activity, acting on a heme group of donors, oxygen as acceptor(GO:0016676) |
| 2.4 | 55.8 | GO:0051879 | Hsp90 protein binding(GO:0051879) |
| 2.4 | 11.9 | GO:0051861 | glycolipid binding(GO:0051861) |
| 2.4 | 149.4 | GO:0016765 | transferase activity, transferring alkyl or aryl (other than methyl) groups(GO:0016765) |
| 2.3 | 83.5 | GO:0004198 | calcium-dependent cysteine-type endopeptidase activity(GO:0004198) |
| 2.3 | 6.9 | GO:0019981 | interleukin-6 receptor activity(GO:0004915) interleukin-6 binding(GO:0019981) |
| 2.3 | 6.9 | GO:0003953 | NAD+ nucleosidase activity(GO:0003953) NAD(P)+ nucleosidase activity(GO:0050135) |
| 2.3 | 27.4 | GO:0080025 | phosphatidylinositol-3,5-bisphosphate binding(GO:0080025) |
| 2.2 | 129.4 | GO:0051082 | unfolded protein binding(GO:0051082) |
| 2.2 | 15.6 | GO:0008094 | DNA-dependent ATPase activity(GO:0008094) |
| 2.2 | 15.6 | GO:0008454 | alpha-1,3-mannosylglycoprotein 4-beta-N-acetylglucosaminyltransferase activity(GO:0008454) |
| 2.2 | 24.3 | GO:0005131 | growth hormone receptor binding(GO:0005131) |
| 2.2 | 10.8 | GO:0032050 | clathrin heavy chain binding(GO:0032050) |
| 2.1 | 6.4 | GO:0099580 | ion antiporter activity involved in regulation of postsynaptic membrane potential(GO:0099580) |
| 2.1 | 40.3 | GO:0016500 | protein-hormone receptor activity(GO:0016500) |
| 2.1 | 100.7 | GO:0017080 | sodium channel regulator activity(GO:0017080) |
| 2.0 | 4.0 | GO:0001849 | complement component C1q binding(GO:0001849) |
| 2.0 | 5.9 | GO:0030377 | urokinase plasminogen activator receptor activity(GO:0030377) |
| 1.9 | 5.8 | GO:0030366 | molybdopterin synthase activity(GO:0030366) |
| 1.9 | 11.5 | GO:0015288 | porin activity(GO:0015288) |
| 1.9 | 32.3 | GO:0008349 | MAP kinase kinase kinase kinase activity(GO:0008349) |
| 1.9 | 13.1 | GO:0034237 | protein kinase A regulatory subunit binding(GO:0034237) |
| 1.9 | 9.4 | GO:0019863 | IgE binding(GO:0019863) |
| 1.9 | 20.6 | GO:0016413 | O-acetyltransferase activity(GO:0016413) |
| 1.8 | 71.1 | GO:0005164 | tumor necrosis factor receptor binding(GO:0005164) |
| 1.8 | 5.5 | GO:0033149 | FFAT motif binding(GO:0033149) |
| 1.8 | 5.5 | GO:0048248 | CXCR3 chemokine receptor binding(GO:0048248) |
| 1.8 | 14.5 | GO:0035325 | Toll-like receptor binding(GO:0035325) |
| 1.8 | 9.0 | GO:0004485 | methylcrotonoyl-CoA carboxylase activity(GO:0004485) |
| 1.8 | 3.6 | GO:0016417 | S-acyltransferase activity(GO:0016417) |
| 1.8 | 7.2 | GO:0016888 | endodeoxyribonuclease activity, producing 5'-phosphomonoesters(GO:0016888) |
| 1.8 | 10.8 | GO:0001875 | lipopolysaccharide receptor activity(GO:0001875) |
| 1.8 | 1.8 | GO:0048185 | activin binding(GO:0048185) |
| 1.8 | 28.7 | GO:0048365 | Rac GTPase binding(GO:0048365) |
| 1.8 | 12.4 | GO:0004180 | carboxypeptidase activity(GO:0004180) |
| 1.8 | 12.3 | GO:0015186 | L-glutamine transmembrane transporter activity(GO:0015186) |
| 1.7 | 5.1 | GO:0030226 | apolipoprotein receptor activity(GO:0030226) apolipoprotein A-I receptor activity(GO:0034188) phosphatidylserine-translocating ATPase activity(GO:0090556) |
| 1.7 | 8.5 | GO:0043325 | phosphatidylinositol-3,4-bisphosphate binding(GO:0043325) |
| 1.7 | 20.2 | GO:0033130 | acetylcholine receptor binding(GO:0033130) |
| 1.7 | 5.0 | GO:0017169 | CDP-alcohol phosphatidyltransferase activity(GO:0017169) |
| 1.7 | 25.1 | GO:0042605 | peptide antigen binding(GO:0042605) |
| 1.7 | 5.0 | GO:0008532 | N-acetyllactosaminide beta-1,3-N-acetylglucosaminyltransferase activity(GO:0008532) |
| 1.6 | 6.5 | GO:0000182 | rDNA binding(GO:0000182) |
| 1.6 | 222.3 | GO:0005178 | integrin binding(GO:0005178) |
| 1.6 | 8.0 | GO:0070840 | dynein complex binding(GO:0070840) |
| 1.6 | 8.0 | GO:0034452 | dynactin binding(GO:0034452) |
| 1.6 | 4.7 | GO:0016286 | small conductance calcium-activated potassium channel activity(GO:0016286) |
| 1.6 | 4.7 | GO:0003829 | beta-1,3-galactosyl-O-glycosyl-glycoprotein beta-1,6-N-acetylglucosaminyltransferase activity(GO:0003829) |
| 1.6 | 9.3 | GO:0008046 | axon guidance receptor activity(GO:0008046) |
| 1.5 | 3.1 | GO:0010340 | carboxyl-O-methyltransferase activity(GO:0010340) protein carboxyl O-methyltransferase activity(GO:0051998) |
| 1.5 | 9.2 | GO:0030368 | interleukin-17 receptor activity(GO:0030368) |
| 1.5 | 6.1 | GO:0001047 | core promoter binding(GO:0001047) |
| 1.5 | 33.2 | GO:0008235 | metalloexopeptidase activity(GO:0008235) |
| 1.5 | 80.0 | GO:0042393 | histone binding(GO:0042393) |
| 1.5 | 25.2 | GO:0005546 | phosphatidylinositol-4,5-bisphosphate binding(GO:0005546) |
| 1.5 | 2.9 | GO:0047006 | 17-alpha,20-alpha-dihydroxypregn-4-en-3-one dehydrogenase activity(GO:0047006) |
| 1.5 | 2.9 | GO:0043812 | phosphatidylinositol-4-phosphate phosphatase activity(GO:0043812) |
| 1.4 | 13.0 | GO:0043560 | insulin receptor substrate binding(GO:0043560) |
| 1.4 | 76.7 | GO:0000979 | RNA polymerase II core promoter sequence-specific DNA binding(GO:0000979) |
| 1.4 | 11.5 | GO:0016724 | ferroxidase activity(GO:0004322) oxidoreductase activity, oxidizing metal ions, oxygen as acceptor(GO:0016724) |
| 1.4 | 18.6 | GO:0008536 | Ran GTPase binding(GO:0008536) |
| 1.4 | 8.6 | GO:0035800 | deubiquitinase activator activity(GO:0035800) |
| 1.4 | 11.4 | GO:0045236 | CXCR chemokine receptor binding(GO:0045236) |
| 1.4 | 59.7 | GO:0008276 | protein methyltransferase activity(GO:0008276) |
| 1.4 | 7.0 | GO:0047820 | D-glutamate cyclase activity(GO:0047820) |
| 1.4 | 5.6 | GO:0043515 | kinetochore binding(GO:0043515) |
| 1.4 | 5.5 | GO:0047023 | androsterone dehydrogenase activity(GO:0047023) indanol dehydrogenase activity(GO:0047718) |
| 1.4 | 20.8 | GO:0004602 | glutathione peroxidase activity(GO:0004602) |
| 1.4 | 4.1 | GO:0000253 | 3-keto sterol reductase activity(GO:0000253) |
| 1.4 | 13.5 | GO:0015174 | basic amino acid transmembrane transporter activity(GO:0015174) |
| 1.3 | 4.0 | GO:0030898 | actin-dependent ATPase activity(GO:0030898) |
| 1.3 | 9.2 | GO:0070403 | NAD+ binding(GO:0070403) |
| 1.3 | 11.7 | GO:0043225 | anion transmembrane-transporting ATPase activity(GO:0043225) |
| 1.3 | 14.2 | GO:0033038 | bitter taste receptor activity(GO:0033038) |
| 1.3 | 12.8 | GO:0005225 | volume-sensitive anion channel activity(GO:0005225) |
| 1.3 | 25.5 | GO:0042813 | Wnt-activated receptor activity(GO:0042813) |
| 1.3 | 17.8 | GO:0004185 | serine-type carboxypeptidase activity(GO:0004185) |
| 1.3 | 1.3 | GO:0034186 | apolipoprotein A-I binding(GO:0034186) |
| 1.3 | 3.8 | GO:0004972 | NMDA glutamate receptor activity(GO:0004972) |
| 1.2 | 9.8 | GO:0016176 | superoxide-generating NADPH oxidase activator activity(GO:0016176) |
| 1.2 | 3.7 | GO:0003976 | UDP-N-acetylglucosamine-lysosomal-enzyme N-acetylglucosaminephosphotransferase activity(GO:0003976) |
| 1.2 | 3.7 | GO:0023023 | MHC protein complex binding(GO:0023023) |
| 1.2 | 256.4 | GO:0003924 | GTPase activity(GO:0003924) |
| 1.2 | 7.1 | GO:0001227 | transcriptional repressor activity, RNA polymerase II transcription regulatory region sequence-specific binding(GO:0001227) |
| 1.2 | 5.9 | GO:0004771 | sterol esterase activity(GO:0004771) |
| 1.2 | 86.5 | GO:0003777 | microtubule motor activity(GO:0003777) |
| 1.2 | 2.3 | GO:0052810 | 1-phosphatidylinositol-5-kinase activity(GO:0052810) |
| 1.2 | 5.8 | GO:0010465 | nerve growth factor receptor activity(GO:0010465) |
| 1.2 | 2.3 | GO:0050501 | hyaluronan synthase activity(GO:0050501) |
| 1.2 | 10.4 | GO:0004985 | opioid receptor activity(GO:0004985) |
| 1.2 | 57.8 | GO:0034987 | immunoglobulin receptor binding(GO:0034987) |
| 1.1 | 6.6 | GO:0039552 | RIG-I binding(GO:0039552) |
| 1.1 | 6.6 | GO:0050291 | sphingosine N-acyltransferase activity(GO:0050291) |
| 1.1 | 14.2 | GO:0008503 | benzodiazepine receptor activity(GO:0008503) |
| 1.1 | 3.3 | GO:0031731 | CCR6 chemokine receptor binding(GO:0031731) |
| 1.1 | 14.1 | GO:0051059 | NF-kappaB binding(GO:0051059) |
| 1.1 | 4.3 | GO:0004739 | pyruvate dehydrogenase (acetyl-transferring) activity(GO:0004739) |
| 1.1 | 8.5 | GO:0016861 | intramolecular oxidoreductase activity, interconverting aldoses and ketoses(GO:0016861) |
| 1.1 | 3.2 | GO:0004379 | glycylpeptide N-tetradecanoyltransferase activity(GO:0004379) myristoyltransferase activity(GO:0019107) |
| 1.1 | 3.2 | GO:0005000 | vasopressin receptor activity(GO:0005000) |
| 1.0 | 2.1 | GO:0015321 | sodium-dependent phosphate transmembrane transporter activity(GO:0015321) |
| 1.0 | 4.2 | GO:0031208 | POZ domain binding(GO:0031208) |
| 1.0 | 4.2 | GO:0016499 | orexin receptor activity(GO:0016499) |
| 1.0 | 6.2 | GO:0035374 | chondroitin sulfate binding(GO:0035374) |
| 1.0 | 19.7 | GO:0003841 | 1-acylglycerol-3-phosphate O-acyltransferase activity(GO:0003841) lysophosphatidic acid acyltransferase activity(GO:0042171) lysophospholipid acyltransferase activity(GO:0071617) |
| 1.0 | 50.8 | GO:0004712 | protein serine/threonine/tyrosine kinase activity(GO:0004712) |
| 1.0 | 39.1 | GO:0005507 | copper ion binding(GO:0005507) |
| 1.0 | 10.2 | GO:0005068 | transmembrane receptor protein tyrosine kinase adaptor activity(GO:0005068) |
| 1.0 | 4.1 | GO:0000822 | inositol hexakisphosphate binding(GO:0000822) |
| 1.0 | 14.2 | GO:0030280 | structural constituent of epidermis(GO:0030280) |
| 1.0 | 7.1 | GO:0043426 | MRF binding(GO:0043426) |
| 1.0 | 63.2 | GO:0016811 | hydrolase activity, acting on carbon-nitrogen (but not peptide) bonds, in linear amides(GO:0016811) |
| 1.0 | 2.9 | GO:0004465 | lipoprotein lipase activity(GO:0004465) |
| 1.0 | 3.8 | GO:0004647 | phosphoserine phosphatase activity(GO:0004647) |
| 0.9 | 3.8 | GO:0008420 | CTD phosphatase activity(GO:0008420) |
| 0.9 | 3.6 | GO:0017018 | myosin phosphatase activity(GO:0017018) |
| 0.9 | 18.8 | GO:0031434 | mitogen-activated protein kinase kinase binding(GO:0031434) |
| 0.9 | 1.8 | GO:0001163 | RNA polymerase I regulatory region DNA binding(GO:0001013) RNA polymerase I regulatory region sequence-specific DNA binding(GO:0001163) RNA polymerase I CORE element sequence-specific DNA binding(GO:0001164) |
| 0.9 | 15.1 | GO:0071889 | 14-3-3 protein binding(GO:0071889) |
| 0.9 | 2.6 | GO:0001665 | alpha-N-acetylgalactosaminide alpha-2,6-sialyltransferase activity(GO:0001665) |
| 0.9 | 10.6 | GO:0008329 | signaling pattern recognition receptor activity(GO:0008329) pattern recognition receptor activity(GO:0038187) |
| 0.8 | 1.7 | GO:0043532 | angiostatin binding(GO:0043532) |
| 0.8 | 5.6 | GO:0016929 | SUMO-specific protease activity(GO:0016929) |
| 0.8 | 48.8 | GO:0032947 | protein complex scaffold(GO:0032947) |
| 0.8 | 2.4 | GO:0043559 | insulin binding(GO:0043559) |
| 0.8 | 18.8 | GO:0005154 | epidermal growth factor receptor binding(GO:0005154) |
| 0.8 | 9.3 | GO:0016723 | oxidoreductase activity, oxidizing metal ions, NAD or NADP as acceptor(GO:0016723) |
| 0.8 | 17.0 | GO:0001102 | RNA polymerase II activating transcription factor binding(GO:0001102) |
| 0.8 | 22.8 | GO:0002039 | p53 binding(GO:0002039) |
| 0.7 | 0.7 | GO:0004521 | endoribonuclease activity(GO:0004521) |
| 0.7 | 5.7 | GO:0004340 | glucokinase activity(GO:0004340) hexokinase activity(GO:0004396) fructokinase activity(GO:0008865) mannokinase activity(GO:0019158) |
| 0.7 | 6.4 | GO:0001608 | G-protein coupled nucleotide receptor activity(GO:0001608) purinergic nucleotide receptor activity(GO:0001614) nucleotide receptor activity(GO:0016502) G-protein coupled purinergic nucleotide receptor activity(GO:0045028) |
| 0.7 | 15.4 | GO:0042169 | SH2 domain binding(GO:0042169) |
| 0.7 | 12.6 | GO:0050811 | GABA receptor binding(GO:0050811) |
| 0.7 | 170.1 | GO:0008236 | serine-type peptidase activity(GO:0008236) |
| 0.7 | 2.0 | GO:0098821 | BMP receptor activity(GO:0098821) |
| 0.7 | 3.3 | GO:0052650 | NADP-retinol dehydrogenase activity(GO:0052650) |
| 0.7 | 16.0 | GO:0015078 | hydrogen ion transmembrane transporter activity(GO:0015078) |
| 0.7 | 5.3 | GO:0035256 | G-protein coupled glutamate receptor binding(GO:0035256) |
| 0.7 | 1.3 | GO:0030158 | protein xylosyltransferase activity(GO:0030158) |
| 0.6 | 7.7 | GO:0051721 | protein phosphatase 2A binding(GO:0051721) |
| 0.6 | 1.9 | GO:0004392 | heme oxygenase (decyclizing) activity(GO:0004392) |
| 0.6 | 6.2 | GO:0017017 | MAP kinase tyrosine/serine/threonine phosphatase activity(GO:0017017) |
| 0.6 | 1.9 | GO:0004609 | phosphatidylserine decarboxylase activity(GO:0004609) |
| 0.6 | 1.8 | GO:0035259 | glucocorticoid receptor binding(GO:0035259) |
| 0.6 | 8.4 | GO:0051087 | chaperone binding(GO:0051087) |
| 0.6 | 1.8 | GO:0003858 | 3-hydroxybutyrate dehydrogenase activity(GO:0003858) |
| 0.6 | 1.2 | GO:0016886 | DNA ligase activity(GO:0003909) DNA ligase (ATP) activity(GO:0003910) ligase activity, forming phosphoric ester bonds(GO:0016886) |
| 0.6 | 4.7 | GO:0042731 | PH domain binding(GO:0042731) |
| 0.6 | 10.5 | GO:0051117 | ATPase binding(GO:0051117) |
| 0.6 | 10.9 | GO:0004033 | aldo-keto reductase (NADP) activity(GO:0004033) |
| 0.6 | 2.2 | GO:0016823 | hydrolase activity, acting on acid carbon-carbon bonds(GO:0016822) hydrolase activity, acting on acid carbon-carbon bonds, in ketonic substances(GO:0016823) |
| 0.6 | 1.7 | GO:0004603 | phenylethanolamine N-methyltransferase activity(GO:0004603) |
| 0.5 | 2.2 | GO:0032190 | acrosin binding(GO:0032190) |
| 0.5 | 4.2 | GO:0016493 | C-C chemokine receptor activity(GO:0016493) |
| 0.5 | 8.9 | GO:0005385 | zinc ion transmembrane transporter activity(GO:0005385) |
| 0.5 | 2.1 | GO:0004467 | long-chain fatty acid-CoA ligase activity(GO:0004467) |
| 0.5 | 2.0 | GO:0005381 | iron ion transmembrane transporter activity(GO:0005381) |
| 0.5 | 3.0 | GO:0045029 | UDP-activated nucleotide receptor activity(GO:0045029) |
| 0.5 | 1.0 | GO:0016300 | tRNA (uracil) methyltransferase activity(GO:0016300) |
| 0.5 | 1.9 | GO:0070915 | lysophosphatidic acid receptor activity(GO:0070915) |
| 0.5 | 1.9 | GO:0051864 | histone demethylase activity (H3-K36 specific)(GO:0051864) |
| 0.5 | 1.9 | GO:0008518 | reduced folate carrier activity(GO:0008518) methotrexate transporter activity(GO:0015350) |
| 0.5 | 1.4 | GO:0042289 | MHC class II protein binding(GO:0042289) |
| 0.5 | 0.5 | GO:0097027 | ligase regulator activity(GO:0055103) ubiquitin-protein transferase regulator activity(GO:0055106) ubiquitin-protein transferase activator activity(GO:0097027) |
| 0.4 | 1.8 | GO:0004666 | prostaglandin-endoperoxide synthase activity(GO:0004666) |
| 0.4 | 6.1 | GO:0019864 | IgG binding(GO:0019864) |
| 0.4 | 3.0 | GO:0008199 | ferric iron binding(GO:0008199) |
| 0.4 | 2.2 | GO:0052740 | 1-acyl-2-lysophosphatidylserine acylhydrolase activity(GO:0052740) |
| 0.4 | 1.7 | GO:0005127 | ciliary neurotrophic factor receptor binding(GO:0005127) |
| 0.4 | 5.0 | GO:0031072 | heat shock protein binding(GO:0031072) |
| 0.4 | 4.4 | GO:0030295 | protein kinase activator activity(GO:0030295) |
| 0.4 | 2.0 | GO:0097493 | structural molecule activity conferring elasticity(GO:0097493) |
| 0.4 | 2.7 | GO:0030345 | extracellular matrix structural constituent conferring compression resistance(GO:0030021) structural constituent of tooth enamel(GO:0030345) |
| 0.4 | 2.3 | GO:0005518 | collagen binding(GO:0005518) |
| 0.4 | 1.4 | GO:0004522 | ribonuclease A activity(GO:0004522) |
| 0.3 | 9.8 | GO:0004702 | receptor signaling protein serine/threonine kinase activity(GO:0004702) |
| 0.3 | 6.6 | GO:0017075 | syntaxin-1 binding(GO:0017075) |
| 0.3 | 3.8 | GO:0015379 | potassium:chloride symporter activity(GO:0015379) potassium ion symporter activity(GO:0022820) |
| 0.3 | 2.4 | GO:0042834 | peptidoglycan binding(GO:0042834) |
| 0.3 | 2.0 | GO:0003945 | N-acetyllactosamine synthase activity(GO:0003945) |
| 0.3 | 6.4 | GO:0008191 | metalloendopeptidase inhibitor activity(GO:0008191) |
| 0.3 | 101.7 | GO:0019900 | kinase binding(GO:0019900) |
| 0.3 | 29.7 | GO:0004867 | serine-type endopeptidase inhibitor activity(GO:0004867) |
| 0.3 | 8.9 | GO:0015485 | cholesterol binding(GO:0015485) |
| 0.3 | 0.9 | GO:0004331 | 6-phosphofructo-2-kinase activity(GO:0003873) fructose-2,6-bisphosphate 2-phosphatase activity(GO:0004331) |
| 0.3 | 2.3 | GO:0008172 | S-methyltransferase activity(GO:0008172) |
| 0.3 | 2.7 | GO:0016755 | transferase activity, transferring amino-acyl groups(GO:0016755) |
| 0.3 | 1.1 | GO:0004966 | galanin receptor activity(GO:0004966) |
| 0.3 | 10.5 | GO:0009055 | electron carrier activity(GO:0009055) |
| 0.3 | 1.0 | GO:0045295 | gamma-catenin binding(GO:0045295) |
| 0.3 | 1.5 | GO:0004084 | branched-chain-amino-acid transaminase activity(GO:0004084) L-leucine transaminase activity(GO:0052654) L-valine transaminase activity(GO:0052655) L-isoleucine transaminase activity(GO:0052656) |
| 0.2 | 3.9 | GO:0003950 | NAD+ ADP-ribosyltransferase activity(GO:0003950) |
| 0.2 | 0.7 | GO:0003883 | CTP synthase activity(GO:0003883) |
| 0.2 | 2.6 | GO:0042043 | neurexin family protein binding(GO:0042043) |
| 0.2 | 4.9 | GO:0019956 | chemokine binding(GO:0019956) |
| 0.2 | 0.4 | GO:0016909 | JUN kinase activity(GO:0004705) SAP kinase activity(GO:0016909) |
| 0.2 | 3.3 | GO:0001786 | phosphatidylserine binding(GO:0001786) |
| 0.2 | 27.8 | GO:0030246 | carbohydrate binding(GO:0030246) |
| 0.2 | 1.2 | GO:0015250 | water channel activity(GO:0015250) |
| 0.2 | 5.6 | GO:0004715 | non-membrane spanning protein tyrosine kinase activity(GO:0004715) |
| 0.2 | 4.2 | GO:0003774 | motor activity(GO:0003774) |
| 0.2 | 60.3 | GO:0003712 | transcription cofactor activity(GO:0003712) |
| 0.2 | 1.0 | GO:0015166 | polyol transmembrane transporter activity(GO:0015166) |
| 0.2 | 1.3 | GO:0044213 | intronic transcription regulatory region sequence-specific DNA binding(GO:0001161) intronic transcription regulatory region DNA binding(GO:0044213) |
| 0.2 | 1.4 | GO:0035381 | extracellular ATP-gated cation channel activity(GO:0004931) ATP-gated ion channel activity(GO:0035381) |
| 0.2 | 0.9 | GO:0038085 | vascular endothelial growth factor binding(GO:0038085) |
| 0.2 | 1.2 | GO:0042923 | neuropeptide binding(GO:0042923) |
| 0.1 | 0.7 | GO:1990841 | promoter-specific chromatin binding(GO:1990841) |
| 0.1 | 3.7 | GO:0043621 | protein self-association(GO:0043621) |
| 0.1 | 2.0 | GO:0043015 | gamma-tubulin binding(GO:0043015) |
| 0.1 | 3.0 | GO:0030276 | clathrin binding(GO:0030276) |
| 0.1 | 10.7 | GO:0005262 | calcium channel activity(GO:0005262) |
| 0.1 | 13.5 | GO:0031625 | ubiquitin protein ligase binding(GO:0031625) |
| 0.1 | 1.8 | GO:0042805 | actinin binding(GO:0042805) |
| 0.1 | 0.6 | GO:0015020 | glucuronosyltransferase activity(GO:0015020) |
| 0.1 | 0.5 | GO:0008301 | DNA binding, bending(GO:0008301) |
| 0.1 | 1.6 | GO:0008510 | sodium:bicarbonate symporter activity(GO:0008510) |
| 0.1 | 1.1 | GO:0016836 | hydro-lyase activity(GO:0016836) |
| 0.1 | 2.1 | GO:0004674 | protein serine/threonine kinase activity(GO:0004674) |
| 0.1 | 0.1 | GO:0005324 | long-chain fatty acid transporter activity(GO:0005324) |
| 0.1 | 0.3 | GO:0015232 | heme transporter activity(GO:0015232) |
| 0.1 | 0.2 | GO:0004596 | peptide alpha-N-acetyltransferase activity(GO:0004596) |
| 0.1 | 0.4 | GO:0016167 | glial cell-derived neurotrophic factor receptor activity(GO:0016167) |
| 0.0 | 0.5 | GO:0008140 | cAMP response element binding protein binding(GO:0008140) |
| 0.0 | 0.5 | GO:0004767 | sphingomyelin phosphodiesterase activity(GO:0004767) |
| 0.0 | 0.8 | GO:0048306 | calcium-dependent protein binding(GO:0048306) |
| 0.0 | 0.7 | GO:0005523 | tropomyosin binding(GO:0005523) |
| 0.0 | 0.8 | GO:0097110 | scaffold protein binding(GO:0097110) |
| 0.0 | 1.9 | GO:0004722 | protein serine/threonine phosphatase activity(GO:0004722) |
| 0.0 | 0.2 | GO:0017048 | Rho GTPase binding(GO:0017048) |
| 0.0 | 0.1 | GO:0004955 | prostaglandin receptor activity(GO:0004955) |
| 0.0 | 0.2 | GO:0001078 | transcriptional repressor activity, RNA polymerase II core promoter proximal region sequence-specific binding(GO:0001078) |
Gene overrepresentation in C2:CP category:
| Log-likelihood per target | Total log-likelihood | Term | Description |
|---|---|---|---|
| 14.7 | 132.5 | SA G2 AND M PHASES | Cdc25 activates the cdc2/cyclin B complex to induce the G2/M transition. |
| 13.9 | 582.6 | PID NFKAPPAB CANONICAL PATHWAY | Canonical NF-kappaB pathway |
| 12.8 | 38.5 | PID TRAIL PATHWAY | TRAIL signaling pathway |
| 11.7 | 349.9 | SA FAS SIGNALING | The TNF-type receptor Fas induces apoptosis on ligand binding. |
| 11.1 | 321.3 | PID ARF6 DOWNSTREAM PATHWAY | Arf6 downstream pathway |
| 10.4 | 855.8 | PID RAC1 PATHWAY | RAC1 signaling pathway |
| 10.0 | 658.4 | PID ATR PATHWAY | ATR signaling pathway |
| 9.8 | 9.8 | PID S1P S1P1 PATHWAY | S1P1 pathway |
| 8.3 | 698.3 | PID CD8 TCR PATHWAY | TCR signaling in naïve CD8+ T cells |
| 8.1 | 32.5 | SIG IL4RECEPTOR IN B LYPHOCYTES | Genes related to IL4 rceptor signaling in B lymphocytes |
| 8.1 | 226.0 | PID DNA PK PATHWAY | DNA-PK pathway in nonhomologous end joining |
| 8.0 | 393.2 | PID INTEGRIN2 PATHWAY | Beta2 integrin cell surface interactions |
| 7.8 | 209.3 | PID TOLL ENDOGENOUS PATHWAY | Endogenous TLR signaling |
| 7.7 | 478.4 | PID AURORA B PATHWAY | Aurora B signaling |
| 7.3 | 7.3 | ST GRANULE CELL SURVIVAL PATHWAY | Granule Cell Survival Pathway is a specific case of more general PAC1 Receptor Pathway. |
| 7.0 | 105.3 | PID LYMPH ANGIOGENESIS PATHWAY | VEGFR3 signaling in lymphatic endothelium |
| 7.0 | 7.0 | PID ECADHERIN NASCENT AJ PATHWAY | E-cadherin signaling in the nascent adherens junction |
| 6.8 | 68.5 | PID PRL SIGNALING EVENTS PATHWAY | Signaling events mediated by PRL |
| 6.7 | 517.6 | PID ILK PATHWAY | Integrin-linked kinase signaling |
| 6.6 | 629.8 | PID E2F PATHWAY | E2F transcription factor network |
| 6.6 | 488.1 | PID P53 REGULATION PATHWAY | p53 pathway |
| 6.4 | 238.2 | PID FOXM1 PATHWAY | FOXM1 transcription factor network |
| 6.4 | 255.8 | PID PLK1 PATHWAY | PLK1 signaling events |
| 6.1 | 201.2 | PID P38 ALPHA BETA PATHWAY | Regulation of p38-alpha and p38-beta |
| 6.0 | 366.1 | SIG INSULIN RECEPTOR PATHWAY IN CARDIAC MYOCYTES | Genes related to the insulin receptor pathway |
| 5.9 | 35.1 | SA G1 AND S PHASES | Cdk2, 4, and 6 bind cyclin D in G1, while cdk2/cyclin E promotes the G1/S transition. |
| 5.8 | 58.2 | ST IL 13 PATHWAY | Interleukin 13 (IL-13) Pathway |
| 5.8 | 219.4 | PID ALK1 PATHWAY | ALK1 signaling events |
| 5.4 | 185.3 | PID HIF1A PATHWAY | Hypoxic and oxygen homeostasis regulation of HIF-1-alpha |
| 5.3 | 112.2 | PID ARF 3PATHWAY | Arf1 pathway |
| 5.2 | 20.7 | ST PHOSPHOINOSITIDE 3 KINASE PATHWAY | PI3K Pathway |
| 4.8 | 154.7 | PID SYNDECAN 2 PATHWAY | Syndecan-2-mediated signaling events |
| 4.6 | 91.6 | PID ERB GENOMIC PATHWAY | Validated nuclear estrogen receptor beta network |
| 4.5 | 8.9 | PID EPHA2 FWD PATHWAY | EPHA2 forward signaling |
| 4.4 | 440.6 | PID MYC ACTIV PATHWAY | Validated targets of C-MYC transcriptional activation |
| 4.3 | 95.6 | PID SMAD2 3PATHWAY | Regulation of cytoplasmic and nuclear SMAD2/3 signaling |
| 3.9 | 147.4 | PID TNF PATHWAY | TNF receptor signaling pathway |
| 3.8 | 19.2 | PID ERBB4 PATHWAY | ErbB4 signaling events |
| 3.8 | 95.6 | PID TCR PATHWAY | TCR signaling in naïve CD4+ T cells |
| 3.8 | 176.6 | PID IL6 7 PATHWAY | IL6-mediated signaling events |
| 3.8 | 108.9 | PID LIS1 PATHWAY | Lissencephaly gene (LIS1) in neuronal migration and development |
| 3.7 | 66.9 | PID AURORA A PATHWAY | Aurora A signaling |
| 3.5 | 60.0 | PID INSULIN GLUCOSE PATHWAY | Insulin-mediated glucose transport |
| 3.3 | 16.6 | ST INTERLEUKIN 4 PATHWAY | Interleukin 4 (IL-4) Pathway |
| 3.3 | 32.9 | PID ATM PATHWAY | ATM pathway |
| 3.2 | 95.7 | PID HIF2PATHWAY | HIF-2-alpha transcription factor network |
| 3.1 | 132.3 | PID PS1 PATHWAY | Presenilin action in Notch and Wnt signaling |
| 3.1 | 75.0 | PID IL1 PATHWAY | IL1-mediated signaling events |
| 3.1 | 3.1 | PID TCR JNK PATHWAY | JNK signaling in the CD4+ TCR pathway |
| 3.0 | 71.9 | PID THROMBIN PAR1 PATHWAY | PAR1-mediated thrombin signaling events |
| 2.9 | 34.9 | PID S1P S1P4 PATHWAY | S1P4 pathway |
| 2.8 | 68.2 | SIG PIP3 SIGNALING IN B LYMPHOCYTES | Genes related to PIP3 signaling in B lymphocytes |
| 2.8 | 33.6 | PID MAPK TRK PATHWAY | Trk receptor signaling mediated by the MAPK pathway |
| 2.7 | 44.0 | PID CD40 PATHWAY | CD40/CD40L signaling |
| 2.6 | 49.4 | PID IFNG PATHWAY | IFN-gamma pathway |
| 2.6 | 124.1 | PID SYNDECAN 1 PATHWAY | Syndecan-1-mediated signaling events |
| 2.6 | 63.9 | PID IL8 CXCR2 PATHWAY | IL8- and CXCR2-mediated signaling events |
| 2.5 | 17.6 | PID WNT SIGNALING PATHWAY | Wnt signaling network |
| 2.5 | 211.4 | PID CMYB PATHWAY | C-MYB transcription factor network |
| 2.4 | 76.9 | PID ERBB1 DOWNSTREAM PATHWAY | ErbB1 downstream signaling |
| 2.4 | 43.2 | PID INSULIN PATHWAY | Insulin Pathway |
| 2.4 | 343.1 | PID P53 DOWNSTREAM PATHWAY | Direct p53 effectors |
| 2.3 | 161.9 | WNT SIGNALING | Genes related to Wnt-mediated signal transduction |
| 2.3 | 78.3 | PID P38 ALPHA BETA DOWNSTREAM PATHWAY | Signaling mediated by p38-alpha and p38-beta |
| 2.3 | 126.4 | PID HNF3A PATHWAY | FOXA1 transcription factor network |
| 2.3 | 18.0 | PID IL2 PI3K PATHWAY | IL2 signaling events mediated by PI3K |
| 2.2 | 20.0 | PID MET PATHWAY | Signaling events mediated by Hepatocyte Growth Factor Receptor (c-Met) |
| 2.2 | 13.3 | PID FAS PATHWAY | FAS (CD95) signaling pathway |
| 2.0 | 14.3 | ST JNK MAPK PATHWAY | JNK MAPK Pathway |
| 2.0 | 69.0 | PID FCER1 PATHWAY | Fc-epsilon receptor I signaling in mast cells |
| 1.9 | 23.3 | PID IL3 PATHWAY | IL3-mediated signaling events |
| 1.8 | 11.0 | ST G ALPHA S PATHWAY | G alpha s Pathway |
| 1.8 | 3.6 | SA CASPASE CASCADE | Apoptosis is mediated by caspases, cysteine proteases arranged in a proteolytic cascade. |
| 1.8 | 111.5 | PID RHOA REG PATHWAY | Regulation of RhoA activity |
| 1.7 | 38.1 | PID ATF2 PATHWAY | ATF-2 transcription factor network |
| 1.7 | 58.7 | PID HDAC CLASSII PATHWAY | Signaling events mediated by HDAC Class II |
| 1.7 | 41.8 | SA MMP CYTOKINE CONNECTION | Cytokines can induce activation of matrix metalloproteinases, which degrade extracellular matrix. |
| 1.6 | 68.1 | PID HNF3B PATHWAY | FOXA2 and FOXA3 transcription factor networks |
| 1.6 | 65.8 | PID HIF1 TFPATHWAY | HIF-1-alpha transcription factor network |
| 1.4 | 33.8 | PID IL4 2PATHWAY | IL4-mediated signaling events |
| 1.3 | 17.3 | PID EPHRINB REV PATHWAY | Ephrin B reverse signaling |
| 1.3 | 20.9 | SIG REGULATION OF THE ACTIN CYTOSKELETON BY RHO GTPASES | Genes related to regulation of the actin cytoskeleton |
| 1.3 | 28.9 | PID HES HEY PATHWAY | Notch-mediated HES/HEY network |
| 1.2 | 43.4 | PID TAP63 PATHWAY | Validated transcriptional targets of TAp63 isoforms |
| 1.2 | 25.4 | ST B CELL ANTIGEN RECEPTOR | B Cell Antigen Receptor |
| 1.2 | 7.0 | PID RAC1 REG PATHWAY | Regulation of RAC1 activity |
| 1.1 | 3.3 | PID TCR RAS PATHWAY | Ras signaling in the CD4+ TCR pathway |
| 1.1 | 14.0 | PID P38 MKK3 6PATHWAY | p38 MAPK signaling pathway |
| 1.1 | 15.9 | PID IL2 1PATHWAY | IL2-mediated signaling events |
| 1.0 | 11.4 | PID FOXO PATHWAY | FoxO family signaling |
| 0.9 | 25.2 | PID INTEGRIN A4B1 PATHWAY | Alpha4 beta1 integrin signaling events |
| 0.9 | 5.3 | PID CXCR3 PATHWAY | CXCR3-mediated signaling events |
| 0.9 | 9.5 | PID INTEGRIN A9B1 PATHWAY | Alpha9 beta1 integrin signaling events |
| 0.8 | 32.5 | PID ERA GENOMIC PATHWAY | Validated nuclear estrogen receptor alpha network |
| 0.8 | 8.0 | PID PI3KCI AKT PATHWAY | Class I PI3K signaling events mediated by Akt |
| 0.8 | 6.3 | PID WNT NONCANONICAL PATHWAY | Noncanonical Wnt signaling pathway |
| 0.8 | 25.0 | PID NFAT TFPATHWAY | Calcineurin-regulated NFAT-dependent transcription in lymphocytes |
| 0.7 | 12.8 | PID CXCR4 PATHWAY | CXCR4-mediated signaling events |
| 0.7 | 17.3 | PID VEGFR1 2 PATHWAY | Signaling events mediated by VEGFR1 and VEGFR2 |
| 0.7 | 2.6 | ST PAC1 RECEPTOR PATHWAY | PAC1 Receptor Pathway |
| 0.6 | 5.7 | PID TCR CALCIUM PATHWAY | Calcium signaling in the CD4+ TCR pathway |
| 0.6 | 20.8 | PID DELTA NP63 PATHWAY | Validated transcriptional targets of deltaNp63 isoforms |
| 0.6 | 4.9 | ST TUMOR NECROSIS FACTOR PATHWAY | Tumor Necrosis Factor Pathway. |
| 0.6 | 5.0 | PID FAK PATHWAY | Signaling events mediated by focal adhesion kinase |
| 0.5 | 12.5 | PID ARF6 TRAFFICKING PATHWAY | Arf6 trafficking events |
| 0.5 | 3.8 | PID REELIN PATHWAY | Reelin signaling pathway |
| 0.5 | 21.2 | PID P73PATHWAY | p73 transcription factor network |
| 0.5 | 6.5 | PID LPA4 PATHWAY | LPA4-mediated signaling events |
| 0.5 | 13.4 | ST INTEGRIN SIGNALING PATHWAY | Integrin Signaling Pathway |
| 0.4 | 2.1 | PID ANTHRAX PATHWAY | Cellular roles of Anthrax toxin |
| 0.4 | 10.6 | PID CDC42 PATHWAY | CDC42 signaling events |
| 0.4 | 21.8 | PID SMAD2 3NUCLEAR PATHWAY | Regulation of nuclear SMAD2/3 signaling |
| 0.4 | 5.9 | ST WNT BETA CATENIN PATHWAY | Wnt/beta-catenin Pathway |
| 0.4 | 89.1 | NABA ECM REGULATORS | Genes encoding enzymes and their regulators involved in the remodeling of the extracellular matrix |
| 0.4 | 1.6 | PID BARD1 PATHWAY | BARD1 signaling events |
| 0.4 | 7.0 | PID ANGIOPOIETIN RECEPTOR PATHWAY | Angiopoietin receptor Tie2-mediated signaling |
| 0.4 | 1.5 | PID GMCSF PATHWAY | GMCSF-mediated signaling events |
| 0.3 | 3.9 | PID TXA2PATHWAY | Thromboxane A2 receptor signaling |
| 0.3 | 4.2 | PID INTEGRIN CS PATHWAY | Integrin family cell surface interactions |
| 0.2 | 1.2 | PID BETA CATENIN DEG PATHWAY | Degradation of beta catenin |
| 0.2 | 3.9 | PID ECADHERIN STABILIZATION PATHWAY | Stabilization and expansion of the E-cadherin adherens junction |
| 0.1 | 1.6 | PID SYNDECAN 4 PATHWAY | Syndecan-4-mediated signaling events |
| 0.1 | 3.5 | PID MTOR 4PATHWAY | mTOR signaling pathway |
| 0.1 | 0.9 | PID VEGF VEGFR PATHWAY | VEGF and VEGFR signaling network |
| 0.1 | 0.6 | PID PI3KCI PATHWAY | Class I PI3K signaling events |
Gene overrepresentation in C2:CP:REACTOME category:
| Log-likelihood per target | Total log-likelihood | Term | Description |
|---|---|---|---|
| 39.5 | 632.7 | REACTOME SLBP DEPENDENT PROCESSING OF REPLICATION DEPENDENT HISTONE PRE MRNAS | Genes involved in SLBP Dependent Processing of Replication-Dependent Histone Pre-mRNAs |
| 36.5 | 328.6 | REACTOME APOBEC3G MEDIATED RESISTANCE TO HIV1 INFECTION | Genes involved in APOBEC3G mediated resistance to HIV-1 infection |
| 35.3 | 2609.8 | REACTOME CDK MEDIATED PHOSPHORYLATION AND REMOVAL OF CDC6 | Genes involved in CDK-mediated phosphorylation and removal of Cdc6 |
| 26.4 | 263.7 | REACTOME COPI MEDIATED TRANSPORT | Genes involved in COPI Mediated Transport |
| 25.6 | 920.2 | REACTOME CYTOSOLIC TRNA AMINOACYLATION | Genes involved in Cytosolic tRNA aminoacylation |
| 24.4 | 391.0 | REACTOME SYNTHESIS OF SUBSTRATES IN N GLYCAN BIOSYTHESIS | Genes involved in Synthesis of substrates in N-glycan biosythesis |
| 24.1 | 1833.9 | REACTOME FORMATION OF THE TERNARY COMPLEX AND SUBSEQUENTLY THE 43S COMPLEX | Genes involved in Formation of the ternary complex, and subsequently, the 43S complex |
| 23.9 | 23.9 | REACTOME MRNA DECAY BY 3 TO 5 EXORIBONUCLEASE | Genes involved in mRNA Decay by 3' to 5' Exoribonuclease |
| 22.2 | 642.5 | REACTOME FORMATION OF INCISION COMPLEX IN GG NER | Genes involved in Formation of incision complex in GG-NER |
| 21.9 | 131.4 | REACTOME APC CDC20 MEDIATED DEGRADATION OF NEK2A | Genes involved in APC-Cdc20 mediated degradation of Nek2A |
| 21.8 | 522.0 | REACTOME VIRAL MESSENGER RNA SYNTHESIS | Genes involved in Viral Messenger RNA Synthesis |
| 21.0 | 2807.8 | REACTOME SRP DEPENDENT COTRANSLATIONAL PROTEIN TARGETING TO MEMBRANE | Genes involved in SRP-dependent cotranslational protein targeting to membrane |
| 20.9 | 480.8 | REACTOME MRNA SPLICING MINOR PATHWAY | Genes involved in mRNA Splicing - Minor Pathway |
| 20.9 | 20.9 | REACTOME TRANSLOCATION OF ZAP 70 TO IMMUNOLOGICAL SYNAPSE | Genes involved in Translocation of ZAP-70 to Immunological synapse |
| 18.8 | 469.6 | REACTOME PURINE SALVAGE | Genes involved in Purine salvage |
| 18.2 | 382.5 | REACTOME ENDOSOMAL SORTING COMPLEX REQUIRED FOR TRANSPORT ESCRT | Genes involved in Endosomal Sorting Complex Required For Transport (ESCRT) |
| 17.8 | 285.4 | REACTOME UNWINDING OF DNA | Genes involved in Unwinding of DNA |
| 16.7 | 699.5 | REACTOME INTERACTIONS OF VPR WITH HOST CELLULAR PROTEINS | Genes involved in Interactions of Vpr with host cellular proteins |
| 16.4 | 540.3 | REACTOME APC C CDH1 MEDIATED DEGRADATION OF CDC20 AND OTHER APC C CDH1 TARGETED PROTEINS IN LATE MITOSIS EARLY G1 | Genes involved in APC/C:Cdh1 mediated degradation of Cdc20 and other APC/C:Cdh1 targeted proteins in late mitosis/early G1 |
| 16.4 | 523.4 | REACTOME OXYGEN DEPENDENT PROLINE HYDROXYLATION OF HYPOXIA INDUCIBLE FACTOR ALPHA | Genes involved in Oxygen-dependent Proline Hydroxylation of Hypoxia-inducible Factor Alpha |
| 16.0 | 224.3 | REACTOME MRNA DECAY BY 5 TO 3 EXORIBONUCLEASE | Genes involved in mRNA Decay by 5' to 3' Exoribonuclease |
| 15.1 | 225.9 | REACTOME DESTABILIZATION OF MRNA BY BRF1 | Genes involved in Destabilization of mRNA by Butyrate Response Factor 1 (BRF1) |
| 15.0 | 180.4 | REACTOME REPAIR SYNTHESIS FOR GAP FILLING BY DNA POL IN TC NER | Genes involved in Repair synthesis for gap-filling by DNA polymerase in TC-NER |
| 14.8 | 575.5 | REACTOME PREFOLDIN MEDIATED TRANSFER OF SUBSTRATE TO CCT TRIC | Genes involved in Prefoldin mediated transfer of substrate to CCT/TriC |
| 14.7 | 29.4 | REACTOME PHOSPHORYLATION OF CD3 AND TCR ZETA CHAINS | Genes involved in Phosphorylation of CD3 and TCR zeta chains |
| 14.5 | 1489.3 | REACTOME PROCESSING OF CAPPED INTRON CONTAINING PRE MRNA | Genes involved in Processing of Capped Intron-Containing Pre-mRNA |
| 13.7 | 219.8 | REACTOME METABOLISM OF NON CODING RNA | Genes involved in Metabolism of non-coding RNA |
| 13.2 | 383.6 | REACTOME EXTRINSIC PATHWAY FOR APOPTOSIS | Genes involved in Extrinsic Pathway for Apoptosis |
| 12.7 | 202.6 | REACTOME FORMATION OF ATP BY CHEMIOSMOTIC COUPLING | Genes involved in Formation of ATP by chemiosmotic coupling |
| 12.6 | 390.4 | REACTOME PD1 SIGNALING | Genes involved in PD-1 signaling |
| 12.2 | 24.3 | REACTOME ACTIVATED TAK1 MEDIATES P38 MAPK ACTIVATION | Genes involved in activated TAK1 mediates p38 MAPK activation |
| 12.1 | 242.3 | REACTOME CITRIC ACID CYCLE TCA CYCLE | Genes involved in Citric acid cycle (TCA cycle) |
| 11.8 | 695.1 | REACTOME MITOCHONDRIAL PROTEIN IMPORT | Genes involved in Mitochondrial Protein Import |
| 11.7 | 11.7 | REACTOME FORMATION OF TUBULIN FOLDING INTERMEDIATES BY CCT TRIC | Genes involved in Formation of tubulin folding intermediates by CCT/TriC |
| 11.5 | 368.3 | REACTOME ENOS ACTIVATION AND REGULATION | Genes involved in eNOS activation and regulation |
| 10.5 | 52.6 | REACTOME PURINE CATABOLISM | Genes involved in Purine catabolism |
| 10.4 | 352.7 | REACTOME SYNTHESIS AND INTERCONVERSION OF NUCLEOTIDE DI AND TRIPHOSPHATES | Genes involved in Synthesis and interconversion of nucleotide di- and triphosphates |
| 10.2 | 193.6 | REACTOME APOPTOSIS INDUCED DNA FRAGMENTATION | Genes involved in Apoptosis induced DNA fragmentation |
| 10.0 | 129.8 | REACTOME TRAF6 MEDIATED IRF7 ACTIVATION IN TLR7 8 OR 9 SIGNALING | Genes involved in TRAF6 mediated IRF7 activation in TLR7/8 or 9 signaling |
| 10.0 | 328.4 | REACTOME ANTIGEN PRESENTATION FOLDING ASSEMBLY AND PEPTIDE LOADING OF CLASS I MHC | Genes involved in Antigen Presentation: Folding, assembly and peptide loading of class I MHC |
| 9.9 | 168.4 | REACTOME PLATELET ADHESION TO EXPOSED COLLAGEN | Genes involved in Platelet Adhesion to exposed collagen |
| 9.8 | 254.5 | REACTOME KINESINS | Genes involved in Kinesins |
| 9.7 | 164.8 | REACTOME NRIF SIGNALS CELL DEATH FROM THE NUCLEUS | Genes involved in NRIF signals cell death from the nucleus |
| 9.7 | 774.7 | REACTOME RESPIRATORY ELECTRON TRANSPORT | Genes involved in Respiratory electron transport |
| 9.4 | 131.1 | REACTOME VITAMIN B5 PANTOTHENATE METABOLISM | Genes involved in Vitamin B5 (pantothenate) metabolism |
| 9.3 | 315.2 | REACTOME PYRIMIDINE METABOLISM | Genes involved in Pyrimidine metabolism |
| 9.2 | 174.5 | REACTOME RETROGRADE NEUROTROPHIN SIGNALLING | Genes involved in Retrograde neurotrophin signalling |
| 9.1 | 63.4 | REACTOME RESPIRATORY ELECTRON TRANSPORT ATP SYNTHESIS BY CHEMIOSMOTIC COUPLING AND HEAT PRODUCTION BY UNCOUPLING PROTEINS | Genes involved in Respiratory electron transport, ATP synthesis by chemiosmotic coupling, and heat production by uncoupling proteins. |
| 8.9 | 384.2 | REACTOME TRANSLATION | Genes involved in Translation |
| 8.7 | 443.6 | REACTOME SIGNALING BY ROBO RECEPTOR | Genes involved in Signaling by Robo receptor |
| 8.7 | 182.4 | REACTOME EXTENSION OF TELOMERES | Genes involved in Extension of Telomeres |
| 8.6 | 129.7 | REACTOME DESTABILIZATION OF MRNA BY KSRP | Genes involved in Destabilization of mRNA by KSRP |
| 8.4 | 160.3 | REACTOME HYALURONAN UPTAKE AND DEGRADATION | Genes involved in Hyaluronan uptake and degradation |
| 8.4 | 218.4 | REACTOME HORMONE SENSITIVE LIPASE HSL MEDIATED TRIACYLGLYCEROL HYDROLYSIS | Genes involved in Hormone-sensitive lipase (HSL)-mediated triacylglycerol hydrolysis |
| 8.3 | 247.6 | REACTOME POST TRANSLATIONAL MODIFICATION SYNTHESIS OF GPI ANCHORED PROTEINS | Genes involved in Post-translational modification: synthesis of GPI-anchored proteins |
| 7.9 | 198.6 | REACTOME METABOLISM OF POLYAMINES | Genes involved in Metabolism of polyamines |
| 7.7 | 271.2 | REACTOME LYSOSOME VESICLE BIOGENESIS | Genes involved in Lysosome Vesicle Biogenesis |
| 7.6 | 428.3 | REACTOME G1 PHASE | Genes involved in G1 Phase |
| 7.6 | 84.0 | REACTOME TRAFFICKING AND PROCESSING OF ENDOSOMAL TLR | Genes involved in Trafficking and processing of endosomal TLR |
| 7.6 | 152.3 | REACTOME TGF BETA RECEPTOR SIGNALING IN EMT EPITHELIAL TO MESENCHYMAL TRANSITION | Genes involved in TGF-beta receptor signaling in EMT (epithelial to mesenchymal transition) |
| 7.5 | 193.9 | REACTOME PROTEOLYTIC CLEAVAGE OF SNARE COMPLEX PROTEINS | Genes involved in Proteolytic cleavage of SNARE complex proteins |
| 7.0 | 49.1 | REACTOME REGULATION OF INSULIN SECRETION BY GLUCAGON LIKE PEPTIDE1 | Genes involved in Regulation of Insulin Secretion by Glucagon-like Peptide-1 |
| 7.0 | 20.9 | REACTOME BINDING AND ENTRY OF HIV VIRION | Genes involved in Binding and entry of HIV virion |
| 6.8 | 47.8 | REACTOME ARMS MEDIATED ACTIVATION | Genes involved in ARMS-mediated activation |
| 6.6 | 138.6 | REACTOME INSULIN SYNTHESIS AND PROCESSING | Genes involved in Insulin Synthesis and Processing |
| 6.5 | 52.4 | REACTOME INFLUENZA VIRAL RNA TRANSCRIPTION AND REPLICATION | Genes involved in Influenza Viral RNA Transcription and Replication |
| 6.4 | 90.2 | REACTOME PLATELET SENSITIZATION BY LDL | Genes involved in Platelet sensitization by LDL |
| 6.4 | 147.4 | REACTOME SHC1 EVENTS IN EGFR SIGNALING | Genes involved in SHC1 events in EGFR signaling |
| 6.2 | 55.8 | REACTOME ACTIVATION OF NF KAPPAB IN B CELLS | Genes involved in Activation of NF-kappaB in B Cells |
| 6.1 | 128.5 | REACTOME GLYCOGEN BREAKDOWN GLYCOGENOLYSIS | Genes involved in Glycogen breakdown (glycogenolysis) |
| 6.1 | 54.6 | REACTOME IL 6 SIGNALING | Genes involved in Interleukin-6 signaling |
| 5.9 | 465.1 | REACTOME IMMUNOREGULATORY INTERACTIONS BETWEEN A LYMPHOID AND A NON LYMPHOID CELL | Genes involved in Immunoregulatory interactions between a Lymphoid and a non-Lymphoid cell |
| 5.8 | 23.1 | REACTOME SCF BETA TRCP MEDIATED DEGRADATION OF EMI1 | Genes involved in SCF-beta-TrCP mediated degradation of Emi1 |
| 5.7 | 17.1 | REACTOME NEGATIVE REGULATION OF THE PI3K AKT NETWORK | Genes involved in Negative regulation of the PI3K/AKT network |
| 5.6 | 118.5 | REACTOME REGULATION OF IFNG SIGNALING | Genes involved in Regulation of IFNG signaling |
| 5.6 | 223.5 | REACTOME REGULATION OF WATER BALANCE BY RENAL AQUAPORINS | Genes involved in Regulation of Water Balance by Renal Aquaporins |
| 5.5 | 154.4 | REACTOME INSULIN RECEPTOR RECYCLING | Genes involved in Insulin receptor recycling |
| 5.4 | 784.5 | REACTOME ANTIGEN PROCESSING UBIQUITINATION PROTEASOME DEGRADATION | Genes involved in Antigen processing: Ubiquitination & Proteasome degradation |
| 5.3 | 159.4 | REACTOME DOUBLE STRAND BREAK REPAIR | Genes involved in Double-Strand Break Repair |
| 5.1 | 97.3 | REACTOME P38MAPK EVENTS | Genes involved in p38MAPK events |
| 5.0 | 20.1 | REACTOME SPRY REGULATION OF FGF SIGNALING | Genes involved in Spry regulation of FGF signaling |
| 5.0 | 15.0 | REACTOME NRAGE SIGNALS DEATH THROUGH JNK | Genes involved in NRAGE signals death through JNK |
| 5.0 | 119.7 | REACTOME ADP SIGNALLING THROUGH P2RY12 | Genes involved in ADP signalling through P2Y purinoceptor 12 |
| 4.9 | 88.1 | REACTOME REGULATION OF MRNA STABILITY BY PROTEINS THAT BIND AU RICH ELEMENTS | Genes involved in Regulation of mRNA Stability by Proteins that Bind AU-rich Elements |
| 4.9 | 39.2 | REACTOME MICRORNA MIRNA BIOGENESIS | Genes involved in MicroRNA (miRNA) Biogenesis |
| 4.8 | 62.3 | REACTOME ACTIVATION OF IRF3 IRF7 MEDIATED BY TBK1 IKK EPSILON | Genes involved in Activation of IRF3/IRF7 mediated by TBK1/IKK epsilon |
| 4.7 | 135.3 | REACTOME ANTIVIRAL MECHANISM BY IFN STIMULATED GENES | Genes involved in Antiviral mechanism by IFN-stimulated genes |
| 4.3 | 78.2 | REACTOME TRNA AMINOACYLATION | Genes involved in tRNA Aminoacylation |
| 4.3 | 60.1 | REACTOME NEGATIVE REGULATORS OF RIG I MDA5 SIGNALING | Genes involved in Negative regulators of RIG-I/MDA5 signaling |
| 4.2 | 62.8 | REACTOME LATENT INFECTION OF HOMO SAPIENS WITH MYCOBACTERIUM TUBERCULOSIS | Genes involved in Latent infection of Homo sapiens with Mycobacterium tuberculosis |
| 4.2 | 29.2 | REACTOME SIGNALING BY CONSTITUTIVELY ACTIVE EGFR | Genes involved in Signaling by constitutively active EGFR |
| 4.2 | 128.7 | REACTOME CHOLESTEROL BIOSYNTHESIS | Genes involved in Cholesterol biosynthesis |
| 4.0 | 16.0 | REACTOME G BETA GAMMA SIGNALLING THROUGH PLC BETA | Genes involved in G beta:gamma signalling through PLC beta |
| 4.0 | 4.0 | REACTOME ELEVATION OF CYTOSOLIC CA2 LEVELS | Genes involved in Elevation of cytosolic Ca2+ levels |
| 4.0 | 158.9 | REACTOME SEMA4D INDUCED CELL MIGRATION AND GROWTH CONE COLLAPSE | Genes involved in Sema4D induced cell migration and growth-cone collapse |
| 4.0 | 71.4 | REACTOME SEMA3A PAK DEPENDENT AXON REPULSION | Genes involved in Sema3A PAK dependent Axon repulsion |
| 3.8 | 65.3 | REACTOME METABOLISM OF NUCLEOTIDES | Genes involved in Metabolism of nucleotides |
| 3.8 | 68.8 | REACTOME GENERATION OF SECOND MESSENGER MOLECULES | Genes involved in Generation of second messenger molecules |
| 3.7 | 85.5 | REACTOME HS GAG DEGRADATION | Genes involved in HS-GAG degradation |
| 3.6 | 36.3 | REACTOME SYNTHESIS OF PIPS AT THE LATE ENDOSOME MEMBRANE | Genes involved in Synthesis of PIPs at the late endosome membrane |
| 3.6 | 36.0 | REACTOME BIOSYNTHESIS OF THE N GLYCAN PRECURSOR DOLICHOL LIPID LINKED OLIGOSACCHARIDE LLO AND TRANSFER TO A NASCENT PROTEIN | Genes involved in Biosynthesis of the N-glycan precursor (dolichol lipid-linked oligosaccharide, LLO) and transfer to a nascent protein |
| 3.6 | 251.0 | REACTOME GLUCOSE METABOLISM | Genes involved in Glucose metabolism |
| 3.6 | 74.7 | REACTOME SYNTHESIS OF BILE ACIDS AND BILE SALTS VIA 7ALPHA HYDROXYCHOLESTEROL | Genes involved in Synthesis of bile acids and bile salts via 7alpha-hydroxycholesterol |
| 3.5 | 14.2 | REACTOME SEMA3A PLEXIN REPULSION SIGNALING BY INHIBITING INTEGRIN ADHESION | Genes involved in SEMA3A-Plexin repulsion signaling by inhibiting Integrin adhesion |
| 3.5 | 80.2 | REACTOME ANTIGEN ACTIVATES B CELL RECEPTOR LEADING TO GENERATION OF SECOND MESSENGERS | Genes involved in Antigen Activates B Cell Receptor Leading to Generation of Second Messengers |
| 3.4 | 20.7 | REACTOME PKA MEDIATED PHOSPHORYLATION OF CREB | Genes involved in PKA-mediated phosphorylation of CREB |
| 3.4 | 61.5 | REACTOME MITOCHONDRIAL FATTY ACID BETA OXIDATION | Genes involved in Mitochondrial Fatty Acid Beta-Oxidation |
| 3.3 | 26.7 | REACTOME REGULATION OF ORNITHINE DECARBOXYLASE ODC | Genes involved in Regulation of ornithine decarboxylase (ODC) |
| 3.3 | 23.2 | REACTOME REGULATION OF KIT SIGNALING | Genes involved in Regulation of KIT signaling |
| 3.1 | 144.9 | REACTOME TRANSPORT TO THE GOLGI AND SUBSEQUENT MODIFICATION | Genes involved in Transport to the Golgi and subsequent modification |
| 3.1 | 9.2 | REACTOME SIGNALLING TO P38 VIA RIT AND RIN | Genes involved in Signalling to p38 via RIT and RIN |
| 3.1 | 3.1 | REACTOME REGULATION OF SIGNALING BY CBL | Genes involved in Regulation of signaling by CBL |
| 3.0 | 127.9 | REACTOME INTERFERON GAMMA SIGNALING | Genes involved in Interferon gamma signaling |
| 3.0 | 32.7 | REACTOME THE NLRP3 INFLAMMASOME | Genes involved in The NLRP3 inflammasome |
| 3.0 | 76.8 | REACTOME SULFUR AMINO ACID METABOLISM | Genes involved in Sulfur amino acid metabolism |
| 2.9 | 26.3 | REACTOME POST CHAPERONIN TUBULIN FOLDING PATHWAY | Genes involved in Post-chaperonin tubulin folding pathway |
| 2.8 | 69.9 | REACTOME CELL EXTRACELLULAR MATRIX INTERACTIONS | Genes involved in Cell-extracellular matrix interactions |
| 2.8 | 82.5 | REACTOME SIGNAL TRANSDUCTION BY L1 | Genes involved in Signal transduction by L1 |
| 2.7 | 155.1 | REACTOME MITOTIC PROMETAPHASE | Genes involved in Mitotic Prometaphase |
| 2.7 | 32.3 | REACTOME INFLAMMASOMES | Genes involved in Inflammasomes |
| 2.7 | 13.4 | REACTOME FORMATION OF THE HIV1 EARLY ELONGATION COMPLEX | Genes involved in Formation of the HIV-1 Early Elongation Complex |
| 2.7 | 152.6 | REACTOME ACTIVATION OF CHAPERONE GENES BY XBP1S | Genes involved in Activation of Chaperone Genes by XBP1(S) |
| 2.7 | 37.2 | REACTOME INTRINSIC PATHWAY | Genes involved in Intrinsic Pathway |
| 2.7 | 8.0 | REACTOME REGULATED PROTEOLYSIS OF P75NTR | Genes involved in Regulated proteolysis of p75NTR |
| 2.6 | 287.7 | REACTOME RESPONSE TO ELEVATED PLATELET CYTOSOLIC CA2 | Genes involved in Response to elevated platelet cytosolic Ca2+ |
| 2.6 | 41.9 | REACTOME CHYLOMICRON MEDIATED LIPID TRANSPORT | Genes involved in Chylomicron-mediated lipid transport |
| 2.5 | 42.2 | REACTOME HOST INTERACTIONS OF HIV FACTORS | Genes involved in Host Interactions of HIV factors |
| 2.4 | 59.3 | REACTOME NUCLEOTIDE BINDING DOMAIN LEUCINE RICH REPEAT CONTAINING RECEPTOR NLR SIGNALING PATHWAYS | Genes involved in Nucleotide-binding domain, leucine rich repeat containing receptor (NLR) signaling pathways |
| 2.3 | 29.4 | REACTOME ACTIVATION OF BH3 ONLY PROTEINS | Genes involved in Activation of BH3-only proteins |
| 2.2 | 33.6 | REACTOME G2 M DNA DAMAGE CHECKPOINT | Genes involved in G2/M DNA damage checkpoint |
| 2.2 | 45.3 | REACTOME METAL ION SLC TRANSPORTERS | Genes involved in Metal ion SLC transporters |
| 2.1 | 55.9 | REACTOME RAP1 SIGNALLING | Genes involved in Rap1 signalling |
| 1.9 | 76.3 | REACTOME GLYCOSPHINGOLIPID METABOLISM | Genes involved in Glycosphingolipid metabolism |
| 1.8 | 38.8 | REACTOME DOWNREGULATION OF TGF BETA RECEPTOR SIGNALING | Genes involved in Downregulation of TGF-beta receptor signaling |
| 1.8 | 20.2 | REACTOME CYCLIN A B1 ASSOCIATED EVENTS DURING G2 M TRANSITION | Genes involved in Cyclin A/B1 associated events during G2/M transition |
| 1.7 | 27.8 | REACTOME ACTIVATION OF THE PRE REPLICATIVE COMPLEX | Genes involved in Activation of the pre-replicative complex |
| 1.7 | 34.6 | REACTOME PEROXISOMAL LIPID METABOLISM | Genes involved in Peroxisomal lipid metabolism |
| 1.7 | 15.3 | REACTOME ELONGATION ARREST AND RECOVERY | Genes involved in Elongation arrest and recovery |
| 1.6 | 8.2 | REACTOME CTNNB1 PHOSPHORYLATION CASCADE | Genes involved in Beta-catenin phosphorylation cascade |
| 1.6 | 11.2 | REACTOME AQUAPORIN MEDIATED TRANSPORT | Genes involved in Aquaporin-mediated transport |
| 1.6 | 68.3 | REACTOME TRANSPORT OF VITAMINS NUCLEOSIDES AND RELATED MOLECULES | Genes involved in Transport of vitamins, nucleosides, and related molecules |
| 1.6 | 84.9 | REACTOME NOTCH1 INTRACELLULAR DOMAIN REGULATES TRANSCRIPTION | Genes involved in NOTCH1 Intracellular Domain Regulates Transcription |
| 1.5 | 60.4 | REACTOME O LINKED GLYCOSYLATION OF MUCINS | Genes involved in O-linked glycosylation of mucins |
| 1.5 | 90.8 | REACTOME COLLAGEN FORMATION | Genes involved in Collagen formation |
| 1.4 | 208.4 | REACTOME SIGNALING BY RHO GTPASES | Genes involved in Signaling by Rho GTPases |
| 1.4 | 66.7 | REACTOME DEPOSITION OF NEW CENPA CONTAINING NUCLEOSOMES AT THE CENTROMERE | Genes involved in Deposition of New CENPA-containing Nucleosomes at the Centromere |
| 1.3 | 18.7 | REACTOME TRYPTOPHAN CATABOLISM | Genes involved in Tryptophan catabolism |
| 1.3 | 97.0 | REACTOME APOPTOTIC EXECUTION PHASE | Genes involved in Apoptotic execution phase |
| 1.3 | 6.4 | REACTOME GRB2 EVENTS IN ERBB2 SIGNALING | Genes involved in GRB2 events in ERBB2 signaling |
| 1.3 | 1.3 | REACTOME SIGNALING BY INSULIN RECEPTOR | Genes involved in Signaling by Insulin receptor |
| 1.2 | 12.4 | REACTOME DCC MEDIATED ATTRACTIVE SIGNALING | Genes involved in DCC mediated attractive signaling |
| 1.2 | 56.3 | REACTOME TRIGLYCERIDE BIOSYNTHESIS | Genes involved in Triglyceride Biosynthesis |
| 1.2 | 18.0 | REACTOME BILE SALT AND ORGANIC ANION SLC TRANSPORTERS | Genes involved in Bile salt and organic anion SLC transporters |
| 1.1 | 3.4 | REACTOME MITOTIC M M G1 PHASES | Genes involved in Mitotic M-M/G1 phases |
| 1.1 | 25.0 | REACTOME PRE NOTCH PROCESSING IN GOLGI | Genes involved in Pre-NOTCH Processing in Golgi |
| 1.1 | 26.8 | REACTOME REGULATION OF COMPLEMENT CASCADE | Genes involved in Regulation of Complement cascade |
| 1.0 | 2.1 | REACTOME TAK1 ACTIVATES NFKB BY PHOSPHORYLATION AND ACTIVATION OF IKKS COMPLEX | Genes involved in TAK1 activates NFkB by phosphorylation and activation of IKKs complex |
| 1.0 | 39.6 | REACTOME RNA POL III TRANSCRIPTION | Genes involved in RNA Polymerase III Transcription |
| 1.0 | 6.7 | REACTOME TOLL RECEPTOR CASCADES | Genes involved in Toll Receptor Cascades |
| 1.0 | 17.2 | REACTOME DOWNREGULATION OF ERBB2 ERBB3 SIGNALING | Genes involved in Downregulation of ERBB2:ERBB3 signaling |
| 0.9 | 16.4 | REACTOME BASE FREE SUGAR PHOSPHATE REMOVAL VIA THE SINGLE NUCLEOTIDE REPLACEMENT PATHWAY | Genes involved in Base-free sugar-phosphate removal via the single-nucleotide replacement pathway |
| 0.8 | 12.1 | REACTOME ADVANCED GLYCOSYLATION ENDPRODUCT RECEPTOR SIGNALING | Genes involved in Advanced glycosylation endproduct receptor signaling |
| 0.7 | 11.2 | REACTOME IRON UPTAKE AND TRANSPORT | Genes involved in Iron uptake and transport |
| 0.7 | 2.2 | REACTOME REGULATORY RNA PATHWAYS | Genes involved in Regulatory RNA pathways |
| 0.7 | 12.3 | REACTOME ABCA TRANSPORTERS IN LIPID HOMEOSTASIS | Genes involved in ABCA transporters in lipid homeostasis |
| 0.7 | 4.8 | REACTOME RNA POL I PROMOTER OPENING | Genes involved in RNA Polymerase I Promoter Opening |
| 0.6 | 20.2 | REACTOME AMYLOIDS | Genes involved in Amyloids |
| 0.5 | 5.1 | REACTOME BETA DEFENSINS | Genes involved in Beta defensins |
| 0.5 | 31.0 | REACTOME LOSS OF NLP FROM MITOTIC CENTROSOMES | Genes involved in Loss of Nlp from mitotic centrosomes |
| 0.3 | 5.7 | REACTOME GLUCOSE TRANSPORT | Genes involved in Glucose transport |
| 0.3 | 5.9 | REACTOME SIGNALING BY FGFR1 FUSION MUTANTS | Genes involved in Signaling by FGFR1 fusion mutants |
| 0.3 | 6.3 | REACTOME GLUCURONIDATION | Genes involved in Glucuronidation |
| 0.3 | 0.8 | REACTOME SEMA4D IN SEMAPHORIN SIGNALING | Genes involved in Sema4D in semaphorin signaling |
| 0.3 | 2.7 | REACTOME HDL MEDIATED LIPID TRANSPORT | Genes involved in HDL-mediated lipid transport |
| 0.3 | 7.8 | REACTOME YAP1 AND WWTR1 TAZ STIMULATED GENE EXPRESSION | Genes involved in YAP1- and WWTR1 (TAZ)-stimulated gene expression |
| 0.2 | 2.4 | REACTOME KERATAN SULFATE DEGRADATION | Genes involved in Keratan sulfate degradation |
| 0.2 | 4.3 | REACTOME SIGNALING BY BMP | Genes involved in Signaling by BMP |
| 0.2 | 0.7 | REACTOME HYALURONAN METABOLISM | Genes involved in Hyaluronan metabolism |
| 0.2 | 8.2 | REACTOME MYD88 MAL CASCADE INITIATED ON PLASMA MEMBRANE | Genes involved in MyD88:Mal cascade initiated on plasma membrane |
| 0.2 | 21.9 | REACTOME METABOLISM OF CARBOHYDRATES | Genes involved in Metabolism of carbohydrates |
| 0.2 | 8.9 | REACTOME AMINO ACID TRANSPORT ACROSS THE PLASMA MEMBRANE | Genes involved in Amino acid transport across the plasma membrane |
| 0.2 | 1.8 | REACTOME IL 7 SIGNALING | Genes involved in Interleukin-7 signaling |
| 0.2 | 4.4 | REACTOME RNA POL I RNA POL III AND MITOCHONDRIAL TRANSCRIPTION | Genes involved in RNA Polymerase I, RNA Polymerase III, and Mitochondrial Transcription |
| 0.1 | 0.4 | REACTOME SCFSKP2 MEDIATED DEGRADATION OF P27 P21 | Genes involved in SCF(Skp2)-mediated degradation of p27/p21 |
| 0.1 | 0.1 | REACTOME PROSTACYCLIN SIGNALLING THROUGH PROSTACYCLIN RECEPTOR | Genes involved in Prostacyclin signalling through prostacyclin receptor |
| 0.1 | 1.0 | REACTOME SIGNALING BY NODAL | Genes involved in Signaling by NODAL |
| 0.0 | 0.4 | REACTOME SYNTHESIS SECRETION AND INACTIVATION OF GIP | Genes involved in Synthesis, Secretion, and Inactivation of Glucose-dependent Insulinotropic Polypeptide (GIP) |