Project
GNF SymAtlas + NCI-60 cancer cell lines, comparison of cancers vs non-cancers, human (Su, 2004; Ross, 2000)
Navigation
Downloads
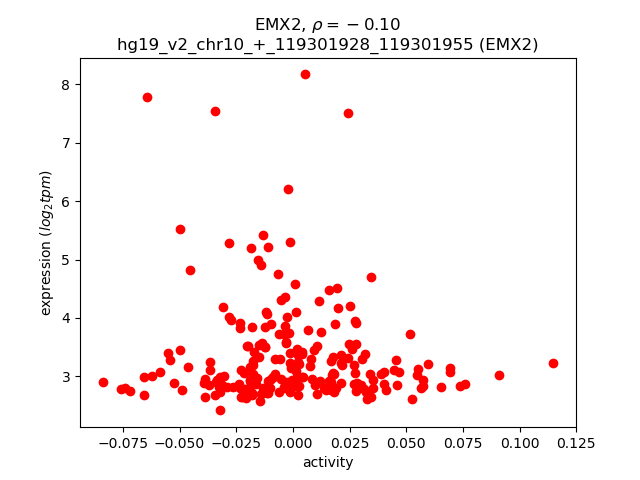
Results for EMX2
Z-value: 0.02
Motif logo

Transcription factors associated with EMX2
| Gene Symbol | Gene ID | Gene Info |
|---|---|---|
|
EMX2
|
ENSG00000170370.10 | empty spiracles homeobox 2 |
Activity-expression correlation:
| Gene | Promoter | Pearson corr. coef. | P-value | Plot |
|---|---|---|---|---|
| EMX2 | hg19_v2_chr10_+_119301928_119301955 | -0.10 | 1.5e-01 | Click! |
Activity profile of EMX2 motif
Sorted Z-values of EMX2 motif
| Promoter | Log-likelihood | Transcript | Gene | Gene Info |
|---|---|---|---|---|
| chr16_-_11375179 | 4.78 |
ENST00000312511.3
|
PRM1
|
protamine 1 |
| chr17_+_42422637 | 4.24 |
ENST00000053867.3
ENST00000588143.1 |
GRN
|
granulin |
| chr17_+_42422662 | 4.20 |
ENST00000593167.1
ENST00000585512.1 ENST00000591740.1 ENST00000592783.1 ENST00000587387.1 ENST00000588237.1 ENST00000589265.1 |
GRN
|
granulin |
| chr4_-_89205879 | 4.05 |
ENST00000608933.1
ENST00000315194.4 ENST00000514204.1 |
PPM1K
|
protein phosphatase, Mg2+/Mn2+ dependent, 1K |
| chr11_+_92085262 | 4.00 |
ENST00000298047.6
ENST00000409404.2 ENST00000541502.1 |
FAT3
|
FAT atypical cadherin 3 |
| chr12_-_123187890 | 3.79 |
ENST00000328880.5
|
HCAR2
|
hydroxycarboxylic acid receptor 2 |
| chr11_-_59950486 | 3.75 |
ENST00000426738.2
ENST00000533023.1 ENST00000420732.2 |
MS4A6A
|
membrane-spanning 4-domains, subfamily A, member 6A |
| chr12_-_123201337 | 3.74 |
ENST00000528880.2
|
HCAR3
|
hydroxycarboxylic acid receptor 3 |
| chr16_-_28634874 | 3.55 |
ENST00000395609.1
ENST00000350842.4 |
SULT1A1
|
sulfotransferase family, cytosolic, 1A, phenol-preferring, member 1 |
| chr11_-_59950519 | 3.49 |
ENST00000528851.1
|
MS4A6A
|
membrane-spanning 4-domains, subfamily A, member 6A |
| chr11_-_59950622 | 3.45 |
ENST00000323961.3
ENST00000412309.2 |
MS4A6A
|
membrane-spanning 4-domains, subfamily A, member 6A |
| chr12_-_10282836 | 3.44 |
ENST00000304084.8
ENST00000353231.5 ENST00000525605.1 |
CLEC7A
|
C-type lectin domain family 7, member A |
| chr5_-_140013275 | 3.43 |
ENST00000512545.1
ENST00000302014.6 ENST00000401743.2 |
CD14
|
CD14 molecule |
| chr18_+_21693306 | 3.43 |
ENST00000540918.2
|
TTC39C
|
tetratricopeptide repeat domain 39C |
| chr9_+_111624577 | 3.33 |
ENST00000333999.3
|
ACTL7A
|
actin-like 7A |
| chr3_-_141747950 | 3.32 |
ENST00000497579.1
|
TFDP2
|
transcription factor Dp-2 (E2F dimerization partner 2) |
| chr1_+_149754227 | 3.11 |
ENST00000444948.1
ENST00000369168.4 |
FCGR1A
|
Fc fragment of IgG, high affinity Ia, receptor (CD64) |
| chr16_-_21663919 | 2.89 |
ENST00000569602.1
|
IGSF6
|
immunoglobulin superfamily, member 6 |
| chr1_+_111773349 | 2.84 |
ENST00000533831.2
|
CHI3L2
|
chitinase 3-like 2 |
| chr3_-_151047327 | 2.74 |
ENST00000325602.5
|
P2RY13
|
purinergic receptor P2Y, G-protein coupled, 13 |
| chr4_-_120243545 | 2.46 |
ENST00000274024.3
|
FABP2
|
fatty acid binding protein 2, intestinal |
| chr4_-_100356551 | 2.42 |
ENST00000209665.4
|
ADH7
|
alcohol dehydrogenase 7 (class IV), mu or sigma polypeptide |
| chr11_-_104905840 | 2.42 |
ENST00000526568.1
ENST00000393136.4 ENST00000531166.1 ENST00000534497.1 ENST00000527979.1 ENST00000446369.1 ENST00000353247.5 ENST00000528974.1 ENST00000533400.1 ENST00000525825.1 ENST00000436863.3 |
CASP1
|
caspase 1, apoptosis-related cysteine peptidase |
| chr9_+_125132803 | 2.41 |
ENST00000540753.1
|
PTGS1
|
prostaglandin-endoperoxide synthase 1 (prostaglandin G/H synthase and cyclooxygenase) |
| chr16_-_21663950 | 2.36 |
ENST00000268389.4
|
IGSF6
|
immunoglobulin superfamily, member 6 |
| chr11_-_104972158 | 2.32 |
ENST00000598974.1
ENST00000593315.1 ENST00000594519.1 ENST00000415981.2 ENST00000525374.1 ENST00000375707.1 |
CASP1
CARD16
CARD17
|
caspase 1, apoptosis-related cysteine peptidase caspase recruitment domain family, member 16 caspase recruitment domain family, member 17 |
| chr3_-_141719195 | 2.31 |
ENST00000397991.4
|
TFDP2
|
transcription factor Dp-2 (E2F dimerization partner 2) |
| chr1_-_120935894 | 2.30 |
ENST00000369383.4
ENST00000369384.4 |
FCGR1B
|
Fc fragment of IgG, high affinity Ib, receptor (CD64) |
| chr9_+_125133315 | 2.26 |
ENST00000223423.4
ENST00000362012.2 |
PTGS1
|
prostaglandin-endoperoxide synthase 1 (prostaglandin G/H synthase and cyclooxygenase) |
| chr17_-_34503867 | 2.24 |
ENST00000589443.1
ENST00000454519.3 ENST00000586369.1 |
TBC1D3B
|
TBC1 domain family, member 3B |
| chr12_+_101988774 | 2.20 |
ENST00000545503.2
ENST00000536007.1 ENST00000541119.1 ENST00000361466.2 ENST00000551300.1 ENST00000550270.1 |
MYBPC1
|
myosin binding protein C, slow type |
| chr20_+_30697298 | 2.16 |
ENST00000398022.2
|
TM9SF4
|
transmembrane 9 superfamily protein member 4 |
| chr2_-_85625857 | 2.08 |
ENST00000453973.1
|
CAPG
|
capping protein (actin filament), gelsolin-like |
| chr3_+_121774202 | 1.99 |
ENST00000469710.1
ENST00000493101.1 ENST00000330540.2 ENST00000264468.5 |
CD86
|
CD86 molecule |
| chr17_-_15244894 | 1.96 |
ENST00000338696.2
ENST00000543896.1 ENST00000539245.1 ENST00000539316.1 ENST00000395930.1 |
TEKT3
|
tektin 3 |
| chr19_+_50016610 | 1.93 |
ENST00000596975.1
|
FCGRT
|
Fc fragment of IgG, receptor, transporter, alpha |
| chr8_-_38008783 | 1.91 |
ENST00000276449.4
|
STAR
|
steroidogenic acute regulatory protein |
| chr12_-_10282742 | 1.90 |
ENST00000298523.5
ENST00000396484.2 ENST00000310002.4 |
CLEC7A
|
C-type lectin domain family 7, member A |
| chr11_+_7110165 | 1.85 |
ENST00000306904.5
|
RBMXL2
|
RNA binding motif protein, X-linked-like 2 |
| chr12_+_29302119 | 1.84 |
ENST00000536681.3
|
FAR2
|
fatty acyl CoA reductase 2 |
| chr22_+_45725524 | 1.82 |
ENST00000405548.3
|
FAM118A
|
family with sequence similarity 118, member A |
| chr8_-_133687778 | 1.75 |
ENST00000518642.1
|
LRRC6
|
leucine rich repeat containing 6 |
| chr6_+_6588316 | 1.70 |
ENST00000379953.2
|
LY86
|
lymphocyte antigen 86 |
| chr17_-_39093672 | 1.70 |
ENST00000209718.3
ENST00000436344.3 ENST00000485751.1 |
KRT23
|
keratin 23 (histone deacetylase inducible) |
| chr17_-_34757039 | 1.67 |
ENST00000455054.2
ENST00000308078.7 |
TBC1D3H
TBC1D3C
|
TBC1 domain family, member 3H TBC1 domain family, member 3C |
| chr4_-_170897045 | 1.64 |
ENST00000508313.1
|
RP11-205M3.3
|
RP11-205M3.3 |
| chr12_-_58220078 | 1.64 |
ENST00000549039.1
|
CTDSP2
|
CTD (carboxy-terminal domain, RNA polymerase II, polypeptide A) small phosphatase 2 |
| chr16_+_15489603 | 1.62 |
ENST00000568766.1
ENST00000287594.7 |
RP11-1021N1.1
MPV17L
|
Uncharacterized protein MPV17 mitochondrial membrane protein-like |
| chr10_-_47239738 | 1.57 |
ENST00000413193.2
|
AGAP10
|
ArfGAP with GTPase domain, ankyrin repeat and PH domain 10 |
| chr4_+_80584903 | 1.57 |
ENST00000506460.1
|
RP11-452C8.1
|
RP11-452C8.1 |
| chr2_+_48796120 | 1.56 |
ENST00000394754.1
|
STON1-GTF2A1L
|
STON1-GTF2A1L readthrough |
| chr12_+_101988627 | 1.54 |
ENST00000547405.1
ENST00000452455.2 ENST00000441232.1 ENST00000360610.2 ENST00000392934.3 ENST00000547509.1 ENST00000361685.2 ENST00000549145.1 ENST00000553190.1 |
MYBPC1
|
myosin binding protein C, slow type |
| chr1_-_182921119 | 1.51 |
ENST00000423786.1
|
SHCBP1L
|
SHC SH2-domain binding protein 1-like |
| chr12_-_24102576 | 1.49 |
ENST00000537393.1
ENST00000309359.1 ENST00000381381.2 ENST00000451604.2 |
SOX5
|
SRY (sex determining region Y)-box 5 |
| chr2_-_99279928 | 1.49 |
ENST00000414521.2
|
MGAT4A
|
mannosyl (alpha-1,3-)-glycoprotein beta-1,4-N-acetylglucosaminyltransferase, isozyme A |
| chr6_+_72926145 | 1.49 |
ENST00000425662.2
ENST00000453976.2 |
RIMS1
|
regulating synaptic membrane exocytosis 1 |
| chr1_+_206858232 | 1.45 |
ENST00000294981.4
|
MAPKAPK2
|
mitogen-activated protein kinase-activated protein kinase 2 |
| chr8_-_133687813 | 1.45 |
ENST00000250173.1
ENST00000519595.1 |
LRRC6
|
leucine rich repeat containing 6 |
| chr12_-_22063787 | 1.45 |
ENST00000544039.1
|
ABCC9
|
ATP-binding cassette, sub-family C (CFTR/MRP), member 9 |
| chr1_+_117544366 | 1.44 |
ENST00000256652.4
ENST00000369470.1 |
CD101
|
CD101 molecule |
| chr9_-_128246769 | 1.41 |
ENST00000444226.1
|
MAPKAP1
|
mitogen-activated protein kinase associated protein 1 |
| chr5_+_81575281 | 1.40 |
ENST00000380167.4
|
ATP6AP1L
|
ATPase, H+ transporting, lysosomal accessory protein 1-like |
| chr11_-_63376013 | 1.39 |
ENST00000540943.1
|
PLA2G16
|
phospholipase A2, group XVI |
| chr12_-_10978957 | 1.38 |
ENST00000240619.2
|
TAS2R10
|
taste receptor, type 2, member 10 |
| chr5_-_137475071 | 1.34 |
ENST00000265191.2
|
NME5
|
NME/NM23 family member 5 |
| chr3_+_40518599 | 1.31 |
ENST00000314686.5
ENST00000447116.2 ENST00000429348.2 ENST00000456778.1 |
ZNF619
|
zinc finger protein 619 |
| chr1_+_174844645 | 1.31 |
ENST00000486220.1
|
RABGAP1L
|
RAB GTPase activating protein 1-like |
| chr5_-_111093081 | 1.30 |
ENST00000453526.2
ENST00000509427.1 |
NREP
|
neuronal regeneration related protein |
| chr3_-_122512619 | 1.27 |
ENST00000383659.1
ENST00000306103.2 |
HSPBAP1
|
HSPB (heat shock 27kDa) associated protein 1 |
| chr8_+_31497271 | 1.24 |
ENST00000520407.1
|
NRG1
|
neuregulin 1 |
| chr1_-_92952433 | 1.24 |
ENST00000294702.5
|
GFI1
|
growth factor independent 1 transcription repressor |
| chr1_-_67142710 | 1.23 |
ENST00000502413.2
|
AL139147.1
|
Uncharacterized protein |
| chr14_+_54863667 | 1.20 |
ENST00000335183.6
|
CDKN3
|
cyclin-dependent kinase inhibitor 3 |
| chr6_-_134639180 | 1.18 |
ENST00000367858.5
|
SGK1
|
serum/glucocorticoid regulated kinase 1 |
| chr4_-_168155169 | 1.18 |
ENST00000534949.1
ENST00000535728.1 |
SPOCK3
|
sparc/osteonectin, cwcv and kazal-like domains proteoglycan (testican) 3 |
| chr17_+_62461569 | 1.17 |
ENST00000603557.1
ENST00000605096.1 |
MILR1
|
mast cell immunoglobulin-like receptor 1 |
| chr11_-_36310958 | 1.17 |
ENST00000532705.1
ENST00000263401.5 ENST00000452374.2 |
COMMD9
|
COMM domain containing 9 |
| chr9_-_115095123 | 1.15 |
ENST00000458258.1
|
PTBP3
|
polypyrimidine tract binding protein 3 |
| chr4_-_100356291 | 1.13 |
ENST00000476959.1
ENST00000482593.1 |
ADH7
|
alcohol dehydrogenase 7 (class IV), mu or sigma polypeptide |
| chr18_+_61637159 | 1.13 |
ENST00000397985.2
ENST00000353706.2 ENST00000542677.1 ENST00000397988.3 ENST00000448851.1 |
SERPINB8
|
serpin peptidase inhibitor, clade B (ovalbumin), member 8 |
| chr1_+_36549676 | 1.04 |
ENST00000207457.3
|
TEKT2
|
tektin 2 (testicular) |
| chr5_+_54455946 | 1.04 |
ENST00000503787.1
ENST00000296734.6 ENST00000515370.1 |
GPX8
|
glutathione peroxidase 8 (putative) |
| chr9_-_21202204 | 1.04 |
ENST00000239347.3
|
IFNA7
|
interferon, alpha 7 |
| chr18_-_5419797 | 1.03 |
ENST00000542146.1
ENST00000427684.2 |
EPB41L3
|
erythrocyte membrane protein band 4.1-like 3 |
| chr17_+_66521936 | 1.03 |
ENST00000592800.1
|
PRKAR1A
|
protein kinase, cAMP-dependent, regulatory, type I, alpha |
| chr12_+_60083118 | 1.02 |
ENST00000261187.4
ENST00000543448.1 |
SLC16A7
|
solute carrier family 16 (monocarboxylate transporter), member 7 |
| chr11_+_74303575 | 1.01 |
ENST00000263681.2
|
POLD3
|
polymerase (DNA-directed), delta 3, accessory subunit |
| chr12_+_26164645 | 1.00 |
ENST00000542004.1
|
RASSF8
|
Ras association (RalGDS/AF-6) domain family (N-terminal) member 8 |
| chr5_-_75919217 | 1.00 |
ENST00000504899.1
|
F2RL2
|
coagulation factor II (thrombin) receptor-like 2 |
| chr5_-_9630463 | 1.00 |
ENST00000382492.2
|
TAS2R1
|
taste receptor, type 2, member 1 |
| chr16_-_28374829 | 0.99 |
ENST00000532254.1
|
NPIPB6
|
nuclear pore complex interacting protein family, member B6 |
| chr18_+_6729725 | 0.99 |
ENST00000400091.2
ENST00000583410.1 ENST00000584387.1 |
ARHGAP28
|
Rho GTPase activating protein 28 |
| chr12_-_118796910 | 0.99 |
ENST00000541186.1
ENST00000539872.1 |
TAOK3
|
TAO kinase 3 |
| chr11_+_122753391 | 0.98 |
ENST00000307257.6
ENST00000227349.2 |
C11orf63
|
chromosome 11 open reading frame 63 |
| chr6_+_44187242 | 0.98 |
ENST00000393844.1
|
SLC29A1
|
solute carrier family 29 (equilibrative nucleoside transporter), member 1 |
| chr17_+_7239821 | 0.98 |
ENST00000158762.3
ENST00000570457.2 |
ACAP1
|
ArfGAP with coiled-coil, ankyrin repeat and PH domains 1 |
| chr7_+_138145076 | 0.97 |
ENST00000343526.4
|
TRIM24
|
tripartite motif containing 24 |
| chr3_+_11314099 | 0.95 |
ENST00000446450.2
ENST00000354956.5 ENST00000354449.3 ENST00000419112.1 |
ATG7
|
autophagy related 7 |
| chr4_-_123377880 | 0.95 |
ENST00000226730.4
|
IL2
|
interleukin 2 |
| chr16_+_11038345 | 0.95 |
ENST00000409790.1
|
CLEC16A
|
C-type lectin domain family 16, member A |
| chr11_+_122709200 | 0.93 |
ENST00000227348.4
|
CRTAM
|
cytotoxic and regulatory T cell molecule |
| chr12_-_86650077 | 0.92 |
ENST00000552808.2
ENST00000547225.1 |
MGAT4C
|
mannosyl (alpha-1,3-)-glycoprotein beta-1,4-N-acetylglucosaminyltransferase, isozyme C (putative) |
| chr18_+_20513278 | 0.91 |
ENST00000327155.5
|
RBBP8
|
retinoblastoma binding protein 8 |
| chr16_-_29479154 | 0.91 |
ENST00000549950.1
|
RP11-345J4.3
|
Uncharacterized protein |
| chr15_+_84115868 | 0.90 |
ENST00000427482.2
|
SH3GL3
|
SH3-domain GRB2-like 3 |
| chr2_+_122494676 | 0.90 |
ENST00000455432.1
|
TSN
|
translin |
| chrX_-_72347916 | 0.90 |
ENST00000373518.1
|
NAP1L6
|
nucleosome assembly protein 1-like 6 |
| chr10_-_115904361 | 0.89 |
ENST00000428953.1
ENST00000543782.1 |
C10orf118
|
chromosome 10 open reading frame 118 |
| chr3_-_48956818 | 0.89 |
ENST00000408959.2
|
ARIH2OS
|
ariadne homolog 2 opposite strand |
| chr4_-_185275104 | 0.89 |
ENST00000317596.3
|
RP11-290F5.2
|
RP11-290F5.2 |
| chr3_+_52245458 | 0.89 |
ENST00000459884.1
|
ALAS1
|
aminolevulinate, delta-, synthase 1 |
| chr1_+_192778161 | 0.89 |
ENST00000235382.5
|
RGS2
|
regulator of G-protein signaling 2, 24kDa |
| chr2_+_234826016 | 0.89 |
ENST00000324695.4
ENST00000433712.2 |
TRPM8
|
transient receptor potential cation channel, subfamily M, member 8 |
| chr1_-_146082633 | 0.88 |
ENST00000605317.1
ENST00000604938.1 ENST00000339388.5 |
NBPF11
|
neuroblastoma breakpoint family, member 11 |
| chr14_-_90420862 | 0.88 |
ENST00000556005.1
ENST00000555872.1 |
EFCAB11
|
EF-hand calcium binding domain 11 |
| chr6_+_29079668 | 0.86 |
ENST00000377169.1
|
OR2J3
|
olfactory receptor, family 2, subfamily J, member 3 |
| chr2_+_196313239 | 0.86 |
ENST00000413290.1
|
AC064834.1
|
AC064834.1 |
| chr12_+_112279782 | 0.85 |
ENST00000550735.2
|
MAPKAPK5
|
mitogen-activated protein kinase-activated protein kinase 5 |
| chr8_-_57123815 | 0.85 |
ENST00000316981.3
ENST00000423799.2 ENST00000429357.2 |
PLAG1
|
pleiomorphic adenoma gene 1 |
| chr6_+_63921399 | 0.84 |
ENST00000356170.3
|
FKBP1C
|
FK506 binding protein 1C |
| chr6_-_46048116 | 0.84 |
ENST00000185206.6
|
CLIC5
|
chloride intracellular channel 5 |
| chr16_+_31885079 | 0.83 |
ENST00000300870.10
ENST00000394846.3 |
ZNF267
|
zinc finger protein 267 |
| chr7_-_104909435 | 0.82 |
ENST00000357311.3
|
SRPK2
|
SRSF protein kinase 2 |
| chr21_-_43735628 | 0.82 |
ENST00000291525.10
ENST00000518498.1 |
TFF3
|
trefoil factor 3 (intestinal) |
| chr1_-_39347255 | 0.81 |
ENST00000454994.2
ENST00000357771.3 |
GJA9
|
gap junction protein, alpha 9, 59kDa |
| chr11_+_117198545 | 0.81 |
ENST00000533153.1
ENST00000278935.3 ENST00000525416.1 |
CEP164
|
centrosomal protein 164kDa |
| chr11_+_10476851 | 0.80 |
ENST00000396553.2
|
AMPD3
|
adenosine monophosphate deaminase 3 |
| chr5_-_75919253 | 0.80 |
ENST00000296641.4
|
F2RL2
|
coagulation factor II (thrombin) receptor-like 2 |
| chr6_+_44187334 | 0.80 |
ENST00000313248.7
ENST00000427851.2 |
SLC29A1
|
solute carrier family 29 (equilibrative nucleoside transporter), member 1 |
| chr12_-_53171128 | 0.78 |
ENST00000332411.2
|
KRT76
|
keratin 76 |
| chr2_-_62733476 | 0.78 |
ENST00000335390.5
|
TMEM17
|
transmembrane protein 17 |
| chr6_+_34725263 | 0.78 |
ENST00000374018.1
ENST00000374017.3 |
SNRPC
|
small nuclear ribonucleoprotein polypeptide C |
| chr5_-_111754948 | 0.78 |
ENST00000261486.5
|
EPB41L4A
|
erythrocyte membrane protein band 4.1 like 4A |
| chr12_+_21525818 | 0.76 |
ENST00000240652.3
ENST00000542023.1 ENST00000537593.1 |
IAPP
|
islet amyloid polypeptide |
| chr16_+_18995249 | 0.76 |
ENST00000569532.1
ENST00000304381.5 |
TMC7
|
transmembrane channel-like 7 |
| chr19_-_51920952 | 0.75 |
ENST00000356298.5
ENST00000339313.5 ENST00000529627.1 ENST00000439889.2 ENST00000353836.5 ENST00000432469.2 |
SIGLEC10
|
sialic acid binding Ig-like lectin 10 |
| chr9_-_21368075 | 0.74 |
ENST00000449498.1
|
IFNA13
|
interferon, alpha 13 |
| chr7_+_117251671 | 0.74 |
ENST00000468795.1
|
CFTR
|
cystic fibrosis transmembrane conductance regulator (ATP-binding cassette sub-family C, member 7) |
| chr12_-_53715328 | 0.74 |
ENST00000547757.1
ENST00000394384.3 ENST00000209873.4 |
AAAS
|
achalasia, adrenocortical insufficiency, alacrimia |
| chr4_-_113437328 | 0.72 |
ENST00000313341.3
|
NEUROG2
|
neurogenin 2 |
| chr5_-_55412774 | 0.72 |
ENST00000434982.2
|
ANKRD55
|
ankyrin repeat domain 55 |
| chr20_+_36405665 | 0.72 |
ENST00000373469.1
|
CTNNBL1
|
catenin, beta like 1 |
| chr12_-_86650045 | 0.71 |
ENST00000604798.1
|
MGAT4C
|
mannosyl (alpha-1,3-)-glycoprotein beta-1,4-N-acetylglucosaminyltransferase, isozyme C (putative) |
| chr18_-_19994830 | 0.71 |
ENST00000525417.1
|
CTAGE1
|
cutaneous T-cell lymphoma-associated antigen 1 |
| chr5_+_129083772 | 0.69 |
ENST00000564719.1
|
KIAA1024L
|
KIAA1024-like |
| chr12_+_58176525 | 0.69 |
ENST00000543727.1
ENST00000540550.1 ENST00000323833.8 ENST00000350762.5 ENST00000550559.1 ENST00000548851.1 ENST00000434359.1 ENST00000457189.1 |
TSFM
|
Ts translation elongation factor, mitochondrial |
| chr12_-_68696652 | 0.68 |
ENST00000539972.1
|
MDM1
|
Mdm1 nuclear protein homolog (mouse) |
| chr19_+_54466179 | 0.68 |
ENST00000270458.2
|
CACNG8
|
calcium channel, voltage-dependent, gamma subunit 8 |
| chr5_-_111093167 | 0.68 |
ENST00000446294.2
ENST00000419114.2 |
NREP
|
neuronal regeneration related protein |
| chr4_+_96012614 | 0.68 |
ENST00000264568.4
|
BMPR1B
|
bone morphogenetic protein receptor, type IB |
| chr4_-_103746924 | 0.68 |
ENST00000505207.1
ENST00000502404.1 ENST00000507845.1 |
UBE2D3
|
ubiquitin-conjugating enzyme E2D 3 |
| chr8_+_12803176 | 0.68 |
ENST00000524591.2
|
KIAA1456
|
KIAA1456 |
| chr11_-_13517565 | 0.66 |
ENST00000282091.1
ENST00000529816.1 |
PTH
|
parathyroid hormone |
| chr14_-_69261310 | 0.66 |
ENST00000336440.3
|
ZFP36L1
|
ZFP36 ring finger protein-like 1 |
| chr1_-_19615744 | 0.65 |
ENST00000361640.4
|
AKR7A3
|
aldo-keto reductase family 7, member A3 (aflatoxin aldehyde reductase) |
| chr5_+_140514782 | 0.65 |
ENST00000231134.5
|
PCDHB5
|
protocadherin beta 5 |
| chrX_+_144908928 | 0.62 |
ENST00000408967.2
|
TMEM257
|
transmembrane protein 257 |
| chr8_+_119294456 | 0.61 |
ENST00000366457.2
|
AC023590.1
|
Uncharacterized protein |
| chr19_+_15852203 | 0.61 |
ENST00000305892.1
|
OR10H3
|
olfactory receptor, family 10, subfamily H, member 3 |
| chr4_+_88571429 | 0.61 |
ENST00000339673.6
ENST00000282479.7 |
DMP1
|
dentin matrix acidic phosphoprotein 1 |
| chr1_+_225600404 | 0.61 |
ENST00000366845.2
|
AC092811.1
|
AC092811.1 |
| chr2_-_207023918 | 0.61 |
ENST00000455934.2
ENST00000449699.1 ENST00000454195.1 |
NDUFS1
|
NADH dehydrogenase (ubiquinone) Fe-S protein 1, 75kDa (NADH-coenzyme Q reductase) |
| chr7_+_107224364 | 0.61 |
ENST00000491150.1
|
BCAP29
|
B-cell receptor-associated protein 29 |
| chr12_-_112279694 | 0.61 |
ENST00000443596.1
ENST00000442119.1 |
MAPKAPK5-AS1
|
MAPKAPK5 antisense RNA 1 |
| chr3_+_38080691 | 0.60 |
ENST00000308059.6
ENST00000346219.3 ENST00000452631.2 |
DLEC1
|
deleted in lung and esophageal cancer 1 |
| chr2_+_157330081 | 0.60 |
ENST00000409674.1
|
GPD2
|
glycerol-3-phosphate dehydrogenase 2 (mitochondrial) |
| chr5_-_111092930 | 0.59 |
ENST00000257435.7
|
NREP
|
neuronal regeneration related protein |
| chr5_-_111312622 | 0.58 |
ENST00000395634.3
|
NREP
|
neuronal regeneration related protein |
| chr5_-_58571935 | 0.57 |
ENST00000503258.1
|
PDE4D
|
phosphodiesterase 4D, cAMP-specific |
| chr3_+_113616317 | 0.57 |
ENST00000440446.2
ENST00000488680.1 |
GRAMD1C
|
GRAM domain containing 1C |
| chr8_+_70404996 | 0.56 |
ENST00000402687.4
ENST00000419716.3 |
SULF1
|
sulfatase 1 |
| chr1_+_146714291 | 0.56 |
ENST00000431239.1
ENST00000369259.3 ENST00000369258.4 ENST00000361293.5 |
CHD1L
|
chromodomain helicase DNA binding protein 1-like |
| chr15_+_64680003 | 0.55 |
ENST00000261884.3
|
TRIP4
|
thyroid hormone receptor interactor 4 |
| chr5_-_76788317 | 0.55 |
ENST00000296679.4
|
WDR41
|
WD repeat domain 41 |
| chr4_+_74702214 | 0.55 |
ENST00000226317.5
ENST00000515050.1 |
CXCL6
|
chemokine (C-X-C motif) ligand 6 |
| chr2_-_207082748 | 0.55 |
ENST00000407325.2
ENST00000411719.1 |
GPR1
|
G protein-coupled receptor 1 |
| chr4_-_89205705 | 0.55 |
ENST00000295908.7
ENST00000510548.2 ENST00000508256.1 |
PPM1K
|
protein phosphatase, Mg2+/Mn2+ dependent, 1K |
| chr21_-_42219065 | 0.54 |
ENST00000400454.1
|
DSCAM
|
Down syndrome cell adhesion molecule |
| chr6_+_150690028 | 0.53 |
ENST00000229447.5
ENST00000344419.3 |
IYD
|
iodotyrosine deiodinase |
| chr5_-_58882219 | 0.53 |
ENST00000505453.1
ENST00000360047.5 |
PDE4D
|
phosphodiesterase 4D, cAMP-specific |
| chr4_+_113568207 | 0.53 |
ENST00000511529.1
|
LARP7
|
La ribonucleoprotein domain family, member 7 |
| chrX_+_78003204 | 0.53 |
ENST00000435339.3
ENST00000514744.1 |
LPAR4
|
lysophosphatidic acid receptor 4 |
| chr16_-_30102547 | 0.53 |
ENST00000279386.2
|
TBX6
|
T-box 6 |
| chr6_-_76782371 | 0.52 |
ENST00000369950.3
ENST00000369963.3 |
IMPG1
|
interphotoreceptor matrix proteoglycan 1 |
| chr6_+_28092338 | 0.52 |
ENST00000340487.4
|
ZSCAN16
|
zinc finger and SCAN domain containing 16 |
| chr7_-_16505440 | 0.52 |
ENST00000307068.4
|
SOSTDC1
|
sclerostin domain containing 1 |
| chr9_-_21217310 | 0.52 |
ENST00000380216.1
|
IFNA16
|
interferon, alpha 16 |
| chr6_+_72922505 | 0.51 |
ENST00000401910.3
|
RIMS1
|
regulating synaptic membrane exocytosis 1 |
| chr21_-_43735446 | 0.51 |
ENST00000398431.2
|
TFF3
|
trefoil factor 3 (intestinal) |
| chr18_+_29769978 | 0.49 |
ENST00000269202.6
ENST00000581447.1 |
MEP1B
|
meprin A, beta |
| chr12_-_11091862 | 0.49 |
ENST00000537503.1
|
TAS2R14
|
taste receptor, type 2, member 14 |
| chr6_+_26204825 | 0.49 |
ENST00000360441.4
|
HIST1H4E
|
histone cluster 1, H4e |
| chr19_+_12848299 | 0.47 |
ENST00000357332.3
|
ASNA1
|
arsA arsenite transporter, ATP-binding, homolog 1 (bacterial) |
| chr1_+_146373546 | 0.47 |
ENST00000446760.2
|
NBPF12
|
neuroblastoma breakpoint family, member 12 |
| chr7_+_115862858 | 0.47 |
ENST00000393481.2
|
TES
|
testis derived transcript (3 LIM domains) |
| chr5_-_132200477 | 0.46 |
ENST00000296875.2
|
GDF9
|
growth differentiation factor 9 |
| chr15_+_59903975 | 0.46 |
ENST00000560585.1
ENST00000396065.1 |
GCNT3
|
glucosaminyl (N-acetyl) transferase 3, mucin type |
| chr6_+_34725181 | 0.46 |
ENST00000244520.5
|
SNRPC
|
small nuclear ribonucleoprotein polypeptide C |
| chrX_+_135730373 | 0.45 |
ENST00000370628.2
|
CD40LG
|
CD40 ligand |
| chr1_+_160709076 | 0.45 |
ENST00000359331.4
ENST00000495334.1 |
SLAMF7
|
SLAM family member 7 |
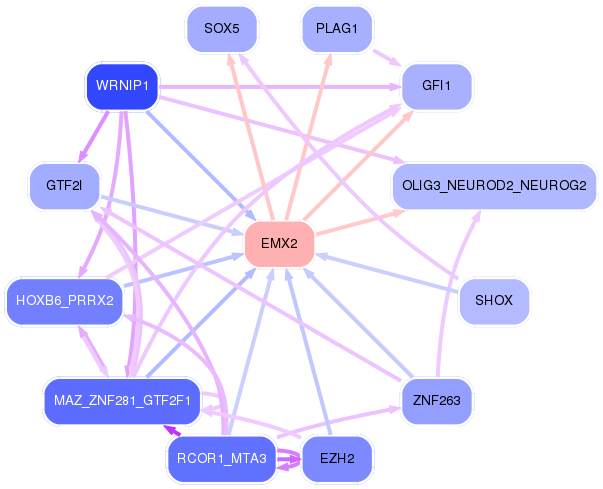
Network of associatons between targets according to the STRING database.

First level regulatory network of EMX2
Gene Ontology Analysis
Gene overrepresentation in biological_process category:
| Log-likelihood per target | Total log-likelihood | Term | Description |
|---|---|---|---|
| 1.2 | 3.6 | GO:0010430 | fatty acid omega-oxidation(GO:0010430) |
| 1.2 | 4.7 | GO:0050717 | positive regulation of interleukin-1 alpha secretion(GO:0050717) |
| 0.9 | 3.4 | GO:0071725 | toll-like receptor TLR1:TLR2 signaling pathway(GO:0038123) response to triacyl bacterial lipopeptide(GO:0071725) cellular response to triacyl bacterial lipopeptide(GO:0071727) |
| 0.7 | 2.0 | GO:0032641 | negative regulation of tolerance induction(GO:0002644) lymphotoxin A production(GO:0032641) interleukin-4 biosynthetic process(GO:0042097) lymphotoxin A biosynthetic process(GO:0042109) regulation of interleukin-4 biosynthetic process(GO:0045402) positive regulation of interleukin-4 biosynthetic process(GO:0045404) |
| 0.6 | 1.9 | GO:0018894 | dibenzo-p-dioxin metabolic process(GO:0018894) |
| 0.6 | 1.8 | GO:0010025 | wax biosynthetic process(GO:0010025) wax metabolic process(GO:0010166) |
| 0.5 | 2.3 | GO:0033031 | positive regulation of neutrophil apoptotic process(GO:0033031) |
| 0.4 | 3.0 | GO:0060294 | cilium movement involved in cell motility(GO:0060294) |
| 0.4 | 1.2 | GO:0070105 | positive regulation of interleukin-6-mediated signaling pathway(GO:0070105) |
| 0.4 | 1.6 | GO:0010730 | negative regulation of hydrogen peroxide biosynthetic process(GO:0010730) |
| 0.4 | 1.8 | GO:0015862 | uridine transport(GO:0015862) |
| 0.3 | 1.0 | GO:1904425 | negative regulation of GTP binding(GO:1904425) |
| 0.3 | 3.2 | GO:0036159 | inner dynein arm assembly(GO:0036159) epithelial cilium movement involved in determination of left/right asymmetry(GO:0060287) |
| 0.3 | 1.0 | GO:1901859 | late nucleophagy(GO:0044805) negative regulation of mitochondrial DNA replication(GO:0090298) negative regulation of mitochondrial DNA metabolic process(GO:1901859) single-organism membrane invagination(GO:1902534) |
| 0.3 | 3.1 | GO:0006030 | chitin metabolic process(GO:0006030) chitin catabolic process(GO:0006032) |
| 0.3 | 1.9 | GO:0002414 | immunoglobulin transcytosis in epithelial cells(GO:0002414) |
| 0.3 | 3.7 | GO:0071688 | striated muscle myosin thick filament assembly(GO:0071688) |
| 0.3 | 5.3 | GO:0009756 | carbohydrate mediated signaling(GO:0009756) |
| 0.3 | 4.7 | GO:0019371 | cyclooxygenase pathway(GO:0019371) |
| 0.2 | 1.5 | GO:0055059 | asymmetric neuroblast division(GO:0055059) |
| 0.2 | 1.0 | GO:0032053 | ciliary basal body organization(GO:0032053) |
| 0.2 | 0.7 | GO:1902161 | positive regulation of cyclic nucleotide-gated ion channel activity(GO:1902161) |
| 0.2 | 0.9 | GO:2000317 | regulation of T cell homeostatic proliferation(GO:0046013) negative regulation of T-helper 17 type immune response(GO:2000317) negative regulation of T-helper 17 cell differentiation(GO:2000320) |
| 0.2 | 1.4 | GO:0030950 | establishment or maintenance of actin cytoskeleton polarity(GO:0030950) |
| 0.2 | 0.7 | GO:1900158 | positive regulation of osteoclast proliferation(GO:0090290) negative regulation of bone mineralization involved in bone maturation(GO:1900158) |
| 0.2 | 0.7 | GO:0048382 | mesendoderm development(GO:0048382) |
| 0.2 | 1.0 | GO:0034334 | adherens junction maintenance(GO:0034334) |
| 0.2 | 1.4 | GO:0046485 | ether lipid metabolic process(GO:0046485) |
| 0.2 | 1.3 | GO:0003351 | epithelial cilium movement(GO:0003351) |
| 0.2 | 1.7 | GO:0031666 | positive regulation of lipopolysaccharide-mediated signaling pathway(GO:0031666) |
| 0.2 | 1.5 | GO:0044351 | macropinocytosis(GO:0044351) |
| 0.2 | 1.2 | GO:0021840 | directional guidance of interneurons involved in migration from the subpallium to the cortex(GO:0021840) chemorepulsion involved in interneuron migration from the subpallium to the cortex(GO:0021842) |
| 0.2 | 0.9 | GO:0050955 | thermoception(GO:0050955) |
| 0.2 | 1.2 | GO:0070294 | renal sodium ion absorption(GO:0070294) |
| 0.2 | 0.5 | GO:0051725 | protein de-ADP-ribosylation(GO:0051725) |
| 0.2 | 2.2 | GO:0070863 | positive regulation of protein exit from endoplasmic reticulum(GO:0070863) |
| 0.2 | 0.8 | GO:0035063 | nuclear speck organization(GO:0035063) |
| 0.2 | 3.6 | GO:0006068 | ethanol catabolic process(GO:0006068) |
| 0.2 | 1.3 | GO:1901475 | pyruvate transport(GO:0006848) pyruvate transmembrane transport(GO:1901475) |
| 0.2 | 0.9 | GO:1901096 | regulation of autophagosome maturation(GO:1901096) positive regulation of autophagosome maturation(GO:1901098) |
| 0.2 | 5.0 | GO:0009083 | branched-chain amino acid catabolic process(GO:0009083) |
| 0.2 | 0.5 | GO:2000870 | regulation of progesterone secretion(GO:2000870) |
| 0.1 | 0.9 | GO:0010519 | negative regulation of phospholipase activity(GO:0010519) |
| 0.1 | 1.0 | GO:0002175 | protein localization to paranode region of axon(GO:0002175) |
| 0.1 | 0.4 | GO:0019287 | isopentenyl diphosphate biosynthetic process, mevalonate pathway(GO:0019287) |
| 0.1 | 1.0 | GO:0070562 | regulation of vitamin D receptor signaling pathway(GO:0070562) |
| 0.1 | 2.7 | GO:0035589 | G-protein coupled purinergic nucleotide receptor signaling pathway(GO:0035589) |
| 0.1 | 1.2 | GO:0000395 | mRNA 5'-splice site recognition(GO:0000395) |
| 0.1 | 0.7 | GO:0001550 | ovarian cumulus expansion(GO:0001550) fused antrum stage(GO:0048165) |
| 0.1 | 5.6 | GO:0000083 | regulation of transcription involved in G1/S transition of mitotic cell cycle(GO:0000083) |
| 0.1 | 0.8 | GO:0006196 | AMP catabolic process(GO:0006196) |
| 0.1 | 0.5 | GO:0060648 | mammary gland bud morphogenesis(GO:0060648) |
| 0.1 | 0.9 | GO:0010792 | DNA double-strand break processing involved in repair via single-strand annealing(GO:0010792) |
| 0.1 | 4.8 | GO:0030261 | chromosome condensation(GO:0030261) |
| 0.1 | 1.1 | GO:0086024 | adrenergic receptor signaling pathway involved in positive regulation of heart rate(GO:0086024) |
| 0.1 | 2.2 | GO:0097151 | positive regulation of inhibitory postsynaptic potential(GO:0097151) modulation of inhibitory postsynaptic potential(GO:0098828) |
| 0.1 | 0.6 | GO:0006127 | glycerophosphate shuttle(GO:0006127) |
| 0.1 | 0.9 | GO:0002860 | positive regulation of natural killer cell mediated immune response to tumor cell(GO:0002857) positive regulation of natural killer cell mediated cytotoxicity directed against tumor cell target(GO:0002860) |
| 0.1 | 2.9 | GO:0001580 | detection of chemical stimulus involved in sensory perception of bitter taste(GO:0001580) |
| 0.1 | 0.3 | GO:2000525 | regulation of T cell costimulation(GO:2000523) positive regulation of T cell costimulation(GO:2000525) |
| 0.1 | 0.3 | GO:0042270 | protection from natural killer cell mediated cytotoxicity(GO:0042270) |
| 0.1 | 2.1 | GO:0071803 | positive regulation of podosome assembly(GO:0071803) |
| 0.1 | 0.8 | GO:0048733 | sebaceous gland development(GO:0048733) |
| 0.1 | 1.1 | GO:0043249 | erythrocyte maturation(GO:0043249) |
| 0.1 | 0.5 | GO:2000158 | positive regulation of ubiquitin-specific protease activity(GO:2000158) |
| 0.1 | 0.5 | GO:0014043 | negative regulation of neuron maturation(GO:0014043) |
| 0.1 | 0.3 | GO:1900133 | regulation of renin secretion into blood stream(GO:1900133) |
| 0.1 | 0.8 | GO:0090400 | stress-induced premature senescence(GO:0090400) |
| 0.1 | 0.8 | GO:0097646 | calcitonin family receptor signaling pathway(GO:0097646) amylin receptor signaling pathway(GO:0097647) |
| 0.1 | 0.8 | GO:0060088 | auditory receptor cell stereocilium organization(GO:0060088) |
| 0.1 | 1.2 | GO:0033004 | negative regulation of mast cell activation(GO:0033004) |
| 0.1 | 1.8 | GO:0070493 | thrombin receptor signaling pathway(GO:0070493) |
| 0.1 | 0.2 | GO:0071934 | thiamine transport(GO:0015888) thiamine transmembrane transport(GO:0071934) |
| 0.1 | 1.6 | GO:0033141 | positive regulation of peptidyl-serine phosphorylation of STAT protein(GO:0033141) |
| 0.1 | 1.0 | GO:0045835 | negative regulation of meiotic nuclear division(GO:0045835) |
| 0.1 | 0.6 | GO:0070973 | protein localization to endoplasmic reticulum exit site(GO:0070973) |
| 0.1 | 0.7 | GO:0002098 | tRNA wobble uridine modification(GO:0002098) |
| 0.1 | 0.3 | GO:0071231 | thymidylate synthase biosynthetic process(GO:0050757) regulation of thymidylate synthase biosynthetic process(GO:0050758) cellular response to folic acid(GO:0071231) |
| 0.1 | 0.6 | GO:0035860 | glial cell-derived neurotrophic factor receptor signaling pathway(GO:0035860) |
| 0.1 | 0.9 | GO:0030422 | production of siRNA involved in RNA interference(GO:0030422) |
| 0.1 | 0.9 | GO:0006782 | protoporphyrinogen IX biosynthetic process(GO:0006782) |
| 0.1 | 0.6 | GO:0070166 | enamel mineralization(GO:0070166) |
| 0.1 | 5.2 | GO:0031338 | regulation of vesicle fusion(GO:0031338) |
| 0.1 | 1.1 | GO:0090136 | epithelial cell-cell adhesion(GO:0090136) |
| 0.1 | 0.3 | GO:2000253 | positive regulation of feeding behavior(GO:2000253) |
| 0.1 | 0.4 | GO:0002933 | lipid hydroxylation(GO:0002933) |
| 0.1 | 0.1 | GO:2001045 | negative regulation of integrin-mediated signaling pathway(GO:2001045) |
| 0.1 | 1.5 | GO:0006491 | N-glycan processing(GO:0006491) |
| 0.1 | 0.4 | GO:2000773 | negative regulation of cellular senescence(GO:2000773) |
| 0.1 | 0.9 | GO:2000353 | positive regulation of endothelial cell apoptotic process(GO:2000353) |
| 0.1 | 0.8 | GO:0060252 | positive regulation of glial cell proliferation(GO:0060252) |
| 0.1 | 0.7 | GO:0046600 | negative regulation of centriole replication(GO:0046600) |
| 0.0 | 0.1 | GO:0007039 | protein catabolic process in the vacuole(GO:0007039) |
| 0.0 | 0.4 | GO:0032057 | negative regulation of translational initiation in response to stress(GO:0032057) |
| 0.0 | 0.4 | GO:0000055 | ribosomal large subunit export from nucleus(GO:0000055) negative regulation of RNA polymerase II regulatory region sequence-specific DNA binding(GO:1903026) |
| 0.0 | 0.5 | GO:0006570 | tyrosine metabolic process(GO:0006570) |
| 0.0 | 0.2 | GO:0006436 | tryptophanyl-tRNA aminoacylation(GO:0006436) |
| 0.0 | 4.7 | GO:0002479 | antigen processing and presentation of exogenous peptide antigen via MHC class I, TAP-dependent(GO:0002479) |
| 0.0 | 0.5 | GO:0048842 | positive regulation of axon extension involved in axon guidance(GO:0048842) |
| 0.0 | 0.3 | GO:0098532 | histone H3-K27 trimethylation(GO:0098532) |
| 0.0 | 0.2 | GO:1902715 | positive regulation of interferon-gamma secretion(GO:1902715) |
| 0.0 | 1.0 | GO:0032201 | telomere maintenance via semi-conservative replication(GO:0032201) |
| 0.0 | 0.7 | GO:0007095 | mitotic G2 DNA damage checkpoint(GO:0007095) |
| 0.0 | 0.4 | GO:0006657 | CDP-choline pathway(GO:0006657) |
| 0.0 | 1.7 | GO:0050911 | detection of chemical stimulus involved in sensory perception of smell(GO:0050911) |
| 0.0 | 0.1 | GO:0051684 | maintenance of Golgi location(GO:0051684) |
| 0.0 | 0.3 | GO:0035457 | cellular response to interferon-alpha(GO:0035457) |
| 0.0 | 0.7 | GO:2000311 | regulation of alpha-amino-3-hydroxy-5-methyl-4-isoxazole propionate selective glutamate receptor activity(GO:2000311) |
| 0.0 | 0.1 | GO:1990637 | response to prolactin(GO:1990637) |
| 0.0 | 0.3 | GO:0019375 | galactosylceramide biosynthetic process(GO:0006682) galactolipid biosynthetic process(GO:0019375) |
| 0.0 | 0.7 | GO:0019800 | peptide cross-linking via chondroitin 4-sulfate glycosaminoglycan(GO:0019800) |
| 0.0 | 4.7 | GO:0007156 | homophilic cell adhesion via plasma membrane adhesion molecules(GO:0007156) |
| 0.0 | 0.1 | GO:0008065 | establishment of blood-nerve barrier(GO:0008065) |
| 0.0 | 0.4 | GO:0034384 | high-density lipoprotein particle clearance(GO:0034384) |
| 0.0 | 4.7 | GO:0007586 | digestion(GO:0007586) |
| 0.0 | 0.2 | GO:0042273 | ribosomal large subunit biogenesis(GO:0042273) |
| 0.0 | 0.3 | GO:0060484 | lung-associated mesenchyme development(GO:0060484) |
| 0.0 | 0.6 | GO:0006295 | nucleotide-excision repair, preincision complex stabilization(GO:0006293) nucleotide-excision repair, DNA incision, 3'-to lesion(GO:0006295) |
| 0.0 | 0.5 | GO:0035025 | positive regulation of Rho protein signal transduction(GO:0035025) |
| 0.0 | 0.3 | GO:0034505 | tooth mineralization(GO:0034505) |
| 0.0 | 1.0 | GO:0070979 | protein K11-linked ubiquitination(GO:0070979) |
| 0.0 | 0.1 | GO:0010513 | positive regulation of phosphatidylinositol biosynthetic process(GO:0010513) cellular response to temperature stimulus(GO:0071502) |
| 0.0 | 1.0 | GO:0000413 | protein peptidyl-prolyl isomerization(GO:0000413) |
| 0.0 | 2.1 | GO:0036498 | IRE1-mediated unfolded protein response(GO:0036498) |
| 0.0 | 0.3 | GO:0036148 | phosphatidylglycerol acyl-chain remodeling(GO:0036148) |
| 0.0 | 0.1 | GO:0014005 | microglia differentiation(GO:0014004) microglia development(GO:0014005) axon midline choice point recognition(GO:0016199) response to norepinephrine(GO:0071873) cellular response to norepinephrine stimulus(GO:0071874) |
| 0.0 | 0.2 | GO:0035721 | intraciliary retrograde transport(GO:0035721) |
| 0.0 | 0.9 | GO:0010107 | potassium ion import(GO:0010107) |
| 0.0 | 0.1 | GO:2000301 | negative regulation of synaptic vesicle exocytosis(GO:2000301) |
| 0.0 | 0.3 | GO:0016576 | histone dephosphorylation(GO:0016576) |
| 0.0 | 2.1 | GO:0031424 | keratinization(GO:0031424) |
| 0.0 | 0.1 | GO:0000290 | deadenylation-dependent decapping of nuclear-transcribed mRNA(GO:0000290) |
| 0.0 | 9.2 | GO:0042119 | neutrophil activation(GO:0042119) |
| 0.0 | 0.2 | GO:0043011 | myeloid dendritic cell differentiation(GO:0043011) |
| 0.0 | 0.6 | GO:1901998 | toxin transport(GO:1901998) |
| 0.0 | 0.1 | GO:0034201 | response to oleic acid(GO:0034201) |
| 0.0 | 0.7 | GO:0032784 | regulation of DNA-templated transcription, elongation(GO:0032784) |
| 0.0 | 1.1 | GO:0008285 | negative regulation of cell proliferation(GO:0008285) |
| 0.0 | 0.9 | GO:0002763 | positive regulation of myeloid leukocyte differentiation(GO:0002763) |
| 0.0 | 0.3 | GO:0030214 | hyaluronan catabolic process(GO:0030214) |
| 0.0 | 0.3 | GO:0016973 | poly(A)+ mRNA export from nucleus(GO:0016973) |
| 0.0 | 0.7 | GO:0007077 | mitotic nuclear envelope disassembly(GO:0007077) |
| 0.0 | 1.2 | GO:0000079 | regulation of cyclin-dependent protein serine/threonine kinase activity(GO:0000079) |
| 0.0 | 0.3 | GO:0021591 | ventricular system development(GO:0021591) |
| 0.0 | 0.7 | GO:0016445 | somatic diversification of immunoglobulins(GO:0016445) |
| 0.0 | 0.4 | GO:0050927 | positive regulation of positive chemotaxis(GO:0050927) |
| 0.0 | 0.8 | GO:0071260 | cellular response to mechanical stimulus(GO:0071260) |
| 0.0 | 0.2 | GO:0050651 | dermatan sulfate proteoglycan biosynthetic process(GO:0050651) |
| 0.0 | 0.5 | GO:0042267 | natural killer cell mediated cytotoxicity(GO:0042267) |
| 0.0 | 0.3 | GO:0033189 | response to vitamin A(GO:0033189) |
| 0.0 | 0.1 | GO:0006108 | malate metabolic process(GO:0006108) |
| 0.0 | 0.0 | GO:0010727 | negative regulation of hydrogen peroxide metabolic process(GO:0010727) |
| 0.0 | 0.2 | GO:0019373 | epoxygenase P450 pathway(GO:0019373) |
| 0.0 | 0.9 | GO:0098869 | cellular oxidant detoxification(GO:0098869) |
Gene overrepresentation in cellular_component category:
| Log-likelihood per target | Total log-likelihood | Term | Description |
|---|---|---|---|
| 0.9 | 4.7 | GO:0097179 | protease inhibitor complex(GO:0097179) |
| 0.7 | 3.4 | GO:0046696 | lipopolysaccharide receptor complex(GO:0046696) |
| 0.5 | 1.4 | GO:0008282 | ATP-sensitive potassium channel complex(GO:0008282) |
| 0.3 | 1.9 | GO:0030061 | mitochondrial crista(GO:0030061) |
| 0.3 | 1.0 | GO:0043625 | delta DNA polymerase complex(GO:0043625) |
| 0.2 | 3.3 | GO:0001673 | male germ cell nucleus(GO:0001673) |
| 0.2 | 1.0 | GO:0005726 | perichromatin fibrils(GO:0005726) |
| 0.2 | 1.5 | GO:0072687 | meiotic spindle(GO:0072687) |
| 0.1 | 0.7 | GO:0031205 | endoplasmic reticulum Sec complex(GO:0031205) |
| 0.1 | 3.9 | GO:0032982 | myosin filament(GO:0032982) |
| 0.1 | 2.1 | GO:0008290 | F-actin capping protein complex(GO:0008290) Flemming body(GO:0090543) |
| 0.1 | 0.9 | GO:0036020 | endolysosome membrane(GO:0036020) |
| 0.1 | 0.8 | GO:0097539 | ciliary transition fiber(GO:0097539) |
| 0.1 | 0.6 | GO:0009331 | glycerol-3-phosphate dehydrogenase complex(GO:0009331) |
| 0.1 | 1.2 | GO:0000243 | commitment complex(GO:0000243) |
| 0.1 | 0.6 | GO:1990316 | ATG1/ULK1 kinase complex(GO:1990316) |
| 0.1 | 2.0 | GO:0002080 | acrosomal membrane(GO:0002080) |
| 0.1 | 5.4 | GO:0030669 | clathrin-coated endocytic vesicle membrane(GO:0030669) |
| 0.1 | 1.4 | GO:0031932 | TORC2 complex(GO:0031932) |
| 0.1 | 8.4 | GO:0035578 | azurophil granule lumen(GO:0035578) |
| 0.1 | 1.8 | GO:0031231 | integral component of peroxisomal membrane(GO:0005779) intrinsic component of peroxisomal membrane(GO:0031231) |
| 0.1 | 2.3 | GO:0030673 | axolemma(GO:0030673) |
| 0.1 | 0.8 | GO:0043025 | neuronal cell body(GO:0043025) |
| 0.1 | 0.3 | GO:0045272 | plasma membrane respiratory chain complex I(GO:0045272) |
| 0.1 | 1.1 | GO:0031588 | nucleotide-activated protein kinase complex(GO:0031588) |
| 0.1 | 0.8 | GO:0036038 | MKS complex(GO:0036038) |
| 0.1 | 0.7 | GO:1990712 | HFE-transferrin receptor complex(GO:1990712) |
| 0.0 | 0.4 | GO:0005851 | eukaryotic translation initiation factor 2B complex(GO:0005851) |
| 0.0 | 2.2 | GO:0048786 | presynaptic active zone(GO:0048786) |
| 0.0 | 2.6 | GO:0000786 | nucleosome(GO:0000786) |
| 0.0 | 0.8 | GO:0005922 | connexon complex(GO:0005922) |
| 0.0 | 4.7 | GO:0001750 | photoreceptor outer segment(GO:0001750) |
| 0.0 | 0.4 | GO:0042587 | glycogen granule(GO:0042587) |
| 0.0 | 0.7 | GO:0000974 | Prp19 complex(GO:0000974) |
| 0.0 | 1.9 | GO:0005891 | voltage-gated calcium channel complex(GO:0005891) |
| 0.0 | 1.2 | GO:0042629 | mast cell granule(GO:0042629) |
| 0.0 | 5.6 | GO:0090575 | RNA polymerase II transcription factor complex(GO:0090575) |
| 0.0 | 1.2 | GO:0045095 | keratin filament(GO:0045095) |
| 0.0 | 1.0 | GO:0000407 | pre-autophagosomal structure(GO:0000407) |
| 0.0 | 1.9 | GO:0036126 | sperm flagellum(GO:0036126) |
| 0.0 | 0.3 | GO:0031362 | anchored component of external side of plasma membrane(GO:0031362) |
| 0.0 | 0.2 | GO:0032584 | growth cone membrane(GO:0032584) |
| 0.0 | 0.3 | GO:0000346 | transcription export complex(GO:0000346) |
| 0.0 | 0.2 | GO:0035869 | ciliary transition zone(GO:0035869) |
| 0.0 | 0.6 | GO:0031594 | neuromuscular junction(GO:0031594) |
| 0.0 | 1.7 | GO:0017053 | transcriptional repressor complex(GO:0017053) |
| 0.0 | 0.8 | GO:0031903 | peroxisomal membrane(GO:0005778) microbody membrane(GO:0031903) |
| 0.0 | 1.1 | GO:0005882 | intermediate filament(GO:0005882) |
| 0.0 | 1.0 | GO:0055038 | recycling endosome membrane(GO:0055038) |
| 0.0 | 0.1 | GO:0098554 | cytoplasmic side of endoplasmic reticulum membrane(GO:0098554) |
| 0.0 | 0.1 | GO:0097449 | astrocyte projection(GO:0097449) |
| 0.0 | 0.3 | GO:0030057 | desmosome(GO:0030057) |
Gene overrepresentation in molecular_function category:
| Log-likelihood per target | Total log-likelihood | Term | Description |
|---|---|---|---|
| 1.2 | 4.7 | GO:0004666 | prostaglandin-endoperoxide synthase activity(GO:0004666) |
| 1.1 | 3.4 | GO:0016019 | peptidoglycan receptor activity(GO:0016019) |
| 0.9 | 3.6 | GO:0035276 | aldehyde oxidase activity(GO:0004031) ethanol binding(GO:0035276) |
| 0.6 | 1.8 | GO:0080019 | fatty-acyl-CoA reductase (alcohol-forming) activity(GO:0080019) |
| 0.5 | 4.2 | GO:0019763 | immunoglobulin receptor activity(GO:0019763) |
| 0.5 | 3.6 | GO:0047894 | flavonol 3-sulfotransferase activity(GO:0047894) steroid sulfotransferase activity(GO:0050294) |
| 0.4 | 3.1 | GO:0008454 | alpha-1,3-mannosylglycoprotein 4-beta-N-acetylglucosaminyltransferase activity(GO:0008454) |
| 0.4 | 1.2 | GO:0030627 | pre-mRNA 5'-splice site binding(GO:0030627) |
| 0.3 | 4.7 | GO:0050700 | CARD domain binding(GO:0050700) |
| 0.3 | 1.6 | GO:0008420 | CTD phosphatase activity(GO:0008420) |
| 0.3 | 1.3 | GO:0005477 | pyruvate secondary active transmembrane transporter activity(GO:0005477) |
| 0.3 | 1.8 | GO:0015057 | thrombin receptor activity(GO:0015057) |
| 0.3 | 0.9 | GO:0003870 | 5-aminolevulinate synthase activity(GO:0003870) N-succinyltransferase activity(GO:0016749) |
| 0.3 | 0.9 | GO:0005174 | CD40 receptor binding(GO:0005174) |
| 0.3 | 3.1 | GO:0008061 | chitinase activity(GO:0004568) chitin binding(GO:0008061) |
| 0.3 | 1.4 | GO:0052740 | 1-acyl-2-lysophosphatidylserine acylhydrolase activity(GO:0052740) |
| 0.3 | 3.7 | GO:0031432 | titin binding(GO:0031432) |
| 0.3 | 2.9 | GO:0033038 | bitter taste receptor activity(GO:0033038) |
| 0.3 | 3.1 | GO:0019864 | IgG binding(GO:0019864) |
| 0.2 | 0.7 | GO:0005260 | channel-conductance-controlling ATPase activity(GO:0005260) |
| 0.2 | 1.4 | GO:0016812 | hydrolase activity, acting on carbon-nitrogen (but not peptide) bonds, in cyclic amides(GO:0016812) |
| 0.2 | 5.3 | GO:0038187 | signaling pattern recognition receptor activity(GO:0008329) pattern recognition receptor activity(GO:0038187) |
| 0.2 | 2.7 | GO:0001608 | G-protein coupled nucleotide receptor activity(GO:0001608) G-protein coupled purinergic nucleotide receptor activity(GO:0045028) |
| 0.2 | 1.4 | GO:0043225 | anion transmembrane-transporting ATPase activity(GO:0043225) |
| 0.2 | 1.0 | GO:0004839 | ubiquitin activating enzyme activity(GO:0004839) |
| 0.2 | 0.9 | GO:0005134 | interleukin-2 receptor binding(GO:0005134) |
| 0.2 | 0.5 | GO:0003829 | beta-1,3-galactosyl-O-glycosyl-glycoprotein beta-1,6-N-acetylglucosaminyltransferase activity(GO:0003829) |
| 0.1 | 0.6 | GO:0052590 | sn-glycerol-3-phosphate:ubiquinone oxidoreductase activity(GO:0052590) sn-glycerol-3-phosphate:ubiquinone-8 oxidoreductase activity(GO:0052591) |
| 0.1 | 0.6 | GO:0008449 | N-acetylglucosamine-6-sulfatase activity(GO:0008449) |
| 0.1 | 0.7 | GO:0016300 | tRNA (uracil) methyltransferase activity(GO:0016300) |
| 0.1 | 1.8 | GO:0005132 | type I interferon receptor binding(GO:0005132) |
| 0.1 | 1.2 | GO:0005176 | ErbB-2 class receptor binding(GO:0005176) |
| 0.1 | 2.3 | GO:0009931 | calcium-dependent protein serine/threonine kinase activity(GO:0009931) |
| 0.1 | 0.4 | GO:0000035 | acyl binding(GO:0000035) phosphopantetheine binding(GO:0031177) |
| 0.1 | 0.4 | GO:0016899 | oxidoreductase activity, acting on the CH-OH group of donors, oxygen as acceptor(GO:0016899) |
| 0.1 | 0.3 | GO:0034041 | sterol-transporting ATPase activity(GO:0034041) |
| 0.1 | 0.7 | GO:0005025 | transforming growth factor beta receptor activity, type I(GO:0005025) |
| 0.1 | 0.8 | GO:0003876 | AMP deaminase activity(GO:0003876) adenosine-phosphate deaminase activity(GO:0047623) |
| 0.1 | 1.0 | GO:0034056 | estrogen response element binding(GO:0034056) |
| 0.1 | 0.5 | GO:0004447 | iodide peroxidase activity(GO:0004447) |
| 0.1 | 0.5 | GO:0035800 | deubiquitinase activator activity(GO:0035800) |
| 0.1 | 1.7 | GO:0017127 | cholesterol transporter activity(GO:0017127) |
| 0.1 | 0.5 | GO:0098821 | BMP receptor activity(GO:0098821) |
| 0.1 | 0.4 | GO:0004105 | choline-phosphate cytidylyltransferase activity(GO:0004105) |
| 0.1 | 1.8 | GO:0005337 | nucleoside transmembrane transporter activity(GO:0005337) |
| 0.1 | 0.2 | GO:0015018 | galactosylgalactosylxylosylprotein 3-beta-glucuronosyltransferase activity(GO:0015018) |
| 0.1 | 0.2 | GO:0015403 | thiamine transmembrane transporter activity(GO:0015234) thiamine uptake transmembrane transporter activity(GO:0015403) |
| 0.1 | 0.4 | GO:0033695 | oxidoreductase activity, acting on CH or CH2 groups, quinone or similar compound as acceptor(GO:0033695) caffeine oxidase activity(GO:0034875) |
| 0.1 | 0.7 | GO:0048018 | receptor agonist activity(GO:0048018) |
| 0.1 | 0.4 | GO:0052656 | branched-chain-amino-acid transaminase activity(GO:0004084) L-leucine transaminase activity(GO:0052654) L-valine transaminase activity(GO:0052655) L-isoleucine transaminase activity(GO:0052656) |
| 0.1 | 0.3 | GO:0061714 | folic acid receptor activity(GO:0061714) |
| 0.1 | 0.9 | GO:0000014 | single-stranded DNA endodeoxyribonuclease activity(GO:0000014) |
| 0.1 | 5.3 | GO:0004722 | protein serine/threonine phosphatase activity(GO:0004722) |
| 0.1 | 0.5 | GO:0070915 | lysophosphatidic acid receptor activity(GO:0070915) |
| 0.1 | 1.4 | GO:0043325 | phosphatidylinositol-3,4-bisphosphate binding(GO:0043325) |
| 0.1 | 1.1 | GO:0008603 | cAMP-dependent protein kinase inhibitor activity(GO:0004862) cAMP-dependent protein kinase regulator activity(GO:0008603) |
| 0.1 | 1.4 | GO:0046933 | proton-transporting ATP synthase activity, rotational mechanism(GO:0046933) |
| 0.1 | 1.2 | GO:0008191 | metalloendopeptidase inhibitor activity(GO:0008191) |
| 0.1 | 1.1 | GO:0017081 | chloride channel regulator activity(GO:0017081) |
| 0.0 | 1.5 | GO:0071889 | 14-3-3 protein binding(GO:0071889) |
| 0.0 | 2.5 | GO:0005504 | fatty acid binding(GO:0005504) |
| 0.0 | 0.8 | GO:0070513 | death domain binding(GO:0070513) |
| 0.0 | 0.3 | GO:0030021 | extracellular matrix structural constituent conferring compression resistance(GO:0030021) structural constituent of tooth enamel(GO:0030345) |
| 0.0 | 7.9 | GO:0017137 | Rab GTPase binding(GO:0017137) |
| 0.0 | 1.0 | GO:0001965 | G-protein alpha-subunit binding(GO:0001965) |
| 0.0 | 0.2 | GO:0004830 | tryptophan-tRNA ligase activity(GO:0004830) |
| 0.0 | 0.3 | GO:0003945 | N-acetyllactosamine synthase activity(GO:0003945) |
| 0.0 | 2.1 | GO:0004984 | olfactory receptor activity(GO:0004984) |
| 0.0 | 0.2 | GO:0004090 | carbonyl reductase (NADPH) activity(GO:0004090) |
| 0.0 | 2.0 | GO:0015026 | coreceptor activity(GO:0015026) |
| 0.0 | 8.6 | GO:0005125 | cytokine activity(GO:0005125) |
| 0.0 | 1.0 | GO:0004602 | glutathione peroxidase activity(GO:0004602) |
| 0.0 | 1.0 | GO:0003887 | DNA-directed DNA polymerase activity(GO:0003887) |
| 0.0 | 1.0 | GO:0005528 | macrolide binding(GO:0005527) FK506 binding(GO:0005528) |
| 0.0 | 0.6 | GO:0042923 | neuropeptide binding(GO:0042923) |
| 0.0 | 1.1 | GO:0030552 | cAMP binding(GO:0030552) |
| 0.0 | 0.6 | GO:0004550 | nucleoside diphosphate kinase activity(GO:0004550) |
| 0.0 | 0.3 | GO:0000146 | microfilament motor activity(GO:0000146) |
| 0.0 | 0.1 | GO:0008332 | low voltage-gated calcium channel activity(GO:0008332) |
| 0.0 | 0.1 | GO:0072542 | protein phosphatase activator activity(GO:0072542) |
| 0.0 | 0.4 | GO:0016493 | C-C chemokine receptor activity(GO:0016493) |
| 0.0 | 0.8 | GO:0004709 | MAP kinase kinase kinase activity(GO:0004709) |
| 0.0 | 1.0 | GO:0061631 | ubiquitin conjugating enzyme activity(GO:0061631) |
| 0.0 | 0.3 | GO:0030215 | semaphorin receptor binding(GO:0030215) |
| 0.0 | 0.7 | GO:0004033 | aldo-keto reductase (NADP) activity(GO:0004033) |
| 0.0 | 0.5 | GO:0001102 | RNA polymerase II activating transcription factor binding(GO:0001102) |
| 0.0 | 6.9 | GO:0004930 | G-protein coupled receptor activity(GO:0004930) |
| 0.0 | 0.6 | GO:0016922 | ligand-dependent nuclear receptor binding(GO:0016922) |
| 0.0 | 0.7 | GO:0005245 | voltage-gated calcium channel activity(GO:0005245) |
| 0.0 | 0.5 | GO:0005540 | hyaluronic acid binding(GO:0005540) |
| 0.0 | 0.3 | GO:0003746 | translation elongation factor activity(GO:0003746) |
| 0.0 | 0.6 | GO:0004364 | glutathione transferase activity(GO:0004364) |
| 0.0 | 2.8 | GO:0005200 | structural constituent of cytoskeleton(GO:0005200) |
| 0.0 | 0.2 | GO:0070330 | aromatase activity(GO:0070330) |
| 0.0 | 0.3 | GO:0051537 | 2 iron, 2 sulfur cluster binding(GO:0051537) |
| 0.0 | 0.2 | GO:0008569 | ATP-dependent microtubule motor activity, minus-end-directed(GO:0008569) |
| 0.0 | 0.3 | GO:0008157 | protein phosphatase 1 binding(GO:0008157) |
| 0.0 | 1.6 | GO:0001078 | transcriptional repressor activity, RNA polymerase II core promoter proximal region sequence-specific binding(GO:0001078) |
| 0.0 | 0.1 | GO:0050072 | m7G(5')pppN diphosphatase activity(GO:0050072) |
| 0.0 | 1.5 | GO:0005179 | hormone activity(GO:0005179) |
| 0.0 | 0.6 | GO:0004003 | ATP-dependent DNA helicase activity(GO:0004003) |
| 0.0 | 0.7 | GO:0070888 | E-box binding(GO:0070888) |
| 0.0 | 0.6 | GO:0017112 | Rab guanyl-nucleotide exchange factor activity(GO:0017112) |
| 0.0 | 0.1 | GO:0016615 | malate dehydrogenase activity(GO:0016615) |
| 0.0 | 6.6 | GO:0001228 | transcriptional activator activity, RNA polymerase II transcription regulatory region sequence-specific binding(GO:0001228) |
| 0.0 | 2.1 | GO:0051015 | actin filament binding(GO:0051015) |
| 0.0 | 0.1 | GO:0051425 | PTB domain binding(GO:0051425) |
| 0.0 | 0.3 | GO:0004181 | metallocarboxypeptidase activity(GO:0004181) |
Gene overrepresentation in C2:CP category:
| Log-likelihood per target | Total log-likelihood | Term | Description |
|---|---|---|---|
| 0.2 | 4.7 | PID ANTHRAX PATHWAY | Cellular roles of Anthrax toxin |
| 0.1 | 1.8 | PID THROMBIN PAR4 PATHWAY | PAR4-mediated thrombin signaling events |
| 0.1 | 3.4 | PID TOLL ENDOGENOUS PATHWAY | Endogenous TLR signaling |
| 0.1 | 1.6 | PID SMAD2 3PATHWAY | Regulation of cytoplasmic and nuclear SMAD2/3 signaling |
| 0.0 | 2.3 | PID IL12 STAT4 PATHWAY | IL12 signaling mediated by STAT4 |
| 0.0 | 2.3 | ST P38 MAPK PATHWAY | p38 MAPK Pathway |
| 0.0 | 4.9 | PID E2F PATHWAY | E2F transcription factor network |
| 0.0 | 0.7 | PID P38 MKK3 6PATHWAY | p38 MAPK signaling pathway |
| 0.0 | 1.2 | PID ERBB NETWORK PATHWAY | ErbB receptor signaling network |
| 0.0 | 1.9 | PID CD8 TCR DOWNSTREAM PATHWAY | Downstream signaling in naïve CD8+ T cells |
| 0.0 | 1.0 | PID NFKAPPAB CANONICAL PATHWAY | Canonical NF-kappaB pathway |
| 0.0 | 2.5 | PID MTOR 4PATHWAY | mTOR signaling pathway |
| 0.0 | 0.9 | PID CD40 PATHWAY | CD40/CD40L signaling |
| 0.0 | 0.5 | PID LPA4 PATHWAY | LPA4-mediated signaling events |
| 0.0 | 1.5 | NABA PROTEOGLYCANS | Genes encoding proteoglycans |
| 0.0 | 1.2 | PID BMP PATHWAY | BMP receptor signaling |
| 0.0 | 0.8 | PID HIV NEF PATHWAY | HIV-1 Nef: Negative effector of Fas and TNF-alpha |
| 0.0 | 0.3 | PID PI3KCI AKT PATHWAY | Class I PI3K signaling events mediated by Akt |
| 0.0 | 1.1 | PID ARF6 PATHWAY | Arf6 signaling events |
| 0.0 | 1.9 | PID MYC REPRESS PATHWAY | Validated targets of C-MYC transcriptional repression |
| 0.0 | 3.3 | NABA ECM AFFILIATED | Genes encoding proteins affiliated structurally or functionally to extracellular matrix proteins |
| 0.0 | 1.3 | PID IL4 2PATHWAY | IL4-mediated signaling events |
| 0.0 | 0.8 | PID ATR PATHWAY | ATR signaling pathway |
| 0.0 | 1.0 | PID AR TF PATHWAY | Regulation of Androgen receptor activity |
Gene overrepresentation in C2:CP:REACTOME category:
| Log-likelihood per target | Total log-likelihood | Term | Description |
|---|---|---|---|
| 0.4 | 3.2 | REACTOME ETHANOL OXIDATION | Genes involved in Ethanol oxidation |
| 0.3 | 3.4 | REACTOME IKK COMPLEX RECRUITMENT MEDIATED BY RIP1 | Genes involved in IKK complex recruitment mediated by RIP1 |
| 0.3 | 4.8 | REACTOME THE NLRP3 INFLAMMASOME | Genes involved in The NLRP3 inflammasome |
| 0.2 | 3.3 | REACTOME P2Y RECEPTORS | Genes involved in P2Y receptors |
| 0.1 | 3.4 | REACTOME N GLYCAN ANTENNAE ELONGATION | Genes involved in N-Glycan antennae elongation |
| 0.1 | 2.5 | REACTOME DOPAMINE NEUROTRANSMITTER RELEASE CYCLE | Genes involved in Dopamine Neurotransmitter Release Cycle |
| 0.1 | 3.6 | REACTOME CYTOSOLIC SULFONATION OF SMALL MOLECULES | Genes involved in Cytosolic sulfonation of small molecules |
| 0.1 | 2.2 | REACTOME DESTABILIZATION OF MRNA BY BRF1 | Genes involved in Destabilization of mRNA by Butyrate Response Factor 1 (BRF1) |
| 0.1 | 1.7 | REACTOME ACYL CHAIN REMODELLING OF PS | Genes involved in Acyl chain remodelling of PS |
| 0.1 | 3.7 | REACTOME CD28 DEPENDENT PI3K AKT SIGNALING | Genes involved in CD28 dependent PI3K/Akt signaling |
| 0.1 | 1.3 | REACTOME BILE SALT AND ORGANIC ANION SLC TRANSPORTERS | Genes involved in Bile salt and organic anion SLC transporters |
| 0.1 | 1.0 | REACTOME REMOVAL OF THE FLAP INTERMEDIATE FROM THE C STRAND | Genes involved in Removal of the Flap Intermediate from the C-strand |
| 0.1 | 3.0 | REACTOME ABC FAMILY PROTEINS MEDIATED TRANSPORT | Genes involved in ABC-family proteins mediated transport |
| 0.1 | 4.7 | REACTOME CROSS PRESENTATION OF SOLUBLE EXOGENOUS ANTIGENS ENDOSOMES | Genes involved in Cross-presentation of soluble exogenous antigens (endosomes) |
| 0.1 | 2.3 | REACTOME TRAF6 MEDIATED IRF7 ACTIVATION | Genes involved in TRAF6 mediated IRF7 activation |
| 0.1 | 4.5 | REACTOME PHASE1 FUNCTIONALIZATION OF COMPOUNDS | Genes involved in Phase 1 - Functionalization of compounds |
| 0.1 | 1.2 | REACTOME DOWNREGULATION OF ERBB2 ERBB3 SIGNALING | Genes involved in Downregulation of ERBB2:ERBB3 signaling |
| 0.1 | 3.7 | REACTOME STRIATED MUSCLE CONTRACTION | Genes involved in Striated Muscle Contraction |
| 0.0 | 0.8 | REACTOME GAP JUNCTION ASSEMBLY | Genes involved in Gap junction assembly |
| 0.0 | 1.7 | REACTOME SIGNALING BY BMP | Genes involved in Signaling by BMP |
| 0.0 | 1.8 | REACTOME THROMBIN SIGNALLING THROUGH PROTEINASE ACTIVATED RECEPTORS PARS | Genes involved in Thrombin signalling through proteinase activated receptors (PARs) |
| 0.0 | 1.9 | REACTOME OLFACTORY SIGNALING PATHWAY | Genes involved in Olfactory Signaling Pathway |
| 0.0 | 1.8 | REACTOME TRANSPORT OF VITAMINS NUCLEOSIDES AND RELATED MOLECULES | Genes involved in Transport of vitamins, nucleosides, and related molecules |
| 0.0 | 0.1 | REACTOME SEROTONIN RECEPTORS | Genes involved in Serotonin receptors |
| 0.0 | 0.9 | REACTOME METABOLISM OF PORPHYRINS | Genes involved in Metabolism of porphyrins |
| 0.0 | 6.3 | REACTOME G ALPHA I SIGNALLING EVENTS | Genes involved in G alpha (i) signalling events |
| 0.0 | 0.5 | REACTOME DSCAM INTERACTIONS | Genes involved in DSCAM interactions |
| 0.0 | 0.8 | REACTOME REGULATION OF GENE EXPRESSION IN BETA CELLS | Genes involved in Regulation of gene expression in beta cells |
| 0.0 | 1.0 | REACTOME SIGNALING BY FGFR1 FUSION MUTANTS | Genes involved in Signaling by FGFR1 fusion mutants |
| 0.0 | 0.5 | REACTOME STEROID HORMONES | Genes involved in Steroid hormones |
| 0.0 | 0.9 | REACTOME IL RECEPTOR SHC SIGNALING | Genes involved in Interleukin receptor SHC signaling |
| 0.0 | 0.4 | REACTOME HORMONE LIGAND BINDING RECEPTORS | Genes involved in Hormone ligand-binding receptors |
| 0.0 | 0.7 | REACTOME PURINE SALVAGE | Genes involved in Purine salvage |
| 0.0 | 1.6 | REACTOME ACTIVATION OF CHAPERONE GENES BY XBP1S | Genes involved in Activation of Chaperone Genes by XBP1(S) |
| 0.0 | 0.7 | REACTOME REGULATION OF GLUCOKINASE BY GLUCOKINASE REGULATORY PROTEIN | Genes involved in Regulation of Glucokinase by Glucokinase Regulatory Protein |
| 0.0 | 0.2 | REACTOME PLATELET SENSITIZATION BY LDL | Genes involved in Platelet sensitization by LDL |
| 0.0 | 0.3 | REACTOME APOPTOTIC CLEAVAGE OF CELL ADHESION PROTEINS | Genes involved in Apoptotic cleavage of cell adhesion proteins |
| 0.0 | 0.3 | REACTOME APOPTOSIS INDUCED DNA FRAGMENTATION | Genes involved in Apoptosis induced DNA fragmentation |
| 0.0 | 0.4 | REACTOME BRANCHED CHAIN AMINO ACID CATABOLISM | Genes involved in Branched-chain amino acid catabolism |
| 0.0 | 0.4 | REACTOME SYNTHESIS OF PC | Genes involved in Synthesis of PC |
| 0.0 | 1.8 | REACTOME G ALPHA S SIGNALLING EVENTS | Genes involved in G alpha (s) signalling events |
| 0.0 | 0.1 | REACTOME SPRY REGULATION OF FGF SIGNALING | Genes involved in Spry regulation of FGF signaling |
| 0.0 | 0.4 | REACTOME CHOLESTEROL BIOSYNTHESIS | Genes involved in Cholesterol biosynthesis |
| 0.0 | 1.7 | REACTOME TOLL RECEPTOR CASCADES | Genes involved in Toll Receptor Cascades |
| 0.0 | 0.3 | REACTOME HYALURONAN UPTAKE AND DEGRADATION | Genes involved in Hyaluronan uptake and degradation |
| 0.0 | 0.3 | REACTOME SYNTHESIS OF GLYCOSYLPHOSPHATIDYLINOSITOL GPI | Genes involved in Synthesis of glycosylphosphatidylinositol (GPI) |
| 0.0 | 1.1 | REACTOME MEIOTIC RECOMBINATION | Genes involved in Meiotic Recombination |
| 0.0 | 0.5 | REACTOME O LINKED GLYCOSYLATION OF MUCINS | Genes involved in O-linked glycosylation of mucins |