Project
GNF SymAtlas + NCI-60 cancer cell lines, comparison of cancers vs non-cancers, human (Su, 2004; Ross, 2000)
Navigation
Downloads
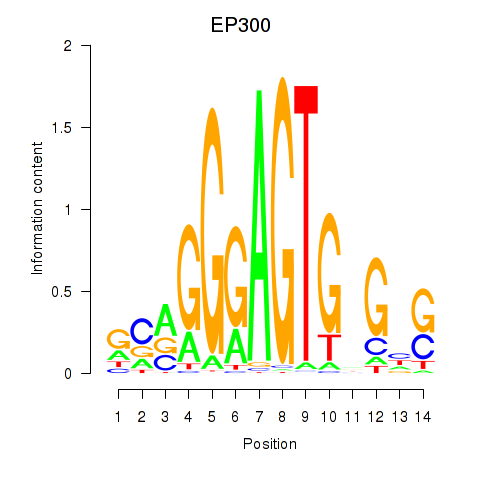
Results for EP300
Z-value: 0.04
Motif logo
Transcription factors associated with EP300
| Gene Symbol | Gene ID | Gene Info |
|---|---|---|
|
EP300
|
ENSG00000100393.9 | E1A binding protein p300 |
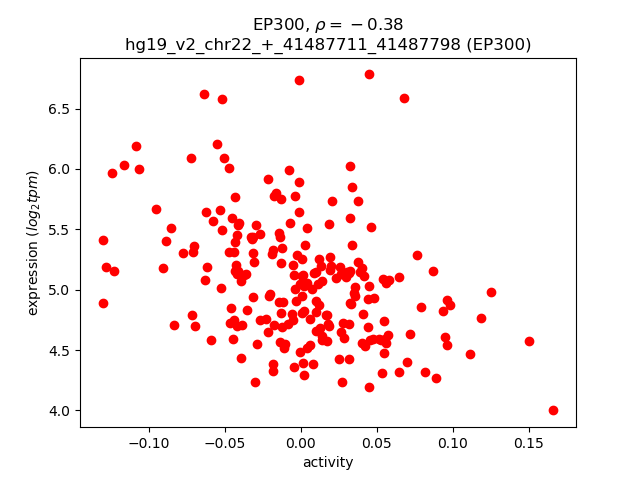
Activity-expression correlation:
| Gene | Promoter | Pearson corr. coef. | P-value | Plot |
|---|---|---|---|---|
| EP300 | hg19_v2_chr22_+_41487711_41487798 | -0.38 | 9.1e-09 | Click! |
Activity profile of EP300 motif
Sorted Z-values of EP300 motif
| Promoter | Log-likelihood | Transcript | Gene | Gene Info |
|---|---|---|---|---|
| chr12_+_6308881 | 18.70 |
ENST00000382518.1
ENST00000536586.1 |
CD9
|
CD9 molecule |
| chrX_-_140271249 | 17.14 |
ENST00000370526.2
|
LDOC1
|
leucine zipper, down-regulated in cancer 1 |
| chr8_+_30300119 | 17.03 |
ENST00000520191.1
|
RBPMS
|
RNA binding protein with multiple splicing |
| chr14_-_69445968 | 16.35 |
ENST00000438964.2
|
ACTN1
|
actinin, alpha 1 |
| chr1_+_10003486 | 16.21 |
ENST00000403197.1
ENST00000377205.1 |
NMNAT1
|
nicotinamide nucleotide adenylyltransferase 1 |
| chr2_-_110371720 | 15.11 |
ENST00000356688.4
|
SEPT10
|
septin 10 |
| chr12_+_6309517 | 14.77 |
ENST00000382519.4
ENST00000009180.4 |
CD9
|
CD9 molecule |
| chr14_-_69445793 | 14.56 |
ENST00000538545.2
ENST00000394419.4 |
ACTN1
|
actinin, alpha 1 |
| chr14_-_69446034 | 14.48 |
ENST00000193403.6
|
ACTN1
|
actinin, alpha 1 |
| chr11_-_46722117 | 13.37 |
ENST00000311956.4
|
ARHGAP1
|
Rho GTPase activating protein 1 |
| chr16_+_66400533 | 12.75 |
ENST00000341529.3
|
CDH5
|
cadherin 5, type 2 (vascular endothelium) |
| chr14_+_105939276 | 12.66 |
ENST00000483017.3
|
CRIP2
|
cysteine-rich protein 2 |
| chr2_-_110371777 | 12.19 |
ENST00000397712.2
|
SEPT10
|
septin 10 |
| chrX_+_134166333 | 11.63 |
ENST00000257013.7
|
FAM127A
|
family with sequence similarity 127, member A |
| chr2_+_46524537 | 11.58 |
ENST00000263734.3
|
EPAS1
|
endothelial PAS domain protein 1 |
| chr2_+_36582857 | 11.14 |
ENST00000280527.2
|
CRIM1
|
cysteine rich transmembrane BMP regulator 1 (chordin-like) |
| chr2_+_201171242 | 11.06 |
ENST00000360760.5
|
SPATS2L
|
spermatogenesis associated, serine-rich 2-like |
| chr10_-_126849588 | 10.67 |
ENST00000411419.2
|
CTBP2
|
C-terminal binding protein 2 |
| chr2_+_201171372 | 10.12 |
ENST00000409140.3
|
SPATS2L
|
spermatogenesis associated, serine-rich 2-like |
| chr2_-_110371412 | 9.99 |
ENST00000415095.1
ENST00000334001.6 ENST00000437928.1 ENST00000493445.1 ENST00000397714.2 ENST00000461295.1 |
SEPT10
|
septin 10 |
| chr3_-_149093499 | 9.97 |
ENST00000472441.1
|
TM4SF1
|
transmembrane 4 L six family member 1 |
| chrX_+_23685653 | 9.64 |
ENST00000379331.3
|
PRDX4
|
peroxiredoxin 4 |
| chr17_+_72427477 | 9.34 |
ENST00000342648.5
ENST00000481232.1 |
GPRC5C
|
G protein-coupled receptor, family C, group 5, member C |
| chr2_+_201171064 | 9.22 |
ENST00000451764.2
|
SPATS2L
|
spermatogenesis associated, serine-rich 2-like |
| chrX_+_23685563 | 9.11 |
ENST00000379341.4
|
PRDX4
|
peroxiredoxin 4 |
| chr8_-_134309335 | 8.87 |
ENST00000522890.1
ENST00000323851.7 ENST00000518176.1 ENST00000354944.5 ENST00000537882.1 ENST00000522476.1 ENST00000518066.1 ENST00000521544.1 ENST00000518480.1 ENST00000523892.1 |
NDRG1
|
N-myc downstream regulated 1 |
| chr1_-_95007193 | 8.28 |
ENST00000370207.4
ENST00000334047.7 |
F3
|
coagulation factor III (thromboplastin, tissue factor) |
| chr13_-_40177261 | 8.25 |
ENST00000379589.3
|
LHFP
|
lipoma HMGIC fusion partner |
| chr7_+_128470431 | 8.15 |
ENST00000325888.8
ENST00000346177.6 |
FLNC
|
filamin C, gamma |
| chr19_+_16187085 | 8.07 |
ENST00000300933.4
|
TPM4
|
tropomyosin 4 |
| chr21_-_46293644 | 8.02 |
ENST00000330938.3
|
PTTG1IP
|
pituitary tumor-transforming 1 interacting protein |
| chr8_-_134309823 | 7.99 |
ENST00000414097.2
|
NDRG1
|
N-myc downstream regulated 1 |
| chr14_+_23340822 | 7.92 |
ENST00000359591.4
|
LRP10
|
low density lipoprotein receptor-related protein 10 |
| chr16_+_69373323 | 7.71 |
ENST00000254940.5
|
NIP7
|
NIP7, nucleolar pre-rRNA processing protein |
| chr5_-_39425290 | 7.67 |
ENST00000545653.1
|
DAB2
|
Dab, mitogen-responsive phosphoprotein, homolog 2 (Drosophila) |
| chr2_+_110371905 | 7.67 |
ENST00000356454.3
|
SOWAHC
|
sosondowah ankyrin repeat domain family member C |
| chr5_-_39425222 | 7.59 |
ENST00000320816.6
|
DAB2
|
Dab, mitogen-responsive phosphoprotein, homolog 2 (Drosophila) |
| chr21_-_46293586 | 7.55 |
ENST00000445724.2
ENST00000397887.3 |
PTTG1IP
|
pituitary tumor-transforming 1 interacting protein |
| chr3_+_171758344 | 7.52 |
ENST00000336824.4
ENST00000423424.1 |
FNDC3B
|
fibronectin type III domain containing 3B |
| chr8_+_15397732 | 7.51 |
ENST00000382020.4
ENST00000506802.1 ENST00000509380.1 ENST00000503731.1 |
TUSC3
|
tumor suppressor candidate 3 |
| chrX_+_135229600 | 7.03 |
ENST00000370690.3
|
FHL1
|
four and a half LIM domains 1 |
| chr17_+_72426891 | 7.02 |
ENST00000392627.1
|
GPRC5C
|
G protein-coupled receptor, family C, group 5, member C |
| chr10_-_81205373 | 6.87 |
ENST00000372336.3
|
ZCCHC24
|
zinc finger, CCHC domain containing 24 |
| chr6_+_3000057 | 6.81 |
ENST00000397717.2
|
NQO2
|
NAD(P)H dehydrogenase, quinone 2 |
| chr2_-_99224915 | 6.76 |
ENST00000328709.3
ENST00000409997.1 |
COA5
|
cytochrome c oxidase assembly factor 5 |
| chr4_-_186456766 | 6.75 |
ENST00000284771.6
|
PDLIM3
|
PDZ and LIM domain 3 |
| chr4_-_186456652 | 6.65 |
ENST00000284767.5
ENST00000284770.5 |
PDLIM3
|
PDZ and LIM domain 3 |
| chr17_+_37844331 | 6.53 |
ENST00000578199.1
ENST00000406381.2 |
ERBB2
|
v-erb-b2 avian erythroblastic leukemia viral oncogene homolog 2 |
| chr1_-_22263790 | 6.42 |
ENST00000374695.3
|
HSPG2
|
heparan sulfate proteoglycan 2 |
| chr9_+_19049372 | 6.38 |
ENST00000380527.1
|
RRAGA
|
Ras-related GTP binding A |
| chr11_+_46402583 | 6.34 |
ENST00000359803.3
|
MDK
|
midkine (neurite growth-promoting factor 2) |
| chr6_+_2988847 | 6.28 |
ENST00000380472.3
ENST00000605901.1 ENST00000454015.1 |
NQO2
LINC01011
|
NAD(P)H dehydrogenase, quinone 2 long intergenic non-protein coding RNA 1011 |
| chr3_+_105086056 | 6.08 |
ENST00000472644.2
|
ALCAM
|
activated leukocyte cell adhesion molecule |
| chr11_+_46403194 | 6.03 |
ENST00000395569.4
ENST00000395566.4 |
MDK
|
midkine (neurite growth-promoting factor 2) |
| chr15_-_73925651 | 6.02 |
ENST00000545878.1
ENST00000287226.8 ENST00000345330.4 |
NPTN
|
neuroplastin |
| chr16_+_66968343 | 5.99 |
ENST00000417689.1
ENST00000561697.1 ENST00000317091.4 ENST00000566182.1 |
CES2
|
carboxylesterase 2 |
| chr3_+_105085734 | 5.97 |
ENST00000306107.5
|
ALCAM
|
activated leukocyte cell adhesion molecule |
| chrX_+_135229559 | 5.92 |
ENST00000394155.2
|
FHL1
|
four and a half LIM domains 1 |
| chr18_+_9334755 | 5.89 |
ENST00000262120.5
|
TWSG1
|
twisted gastrulation BMP signaling modulator 1 |
| chr11_+_46403303 | 5.74 |
ENST00000407067.1
ENST00000395565.1 |
MDK
|
midkine (neurite growth-promoting factor 2) |
| chr12_-_105629852 | 5.73 |
ENST00000551662.1
ENST00000553097.1 |
APPL2
|
adaptor protein, phosphotyrosine interaction, PH domain and leucine zipper containing 2 |
| chr13_-_114567034 | 5.56 |
ENST00000327773.6
ENST00000357389.3 |
GAS6
|
growth arrest-specific 6 |
| chr6_+_43738444 | 5.55 |
ENST00000324450.6
ENST00000417285.2 ENST00000413642.3 ENST00000372055.4 ENST00000482630.2 ENST00000425836.2 ENST00000372064.4 ENST00000372077.4 ENST00000519767.1 |
VEGFA
|
vascular endothelial growth factor A |
| chr8_+_144816303 | 5.53 |
ENST00000533004.1
|
FAM83H-AS1
|
FAM83H antisense RNA 1 (head to head) |
| chr2_+_25015968 | 5.52 |
ENST00000380834.2
ENST00000473706.1 |
CENPO
|
centromere protein O |
| chr17_-_79269067 | 5.51 |
ENST00000288439.5
ENST00000374759.3 |
SLC38A10
|
solute carrier family 38, member 10 |
| chr2_+_25016282 | 5.34 |
ENST00000260662.1
|
CENPO
|
centromere protein O |
| chr6_-_10415218 | 5.32 |
ENST00000466073.1
ENST00000498450.1 |
TFAP2A
|
transcription factor AP-2 alpha (activating enhancer binding protein 2 alpha) |
| chr2_+_192109911 | 5.30 |
ENST00000418908.1
ENST00000339514.4 ENST00000392318.3 |
MYO1B
|
myosin IB |
| chr22_-_43042968 | 5.29 |
ENST00000407623.3
ENST00000396303.3 ENST00000438270.1 |
CYB5R3
|
cytochrome b5 reductase 3 |
| chr2_+_192110199 | 5.17 |
ENST00000304164.4
|
MYO1B
|
myosin IB |
| chr1_-_20812690 | 5.16 |
ENST00000375078.3
|
CAMK2N1
|
calcium/calmodulin-dependent protein kinase II inhibitor 1 |
| chr11_+_46402482 | 5.14 |
ENST00000441869.1
|
MDK
|
midkine (neurite growth-promoting factor 2) |
| chr1_-_94079648 | 5.06 |
ENST00000370247.3
|
BCAR3
|
breast cancer anti-estrogen resistance 3 |
| chr10_-_69835099 | 5.04 |
ENST00000373700.4
|
HERC4
|
HECT and RLD domain containing E3 ubiquitin protein ligase 4 |
| chr11_+_46402744 | 5.01 |
ENST00000533952.1
|
MDK
|
midkine (neurite growth-promoting factor 2) |
| chr8_-_103668114 | 4.98 |
ENST00000285407.6
|
KLF10
|
Kruppel-like factor 10 |
| chr11_+_46722368 | 4.83 |
ENST00000311764.2
|
ZNF408
|
zinc finger protein 408 |
| chr2_-_110371664 | 4.83 |
ENST00000545389.1
ENST00000423520.1 |
SEPT10
|
septin 10 |
| chr11_-_86666427 | 4.76 |
ENST00000531380.1
|
FZD4
|
frizzled family receptor 4 |
| chr10_-_95360983 | 4.69 |
ENST00000371464.3
|
RBP4
|
retinol binding protein 4, plasma |
| chr11_+_62623621 | 4.64 |
ENST00000535296.1
|
SLC3A2
|
solute carrier family 3 (amino acid transporter heavy chain), member 2 |
| chr3_+_71803201 | 4.64 |
ENST00000304411.2
|
GPR27
|
G protein-coupled receptor 27 |
| chr14_-_38064198 | 4.58 |
ENST00000250448.2
|
FOXA1
|
forkhead box A1 |
| chr1_+_18958008 | 4.54 |
ENST00000420770.2
ENST00000400661.3 |
PAX7
|
paired box 7 |
| chr15_+_22892663 | 4.50 |
ENST00000313077.7
ENST00000561274.1 ENST00000560848.1 |
CYFIP1
|
cytoplasmic FMR1 interacting protein 1 |
| chr11_+_62623544 | 4.41 |
ENST00000377890.2
ENST00000377891.2 ENST00000377889.2 |
SLC3A2
|
solute carrier family 3 (amino acid transporter heavy chain), member 2 |
| chr5_-_39425068 | 4.36 |
ENST00000515700.1
ENST00000339788.6 |
DAB2
|
Dab, mitogen-responsive phosphoprotein, homolog 2 (Drosophila) |
| chr12_-_8815404 | 4.31 |
ENST00000359478.2
ENST00000396549.2 |
MFAP5
|
microfibrillar associated protein 5 |
| chr1_-_157108266 | 4.30 |
ENST00000326786.4
|
ETV3
|
ets variant 3 |
| chr1_+_156030937 | 4.30 |
ENST00000361084.5
|
RAB25
|
RAB25, member RAS oncogene family |
| chr20_+_43104508 | 4.29 |
ENST00000262605.4
ENST00000372904.3 |
TTPAL
|
tocopherol (alpha) transfer protein-like |
| chr18_-_21977748 | 4.23 |
ENST00000399441.4
ENST00000319481.3 |
OSBPL1A
|
oxysterol binding protein-like 1A |
| chr11_+_62623512 | 4.20 |
ENST00000377892.1
|
SLC3A2
|
solute carrier family 3 (amino acid transporter heavy chain), member 2 |
| chr1_-_108742957 | 4.18 |
ENST00000565488.1
|
SLC25A24
|
solute carrier family 25 (mitochondrial carrier; phosphate carrier), member 24 |
| chr17_+_7487146 | 4.10 |
ENST00000396501.4
ENST00000584378.1 ENST00000423172.2 ENST00000579445.1 ENST00000585217.1 ENST00000581380.1 |
MPDU1
|
mannose-P-dolichol utilization defect 1 |
| chr11_-_64527425 | 3.97 |
ENST00000377432.3
|
PYGM
|
phosphorylase, glycogen, muscle |
| chr2_-_85895295 | 3.94 |
ENST00000428225.1
ENST00000519937.2 |
SFTPB
|
surfactant protein B |
| chrX_-_153599578 | 3.93 |
ENST00000360319.4
ENST00000344736.4 |
FLNA
|
filamin A, alpha |
| chr19_-_1174226 | 3.91 |
ENST00000587024.1
ENST00000361757.3 |
SBNO2
|
strawberry notch homolog 2 (Drosophila) |
| chr17_+_39969183 | 3.90 |
ENST00000321562.4
|
FKBP10
|
FK506 binding protein 10, 65 kDa |
| chr7_+_150756657 | 3.90 |
ENST00000413384.2
|
SLC4A2
|
solute carrier family 4 (anion exchanger), member 2 |
| chr5_-_137090028 | 3.89 |
ENST00000314940.4
|
HNRNPA0
|
heterogeneous nuclear ribonucleoprotein A0 |
| chr1_+_236558694 | 3.88 |
ENST00000359362.5
|
EDARADD
|
EDAR-associated death domain |
| chr1_-_11865982 | 3.88 |
ENST00000418034.1
|
MTHFR
|
methylenetetrahydrofolate reductase (NAD(P)H) |
| chrX_-_17879356 | 3.88 |
ENST00000331511.1
ENST00000415486.3 ENST00000545871.1 ENST00000451717.1 |
RAI2
|
retinoic acid induced 2 |
| chr3_-_79816965 | 3.87 |
ENST00000464233.1
|
ROBO1
|
roundabout, axon guidance receptor, homolog 1 (Drosophila) |
| chr1_-_43833628 | 3.77 |
ENST00000413844.2
ENST00000372458.3 |
ELOVL1
|
ELOVL fatty acid elongase 1 |
| chr1_-_11866034 | 3.74 |
ENST00000376590.3
|
MTHFR
|
methylenetetrahydrofolate reductase (NAD(P)H) |
| chr1_-_8939265 | 3.74 |
ENST00000489867.1
|
ENO1
|
enolase 1, (alpha) |
| chr20_-_30311703 | 3.73 |
ENST00000450273.1
ENST00000456404.1 ENST00000420488.1 ENST00000439267.1 |
BCL2L1
|
BCL2-like 1 |
| chr17_-_71308119 | 3.72 |
ENST00000439510.2
ENST00000581014.1 ENST00000579611.1 |
CDC42EP4
|
CDC42 effector protein (Rho GTPase binding) 4 |
| chr5_+_179125368 | 3.64 |
ENST00000502296.1
ENST00000504734.1 ENST00000415618.2 |
CANX
|
calnexin |
| chr19_-_1605424 | 3.63 |
ENST00000589880.1
ENST00000585671.1 ENST00000591899.3 |
UQCR11
|
ubiquinol-cytochrome c reductase, complex III subunit XI |
| chr6_-_28367510 | 3.61 |
ENST00000361028.1
|
ZSCAN12
|
zinc finger and SCAN domain containing 12 |
| chr9_+_133454943 | 3.56 |
ENST00000319725.9
|
FUBP3
|
far upstream element (FUSE) binding protein 3 |
| chr11_+_2421718 | 3.52 |
ENST00000380996.5
ENST00000333256.6 ENST00000380992.1 ENST00000437110.1 ENST00000435795.1 |
TSSC4
|
tumor suppressing subtransferable candidate 4 |
| chr5_-_180237445 | 3.47 |
ENST00000393340.3
|
MGAT1
|
mannosyl (alpha-1,3-)-glycoprotein beta-1,2-N-acetylglucosaminyltransferase |
| chr10_-_99161033 | 3.44 |
ENST00000315563.6
ENST00000370992.4 ENST00000414986.1 |
RRP12
|
ribosomal RNA processing 12 homolog (S. cerevisiae) |
| chr4_+_56814968 | 3.41 |
ENST00000422247.2
|
CEP135
|
centrosomal protein 135kDa |
| chr16_-_31085514 | 3.33 |
ENST00000300849.4
|
ZNF668
|
zinc finger protein 668 |
| chr8_+_17434689 | 3.32 |
ENST00000398074.3
|
PDGFRL
|
platelet-derived growth factor receptor-like |
| chr3_-_185826855 | 3.29 |
ENST00000306376.5
|
ETV5
|
ets variant 5 |
| chr10_-_69834973 | 3.29 |
ENST00000395187.2
|
HERC4
|
HECT and RLD domain containing E3 ubiquitin protein ligase 4 |
| chr20_-_56286479 | 3.28 |
ENST00000265626.4
|
PMEPA1
|
prostate transmembrane protein, androgen induced 1 |
| chr17_-_37844267 | 3.27 |
ENST00000579146.1
ENST00000378011.4 ENST00000429199.2 ENST00000300658.4 |
PGAP3
|
post-GPI attachment to proteins 3 |
| chr1_-_155532484 | 3.26 |
ENST00000368346.3
ENST00000548830.1 |
ASH1L
|
ash1 (absent, small, or homeotic)-like (Drosophila) |
| chr9_-_72287191 | 3.22 |
ENST00000265381.4
|
APBA1
|
amyloid beta (A4) precursor protein-binding, family A, member 1 |
| chr10_-_69835001 | 3.21 |
ENST00000513996.1
ENST00000412272.2 ENST00000395198.3 ENST00000492996.2 |
HERC4
|
HECT and RLD domain containing E3 ubiquitin protein ligase 4 |
| chr22_+_29138013 | 3.18 |
ENST00000216027.3
ENST00000398941.2 |
HSCB
|
HscB mitochondrial iron-sulfur cluster co-chaperone |
| chr19_-_55668093 | 3.13 |
ENST00000588882.1
ENST00000586858.1 |
TNNI3
|
troponin I type 3 (cardiac) |
| chr3_-_158450475 | 3.11 |
ENST00000237696.5
|
RARRES1
|
retinoic acid receptor responder (tazarotene induced) 1 |
| chr5_-_35230434 | 3.10 |
ENST00000504500.1
|
PRLR
|
prolactin receptor |
| chr6_+_3000195 | 3.05 |
ENST00000338130.2
|
NQO2
|
NAD(P)H dehydrogenase, quinone 2 |
| chr16_+_69373661 | 3.05 |
ENST00000254941.6
|
NIP7
|
NIP7, nucleolar pre-rRNA processing protein |
| chr6_+_3000218 | 3.04 |
ENST00000380441.1
ENST00000380455.4 ENST00000380454.4 |
NQO2
|
NAD(P)H dehydrogenase, quinone 2 |
| chr5_-_443239 | 3.00 |
ENST00000408966.2
|
C5orf55
|
chromosome 5 open reading frame 55 |
| chr5_+_68530668 | 2.97 |
ENST00000506563.1
|
CDK7
|
cyclin-dependent kinase 7 |
| chr1_+_18957500 | 2.97 |
ENST00000375375.3
|
PAX7
|
paired box 7 |
| chr11_-_104035088 | 2.97 |
ENST00000302251.5
|
PDGFD
|
platelet derived growth factor D |
| chr19_+_11546153 | 2.97 |
ENST00000591946.1
ENST00000252455.2 ENST00000412601.1 |
PRKCSH
|
protein kinase C substrate 80K-H |
| chr15_+_51200871 | 2.96 |
ENST00000560508.1
|
AP4E1
|
adaptor-related protein complex 4, epsilon 1 subunit |
| chr14_-_36990354 | 2.89 |
ENST00000518149.1
|
NKX2-1
|
NK2 homeobox 1 |
| chr6_+_126240442 | 2.87 |
ENST00000448104.1
ENST00000438495.1 ENST00000444128.1 |
NCOA7
|
nuclear receptor coactivator 7 |
| chr19_-_11039261 | 2.86 |
ENST00000590329.1
ENST00000587943.1 ENST00000585858.1 ENST00000586748.1 ENST00000586575.1 ENST00000253031.2 |
YIPF2
|
Yip1 domain family, member 2 |
| chr19_+_11546093 | 2.85 |
ENST00000591462.1
|
PRKCSH
|
protein kinase C substrate 80K-H |
| chr2_-_120980939 | 2.82 |
ENST00000426077.2
|
TMEM185B
|
transmembrane protein 185B |
| chr10_+_114710211 | 2.79 |
ENST00000349937.2
ENST00000369397.4 |
TCF7L2
|
transcription factor 7-like 2 (T-cell specific, HMG-box) |
| chr6_+_31865552 | 2.74 |
ENST00000469372.1
ENST00000497706.1 |
C2
|
complement component 2 |
| chr17_+_4843679 | 2.73 |
ENST00000576229.1
|
RNF167
|
ring finger protein 167 |
| chr3_+_130745688 | 2.72 |
ENST00000510769.1
ENST00000429253.2 ENST00000356918.4 ENST00000510688.1 ENST00000511262.1 ENST00000383366.4 |
NEK11
|
NIMA-related kinase 11 |
| chr5_+_96079240 | 2.71 |
ENST00000515663.1
|
CAST
|
calpastatin |
| chr6_-_28226984 | 2.71 |
ENST00000423974.2
|
ZKSCAN4
|
zinc finger with KRAB and SCAN domains 4 |
| chr2_+_204193129 | 2.68 |
ENST00000417864.1
|
ABI2
|
abl-interactor 2 |
| chr8_+_106330920 | 2.68 |
ENST00000407775.2
|
ZFPM2
|
zinc finger protein, FOG family member 2 |
| chr17_-_7518145 | 2.68 |
ENST00000250113.7
ENST00000571597.1 |
FXR2
|
fragile X mental retardation, autosomal homolog 2 |
| chr18_+_3262415 | 2.67 |
ENST00000581193.1
ENST00000400175.5 |
MYL12B
|
myosin, light chain 12B, regulatory |
| chr8_-_99306564 | 2.65 |
ENST00000430223.2
|
NIPAL2
|
NIPA-like domain containing 2 |
| chr1_-_244013384 | 2.64 |
ENST00000366539.1
|
AKT3
|
v-akt murine thymoma viral oncogene homolog 3 |
| chr5_-_180236811 | 2.63 |
ENST00000446023.2
|
MGAT1
|
mannosyl (alpha-1,3-)-glycoprotein beta-1,2-N-acetylglucosaminyltransferase |
| chr22_+_20104947 | 2.62 |
ENST00000402752.1
|
RANBP1
|
RAN binding protein 1 |
| chr19_-_4670345 | 2.61 |
ENST00000599630.1
ENST00000262947.3 |
C19orf10
|
chromosome 19 open reading frame 10 |
| chr20_+_44035200 | 2.58 |
ENST00000372717.1
ENST00000360981.4 |
DBNDD2
|
dysbindin (dystrobrevin binding protein 1) domain containing 2 |
| chr11_+_131781290 | 2.58 |
ENST00000425719.2
ENST00000374784.1 |
NTM
|
neurotrimin |
| chr2_+_204193149 | 2.57 |
ENST00000422511.2
|
ABI2
|
abl-interactor 2 |
| chr19_-_6110474 | 2.57 |
ENST00000587181.1
ENST00000587321.1 ENST00000586806.1 ENST00000589742.1 ENST00000592546.1 ENST00000303657.5 |
RFX2
|
regulatory factor X, 2 (influences HLA class II expression) |
| chr17_+_7482785 | 2.55 |
ENST00000250092.6
ENST00000380498.6 ENST00000584502.1 |
CD68
|
CD68 molecule |
| chr8_-_99306611 | 2.51 |
ENST00000341166.3
|
NIPAL2
|
NIPA-like domain containing 2 |
| chr4_+_75480629 | 2.51 |
ENST00000380846.3
|
AREGB
|
amphiregulin B |
| chr22_-_29075853 | 2.51 |
ENST00000397906.2
|
TTC28
|
tetratricopeptide repeat domain 28 |
| chr3_+_130745769 | 2.47 |
ENST00000412440.2
|
NEK11
|
NIMA-related kinase 11 |
| chr19_-_55658281 | 2.46 |
ENST00000585321.2
ENST00000587465.2 |
TNNT1
|
troponin T type 1 (skeletal, slow) |
| chr22_-_20104700 | 2.44 |
ENST00000439169.2
ENST00000445045.1 ENST00000404751.3 ENST00000252136.7 ENST00000403707.3 |
TRMT2A
|
tRNA methyltransferase 2 homolog A (S. cerevisiae) |
| chr9_-_139094988 | 2.44 |
ENST00000371746.3
|
LHX3
|
LIM homeobox 3 |
| chr16_+_4784458 | 2.44 |
ENST00000590191.1
|
C16orf71
|
chromosome 16 open reading frame 71 |
| chr15_+_74466012 | 2.40 |
ENST00000249842.3
|
ISLR
|
immunoglobulin superfamily containing leucine-rich repeat |
| chr11_-_107582775 | 2.39 |
ENST00000305991.2
|
SLN
|
sarcolipin |
| chr1_-_43855444 | 2.39 |
ENST00000372455.4
|
MED8
|
mediator complex subunit 8 |
| chr5_-_137878887 | 2.39 |
ENST00000507939.1
ENST00000572514.1 ENST00000499810.2 ENST00000360541.5 |
ETF1
|
eukaryotic translation termination factor 1 |
| chr1_-_43855479 | 2.38 |
ENST00000290663.6
ENST00000372457.4 |
MED8
|
mediator complex subunit 8 |
| chr4_+_56262115 | 2.38 |
ENST00000506198.1
ENST00000381334.5 ENST00000542052.1 |
TMEM165
|
transmembrane protein 165 |
| chr4_+_75311019 | 2.37 |
ENST00000502307.1
|
AREG
|
amphiregulin |
| chr5_+_68530697 | 2.36 |
ENST00000256443.3
ENST00000514676.1 |
CDK7
|
cyclin-dependent kinase 7 |
| chr16_-_66968265 | 2.36 |
ENST00000567511.1
ENST00000422424.2 |
FAM96B
|
family with sequence similarity 96, member B |
| chr4_-_121993673 | 2.34 |
ENST00000379692.4
|
NDNF
|
neuron-derived neurotrophic factor |
| chr5_+_174151536 | 2.34 |
ENST00000239243.6
ENST00000507785.1 |
MSX2
|
msh homeobox 2 |
| chr6_+_26087646 | 2.32 |
ENST00000309234.6
|
HFE
|
hemochromatosis |
| chr3_+_19988885 | 2.32 |
ENST00000422242.1
|
RAB5A
|
RAB5A, member RAS oncogene family |
| chr12_-_123215306 | 2.28 |
ENST00000356987.2
ENST00000436083.2 |
HCAR1
|
hydroxycarboxylic acid receptor 1 |
| chr6_+_26087509 | 2.28 |
ENST00000397022.3
ENST00000353147.5 ENST00000352392.4 ENST00000349999.4 ENST00000317896.7 ENST00000357618.5 ENST00000470149.1 ENST00000336625.8 ENST00000461397.1 ENST00000488199.1 |
HFE
|
hemochromatosis |
| chr10_+_114709999 | 2.27 |
ENST00000355995.4
ENST00000545257.1 ENST00000543371.1 ENST00000536810.1 ENST00000355717.4 ENST00000538897.1 ENST00000534894.1 |
TCF7L2
|
transcription factor 7-like 2 (T-cell specific, HMG-box) |
| chr5_+_179125907 | 2.27 |
ENST00000247461.4
ENST00000452673.2 ENST00000502498.1 ENST00000507307.1 ENST00000513246.1 ENST00000502673.1 ENST00000506654.1 ENST00000512607.2 ENST00000510810.1 |
CANX
|
calnexin |
| chr15_+_51200859 | 2.25 |
ENST00000261842.5
|
AP4E1
|
adaptor-related protein complex 4, epsilon 1 subunit |
| chr1_-_36235559 | 2.24 |
ENST00000251195.5
|
CLSPN
|
claspin |
| chrX_+_37208521 | 2.23 |
ENST00000378628.4
|
PRRG1
|
proline rich Gla (G-carboxyglutamic acid) 1 |
| chr12_+_52463751 | 2.21 |
ENST00000336854.4
ENST00000550604.1 ENST00000553049.1 ENST00000548915.1 |
C12orf44
|
chromosome 12 open reading frame 44 |
| chr1_-_161102421 | 2.20 |
ENST00000490843.2
ENST00000368006.3 ENST00000392188.1 ENST00000545495.1 |
DEDD
|
death effector domain containing |
| chr19_+_11546440 | 2.20 |
ENST00000589126.1
ENST00000588269.1 ENST00000587509.1 ENST00000592741.1 ENST00000593101.1 ENST00000587327.1 |
PRKCSH
|
protein kinase C substrate 80K-H |
| chr2_+_113816685 | 2.19 |
ENST00000393200.2
|
IL36RN
|
interleukin 36 receptor antagonist |
| chr7_-_35734730 | 2.19 |
ENST00000396081.1
ENST00000311350.3 |
HERPUD2
|
HERPUD family member 2 |
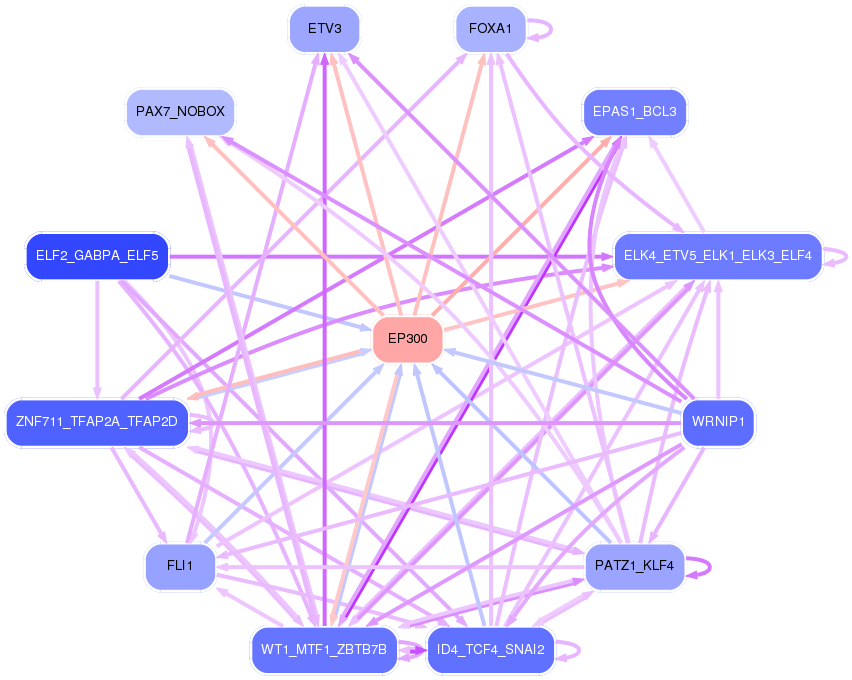
Network of associatons between targets according to the STRING database.

First level regulatory network of EP300
Gene Ontology Analysis
Gene overrepresentation in biological_process category:
| Log-likelihood per target | Total log-likelihood | Term | Description |
|---|---|---|---|
| 4.9 | 19.6 | GO:0035026 | leading edge cell differentiation(GO:0035026) |
| 4.7 | 28.3 | GO:0030421 | defecation(GO:0030421) |
| 4.5 | 13.4 | GO:1903336 | negative regulation of vacuolar transport(GO:1903336) |
| 3.7 | 18.7 | GO:2000255 | negative regulation of male germ cell proliferation(GO:2000255) |
| 3.0 | 33.5 | GO:0009414 | response to water deprivation(GO:0009414) |
| 2.8 | 45.4 | GO:0051639 | actin filament network formation(GO:0051639) |
| 2.8 | 8.3 | GO:0002541 | activation of plasma proteins involved in acute inflammatory response(GO:0002541) |
| 2.6 | 13.2 | GO:0060356 | leucine import(GO:0060356) |
| 2.5 | 7.5 | GO:0014816 | skeletal muscle satellite cell differentiation(GO:0014816) |
| 2.1 | 17.1 | GO:0043129 | surfactant homeostasis(GO:0043129) |
| 2.1 | 6.2 | GO:0048170 | positive regulation of long-term neuronal synaptic plasticity(GO:0048170) |
| 1.9 | 5.6 | GO:0033159 | negative regulation of protein import into nucleus, translocation(GO:0033159) renal albumin absorption(GO:0097018) oligodendrocyte apoptotic process(GO:0097252) regulation of renal albumin absorption(GO:2000532) |
| 1.8 | 16.2 | GO:0006531 | aspartate metabolic process(GO:0006531) |
| 1.7 | 13.4 | GO:1903142 | positive regulation of endothelial cell development(GO:1901552) positive regulation of establishment of endothelial barrier(GO:1903142) |
| 1.6 | 6.6 | GO:2000562 | negative regulation of CD4-positive, alpha-beta T cell proliferation(GO:2000562) |
| 1.6 | 12.7 | GO:0015693 | magnesium ion transport(GO:0015693) |
| 1.5 | 4.6 | GO:0002589 | regulation of antigen processing and presentation of peptide antigen via MHC class I(GO:0002589) negative regulation of antigen processing and presentation of peptide antigen via MHC class I(GO:0002590) regulation of T cell antigen processing and presentation(GO:0002625) positive regulation of iron ion transport(GO:0034758) positive regulation of iron ion transmembrane transport(GO:0034761) regulation of iron ion import(GO:1900390) regulation of ferrous iron import into cell(GO:1903989) positive regulation of ferrous iron import into cell(GO:1903991) regulation of ferrous iron binding(GO:1904432) positive regulation of ferrous iron binding(GO:1904434) regulation of transferrin receptor binding(GO:1904435) positive regulation of transferrin receptor binding(GO:1904437) regulation of ferrous iron import across plasma membrane(GO:1904438) positive regulation of ferrous iron import across plasma membrane(GO:1904440) response to iron ion starvation(GO:1990641) |
| 1.5 | 16.8 | GO:0032287 | peripheral nervous system myelin maintenance(GO:0032287) |
| 1.5 | 7.6 | GO:0070829 | response to vitamin B2(GO:0033274) heterochromatin maintenance(GO:0070829) |
| 1.5 | 6.1 | GO:0006049 | UDP-N-acetylglucosamine catabolic process(GO:0006049) |
| 1.3 | 5.3 | GO:0003409 | optic cup structural organization(GO:0003409) |
| 1.3 | 17.1 | GO:0060137 | maternal process involved in parturition(GO:0060137) |
| 1.3 | 6.5 | GO:0033088 | negative regulation of immature T cell proliferation in thymus(GO:0033088) |
| 1.3 | 3.9 | GO:0000412 | histone peptidyl-prolyl isomerization(GO:0000412) |
| 1.3 | 3.9 | GO:0021836 | cerebral cortex tangential migration using cell-cell interactions(GO:0021823) postnatal olfactory bulb interneuron migration(GO:0021827) chemorepulsion involved in postnatal olfactory bulb interneuron migration(GO:0021836) regulation of negative chemotaxis(GO:0050923) |
| 1.2 | 4.8 | GO:0061304 | extracellular matrix-cell signaling(GO:0035426) retinal blood vessel morphogenesis(GO:0061304) |
| 1.2 | 10.7 | GO:0048386 | positive regulation of retinoic acid receptor signaling pathway(GO:0048386) |
| 1.2 | 2.3 | GO:0060364 | frontal suture morphogenesis(GO:0060364) |
| 1.1 | 4.6 | GO:0060743 | epithelial cell maturation involved in prostate gland development(GO:0060743) |
| 1.1 | 4.5 | GO:1903422 | negative regulation of synaptic vesicle recycling(GO:1903422) |
| 1.1 | 3.3 | GO:0060762 | regulation of branching involved in mammary gland duct morphogenesis(GO:0060762) |
| 1.1 | 18.6 | GO:0060391 | positive regulation of SMAD protein import into nucleus(GO:0060391) |
| 1.0 | 3.0 | GO:2000439 | positive regulation of monocyte extravasation(GO:2000439) |
| 1.0 | 5.8 | GO:0010756 | positive regulation of plasminogen activation(GO:0010756) |
| 0.9 | 4.7 | GO:0048807 | female genitalia morphogenesis(GO:0048807) |
| 0.9 | 4.6 | GO:1900738 | positive regulation of phospholipase C-activating G-protein coupled receptor signaling pathway(GO:1900738) |
| 0.9 | 3.7 | GO:0009298 | GDP-mannose biosynthetic process(GO:0009298) |
| 0.9 | 2.7 | GO:0003221 | right ventricular cardiac muscle tissue morphogenesis(GO:0003221) |
| 0.8 | 5.1 | GO:0010908 | regulation of heparan sulfate proteoglycan biosynthetic process(GO:0010908) positive regulation of heparan sulfate proteoglycan biosynthetic process(GO:0010909) canonical Wnt signaling pathway involved in positive regulation of epithelial to mesenchymal transition(GO:0044334) positive regulation of proteoglycan biosynthetic process(GO:1902730) |
| 0.8 | 3.3 | GO:0097676 | histone H3-K36 dimethylation(GO:0097676) |
| 0.8 | 2.4 | GO:1901877 | regulation of calcium ion binding(GO:1901876) negative regulation of calcium ion binding(GO:1901877) |
| 0.7 | 1.4 | GO:0061643 | chemorepulsion of dopaminergic neuron axon(GO:0036518) chemorepulsion of axon(GO:0061643) |
| 0.7 | 2.0 | GO:0090076 | regulation of fast-twitch skeletal muscle fiber contraction(GO:0031446) positive regulation of fast-twitch skeletal muscle fiber contraction(GO:0031448) relaxation of skeletal muscle(GO:0090076) |
| 0.7 | 4.6 | GO:0046604 | positive regulation of mitotic centrosome separation(GO:0046604) |
| 0.7 | 3.9 | GO:0016479 | negative regulation of transcription from RNA polymerase I promoter(GO:0016479) |
| 0.7 | 3.9 | GO:0071105 | response to interleukin-11(GO:0071105) |
| 0.6 | 3.8 | GO:0034625 | fatty acid elongation, saturated fatty acid(GO:0019367) fatty acid elongation, unsaturated fatty acid(GO:0019368) fatty acid elongation, monounsaturated fatty acid(GO:0034625) fatty acid elongation, polyunsaturated fatty acid(GO:0034626) |
| 0.6 | 4.4 | GO:0042695 | thelarche(GO:0042695) mammary gland branching involved in thelarche(GO:0060744) |
| 0.6 | 19.2 | GO:1904707 | positive regulation of vascular smooth muscle cell proliferation(GO:1904707) |
| 0.6 | 15.6 | GO:0043518 | negative regulation of DNA damage response, signal transduction by p53 class mediator(GO:0043518) |
| 0.6 | 1.7 | GO:0045013 | carbon catabolite repression of transcription(GO:0045013) negative regulation of transcription by glucose(GO:0045014) |
| 0.6 | 2.9 | GO:0021759 | globus pallidus development(GO:0021759) |
| 0.5 | 3.7 | GO:0060154 | cellular process regulating host cell cycle in response to virus(GO:0060154) |
| 0.5 | 3.2 | GO:0097428 | protein maturation by iron-sulfur cluster transfer(GO:0097428) |
| 0.5 | 4.2 | GO:0021520 | spinal cord motor neuron cell fate specification(GO:0021520) |
| 0.5 | 4.2 | GO:0015866 | ADP transport(GO:0015866) |
| 0.5 | 6.8 | GO:0033617 | mitochondrial respiratory chain complex IV assembly(GO:0033617) mitochondrial respiratory chain complex IV biogenesis(GO:0097034) |
| 0.5 | 2.1 | GO:2000286 | receptor internalization involved in canonical Wnt signaling pathway(GO:2000286) |
| 0.5 | 3.1 | GO:0038161 | prolactin signaling pathway(GO:0038161) |
| 0.5 | 1.5 | GO:0019858 | cytosine metabolic process(GO:0019858) |
| 0.5 | 4.6 | GO:0031444 | slow-twitch skeletal muscle fiber contraction(GO:0031444) |
| 0.5 | 8.0 | GO:0031268 | pseudopodium organization(GO:0031268) |
| 0.5 | 12.1 | GO:1902284 | axon extension involved in axon guidance(GO:0048846) neuron projection extension involved in neuron projection guidance(GO:1902284) |
| 0.5 | 5.8 | GO:1904263 | positive regulation of TORC1 signaling(GO:1904263) |
| 0.5 | 3.4 | GO:0051533 | positive regulation of NFAT protein import into nucleus(GO:0051533) |
| 0.5 | 3.8 | GO:2000601 | positive regulation of Arp2/3 complex-mediated actin nucleation(GO:2000601) |
| 0.5 | 0.9 | GO:0070172 | positive regulation of tooth mineralization(GO:0070172) |
| 0.4 | 1.3 | GO:0006550 | isoleucine catabolic process(GO:0006550) |
| 0.4 | 2.2 | GO:0033314 | mitotic DNA replication checkpoint(GO:0033314) |
| 0.4 | 1.3 | GO:0019470 | 4-hydroxyproline catabolic process(GO:0019470) |
| 0.4 | 1.3 | GO:0036511 | trimming of terminal mannose on B branch(GO:0036509) trimming of first mannose on A branch(GO:0036511) trimming of second mannose on A branch(GO:0036512) |
| 0.4 | 2.6 | GO:0017196 | N-terminal peptidyl-methionine acetylation(GO:0017196) |
| 0.4 | 6.9 | GO:0034975 | protein folding in endoplasmic reticulum(GO:0034975) |
| 0.4 | 3.4 | GO:0030578 | PML body organization(GO:0030578) |
| 0.4 | 3.9 | GO:0097011 | cellular response to granulocyte macrophage colony-stimulating factor stimulus(GO:0097011) response to granulocyte macrophage colony-stimulating factor(GO:0097012) |
| 0.4 | 5.9 | GO:0016226 | iron-sulfur cluster assembly(GO:0016226) metallo-sulfur cluster assembly(GO:0031163) |
| 0.4 | 1.1 | GO:0002232 | leukocyte chemotaxis involved in inflammatory response(GO:0002232) cell surface pattern recognition receptor signaling pathway(GO:0002752) |
| 0.4 | 2.2 | GO:1902714 | negative regulation of interferon-gamma secretion(GO:1902714) |
| 0.4 | 9.3 | GO:0006491 | N-glycan processing(GO:0006491) |
| 0.4 | 1.1 | GO:0018317 | protein C-linked glycosylation(GO:0018103) peptidyl-tryptophan modification(GO:0018211) protein C-linked glycosylation via tryptophan(GO:0018317) protein C-linked glycosylation via 2'-alpha-mannosyl-L-tryptophan(GO:0018406) |
| 0.4 | 2.8 | GO:2000535 | regulation of entry of bacterium into host cell(GO:2000535) |
| 0.4 | 5.3 | GO:0019852 | L-ascorbic acid metabolic process(GO:0019852) |
| 0.4 | 1.4 | GO:0033123 | positive regulation of cyclic nucleotide catabolic process(GO:0030807) positive regulation of cAMP catabolic process(GO:0030822) positive regulation of purine nucleotide catabolic process(GO:0033123) |
| 0.4 | 10.9 | GO:0034080 | CENP-A containing nucleosome assembly(GO:0034080) CENP-A containing chromatin organization(GO:0061641) |
| 0.3 | 3.1 | GO:0015747 | urate transport(GO:0015747) |
| 0.3 | 1.0 | GO:0002276 | basophil activation involved in immune response(GO:0002276) |
| 0.3 | 1.7 | GO:0000720 | pyrimidine dimer repair by nucleotide-excision repair(GO:0000720) |
| 0.3 | 1.4 | GO:0046108 | uridine catabolic process(GO:0006218) uridine metabolic process(GO:0046108) |
| 0.3 | 2.4 | GO:0032472 | Golgi calcium ion transport(GO:0032472) |
| 0.3 | 4.3 | GO:0045793 | positive regulation of cell size(GO:0045793) |
| 0.3 | 1.0 | GO:0002522 | leukocyte migration involved in immune response(GO:0002522) |
| 0.3 | 1.5 | GO:0001826 | inner cell mass cell differentiation(GO:0001826) |
| 0.3 | 1.2 | GO:0043376 | regulation of CD8-positive, alpha-beta T cell differentiation(GO:0043376) |
| 0.3 | 0.9 | GO:0070940 | negative regulation of cell growth involved in cardiac muscle cell development(GO:0061052) dephosphorylation of RNA polymerase II C-terminal domain(GO:0070940) |
| 0.3 | 2.6 | GO:0001675 | acrosome assembly(GO:0001675) |
| 0.3 | 4.0 | GO:0014051 | gamma-aminobutyric acid secretion(GO:0014051) |
| 0.3 | 1.7 | GO:0071907 | determination of pancreatic left/right asymmetry(GO:0035469) determination of digestive tract left/right asymmetry(GO:0071907) |
| 0.3 | 3.3 | GO:0010990 | regulation of SMAD protein complex assembly(GO:0010990) negative regulation of SMAD protein complex assembly(GO:0010991) |
| 0.3 | 0.8 | GO:0010936 | negative regulation of macrophage cytokine production(GO:0010936) |
| 0.3 | 2.4 | GO:0007168 | receptor guanylyl cyclase signaling pathway(GO:0007168) |
| 0.3 | 3.6 | GO:0006122 | mitochondrial electron transport, ubiquinol to cytochrome c(GO:0006122) |
| 0.3 | 0.8 | GO:1901668 | regulation of superoxide dismutase activity(GO:1901668) |
| 0.2 | 1.0 | GO:0019086 | late viral transcription(GO:0019086) |
| 0.2 | 4.1 | GO:0006488 | dolichol-linked oligosaccharide biosynthetic process(GO:0006488) |
| 0.2 | 0.7 | GO:0097112 | gamma-aminobutyric acid receptor clustering(GO:0097112) |
| 0.2 | 3.3 | GO:0035791 | platelet-derived growth factor receptor-beta signaling pathway(GO:0035791) |
| 0.2 | 5.1 | GO:0002089 | lens morphogenesis in camera-type eye(GO:0002089) |
| 0.2 | 0.7 | GO:1903936 | response to sodium arsenite(GO:1903935) cellular response to sodium arsenite(GO:1903936) |
| 0.2 | 2.7 | GO:2000427 | positive regulation of apoptotic cell clearance(GO:2000427) |
| 0.2 | 0.5 | GO:0051031 | tRNA export from nucleus(GO:0006409) tRNA transport(GO:0051031) tRNA-containing ribonucleoprotein complex export from nucleus(GO:0071431) |
| 0.2 | 1.3 | GO:0001712 | ectodermal cell fate commitment(GO:0001712) |
| 0.2 | 2.3 | GO:0061042 | vascular wound healing(GO:0061042) |
| 0.2 | 1.4 | GO:0071680 | response to indole-3-methanol(GO:0071680) cellular response to indole-3-methanol(GO:0071681) |
| 0.2 | 1.0 | GO:0006651 | diacylglycerol biosynthetic process(GO:0006651) |
| 0.2 | 0.6 | GO:0046642 | negative regulation of alpha-beta T cell proliferation(GO:0046642) |
| 0.2 | 10.6 | GO:0048009 | insulin-like growth factor receptor signaling pathway(GO:0048009) |
| 0.2 | 1.0 | GO:0003219 | cardiac right ventricle formation(GO:0003219) |
| 0.2 | 2.0 | GO:2000675 | negative regulation of type B pancreatic cell apoptotic process(GO:2000675) |
| 0.2 | 1.8 | GO:0045039 | protein import into mitochondrial inner membrane(GO:0045039) |
| 0.2 | 0.8 | GO:1900227 | positive regulation of NLRP3 inflammasome complex assembly(GO:1900227) |
| 0.2 | 0.6 | GO:0051182 | coenzyme transport(GO:0051182) |
| 0.2 | 1.6 | GO:0097647 | calcitonin family receptor signaling pathway(GO:0097646) amylin receptor signaling pathway(GO:0097647) |
| 0.2 | 2.9 | GO:1902083 | negative regulation of peptidyl-cysteine S-nitrosylation(GO:1902083) |
| 0.2 | 1.8 | GO:0071313 | cellular response to caffeine(GO:0071313) |
| 0.2 | 11.7 | GO:1901016 | regulation of potassium ion transmembrane transporter activity(GO:1901016) |
| 0.2 | 6.0 | GO:0006692 | prostanoid metabolic process(GO:0006692) prostaglandin metabolic process(GO:0006693) |
| 0.2 | 3.1 | GO:0010882 | regulation of cardiac muscle contraction by calcium ion signaling(GO:0010882) |
| 0.2 | 8.0 | GO:0048747 | muscle fiber development(GO:0048747) |
| 0.2 | 0.6 | GO:0046952 | ketone body catabolic process(GO:0046952) |
| 0.2 | 3.9 | GO:0070935 | 3'-UTR-mediated mRNA stabilization(GO:0070935) |
| 0.2 | 2.4 | GO:0006449 | regulation of translational termination(GO:0006449) |
| 0.2 | 2.1 | GO:0034638 | phosphatidylcholine catabolic process(GO:0034638) |
| 0.1 | 5.8 | GO:0006699 | bile acid biosynthetic process(GO:0006699) |
| 0.1 | 7.0 | GO:0031572 | G2 DNA damage checkpoint(GO:0031572) |
| 0.1 | 0.9 | GO:0045657 | positive regulation of monocyte differentiation(GO:0045657) |
| 0.1 | 2.3 | GO:0010457 | centriole-centriole cohesion(GO:0010457) |
| 0.1 | 0.7 | GO:0045631 | regulation of auditory receptor cell differentiation(GO:0045607) regulation of mechanoreceptor differentiation(GO:0045631) regulation of inner ear receptor cell differentiation(GO:2000980) |
| 0.1 | 0.6 | GO:0090069 | regulation of ribosome biogenesis(GO:0090069) regulation of rRNA processing(GO:2000232) |
| 0.1 | 0.7 | GO:0099538 | synaptic signaling via neuropeptide(GO:0099538) trans-synaptic signaling by neuropeptide(GO:0099540) trans-synaptic signaling by neuropeptide, modulating synaptic transmission(GO:0099551) |
| 0.1 | 5.0 | GO:0045672 | positive regulation of osteoclast differentiation(GO:0045672) |
| 0.1 | 0.8 | GO:0010815 | bradykinin catabolic process(GO:0010815) |
| 0.1 | 0.3 | GO:1900138 | oxidative stress-induced premature senescence(GO:0090403) negative regulation of phospholipase A2 activity(GO:1900138) |
| 0.1 | 0.5 | GO:0021553 | olfactory nerve development(GO:0021553) axonogenesis involved in innervation(GO:0060385) behavioral response to chemical pain(GO:0061366) behavioral response to formalin induced pain(GO:0061368) |
| 0.1 | 1.2 | GO:0045023 | G0 to G1 transition(GO:0045023) |
| 0.1 | 1.2 | GO:0036066 | protein O-linked fucosylation(GO:0036066) |
| 0.1 | 7.7 | GO:0033275 | muscle filament sliding(GO:0030049) actin-myosin filament sliding(GO:0033275) |
| 0.1 | 5.0 | GO:0009214 | cyclic nucleotide catabolic process(GO:0009214) |
| 0.1 | 0.2 | GO:2000399 | negative regulation of T cell differentiation in thymus(GO:0033085) negative regulation of thymocyte aggregation(GO:2000399) |
| 0.1 | 1.0 | GO:0010499 | proteasomal ubiquitin-independent protein catabolic process(GO:0010499) |
| 0.1 | 1.1 | GO:0002553 | histamine production involved in inflammatory response(GO:0002349) histamine secretion involved in inflammatory response(GO:0002441) histamine secretion by mast cell(GO:0002553) |
| 0.1 | 0.7 | GO:0006701 | progesterone biosynthetic process(GO:0006701) Sertoli cell proliferation(GO:0060011) |
| 0.1 | 0.4 | GO:0046882 | negative regulation of B cell differentiation(GO:0045578) negative regulation of follicle-stimulating hormone secretion(GO:0046882) |
| 0.1 | 0.5 | GO:0099590 | exocytic insertion of neurotransmitter receptor to plasma membrane(GO:0098881) exocytic insertion of neurotransmitter receptor to postsynaptic membrane(GO:0098967) neurotransmitter receptor internalization(GO:0099590) |
| 0.1 | 6.7 | GO:0042255 | ribosome assembly(GO:0042255) |
| 0.1 | 3.3 | GO:0006506 | GPI anchor biosynthetic process(GO:0006506) |
| 0.1 | 1.0 | GO:0051967 | negative regulation of synaptic transmission, glutamatergic(GO:0051967) |
| 0.1 | 1.4 | GO:0050774 | negative regulation of dendrite morphogenesis(GO:0050774) |
| 0.1 | 4.3 | GO:0097435 | fibril organization(GO:0097435) |
| 0.1 | 7.2 | GO:0006027 | glycosaminoglycan catabolic process(GO:0006027) |
| 0.1 | 9.0 | GO:0006892 | post-Golgi vesicle-mediated transport(GO:0006892) |
| 0.1 | 4.4 | GO:0042733 | embryonic digit morphogenesis(GO:0042733) |
| 0.1 | 0.3 | GO:2000314 | fibroblast growth factor receptor signaling pathway involved in neural plate anterior/posterior pattern formation(GO:0060825) regulation of neural crest formation(GO:0090299) negative regulation of neural crest formation(GO:0090301) regulation of fibroblast growth factor receptor signaling pathway involved in neural plate anterior/posterior pattern formation(GO:2000313) negative regulation of fibroblast growth factor receptor signaling pathway involved in neural plate anterior/posterior pattern formation(GO:2000314) |
| 0.1 | 0.3 | GO:0044375 | regulation of peroxisome size(GO:0044375) |
| 0.1 | 0.6 | GO:0045198 | establishment of epithelial cell apical/basal polarity(GO:0045198) |
| 0.1 | 3.2 | GO:0006294 | nucleotide-excision repair, preincision complex assembly(GO:0006294) |
| 0.1 | 1.3 | GO:0006995 | cellular response to nitrogen starvation(GO:0006995) cellular response to nitrogen levels(GO:0043562) |
| 0.1 | 2.6 | GO:0008038 | neuron recognition(GO:0008038) |
| 0.1 | 3.2 | GO:0050766 | positive regulation of phagocytosis(GO:0050766) |
| 0.1 | 3.9 | GO:0015701 | bicarbonate transport(GO:0015701) |
| 0.1 | 3.9 | GO:0007585 | respiratory gaseous exchange(GO:0007585) |
| 0.1 | 0.9 | GO:0000098 | sulfur amino acid catabolic process(GO:0000098) |
| 0.1 | 2.1 | GO:0014037 | Schwann cell differentiation(GO:0014037) |
| 0.1 | 0.3 | GO:0060013 | righting reflex(GO:0060013) |
| 0.1 | 0.9 | GO:0016024 | CDP-diacylglycerol biosynthetic process(GO:0016024) |
| 0.1 | 0.5 | GO:0035269 | protein mannosylation(GO:0035268) protein O-linked mannosylation(GO:0035269) |
| 0.1 | 2.5 | GO:0043044 | ATP-dependent chromatin remodeling(GO:0043044) |
| 0.1 | 1.1 | GO:0006349 | regulation of gene expression by genetic imprinting(GO:0006349) |
| 0.1 | 7.9 | GO:0048839 | inner ear development(GO:0048839) |
| 0.1 | 0.4 | GO:0032534 | regulation of microvillus assembly(GO:0032534) |
| 0.1 | 0.3 | GO:0090649 | response to oxygen-glucose deprivation(GO:0090649) cellular response to oxygen-glucose deprivation(GO:0090650) |
| 0.1 | 1.0 | GO:2000369 | regulation of clathrin-mediated endocytosis(GO:2000369) |
| 0.0 | 0.9 | GO:0001696 | gastric acid secretion(GO:0001696) |
| 0.0 | 8.5 | GO:0006814 | sodium ion transport(GO:0006814) |
| 0.0 | 1.5 | GO:0050855 | regulation of B cell receptor signaling pathway(GO:0050855) |
| 0.0 | 0.4 | GO:0006682 | galactosylceramide biosynthetic process(GO:0006682) galactolipid biosynthetic process(GO:0019375) |
| 0.0 | 1.2 | GO:0035249 | synaptic transmission, glutamatergic(GO:0035249) |
| 0.0 | 1.1 | GO:0000301 | retrograde transport, vesicle recycling within Golgi(GO:0000301) |
| 0.0 | 0.4 | GO:0071578 | zinc II ion transmembrane import(GO:0071578) |
| 0.0 | 0.5 | GO:0035116 | embryonic hindlimb morphogenesis(GO:0035116) |
| 0.0 | 1.6 | GO:0007190 | activation of adenylate cyclase activity(GO:0007190) |
| 0.0 | 0.1 | GO:0034227 | tRNA thio-modification(GO:0034227) |
| 0.0 | 2.4 | GO:0002576 | platelet degranulation(GO:0002576) |
| 0.0 | 0.6 | GO:0098779 | mitophagy in response to mitochondrial depolarization(GO:0098779) |
| 0.0 | 0.8 | GO:0035335 | peptidyl-tyrosine dephosphorylation(GO:0035335) |
| 0.0 | 1.7 | GO:0048706 | embryonic skeletal system development(GO:0048706) |
| 0.0 | 0.4 | GO:2000757 | negative regulation of peptidyl-lysine acetylation(GO:2000757) |
| 0.0 | 1.5 | GO:0051965 | positive regulation of synapse assembly(GO:0051965) |
| 0.0 | 1.3 | GO:0050911 | detection of chemical stimulus involved in sensory perception of smell(GO:0050911) |
| 0.0 | 0.3 | GO:0050982 | detection of mechanical stimulus(GO:0050982) |
| 0.0 | 2.5 | GO:0010811 | positive regulation of cell-substrate adhesion(GO:0010811) |
| 0.0 | 0.9 | GO:1903959 | regulation of anion transmembrane transport(GO:1903959) |
| 0.0 | 1.1 | GO:0007566 | embryo implantation(GO:0007566) |
| 0.0 | 1.6 | GO:0030433 | ER-associated ubiquitin-dependent protein catabolic process(GO:0030433) |
| 0.0 | 8.6 | GO:0007507 | heart development(GO:0007507) |
| 0.0 | 0.1 | GO:0017185 | peptidyl-lysine hydroxylation(GO:0017185) |
| 0.0 | 0.2 | GO:0042373 | vitamin K metabolic process(GO:0042373) |
| 0.0 | 0.3 | GO:0050890 | cognition(GO:0050890) |
| 0.0 | 2.6 | GO:0006805 | xenobiotic metabolic process(GO:0006805) |
| 0.0 | 0.2 | GO:0015825 | L-serine transport(GO:0015825) |
| 0.0 | 0.2 | GO:0006833 | water transport(GO:0006833) |
| 0.0 | 0.4 | GO:0002755 | MyD88-dependent toll-like receptor signaling pathway(GO:0002755) |
| 0.0 | 0.0 | GO:0070459 | positive regulation of acetylcholine secretion, neurotransmission(GO:0014057) prolactin secretion(GO:0070459) |
| 0.0 | 0.3 | GO:0006356 | regulation of transcription from RNA polymerase I promoter(GO:0006356) |
Gene overrepresentation in cellular_component category:
| Log-likelihood per target | Total log-likelihood | Term | Description |
|---|---|---|---|
| 3.0 | 45.4 | GO:0005916 | fascia adherens(GO:0005916) |
| 2.2 | 19.6 | GO:0070022 | transforming growth factor beta receptor homodimeric complex(GO:0070022) |
| 1.3 | 5.3 | GO:0070985 | TFIIK complex(GO:0070985) |
| 1.3 | 3.9 | GO:0031523 | Myb complex(GO:0031523) |
| 1.3 | 5.1 | GO:0071664 | beta-catenin-TCF7L2 complex(GO:0070369) catenin-TCF7L2 complex(GO:0071664) |
| 1.2 | 13.4 | GO:0097443 | sorting endosome(GO:0097443) |
| 1.2 | 7.1 | GO:1990130 | Iml1 complex(GO:1990130) |
| 1.1 | 33.5 | GO:0031092 | platelet alpha granule membrane(GO:0031092) |
| 1.0 | 5.8 | GO:0000015 | phosphopyruvate hydratase complex(GO:0000015) |
| 0.8 | 10.7 | GO:0097470 | ribbon synapse(GO:0097470) |
| 0.8 | 4.6 | GO:1990357 | terminal web(GO:1990357) |
| 0.7 | 4.1 | GO:0071817 | MMXD complex(GO:0071817) |
| 0.6 | 7.5 | GO:0008250 | oligosaccharyltransferase complex(GO:0008250) |
| 0.6 | 8.3 | GO:0031209 | SCAR complex(GO:0031209) |
| 0.6 | 25.4 | GO:0005790 | smooth endoplasmic reticulum(GO:0005790) |
| 0.6 | 3.4 | GO:0042406 | extrinsic component of endoplasmic reticulum membrane(GO:0042406) |
| 0.5 | 17.0 | GO:0005685 | U1 snRNP(GO:0005685) |
| 0.5 | 6.0 | GO:0060077 | inhibitory synapse(GO:0060077) |
| 0.5 | 3.9 | GO:0097208 | alveolar lamellar body(GO:0097208) |
| 0.5 | 2.7 | GO:1990584 | cardiac Troponin complex(GO:1990584) |
| 0.4 | 1.8 | GO:0019907 | cyclin-dependent protein kinase activating kinase holoenzyme complex(GO:0019907) |
| 0.4 | 8.1 | GO:0005862 | muscle thin filament tropomyosin(GO:0005862) |
| 0.4 | 2.8 | GO:0032584 | growth cone membrane(GO:0032584) |
| 0.4 | 12.4 | GO:0090568 | nuclear transcriptional repressor complex(GO:0090568) |
| 0.4 | 5.3 | GO:0005833 | hemoglobin complex(GO:0005833) |
| 0.4 | 12.1 | GO:0042101 | T cell receptor complex(GO:0042101) |
| 0.4 | 8.3 | GO:0031233 | intrinsic component of external side of plasma membrane(GO:0031233) |
| 0.3 | 4.4 | GO:0036038 | MKS complex(GO:0036038) |
| 0.3 | 35.3 | GO:0005913 | cell-cell adherens junction(GO:0005913) |
| 0.3 | 3.0 | GO:0035749 | myelin sheath adaxonal region(GO:0035749) |
| 0.3 | 3.7 | GO:0097136 | Bcl-2 family protein complex(GO:0097136) |
| 0.3 | 1.0 | GO:0035838 | growing cell tip(GO:0035838) |
| 0.3 | 2.1 | GO:0098559 | cytoplasmic side of early endosome membrane(GO:0098559) |
| 0.3 | 1.5 | GO:0032444 | activin responsive factor complex(GO:0032444) |
| 0.3 | 4.6 | GO:0005861 | troponin complex(GO:0005861) |
| 0.2 | 7.6 | GO:0045202 | synapse(GO:0045202) |
| 0.2 | 1.7 | GO:0000110 | nucleotide-excision repair factor 1 complex(GO:0000110) ERCC4-ERCC1 complex(GO:0070522) |
| 0.2 | 1.6 | GO:1903439 | calcitonin family receptor complex(GO:1903439) amylin receptor complex(GO:1903440) |
| 0.2 | 6.7 | GO:0030687 | preribosome, large subunit precursor(GO:0030687) |
| 0.2 | 4.3 | GO:0001527 | microfibril(GO:0001527) fibril(GO:0043205) |
| 0.2 | 2.5 | GO:0097433 | dense body(GO:0097433) |
| 0.2 | 4.3 | GO:0031143 | pseudopodium(GO:0031143) |
| 0.2 | 1.2 | GO:0043204 | perikaryon(GO:0043204) |
| 0.2 | 8.3 | GO:0031904 | endosome lumen(GO:0031904) |
| 0.2 | 6.9 | GO:0043034 | costamere(GO:0043034) |
| 0.1 | 13.7 | GO:0016459 | myosin complex(GO:0016459) |
| 0.1 | 1.8 | GO:1990454 | L-type voltage-gated calcium channel complex(GO:1990454) |
| 0.1 | 2.0 | GO:0031095 | platelet dense tubular network membrane(GO:0031095) |
| 0.1 | 0.4 | GO:0043512 | inhibin complex(GO:0043511) inhibin A complex(GO:0043512) |
| 0.1 | 4.8 | GO:0016592 | mediator complex(GO:0016592) |
| 0.1 | 0.8 | GO:0032280 | symmetric synapse(GO:0032280) |
| 0.1 | 0.5 | GO:0070032 | synaptobrevin 2-SNAP-25-syntaxin-1a-complexin I complex(GO:0070032) |
| 0.1 | 1.0 | GO:0072546 | ER membrane protein complex(GO:0072546) |
| 0.1 | 13.7 | GO:0005796 | Golgi lumen(GO:0005796) |
| 0.1 | 9.7 | GO:0005905 | clathrin-coated pit(GO:0005905) |
| 0.1 | 13.2 | GO:0048770 | melanosome(GO:0042470) pigment granule(GO:0048770) |
| 0.1 | 7.4 | GO:0033116 | endoplasmic reticulum-Golgi intermediate compartment membrane(GO:0033116) |
| 0.1 | 10.9 | GO:0000777 | condensed chromosome kinetochore(GO:0000777) |
| 0.1 | 11.3 | GO:0030018 | Z disc(GO:0030018) |
| 0.1 | 0.6 | GO:0000145 | exocyst(GO:0000145) |
| 0.1 | 2.4 | GO:0030669 | clathrin-coated endocytic vesicle membrane(GO:0030669) |
| 0.1 | 4.5 | GO:0005902 | microvillus(GO:0005902) |
| 0.1 | 0.3 | GO:0016600 | flotillin complex(GO:0016600) |
| 0.1 | 1.6 | GO:0008074 | guanylate cyclase complex, soluble(GO:0008074) |
| 0.1 | 1.6 | GO:0033017 | sarcoplasmic reticulum membrane(GO:0033017) |
| 0.1 | 1.4 | GO:0014704 | intercalated disc(GO:0014704) |
| 0.1 | 1.5 | GO:0032809 | neuronal cell body membrane(GO:0032809) cell body membrane(GO:0044298) |
| 0.1 | 14.7 | GO:0005788 | endoplasmic reticulum lumen(GO:0005788) |
| 0.0 | 4.2 | GO:0022625 | cytosolic large ribosomal subunit(GO:0022625) |
| 0.0 | 0.4 | GO:0030877 | beta-catenin destruction complex(GO:0030877) |
| 0.0 | 20.5 | GO:0031012 | extracellular matrix(GO:0031012) |
| 0.0 | 14.2 | GO:0016324 | apical plasma membrane(GO:0016324) |
| 0.0 | 2.8 | GO:0030672 | synaptic vesicle membrane(GO:0030672) exocytic vesicle membrane(GO:0099501) |
| 0.0 | 1.0 | GO:0032839 | dendrite cytoplasm(GO:0032839) |
| 0.0 | 1.0 | GO:0071564 | npBAF complex(GO:0071564) nBAF complex(GO:0071565) |
| 0.0 | 3.0 | GO:0008021 | synaptic vesicle(GO:0008021) |
| 0.0 | 16.7 | GO:0005856 | cytoskeleton(GO:0005856) |
| 0.0 | 8.2 | GO:0005925 | focal adhesion(GO:0005925) |
| 0.0 | 0.7 | GO:0097381 | photoreceptor disc membrane(GO:0097381) |
| 0.0 | 1.8 | GO:0030964 | mitochondrial respiratory chain complex I(GO:0005747) NADH dehydrogenase complex(GO:0030964) respiratory chain complex I(GO:0045271) |
| 0.0 | 0.4 | GO:0031258 | lamellipodium membrane(GO:0031258) |
| 0.0 | 1.6 | GO:0031907 | peroxisomal matrix(GO:0005782) microbody lumen(GO:0031907) |
| 0.0 | 3.8 | GO:0030133 | transport vesicle(GO:0030133) |
| 0.0 | 2.7 | GO:0005923 | bicellular tight junction(GO:0005923) |
| 0.0 | 0.5 | GO:0030686 | 90S preribosome(GO:0030686) |
| 0.0 | 0.9 | GO:0032588 | trans-Golgi network membrane(GO:0032588) |
| 0.0 | 0.5 | GO:0000421 | autophagosome membrane(GO:0000421) |
| 0.0 | 1.0 | GO:0022626 | cytosolic ribosome(GO:0022626) |
| 0.0 | 2.1 | GO:0031227 | intrinsic component of endoplasmic reticulum membrane(GO:0031227) |
| 0.0 | 1.0 | GO:0005884 | actin filament(GO:0005884) |
| 0.0 | 1.2 | GO:0032580 | Golgi cisterna membrane(GO:0032580) |
| 0.0 | 1.8 | GO:0045111 | intermediate filament cytoskeleton(GO:0045111) |
| 0.0 | 0.3 | GO:0005779 | integral component of peroxisomal membrane(GO:0005779) intrinsic component of peroxisomal membrane(GO:0031231) |
| 0.0 | 0.7 | GO:0043195 | terminal bouton(GO:0043195) |
| 0.0 | 0.2 | GO:0032281 | AMPA glutamate receptor complex(GO:0032281) |
| 0.0 | 0.4 | GO:0051233 | spindle midzone(GO:0051233) |
| 0.0 | 2.5 | GO:0045211 | postsynaptic membrane(GO:0045211) |
| 0.0 | 0.1 | GO:0030897 | HOPS complex(GO:0030897) |
Gene overrepresentation in molecular_function category:
| Log-likelihood per target | Total log-likelihood | Term | Description |
|---|---|---|---|
| 5.4 | 16.2 | GO:0004515 | nicotinate-nucleotide adenylyltransferase activity(GO:0004515) |
| 4.8 | 19.2 | GO:0001512 | dihydronicotinamide riboside quinone reductase activity(GO:0001512) melatonin binding(GO:1904408) |
| 2.4 | 17.0 | GO:0035614 | snRNA stem-loop binding(GO:0035614) |
| 2.3 | 18.7 | GO:0008379 | thioredoxin peroxidase activity(GO:0008379) |
| 1.8 | 45.4 | GO:0017166 | vinculin binding(GO:0017166) |
| 1.5 | 7.6 | GO:0004489 | methylenetetrahydrofolate reductase (NAD(P)H) activity(GO:0004489) |
| 1.5 | 10.7 | GO:0016618 | hydroxypyruvate reductase activity(GO:0016618) glyoxylate reductase (NADP) activity(GO:0030267) |
| 1.5 | 6.1 | GO:0003827 | alpha-1,3-mannosylglycoprotein 2-beta-N-acetylglucosaminyltransferase activity(GO:0003827) |
| 1.5 | 6.0 | GO:0005105 | type 1 fibroblast growth factor receptor binding(GO:0005105) |
| 1.3 | 13.2 | GO:0005432 | calcium:sodium antiporter activity(GO:0005432) |
| 1.2 | 6.0 | GO:0047374 | methylumbelliferyl-acetate deacetylase activity(GO:0047374) |
| 1.1 | 3.3 | GO:0005017 | platelet-derived growth factor-activated receptor activity(GO:0005017) |
| 1.0 | 4.0 | GO:0008184 | glycogen phosphorylase activity(GO:0008184) |
| 1.0 | 3.9 | GO:0034988 | Fc-gamma receptor I complex binding(GO:0034988) |
| 1.0 | 5.8 | GO:0004634 | phosphopyruvate hydratase activity(GO:0004634) |
| 0.9 | 5.5 | GO:0043183 | vascular endothelial growth factor receptor 1 binding(GO:0043183) |
| 0.9 | 19.6 | GO:0098748 | clathrin adaptor activity(GO:0035615) endocytic adaptor activity(GO:0098748) |
| 0.9 | 5.2 | GO:0010858 | calcium-dependent protein kinase regulator activity(GO:0010858) |
| 0.8 | 7.5 | GO:0004579 | dolichyl-diphosphooligosaccharide-protein glycotransferase activity(GO:0004579) |
| 0.7 | 4.1 | GO:0008046 | axon guidance receptor activity(GO:0008046) |
| 0.6 | 3.8 | GO:0009922 | fatty acid elongase activity(GO:0009922) 3-oxo-arachidoyl-CoA synthase activity(GO:0102336) 3-oxo-cerotoyl-CoA synthase activity(GO:0102337) 3-oxo-lignoceronyl-CoA synthase activity(GO:0102338) |
| 0.6 | 3.1 | GO:0004925 | prolactin receptor activity(GO:0004925) |
| 0.6 | 6.5 | GO:0001042 | RNA polymerase I core binding(GO:0001042) |
| 0.6 | 0.6 | GO:0051185 | coenzyme transporter activity(GO:0051185) |
| 0.5 | 7.7 | GO:0031014 | troponin T binding(GO:0031014) |
| 0.5 | 4.4 | GO:0000340 | RNA 7-methylguanosine cap binding(GO:0000340) |
| 0.5 | 4.2 | GO:0015217 | adenine nucleotide transmembrane transporter activity(GO:0000295) purine ribonucleotide transmembrane transporter activity(GO:0005346) ATP transmembrane transporter activity(GO:0005347) purine nucleotide transmembrane transporter activity(GO:0015216) ADP transmembrane transporter activity(GO:0015217) |
| 0.5 | 3.6 | GO:0016681 | ubiquinol-cytochrome-c reductase activity(GO:0008121) oxidoreductase activity, acting on diphenols and related substances as donors, cytochrome as acceptor(GO:0016681) |
| 0.5 | 4.4 | GO:0008158 | hedgehog receptor activity(GO:0008158) |
| 0.5 | 10.5 | GO:0030898 | actin-dependent ATPase activity(GO:0030898) |
| 0.4 | 5.3 | GO:0004128 | cytochrome-b5 reductase activity, acting on NAD(P)H(GO:0004128) |
| 0.4 | 13.7 | GO:0043015 | gamma-tubulin binding(GO:0043015) |
| 0.4 | 2.2 | GO:0005152 | interleukin-1 receptor antagonist activity(GO:0005152) |
| 0.4 | 4.6 | GO:0039706 | co-receptor binding(GO:0039706) |
| 0.4 | 2.4 | GO:0003747 | translation release factor activity(GO:0003747) translation termination factor activity(GO:0008079) |
| 0.4 | 5.9 | GO:0034185 | apolipoprotein binding(GO:0034185) |
| 0.4 | 2.7 | GO:0015277 | kainate selective glutamate receptor activity(GO:0015277) |
| 0.4 | 10.8 | GO:0030296 | protein tyrosine kinase activator activity(GO:0030296) |
| 0.4 | 2.2 | GO:0010997 | anaphase-promoting complex binding(GO:0010997) |
| 0.4 | 1.8 | GO:0070568 | guanylyltransferase activity(GO:0070568) |
| 0.4 | 3.3 | GO:0046975 | histone methyltransferase activity (H3-K36 specific)(GO:0046975) |
| 0.3 | 7.9 | GO:0005041 | low-density lipoprotein receptor activity(GO:0005041) |
| 0.3 | 6.5 | GO:0045295 | gamma-catenin binding(GO:0045295) |
| 0.3 | 1.4 | GO:0004850 | uridine phosphorylase activity(GO:0004850) |
| 0.3 | 5.1 | GO:0017151 | DEAD/H-box RNA helicase binding(GO:0017151) |
| 0.3 | 1.0 | GO:0003846 | 2-acylglycerol O-acyltransferase activity(GO:0003846) |
| 0.3 | 3.7 | GO:0051434 | BH3 domain binding(GO:0051434) |
| 0.3 | 2.0 | GO:1904929 | coreceptor activity involved in Wnt signaling pathway, planar cell polarity pathway(GO:1904929) |
| 0.3 | 2.0 | GO:0010859 | calcium-dependent cysteine-type endopeptidase inhibitor activity(GO:0010859) |
| 0.3 | 4.7 | GO:0016918 | retinal binding(GO:0016918) |
| 0.3 | 3.1 | GO:1901702 | urate transmembrane transporter activity(GO:0015143) salt transmembrane transporter activity(GO:1901702) |
| 0.3 | 11.1 | GO:0005520 | insulin-like growth factor binding(GO:0005520) |
| 0.3 | 6.4 | GO:0050750 | low-density lipoprotein particle receptor binding(GO:0050750) |
| 0.3 | 11.6 | GO:0035035 | histone acetyltransferase binding(GO:0035035) |
| 0.3 | 1.6 | GO:0016941 | natriuretic peptide receptor activity(GO:0016941) |
| 0.3 | 4.8 | GO:0042813 | Wnt-activated receptor activity(GO:0042813) |
| 0.3 | 1.0 | GO:0035651 | AP-3 adaptor complex binding(GO:0035651) |
| 0.3 | 3.3 | GO:0030957 | Tat protein binding(GO:0030957) |
| 0.3 | 1.5 | GO:0035258 | steroid hormone receptor binding(GO:0035258) |
| 0.2 | 3.9 | GO:0032036 | myosin heavy chain binding(GO:0032036) |
| 0.2 | 5.9 | GO:0030506 | ankyrin binding(GO:0030506) |
| 0.2 | 1.7 | GO:1990599 | 3' overhang single-stranded DNA endodeoxyribonuclease activity(GO:1990599) |
| 0.2 | 18.4 | GO:0008307 | structural constituent of muscle(GO:0008307) |
| 0.2 | 2.1 | GO:0047499 | calcium-independent phospholipase A2 activity(GO:0047499) |
| 0.2 | 6.6 | GO:0050431 | transforming growth factor beta binding(GO:0050431) |
| 0.2 | 1.6 | GO:0097643 | amylin receptor activity(GO:0097643) |
| 0.2 | 3.9 | GO:0008510 | sodium:bicarbonate symporter activity(GO:0008510) |
| 0.2 | 3.0 | GO:0005161 | platelet-derived growth factor receptor binding(GO:0005161) |
| 0.2 | 37.2 | GO:0044325 | ion channel binding(GO:0044325) |
| 0.2 | 1.3 | GO:0052655 | branched-chain-amino-acid transaminase activity(GO:0004084) L-leucine transaminase activity(GO:0052654) L-valine transaminase activity(GO:0052655) L-isoleucine transaminase activity(GO:0052656) |
| 0.2 | 33.6 | GO:0005178 | integrin binding(GO:0005178) |
| 0.2 | 4.2 | GO:0005537 | mannose binding(GO:0005537) |
| 0.2 | 1.5 | GO:0004126 | cytidine deaminase activity(GO:0004126) |
| 0.2 | 3.7 | GO:0017049 | GTP-Rho binding(GO:0017049) |
| 0.2 | 2.6 | GO:0004596 | peptide alpha-N-acetyltransferase activity(GO:0004596) |
| 0.2 | 1.2 | GO:0004118 | cGMP-stimulated cyclic-nucleotide phosphodiesterase activity(GO:0004118) |
| 0.2 | 2.9 | GO:0001161 | intronic transcription regulatory region sequence-specific DNA binding(GO:0001161) intronic transcription regulatory region DNA binding(GO:0044213) |
| 0.2 | 7.5 | GO:0000983 | transcription factor activity, RNA polymerase II core promoter sequence-specific(GO:0000983) |
| 0.2 | 4.2 | GO:0005092 | GDP-dissociation inhibitor activity(GO:0005092) |
| 0.2 | 1.3 | GO:0003828 | alpha-N-acetylneuraminate alpha-2,8-sialyltransferase activity(GO:0003828) |
| 0.2 | 28.9 | GO:0008201 | heparin binding(GO:0008201) |
| 0.2 | 0.7 | GO:0008940 | nitrate reductase activity(GO:0008940) |
| 0.2 | 4.3 | GO:0031489 | myosin V binding(GO:0031489) |
| 0.2 | 4.0 | GO:0005527 | macrolide binding(GO:0005527) FK506 binding(GO:0005528) |
| 0.2 | 0.6 | GO:0008410 | CoA-transferase activity(GO:0008410) |
| 0.2 | 18.4 | GO:0005070 | SH3/SH2 adaptor activity(GO:0005070) |
| 0.2 | 0.9 | GO:0045569 | TRAIL binding(GO:0045569) |
| 0.2 | 1.9 | GO:0016868 | intramolecular transferase activity, phosphotransferases(GO:0016868) |
| 0.2 | 1.5 | GO:0005072 | transforming growth factor beta receptor, cytoplasmic mediator activity(GO:0005072) |
| 0.2 | 11.1 | GO:0002039 | p53 binding(GO:0002039) |
| 0.2 | 0.8 | GO:0004468 | lysine N-acetyltransferase activity, acting on acetyl phosphate as donor(GO:0004468) |
| 0.1 | 0.7 | GO:0008048 | calcium sensitive guanylate cyclase activator activity(GO:0008048) |
| 0.1 | 2.2 | GO:0008417 | fucosyltransferase activity(GO:0008417) |
| 0.1 | 4.2 | GO:0015248 | sterol transporter activity(GO:0015248) |
| 0.1 | 1.6 | GO:0016290 | palmitoyl-CoA hydrolase activity(GO:0016290) |
| 0.1 | 0.7 | GO:0060175 | brain-derived neurotrophic factor-activated receptor activity(GO:0060175) |
| 0.1 | 3.2 | GO:0008353 | RNA polymerase II carboxy-terminal domain kinase activity(GO:0008353) |
| 0.1 | 0.5 | GO:0005166 | neurotrophin p75 receptor binding(GO:0005166) |
| 0.1 | 1.0 | GO:0035612 | AP-2 adaptor complex binding(GO:0035612) |
| 0.1 | 1.4 | GO:0015095 | magnesium ion transmembrane transporter activity(GO:0015095) |
| 0.1 | 1.6 | GO:0051787 | misfolded protein binding(GO:0051787) |
| 0.1 | 1.3 | GO:0004571 | mannosyl-oligosaccharide 1,2-alpha-mannosidase activity(GO:0004571) |
| 0.1 | 1.6 | GO:0008179 | adenylate cyclase binding(GO:0008179) |
| 0.1 | 0.2 | GO:0004971 | AMPA glutamate receptor activity(GO:0004971) |
| 0.1 | 3.9 | GO:0017091 | AU-rich element binding(GO:0017091) |
| 0.1 | 1.4 | GO:0017034 | Rap guanyl-nucleotide exchange factor activity(GO:0017034) |
| 0.1 | 0.4 | GO:0070290 | N-acylphosphatidylethanolamine-specific phospholipase D activity(GO:0070290) |
| 0.1 | 4.6 | GO:0005154 | epidermal growth factor receptor binding(GO:0005154) |
| 0.1 | 3.2 | GO:0001671 | ATPase activator activity(GO:0001671) |
| 0.1 | 3.3 | GO:0070412 | R-SMAD binding(GO:0070412) |
| 0.1 | 0.9 | GO:0004969 | histamine receptor activity(GO:0004969) |
| 0.1 | 1.8 | GO:0008331 | high voltage-gated calcium channel activity(GO:0008331) |
| 0.1 | 0.5 | GO:0004169 | dolichyl-phosphate-mannose-protein mannosyltransferase activity(GO:0004169) |
| 0.1 | 1.8 | GO:0031434 | mitogen-activated protein kinase kinase binding(GO:0031434) |
| 0.1 | 1.1 | GO:0000030 | mannosyltransferase activity(GO:0000030) |
| 0.1 | 3.1 | GO:0004112 | cyclic-nucleotide phosphodiesterase activity(GO:0004112) |
| 0.1 | 1.5 | GO:0005104 | fibroblast growth factor receptor binding(GO:0005104) |
| 0.1 | 2.9 | GO:0030374 | ligand-dependent nuclear receptor transcription coactivator activity(GO:0030374) |
| 0.1 | 2.0 | GO:0015485 | cholesterol binding(GO:0015485) |
| 0.1 | 1.3 | GO:0004993 | G-protein coupled serotonin receptor activity(GO:0004993) |
| 0.1 | 7.5 | GO:0001104 | RNA polymerase II transcription cofactor activity(GO:0001104) |
| 0.1 | 2.7 | GO:0004674 | protein serine/threonine kinase activity(GO:0004674) |
| 0.1 | 1.3 | GO:0004029 | aldehyde dehydrogenase (NAD) activity(GO:0004029) |
| 0.1 | 3.4 | GO:0046332 | SMAD binding(GO:0046332) |
| 0.1 | 1.2 | GO:0016854 | racemase and epimerase activity(GO:0016854) |
| 0.1 | 23.8 | GO:0001077 | transcriptional activator activity, RNA polymerase II core promoter proximal region sequence-specific binding(GO:0001077) |
| 0.1 | 26.7 | GO:0005525 | GTP binding(GO:0005525) |
| 0.1 | 0.6 | GO:0017160 | Ral GTPase binding(GO:0017160) |
| 0.1 | 5.1 | GO:0005201 | extracellular matrix structural constituent(GO:0005201) |
| 0.1 | 3.2 | GO:0001540 | beta-amyloid binding(GO:0001540) |
| 0.1 | 0.4 | GO:0034711 | inhibin binding(GO:0034711) |
| 0.0 | 1.6 | GO:0030507 | spectrin binding(GO:0030507) |
| 0.0 | 6.3 | GO:0004896 | cytokine receptor activity(GO:0004896) |
| 0.0 | 17.6 | GO:0004930 | G-protein coupled receptor activity(GO:0004930) |
| 0.0 | 0.2 | GO:0047057 | oxidoreductase activity, acting on the CH-OH group of donors, disulfide as acceptor(GO:0016900) vitamin-K-epoxide reductase (warfarin-sensitive) activity(GO:0047057) |
| 0.0 | 0.3 | GO:0050694 | galactosylceramide sulfotransferase activity(GO:0001733) galactose 3-O-sulfotransferase activity(GO:0050694) |
| 0.0 | 0.9 | GO:0005247 | voltage-gated chloride channel activity(GO:0005247) |
| 0.0 | 0.9 | GO:0003841 | 1-acylglycerol-3-phosphate O-acyltransferase activity(GO:0003841) |
| 0.0 | 0.7 | GO:0050811 | GABA receptor binding(GO:0050811) |
| 0.0 | 1.9 | GO:0051539 | 4 iron, 4 sulfur cluster binding(GO:0051539) |
| 0.0 | 0.8 | GO:0070006 | metalloaminopeptidase activity(GO:0070006) |
| 0.0 | 0.9 | GO:0016702 | oxidoreductase activity, acting on single donors with incorporation of molecular oxygen, incorporation of two atoms of oxygen(GO:0016702) |
| 0.0 | 1.6 | GO:0005484 | SNAP receptor activity(GO:0005484) |
| 0.0 | 0.8 | GO:0005388 | calcium-transporting ATPase activity(GO:0005388) |
| 0.0 | 1.2 | GO:0005272 | sodium channel activity(GO:0005272) |
| 0.0 | 1.2 | GO:0030971 | receptor tyrosine kinase binding(GO:0030971) |
| 0.0 | 0.5 | GO:0070577 | lysine-acetylated histone binding(GO:0070577) |
| 0.0 | 0.3 | GO:0001871 | pattern binding(GO:0001871) polysaccharide binding(GO:0030247) |
| 0.0 | 2.7 | GO:0016788 | hydrolase activity, acting on ester bonds(GO:0016788) |
| 0.0 | 0.1 | GO:0097016 | L27 domain binding(GO:0097016) |
| 0.0 | 0.4 | GO:0005385 | zinc ion transmembrane transporter activity(GO:0005385) |
| 0.0 | 3.7 | GO:0061630 | ubiquitin protein ligase activity(GO:0061630) |
| 0.0 | 2.4 | GO:0017137 | Rab GTPase binding(GO:0017137) |
| 0.0 | 0.6 | GO:0051879 | Hsp90 protein binding(GO:0051879) |
| 0.0 | 0.2 | GO:0022889 | L-serine transmembrane transporter activity(GO:0015194) serine transmembrane transporter activity(GO:0022889) |
| 0.0 | 1.8 | GO:0001227 | transcriptional repressor activity, RNA polymerase II transcription regulatory region sequence-specific binding(GO:0001227) |
| 0.0 | 0.2 | GO:0015250 | water channel activity(GO:0015250) |
| 0.0 | 0.4 | GO:0005212 | structural constituent of eye lens(GO:0005212) |
| 0.0 | 0.3 | GO:0043274 | phospholipase binding(GO:0043274) |
| 0.0 | 1.9 | GO:0000978 | RNA polymerase II core promoter proximal region sequence-specific DNA binding(GO:0000978) |
| 0.0 | 1.0 | GO:0005200 | structural constituent of cytoskeleton(GO:0005200) |
| 0.0 | 0.5 | GO:0008137 | NADH dehydrogenase (ubiquinone) activity(GO:0008137) NADH dehydrogenase (quinone) activity(GO:0050136) |
| 0.0 | 0.7 | GO:0008028 | monocarboxylic acid transmembrane transporter activity(GO:0008028) |
Gene overrepresentation in C2:CP category:
| Log-likelihood per target | Total log-likelihood | Term | Description |
|---|---|---|---|
| 1.2 | 73.6 | PID SYNDECAN 4 PATHWAY | Syndecan-4-mediated signaling events |
| 0.5 | 42.8 | PID A6B1 A6B4 INTEGRIN PATHWAY | a6b1 and a6b4 Integrin signaling |
| 0.4 | 8.2 | PID S1P S1P3 PATHWAY | S1P3 pathway |
| 0.4 | 13.4 | PID S1P S1P2 PATHWAY | S1P2 pathway |
| 0.3 | 18.2 | PID CDC42 REG PATHWAY | Regulation of CDC42 activity |
| 0.3 | 25.8 | PID TGFBR PATHWAY | TGF-beta receptor signaling |
| 0.3 | 4.0 | SA G2 AND M PHASES | Cdc25 activates the cdc2/cyclin B complex to induce the G2/M transition. |
| 0.3 | 20.6 | PID HIF1 TFPATHWAY | HIF-1-alpha transcription factor network |
| 0.2 | 11.6 | PID HIF2PATHWAY | HIF-2-alpha transcription factor network |
| 0.2 | 6.1 | PID WNT SIGNALING PATHWAY | Wnt signaling network |
| 0.2 | 6.4 | NABA BASEMENT MEMBRANES | Genes encoding structural components of basement membranes |
| 0.2 | 4.4 | PID ERBB NETWORK PATHWAY | ErbB receptor signaling network |
| 0.2 | 10.2 | SIG REGULATION OF THE ACTIN CYTOSKELETON BY RHO GTPASES | Genes related to regulation of the actin cytoskeleton |
| 0.2 | 3.7 | SA PROGRAMMED CELL DEATH | Programmed cell death, or apoptosis, eliminates damaged or unneeded cells. |
| 0.1 | 8.5 | PID HNF3B PATHWAY | FOXA2 and FOXA3 transcription factor networks |
| 0.1 | 13.7 | WNT SIGNALING | Genes related to Wnt-mediated signal transduction |
| 0.1 | 23.6 | NABA ECM GLYCOPROTEINS | Genes encoding structural ECM glycoproteins |
| 0.1 | 6.6 | PID AJDISS 2PATHWAY | Posttranslational regulation of adherens junction stability and dissassembly |
| 0.1 | 3.0 | PID UPA UPAR PATHWAY | Urokinase-type plasminogen activator (uPA) and uPAR-mediated signaling |
| 0.1 | 6.8 | PID MTOR 4PATHWAY | mTOR signaling pathway |
| 0.1 | 3.1 | PID ERBB4 PATHWAY | ErbB4 signaling events |
| 0.1 | 4.6 | PID RAC1 PATHWAY | RAC1 signaling pathway |
| 0.1 | 1.4 | ST G ALPHA S PATHWAY | G alpha s Pathway |
| 0.1 | 1.0 | PID WNT CANONICAL PATHWAY | Canonical Wnt signaling pathway |
| 0.1 | 3.3 | PID IL12 STAT4 PATHWAY | IL12 signaling mediated by STAT4 |
| 0.1 | 3.1 | PID CDC42 PATHWAY | CDC42 signaling events |
| 0.1 | 0.5 | SA TRKA RECEPTOR | The TrkA receptor binds nerve growth factor to activate MAP kinase pathways and promote cell growth. |
| 0.1 | 6.6 | PID E2F PATHWAY | E2F transcription factor network |
| 0.1 | 5.1 | PID BETA CATENIN NUC PATHWAY | Regulation of nuclear beta catenin signaling and target gene transcription |
| 0.1 | 4.8 | PID NFAT TFPATHWAY | Calcineurin-regulated NFAT-dependent transcription in lymphocytes |
| 0.1 | 0.8 | PID FAK PATHWAY | Signaling events mediated by focal adhesion kinase |
| 0.0 | 1.9 | PID ATR PATHWAY | ATR signaling pathway |
| 0.0 | 1.5 | PID ANGIOPOIETIN RECEPTOR PATHWAY | Angiopoietin receptor Tie2-mediated signaling |
| 0.0 | 0.7 | PID CONE PATHWAY | Visual signal transduction: Cones |
| 0.0 | 1.6 | PID LKB1 PATHWAY | LKB1 signaling events |
| 0.0 | 0.6 | SIG INSULIN RECEPTOR PATHWAY IN CARDIAC MYOCYTES | Genes related to the insulin receptor pathway |
| 0.0 | 1.0 | ST FAS SIGNALING PATHWAY | Fas Signaling Pathway |
| 0.0 | 0.8 | NABA PROTEOGLYCANS | Genes encoding proteoglycans |
| 0.0 | 0.2 | PID EPHB FWD PATHWAY | EPHB forward signaling |
Gene overrepresentation in C2:CP:REACTOME category:
| Log-likelihood per target | Total log-likelihood | Term | Description |
|---|---|---|---|
| 2.0 | 56.0 | REACTOME CELL EXTRACELLULAR MATRIX INTERACTIONS | Genes involved in Cell-extracellular matrix interactions |
| 1.1 | 19.6 | REACTOME GAP JUNCTION DEGRADATION | Genes involved in Gap junction degradation |
| 0.9 | 15.2 | REACTOME CALNEXIN CALRETICULIN CYCLE | Genes involved in Calnexin/calreticulin cycle |
| 0.5 | 15.3 | REACTOME ADHERENS JUNCTIONS INTERACTIONS | Genes involved in Adherens junctions interactions |
| 0.4 | 29.8 | REACTOME METABOLISM OF VITAMINS AND COFACTORS | Genes involved in Metabolism of vitamins and cofactors |
| 0.4 | 9.1 | REACTOME DOWNREGULATION OF ERBB2 ERBB3 SIGNALING | Genes involved in Downregulation of ERBB2:ERBB3 signaling |
| 0.4 | 17.1 | REACTOME REGULATION OF HYPOXIA INDUCIBLE FACTOR HIF BY OXYGEN | Genes involved in Regulation of Hypoxia-inducible Factor (HIF) by Oxygen |
| 0.3 | 6.4 | REACTOME CHYLOMICRON MEDIATED LIPID TRANSPORT | Genes involved in Chylomicron-mediated lipid transport |
| 0.2 | 3.7 | REACTOME SYNTHESIS OF SUBSTRATES IN N GLYCAN BIOSYTHESIS | Genes involved in Synthesis of substrates in N-glycan biosythesis |
| 0.2 | 29.8 | REACTOME RESPONSE TO ELEVATED PLATELET CYTOSOLIC CA2 | Genes involved in Response to elevated platelet cytosolic Ca2+ |
| 0.2 | 8.6 | REACTOME BASIGIN INTERACTIONS | Genes involved in Basigin interactions |
| 0.2 | 15.4 | REACTOME STRIATED MUSCLE CONTRACTION | Genes involved in Striated Muscle Contraction |
| 0.2 | 8.3 | REACTOME FORMATION OF FIBRIN CLOT CLOTTING CASCADE | Genes involved in Formation of Fibrin Clot (Clotting Cascade) |
| 0.2 | 5.3 | REACTOME CYCLIN A B1 ASSOCIATED EVENTS DURING G2 M TRANSITION | Genes involved in Cyclin A/B1 associated events during G2/M transition |
| 0.2 | 3.8 | REACTOME SYNTHESIS OF VERY LONG CHAIN FATTY ACYL COAS | Genes involved in Synthesis of very long-chain fatty acyl-CoAs |
| 0.2 | 14.9 | REACTOME ASPARAGINE N LINKED GLYCOSYLATION | Genes involved in Asparagine N-linked glycosylation |
| 0.2 | 10.9 | REACTOME DEPOSITION OF NEW CENPA CONTAINING NUCLEOSOMES AT THE CENTROMERE | Genes involved in Deposition of New CENPA-containing Nucleosomes at the Centromere |
| 0.2 | 3.9 | REACTOME ACTIVATION OF RAC | Genes involved in Activation of Rac |
| 0.1 | 3.1 | REACTOME ORGANIC CATION ANION ZWITTERION TRANSPORT | Genes involved in Organic cation/anion/zwitterion transport |
| 0.1 | 2.7 | REACTOME INITIAL TRIGGERING OF COMPLEMENT | Genes involved in Initial triggering of complement |
| 0.1 | 5.8 | REACTOME GLYCOLYSIS | Genes involved in Glycolysis |
| 0.1 | 2.3 | REACTOME IONOTROPIC ACTIVITY OF KAINATE RECEPTORS | Genes involved in Ionotropic activity of Kainate Receptors |
| 0.1 | 4.8 | REACTOME TGF BETA RECEPTOR SIGNALING ACTIVATES SMADS | Genes involved in TGF-beta receptor signaling activates SMADs |
| 0.1 | 3.9 | REACTOME MUSCLE CONTRACTION | Genes involved in Muscle contraction |
| 0.1 | 1.6 | REACTOME ALPHA LINOLENIC ACID ALA METABOLISM | Genes involved in alpha-linolenic acid (ALA) metabolism |
| 0.1 | 0.5 | REACTOME RETROGRADE NEUROTROPHIN SIGNALLING | Genes involved in Retrograde neurotrophin signalling |
| 0.1 | 2.6 | REACTOME PROLACTIN RECEPTOR SIGNALING | Genes involved in Prolactin receptor signaling |
| 0.1 | 1.4 | REACTOME PYRIMIDINE CATABOLISM | Genes involved in Pyrimidine catabolism |
| 0.1 | 3.0 | REACTOME SYNTHESIS AND INTERCONVERSION OF NUCLEOTIDE DI AND TRIPHOSPHATES | Genes involved in Synthesis and interconversion of nucleotide di- and triphosphates |
| 0.1 | 1.2 | REACTOME SHC MEDIATED SIGNALLING | Genes involved in SHC-mediated signalling |
| 0.1 | 1.1 | REACTOME GLYCOPROTEIN HORMONES | Genes involved in Glycoprotein hormones |
| 0.1 | 8.5 | REACTOME L1CAM INTERACTIONS | Genes involved in L1CAM interactions |
| 0.1 | 1.5 | REACTOME PYRIMIDINE METABOLISM | Genes involved in Pyrimidine metabolism |
| 0.1 | 5.4 | REACTOME RESPIRATORY ELECTRON TRANSPORT | Genes involved in Respiratory electron transport |
| 0.1 | 0.9 | REACTOME SIGNALING BY CONSTITUTIVELY ACTIVE EGFR | Genes involved in Signaling by constitutively active EGFR |
| 0.1 | 3.2 | REACTOME MITOCHONDRIAL PROTEIN IMPORT | Genes involved in Mitochondrial Protein Import |
| 0.1 | 5.9 | REACTOME CLASS B 2 SECRETIN FAMILY RECEPTORS | Genes involved in Class B/2 (Secretin family receptors) |
| 0.0 | 1.3 | REACTOME BRANCHED CHAIN AMINO ACID CATABOLISM | Genes involved in Branched-chain amino acid catabolism |
| 0.0 | 3.9 | REACTOME TRANS GOLGI NETWORK VESICLE BUDDING | Genes involved in trans-Golgi Network Vesicle Budding |
| 0.0 | 4.2 | REACTOME MHC CLASS II ANTIGEN PRESENTATION | Genes involved in MHC class II antigen presentation |
| 0.0 | 1.0 | REACTOME REGULATION OF GENE EXPRESSION IN BETA CELLS | Genes involved in Regulation of gene expression in beta cells |
| 0.0 | 1.3 | REACTOME SYNTHESIS OF PA | Genes involved in Synthesis of PA |
| 0.0 | 3.4 | REACTOME TRANSCRIPTIONAL REGULATION OF WHITE ADIPOCYTE DIFFERENTIATION | Genes involved in Transcriptional Regulation of White Adipocyte Differentiation |
| 0.0 | 0.5 | REACTOME NOREPINEPHRINE NEUROTRANSMITTER RELEASE CYCLE | Genes involved in Norepinephrine Neurotransmitter Release Cycle |
| 0.0 | 0.8 | REACTOME CS DS DEGRADATION | Genes involved in CS/DS degradation |
| 0.0 | 1.8 | REACTOME ACTIVATION OF CHAPERONE GENES BY XBP1S | Genes involved in Activation of Chaperone Genes by XBP1(S) |
| 0.0 | 1.3 | REACTOME OLFACTORY SIGNALING PATHWAY | Genes involved in Olfactory Signaling Pathway |
| 0.0 | 0.4 | REACTOME ZINC TRANSPORTERS | Genes involved in Zinc transporters |
| 0.0 | 0.9 | REACTOME AMINE LIGAND BINDING RECEPTORS | Genes involved in Amine ligand-binding receptors |
| 0.0 | 0.5 | REACTOME SIGNALING BY HIPPO | Genes involved in Signaling by Hippo |
| 0.0 | 0.2 | REACTOME PASSIVE TRANSPORT BY AQUAPORINS | Genes involved in Passive Transport by Aquaporins |
| 0.0 | 0.2 | REACTOME TRAFFICKING OF GLUR2 CONTAINING AMPA RECEPTORS | Genes involved in Trafficking of GluR2-containing AMPA receptors |
| 0.0 | 0.9 | REACTOME APOPTOTIC CLEAVAGE OF CELLULAR PROTEINS | Genes involved in Apoptotic cleavage of cellular proteins |
| 0.0 | 0.5 | REACTOME PREFOLDIN MEDIATED TRANSFER OF SUBSTRATE TO CCT TRIC | Genes involved in Prefoldin mediated transfer of substrate to CCT/TriC |
| 0.0 | 1.1 | REACTOME FACTORS INVOLVED IN MEGAKARYOCYTE DEVELOPMENT AND PLATELET PRODUCTION | Genes involved in Factors involved in megakaryocyte development and platelet production |
| 0.0 | 0.6 | REACTOME TRANSPORT OF VITAMINS NUCLEOSIDES AND RELATED MOLECULES | Genes involved in Transport of vitamins, nucleosides, and related molecules |