Project
GNF SymAtlas + NCI-60 cancer cell lines, comparison of cancers vs non-cancers, human (Su, 2004; Ross, 2000)
Navigation
Downloads
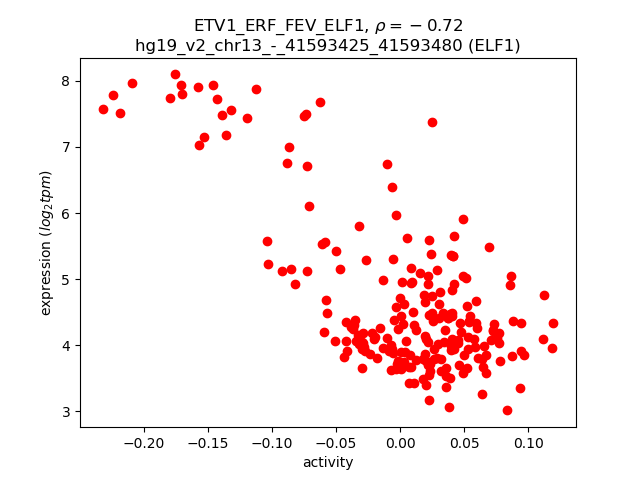
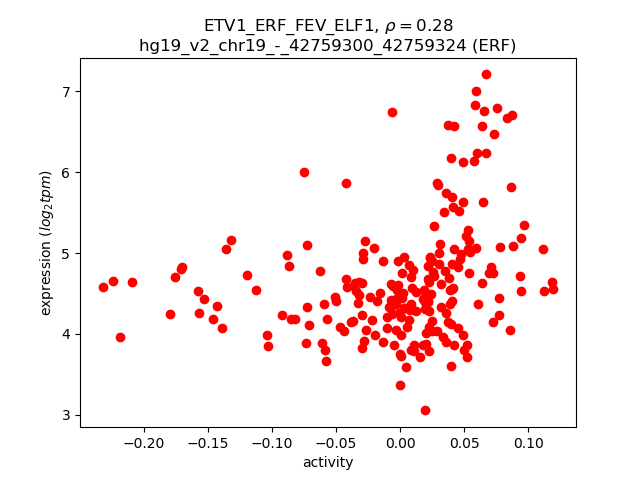
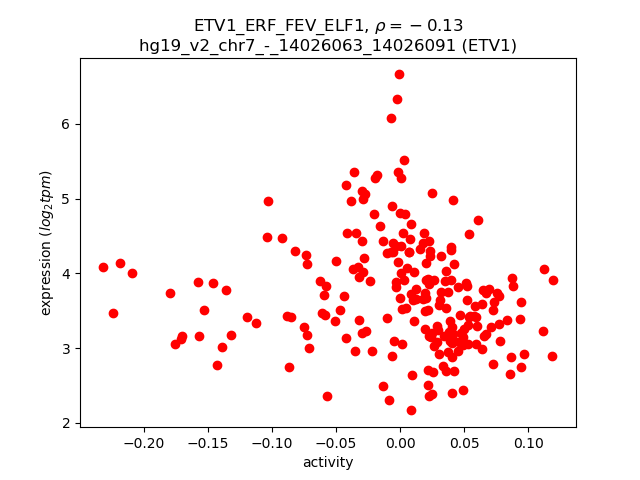
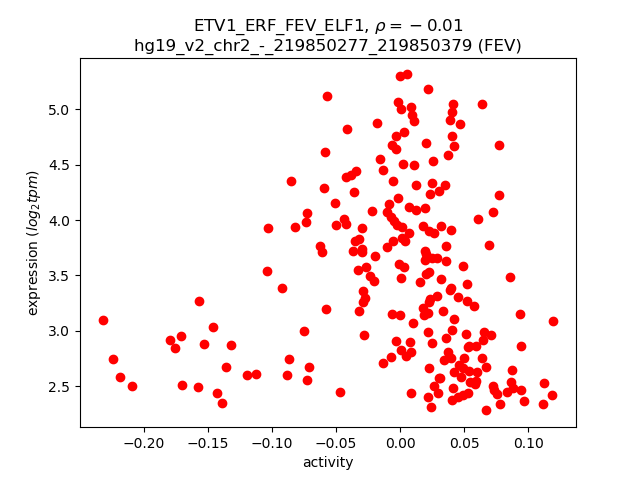
Results for ETV1_ERF_FEV_ELF1
Z-value: 0.52
Motif logo
Transcription factors associated with ETV1_ERF_FEV_ELF1
| Gene Symbol | Gene ID | Gene Info |
|---|---|---|
|
ETV1
|
ENSG00000006468.9 | ETS variant transcription factor 1 |
|
ERF
|
ENSG00000105722.5 | ETS2 repressor factor |
|
FEV
|
ENSG00000163497.2 | FEV transcription factor, ETS family member |
|
ELF1
|
ENSG00000120690.9 | E74 like ETS transcription factor 1 |
Activity-expression correlation:
| Gene | Promoter | Pearson corr. coef. | P-value | Plot |
|---|---|---|---|---|
| ELF1 | hg19_v2_chr13_-_41593425_41593480 | -0.72 | 1.3e-35 | Click! |
| ERF | hg19_v2_chr19_-_42759300_42759324 | 0.28 | 3.2e-05 | Click! |
| ETV1 | hg19_v2_chr7_-_14026063_14026091 | -0.13 | 6.4e-02 | Click! |
| FEV | hg19_v2_chr2_-_219850277_219850379 | -0.01 | 8.4e-01 | Click! |
Activity profile of ETV1_ERF_FEV_ELF1 motif
Sorted Z-values of ETV1_ERF_FEV_ELF1 motif
| Promoter | Log-likelihood | Transcript | Gene | Gene Info |
|---|---|---|---|---|
| chr14_-_69864993 | 130.67 |
ENST00000555373.1
|
ERH
|
enhancer of rudimentary homolog (Drosophila) |
| chr1_-_169337176 | 89.21 |
ENST00000472647.1
ENST00000367811.3 |
NME7
|
NME/NM23 family member 7 |
| chr8_+_145133493 | 72.56 |
ENST00000316052.5
ENST00000525936.1 |
EXOSC4
|
exosome component 4 |
| chr5_-_140070897 | 69.93 |
ENST00000448240.1
ENST00000438307.2 ENST00000415192.2 ENST00000457527.2 ENST00000307633.3 ENST00000507746.1 ENST00000431330.2 |
HARS
|
histidyl-tRNA synthetase |
| chr2_+_177134134 | 68.99 |
ENST00000249442.6
ENST00000392529.2 ENST00000443241.1 |
MTX2
|
metaxin 2 |
| chr2_+_177134201 | 64.11 |
ENST00000452865.1
|
MTX2
|
metaxin 2 |
| chr5_+_892745 | 63.74 |
ENST00000166345.3
|
TRIP13
|
thyroid hormone receptor interactor 13 |
| chr18_-_812517 | 63.36 |
ENST00000584307.1
|
YES1
|
v-yes-1 Yamaguchi sarcoma viral oncogene homolog 1 |
| chr5_+_68530668 | 63.29 |
ENST00000506563.1
|
CDK7
|
cyclin-dependent kinase 7 |
| chr8_+_30300119 | 60.30 |
ENST00000520191.1
|
RBPMS
|
RNA binding protein with multiple splicing |
| chr15_+_90808919 | 60.07 |
ENST00000379095.3
|
NGRN
|
neugrin, neurite outgrowth associated |
| chr1_+_154947126 | 59.99 |
ENST00000368439.1
|
CKS1B
|
CDC28 protein kinase regulatory subunit 1B |
| chr18_-_812231 | 56.90 |
ENST00000314574.4
|
YES1
|
v-yes-1 Yamaguchi sarcoma viral oncogene homolog 1 |
| chr17_-_57784755 | 55.29 |
ENST00000537860.1
ENST00000393038.2 ENST00000409433.2 |
PTRH2
|
peptidyl-tRNA hydrolase 2 |
| chr8_-_121457332 | 54.39 |
ENST00000518918.1
|
MRPL13
|
mitochondrial ribosomal protein L13 |
| chr11_-_46722117 | 53.82 |
ENST00000311956.4
|
ARHGAP1
|
Rho GTPase activating protein 1 |
| chrX_-_153775426 | 52.71 |
ENST00000393562.2
|
G6PD
|
glucose-6-phosphate dehydrogenase |
| chr1_-_43638168 | 51.77 |
ENST00000431635.2
|
EBNA1BP2
|
EBNA1 binding protein 2 |
| chr5_+_68530697 | 51.28 |
ENST00000256443.3
ENST00000514676.1 |
CDK7
|
cyclin-dependent kinase 7 |
| chr11_+_118889456 | 51.09 |
ENST00000528230.1
ENST00000525303.1 ENST00000434101.2 ENST00000359005.4 ENST00000533058.1 |
TRAPPC4
|
trafficking protein particle complex 4 |
| chr2_-_110371720 | 50.42 |
ENST00000356688.4
|
SEPT10
|
septin 10 |
| chr1_-_43637915 | 48.86 |
ENST00000236051.2
|
EBNA1BP2
|
EBNA1 binding protein 2 |
| chr1_-_43855444 | 48.37 |
ENST00000372455.4
|
MED8
|
mediator complex subunit 8 |
| chr11_+_70244510 | 48.18 |
ENST00000346329.3
ENST00000301843.8 ENST00000376561.3 |
CTTN
|
cortactin |
| chr2_-_110371777 | 46.90 |
ENST00000397712.2
|
SEPT10
|
septin 10 |
| chr12_-_110888103 | 46.82 |
ENST00000426440.1
ENST00000228825.7 |
ARPC3
|
actin related protein 2/3 complex, subunit 3, 21kDa |
| chr2_-_73964447 | 46.62 |
ENST00000272424.5
ENST00000409716.2 ENST00000318190.7 |
TPRKB
|
TP53RK binding protein |
| chr11_+_118889142 | 46.30 |
ENST00000533632.1
|
TRAPPC4
|
trafficking protein particle complex 4 |
| chr8_-_121457608 | 45.35 |
ENST00000306185.3
|
MRPL13
|
mitochondrial ribosomal protein L13 |
| chr20_-_54967187 | 43.44 |
ENST00000422322.1
ENST00000371356.2 ENST00000451915.1 ENST00000347343.2 ENST00000395911.1 ENST00000395907.1 ENST00000441357.1 ENST00000456249.1 ENST00000420474.1 ENST00000395909.4 ENST00000395914.1 ENST00000312783.6 ENST00000395915.3 ENST00000395913.3 |
AURKA
|
aurora kinase A |
| chr3_-_57583185 | 42.46 |
ENST00000463880.1
|
ARF4
|
ADP-ribosylation factor 4 |
| chr1_-_1310530 | 42.18 |
ENST00000338370.3
ENST00000321751.5 ENST00000378853.3 |
AURKAIP1
|
aurora kinase A interacting protein 1 |
| chrX_+_51546103 | 41.43 |
ENST00000375772.3
|
MAGED1
|
melanoma antigen family D, 1 |
| chr7_+_128379346 | 41.36 |
ENST00000535011.2
ENST00000542996.2 ENST00000535623.1 ENST00000538546.1 ENST00000249364.4 ENST00000449187.2 |
CALU
|
calumenin |
| chr11_-_116658695 | 41.14 |
ENST00000429220.1
ENST00000444935.1 |
ZNF259
|
zinc finger protein 259 |
| chr20_-_49575058 | 40.36 |
ENST00000371584.4
ENST00000371583.5 ENST00000413082.1 |
DPM1
|
dolichyl-phosphate mannosyltransferase polypeptide 1, catalytic subunit |
| chr1_-_1310870 | 40.24 |
ENST00000338338.5
|
AURKAIP1
|
aurora kinase A interacting protein 1 |
| chr7_+_102988082 | 40.09 |
ENST00000292644.3
ENST00000544811.1 |
PSMC2
|
proteasome (prosome, macropain) 26S subunit, ATPase, 2 |
| chr20_+_30327063 | 39.86 |
ENST00000300403.6
ENST00000340513.4 |
TPX2
|
TPX2, microtubule-associated |
| chr7_+_128379449 | 39.78 |
ENST00000479257.1
|
CALU
|
calumenin |
| chr1_+_32687971 | 39.72 |
ENST00000373586.1
|
EIF3I
|
eukaryotic translation initiation factor 3, subunit I |
| chr12_+_56546363 | 39.56 |
ENST00000551834.1
ENST00000552568.1 |
MYL6B
|
myosin, light chain 6B, alkali, smooth muscle and non-muscle |
| chr5_+_132202252 | 39.21 |
ENST00000378670.3
ENST00000378667.1 ENST00000378665.1 |
UQCRQ
|
ubiquinol-cytochrome c reductase, complex III subunit VII, 9.5kDa |
| chr11_-_116658758 | 38.96 |
ENST00000227322.3
|
ZNF259
|
zinc finger protein 259 |
| chr16_-_20817753 | 38.60 |
ENST00000389345.5
ENST00000300005.3 ENST00000357967.4 ENST00000569729.1 |
ERI2
|
ERI1 exoribonuclease family member 2 |
| chr15_+_63340647 | 38.36 |
ENST00000404484.4
|
TPM1
|
tropomyosin 1 (alpha) |
| chr6_-_31926629 | 38.35 |
ENST00000375425.5
ENST00000426722.1 ENST00000441998.1 ENST00000444811.2 ENST00000375429.3 |
NELFE
|
negative elongation factor complex member E |
| chr14_+_75469606 | 37.86 |
ENST00000266126.5
|
EIF2B2
|
eukaryotic translation initiation factor 2B, subunit 2 beta, 39kDa |
| chr16_-_66968265 | 37.55 |
ENST00000567511.1
ENST00000422424.2 |
FAM96B
|
family with sequence similarity 96, member B |
| chr20_-_49575081 | 37.25 |
ENST00000371588.5
ENST00000371582.4 |
DPM1
|
dolichyl-phosphate mannosyltransferase polypeptide 1, catalytic subunit |
| chr7_-_7680601 | 37.25 |
ENST00000396682.2
|
RPA3
|
replication protein A3, 14kDa |
| chr15_+_63340858 | 37.14 |
ENST00000560615.1
|
TPM1
|
tropomyosin 1 (alpha) |
| chr6_-_33239712 | 37.10 |
ENST00000436044.2
|
VPS52
|
vacuolar protein sorting 52 homolog (S. cerevisiae) |
| chr15_+_63340734 | 37.01 |
ENST00000560959.1
|
TPM1
|
tropomyosin 1 (alpha) |
| chr17_+_7487146 | 36.85 |
ENST00000396501.4
ENST00000584378.1 ENST00000423172.2 ENST00000579445.1 ENST00000585217.1 ENST00000581380.1 |
MPDU1
|
mannose-P-dolichol utilization defect 1 |
| chr16_+_67261008 | 36.82 |
ENST00000304800.9
ENST00000563953.1 ENST00000565201.1 |
TMEM208
|
transmembrane protein 208 |
| chr20_+_43104508 | 36.65 |
ENST00000262605.4
ENST00000372904.3 |
TTPAL
|
tocopherol (alpha) transfer protein-like |
| chr2_+_201754050 | 36.50 |
ENST00000426253.1
ENST00000416651.1 ENST00000454952.1 ENST00000409020.1 ENST00000359683.4 |
NIF3L1
|
NIF3 NGG1 interacting factor 3-like 1 (S. cerevisiae) |
| chr2_-_9563469 | 36.19 |
ENST00000484735.1
ENST00000456913.2 |
ITGB1BP1
|
integrin beta 1 binding protein 1 |
| chr17_-_4843316 | 35.87 |
ENST00000544061.2
|
SLC25A11
|
solute carrier family 25 (mitochondrial carrier; oxoglutarate carrier), member 11 |
| chr2_-_110371412 | 35.55 |
ENST00000415095.1
ENST00000334001.6 ENST00000437928.1 ENST00000493445.1 ENST00000397714.2 ENST00000461295.1 |
SEPT10
|
septin 10 |
| chr10_-_15902449 | 35.53 |
ENST00000277632.3
|
FAM188A
|
family with sequence similarity 188, member A |
| chr2_+_201754135 | 35.47 |
ENST00000409357.1
ENST00000409129.2 |
NIF3L1
|
NIF3 NGG1 interacting factor 3-like 1 (S. cerevisiae) |
| chr12_+_7079944 | 35.31 |
ENST00000261406.6
|
EMG1
|
EMG1 N1-specific pseudouridine methyltransferase |
| chr14_+_69865401 | 35.17 |
ENST00000556605.1
ENST00000336643.5 ENST00000031146.4 |
SLC39A9
|
solute carrier family 39, member 9 |
| chr12_+_56546223 | 35.12 |
ENST00000550443.1
ENST00000207437.5 |
MYL6B
|
myosin, light chain 6B, alkali, smooth muscle and non-muscle |
| chr6_+_33257427 | 34.82 |
ENST00000463584.1
|
PFDN6
|
prefoldin subunit 6 |
| chr1_+_38478432 | 34.60 |
ENST00000537711.1
|
UTP11L
|
UTP11-like, U3 small nucleolar ribonucleoprotein, (yeast) |
| chr16_-_31085514 | 33.75 |
ENST00000300849.4
|
ZNF668
|
zinc finger protein 668 |
| chr17_+_57784826 | 33.65 |
ENST00000262291.4
|
VMP1
|
vacuole membrane protein 1 |
| chr5_+_140739537 | 33.55 |
ENST00000522605.1
|
PCDHGB2
|
protocadherin gamma subfamily B, 2 |
| chr5_+_140071178 | 33.44 |
ENST00000508522.1
ENST00000448069.2 |
HARS2
|
histidyl-tRNA synthetase 2, mitochondrial |
| chr19_+_19627026 | 33.38 |
ENST00000608404.1
ENST00000555938.1 ENST00000503283.1 ENST00000512771.3 ENST00000428459.2 |
YJEFN3
CTC-260F20.3
NDUFA13
|
YjeF N-terminal domain containing 3 Uncharacterized protein NADH dehydrogenase (ubiquinone) 1 alpha subcomplex, 13 |
| chr11_-_6502580 | 33.30 |
ENST00000423813.2
ENST00000396777.3 |
ARFIP2
|
ADP-ribosylation factor interacting protein 2 |
| chr3_-_48481434 | 33.07 |
ENST00000395694.2
ENST00000447018.1 ENST00000442740.1 |
CCDC51
|
coiled-coil domain containing 51 |
| chr1_+_38478378 | 32.40 |
ENST00000373014.4
|
UTP11L
|
UTP11-like, U3 small nucleolar ribonucleoprotein, (yeast) |
| chr2_-_110371664 | 32.38 |
ENST00000545389.1
ENST00000423520.1 |
SEPT10
|
septin 10 |
| chr17_-_19281203 | 32.29 |
ENST00000487415.2
|
B9D1
|
B9 protein domain 1 |
| chr17_+_37844331 | 32.18 |
ENST00000578199.1
ENST00000406381.2 |
ERBB2
|
v-erb-b2 avian erythroblastic leukemia viral oncogene homolog 2 |
| chr11_-_6502534 | 31.84 |
ENST00000254584.2
ENST00000525235.1 ENST00000445086.2 |
ARFIP2
|
ADP-ribosylation factor interacting protein 2 |
| chr3_-_48481518 | 31.77 |
ENST00000412398.2
ENST00000395696.1 |
CCDC51
|
coiled-coil domain containing 51 |
| chr16_-_66968055 | 31.68 |
ENST00000568572.1
|
FAM96B
|
family with sequence similarity 96, member B |
| chr7_+_99006232 | 31.67 |
ENST00000403633.2
|
BUD31
|
BUD31 homolog (S. cerevisiae) |
| chr17_-_65362678 | 31.58 |
ENST00000357146.4
ENST00000356126.3 |
PSMD12
|
proteasome (prosome, macropain) 26S subunit, non-ATPase, 12 |
| chr7_+_6617039 | 31.13 |
ENST00000405731.3
ENST00000396713.2 ENST00000396707.2 ENST00000335965.6 ENST00000396709.1 ENST00000483589.1 ENST00000396706.2 |
ZDHHC4
|
zinc finger, DHHC-type containing 4 |
| chr20_+_16710606 | 30.86 |
ENST00000377943.5
ENST00000246071.6 |
SNRPB2
|
small nuclear ribonucleoprotein polypeptide B |
| chr8_-_38034192 | 30.44 |
ENST00000520755.1
|
LSM1
|
LSM1 homolog, U6 small nuclear RNA associated (S. cerevisiae) |
| chr17_+_40985407 | 30.31 |
ENST00000586114.1
ENST00000590720.1 ENST00000585805.1 ENST00000541124.1 ENST00000441946.2 ENST00000591152.1 ENST00000589469.1 ENST00000293362.3 ENST00000592169.1 |
PSME3
|
proteasome (prosome, macropain) activator subunit 3 (PA28 gamma; Ki) |
| chr6_+_33257346 | 30.20 |
ENST00000374606.5
ENST00000374610.2 ENST00000374607.1 |
PFDN6
|
prefoldin subunit 6 |
| chr1_-_246729544 | 30.07 |
ENST00000544618.1
ENST00000366514.4 |
TFB2M
|
transcription factor B2, mitochondrial |
| chr8_-_38034234 | 29.87 |
ENST00000311351.4
|
LSM1
|
LSM1 homolog, U6 small nuclear RNA associated (S. cerevisiae) |
| chr21_-_33984865 | 29.84 |
ENST00000458138.1
|
C21orf59
|
chromosome 21 open reading frame 59 |
| chr9_-_35103105 | 29.49 |
ENST00000452248.2
ENST00000356493.5 |
STOML2
|
stomatin (EPB72)-like 2 |
| chr11_+_73882311 | 29.44 |
ENST00000398427.4
ENST00000544401.1 |
PPME1
|
protein phosphatase methylesterase 1 |
| chr11_-_65655906 | 29.43 |
ENST00000533045.1
ENST00000338369.2 ENST00000357519.4 |
FIBP
|
fibroblast growth factor (acidic) intracellular binding protein |
| chr14_+_90722886 | 29.26 |
ENST00000543772.2
|
PSMC1
|
proteasome (prosome, macropain) 26S subunit, ATPase, 1 |
| chr7_+_99006550 | 29.21 |
ENST00000222969.5
|
BUD31
|
BUD31 homolog (S. cerevisiae) |
| chr21_-_33984888 | 29.00 |
ENST00000382549.4
ENST00000540881.1 |
C21orf59
|
chromosome 21 open reading frame 59 |
| chr15_+_63340553 | 28.89 |
ENST00000334895.5
|
TPM1
|
tropomyosin 1 (alpha) |
| chr11_+_73882144 | 28.88 |
ENST00000328257.8
|
PPME1
|
protein phosphatase methylesterase 1 |
| chr3_+_57541975 | 28.74 |
ENST00000487257.1
ENST00000311180.8 |
PDE12
|
phosphodiesterase 12 |
| chr10_+_89264625 | 28.67 |
ENST00000371996.4
ENST00000371994.4 |
MINPP1
|
multiple inositol-polyphosphate phosphatase 1 |
| chr11_-_95657231 | 28.42 |
ENST00000409459.1
ENST00000352297.7 ENST00000393223.3 ENST00000346299.5 |
MTMR2
|
myotubularin related protein 2 |
| chr19_+_16296191 | 28.31 |
ENST00000589852.1
ENST00000263384.7 ENST00000588367.1 ENST00000587351.1 |
FAM32A
|
family with sequence similarity 32, member A |
| chr1_-_165738072 | 28.02 |
ENST00000481278.1
|
TMCO1
|
transmembrane and coiled-coil domains 1 |
| chr3_-_131221790 | 27.98 |
ENST00000512877.1
ENST00000264995.3 ENST00000511168.1 ENST00000425847.2 |
MRPL3
|
mitochondrial ribosomal protein L3 |
| chr14_+_75348592 | 27.94 |
ENST00000334220.4
|
DLST
|
dihydrolipoamide S-succinyltransferase (E2 component of 2-oxo-glutarate complex) |
| chr14_+_90722839 | 27.71 |
ENST00000261303.8
ENST00000553835.1 |
PSMC1
|
proteasome (prosome, macropain) 26S subunit, ATPase, 1 |
| chr14_-_57735528 | 27.50 |
ENST00000340918.7
ENST00000413566.2 |
EXOC5
|
exocyst complex component 5 |
| chr7_+_98923505 | 27.49 |
ENST00000432884.2
ENST00000262942.5 |
ARPC1A
|
actin related protein 2/3 complex, subunit 1A, 41kDa |
| chr6_+_33239787 | 27.47 |
ENST00000439602.2
ENST00000474973.1 |
RPS18
|
ribosomal protein S18 |
| chr14_-_67826486 | 27.39 |
ENST00000555431.1
ENST00000554236.1 ENST00000555474.1 |
ATP6V1D
|
ATPase, H+ transporting, lysosomal 34kDa, V1 subunit D |
| chr19_-_55791563 | 27.39 |
ENST00000588971.1
ENST00000255631.5 ENST00000587551.1 |
HSPBP1
|
HSPA (heat shock 70kDa) binding protein, cytoplasmic cochaperone 1 |
| chr1_-_20987851 | 27.34 |
ENST00000464364.1
ENST00000602624.2 |
DDOST
|
dolichyl-diphosphooligosaccharide--protein glycosyltransferase subunit (non-catalytic) |
| chr17_+_73008755 | 27.22 |
ENST00000584208.1
ENST00000301585.5 |
ICT1
|
immature colon carcinoma transcript 1 |
| chr1_+_169337172 | 27.18 |
ENST00000367807.3
ENST00000367808.3 ENST00000329281.2 ENST00000420531.1 |
BLZF1
|
basic leucine zipper nuclear factor 1 |
| chr7_+_44240520 | 26.99 |
ENST00000496112.1
ENST00000223369.2 |
YKT6
|
YKT6 v-SNARE homolog (S. cerevisiae) |
| chr1_-_154946825 | 26.94 |
ENST00000368453.4
ENST00000368450.1 ENST00000366442.2 |
SHC1
|
SHC (Src homology 2 domain containing) transforming protein 1 |
| chr14_-_24701539 | 26.94 |
ENST00000534348.1
ENST00000524927.1 ENST00000250495.5 |
NEDD8-MDP1
NEDD8
|
NEDD8-MDP1 readthrough neural precursor cell expressed, developmentally down-regulated 8 |
| chr16_+_23652773 | 26.89 |
ENST00000563998.1
ENST00000568589.1 ENST00000568272.1 |
DCTN5
|
dynactin 5 (p25) |
| chr10_+_75504105 | 26.79 |
ENST00000535742.1
ENST00000546025.1 ENST00000345254.4 ENST00000540668.1 ENST00000339365.2 ENST00000411652.2 |
SEC24C
|
SEC24 family member C |
| chr1_-_43855479 | 26.79 |
ENST00000290663.6
ENST00000372457.4 |
MED8
|
mediator complex subunit 8 |
| chr3_-_28390581 | 26.78 |
ENST00000479665.1
|
AZI2
|
5-azacytidine induced 2 |
| chr11_-_64085533 | 26.77 |
ENST00000544844.1
|
TRMT112
|
tRNA methyltransferase 11-2 homolog (S. cerevisiae) |
| chr6_-_31620403 | 26.58 |
ENST00000451898.1
ENST00000439687.2 ENST00000362049.6 ENST00000424480.1 |
BAG6
|
BCL2-associated athanogene 6 |
| chr1_-_20987889 | 26.57 |
ENST00000415136.2
|
DDOST
|
dolichyl-diphosphooligosaccharide--protein glycosyltransferase subunit (non-catalytic) |
| chr1_-_27216729 | 26.52 |
ENST00000431781.2
ENST00000374135.4 |
GPN2
|
GPN-loop GTPase 2 |
| chr1_-_165738085 | 26.39 |
ENST00000464650.1
ENST00000392129.6 |
TMCO1
|
transmembrane and coiled-coil domains 1 |
| chr17_+_57784997 | 26.23 |
ENST00000537567.1
ENST00000539763.1 ENST00000587945.1 ENST00000536180.1 ENST00000589823.2 ENST00000592106.1 ENST00000591315.1 ENST00000545362.1 |
VMP1
|
vacuole membrane protein 1 |
| chr7_-_99006443 | 26.18 |
ENST00000350498.3
|
PDAP1
|
PDGFA associated protein 1 |
| chr21_-_33985127 | 26.15 |
ENST00000290155.3
|
C21orf59
|
chromosome 21 open reading frame 59 |
| chr19_+_19626531 | 25.97 |
ENST00000507754.4
|
NDUFA13
|
NADH dehydrogenase (ubiquinone) 1 alpha subcomplex, 13 |
| chr12_+_6833437 | 25.85 |
ENST00000534947.1
ENST00000541866.1 ENST00000534877.1 ENST00000538753.1 |
COPS7A
|
COP9 signalosome subunit 7A |
| chr16_+_20817761 | 25.80 |
ENST00000568046.1
ENST00000261377.6 |
AC004381.6
|
Putative RNA exonuclease NEF-sp |
| chr17_+_33914460 | 25.77 |
ENST00000537622.2
|
AP2B1
|
adaptor-related protein complex 2, beta 1 subunit |
| chr5_+_82373379 | 25.65 |
ENST00000396027.4
ENST00000511817.1 |
XRCC4
|
X-ray repair complementing defective repair in Chinese hamster cells 4 |
| chr15_+_63340775 | 25.56 |
ENST00000559281.1
ENST00000317516.7 |
TPM1
|
tropomyosin 1 (alpha) |
| chr17_+_7155819 | 25.53 |
ENST00000570322.1
ENST00000576496.1 ENST00000574841.2 |
ELP5
|
elongator acetyltransferase complex subunit 5 |
| chr3_+_100428188 | 25.39 |
ENST00000418917.2
ENST00000490574.1 |
TFG
|
TRK-fused gene |
| chrX_+_69509927 | 25.38 |
ENST00000374403.3
|
KIF4A
|
kinesin family member 4A |
| chr12_+_6833237 | 25.26 |
ENST00000229251.3
ENST00000539735.1 ENST00000538410.1 |
COPS7A
|
COP9 signalosome subunit 7A |
| chr3_-_57583130 | 25.22 |
ENST00000303436.6
|
ARF4
|
ADP-ribosylation factor 4 |
| chr10_+_51371390 | 25.07 |
ENST00000478381.1
ENST00000451577.2 ENST00000374098.2 ENST00000374097.2 |
TIMM23B
|
translocase of inner mitochondrial membrane 23 homolog B (yeast) |
| chr7_+_100770328 | 25.01 |
ENST00000223095.4
ENST00000445463.2 |
SERPINE1
|
serpin peptidase inhibitor, clade E (nexin, plasminogen activator inhibitor type 1), member 1 |
| chr7_-_2281802 | 24.91 |
ENST00000242257.8
ENST00000440306.2 |
FTSJ2
|
FtsJ RNA methyltransferase homolog 2 (E. coli) |
| chr9_+_33264861 | 24.91 |
ENST00000223500.8
|
CHMP5
|
charged multivesicular body protein 5 |
| chr1_-_17380630 | 24.86 |
ENST00000375499.3
|
SDHB
|
succinate dehydrogenase complex, subunit B, iron sulfur (Ip) |
| chr5_+_82373317 | 24.68 |
ENST00000282268.3
ENST00000338635.6 |
XRCC4
|
X-ray repair complementing defective repair in Chinese hamster cells 4 |
| chr22_+_19419425 | 24.55 |
ENST00000333130.3
|
MRPL40
|
mitochondrial ribosomal protein L40 |
| chr17_+_7155556 | 24.44 |
ENST00000570500.1
ENST00000574993.1 ENST00000396628.2 ENST00000573657.1 |
ELP5
|
elongator acetyltransferase complex subunit 5 |
| chr12_-_44200146 | 24.44 |
ENST00000395510.2
ENST00000325127.4 |
TWF1
|
twinfilin actin-binding protein 1 |
| chr3_-_119396193 | 24.42 |
ENST00000484810.1
ENST00000497116.1 ENST00000261070.2 |
COX17
|
COX17 cytochrome c oxidase copper chaperone |
| chr11_-_18548426 | 24.34 |
ENST00000357193.3
ENST00000536719.1 |
TSG101
|
tumor susceptibility 101 |
| chrX_+_21958674 | 24.12 |
ENST00000404933.2
|
SMS
|
spermine synthase |
| chr19_+_9938562 | 24.08 |
ENST00000586895.1
ENST00000358666.3 ENST00000590068.1 ENST00000593087.1 |
UBL5
|
ubiquitin-like 5 |
| chr1_-_20987982 | 24.04 |
ENST00000375048.3
|
DDOST
|
dolichyl-diphosphooligosaccharide--protein glycosyltransferase subunit (non-catalytic) |
| chr12_+_120907622 | 23.88 |
ENST00000392509.2
ENST00000549649.1 ENST00000548342.1 |
DYNLL1
|
dynein, light chain, LC8-type 1 |
| chrX_+_21958814 | 23.80 |
ENST00000379404.1
ENST00000415881.2 |
SMS
|
spermine synthase |
| chr3_-_57583052 | 23.80 |
ENST00000496292.1
ENST00000489843.1 |
ARF4
|
ADP-ribosylation factor 4 |
| chr7_+_100860949 | 23.78 |
ENST00000305105.2
|
ZNHIT1
|
zinc finger, HIT-type containing 1 |
| chrX_+_11129388 | 23.77 |
ENST00000321143.4
ENST00000380763.3 ENST00000380762.4 |
HCCS
|
holocytochrome c synthase |
| chr17_+_33914276 | 23.76 |
ENST00000592545.1
ENST00000538556.1 ENST00000312678.8 ENST00000589344.1 |
AP2B1
|
adaptor-related protein complex 2, beta 1 subunit |
| chr19_-_59070239 | 23.60 |
ENST00000595957.1
ENST00000253023.3 |
UBE2M
|
ubiquitin-conjugating enzyme E2M |
| chr20_+_19867150 | 23.47 |
ENST00000255006.6
|
RIN2
|
Ras and Rab interactor 2 |
| chr14_+_77924204 | 23.40 |
ENST00000555133.1
|
AHSA1
|
AHA1, activator of heat shock 90kDa protein ATPase homolog 1 (yeast) |
| chr3_+_130613226 | 23.34 |
ENST00000509662.1
ENST00000328560.8 ENST00000428331.2 ENST00000359644.3 ENST00000422190.2 |
ATP2C1
|
ATPase, Ca++ transporting, type 2C, member 1 |
| chrX_-_40594755 | 23.25 |
ENST00000324817.1
|
MED14
|
mediator complex subunit 14 |
| chr16_+_56485402 | 23.17 |
ENST00000566157.1
ENST00000562150.1 ENST00000561646.1 ENST00000568397.1 |
OGFOD1
|
2-oxoglutarate and iron-dependent oxygenase domain containing 1 |
| chr4_-_120988229 | 23.09 |
ENST00000296509.6
|
MAD2L1
|
MAD2 mitotic arrest deficient-like 1 (yeast) |
| chr17_+_7155343 | 23.05 |
ENST00000573513.1
ENST00000354429.2 ENST00000574255.1 ENST00000396627.2 ENST00000356683.2 |
ELP5
|
elongator acetyltransferase complex subunit 5 |
| chr10_-_51623203 | 22.96 |
ENST00000444743.1
ENST00000374065.3 ENST00000374064.3 ENST00000260867.4 |
TIMM23
|
translocase of inner mitochondrial membrane 23 homolog (yeast) |
| chr3_+_100428316 | 22.85 |
ENST00000479672.1
ENST00000476228.1 ENST00000463568.1 |
TFG
|
TRK-fused gene |
| chr3_+_100428268 | 22.84 |
ENST00000240851.4
|
TFG
|
TRK-fused gene |
| chr20_-_2451395 | 22.77 |
ENST00000339610.6
ENST00000381342.2 ENST00000438552.2 |
SNRPB
|
small nuclear ribonucleoprotein polypeptides B and B1 |
| chr5_+_125758813 | 22.62 |
ENST00000285689.3
ENST00000515200.1 |
GRAMD3
|
GRAM domain containing 3 |
| chr5_+_102455968 | 22.41 |
ENST00000358359.3
|
PPIP5K2
|
diphosphoinositol pentakisphosphate kinase 2 |
| chr6_+_142622991 | 22.41 |
ENST00000230173.6
ENST00000367608.2 |
GPR126
|
G protein-coupled receptor 126 |
| chr19_-_2427536 | 22.35 |
ENST00000591871.1
|
TIMM13
|
translocase of inner mitochondrial membrane 13 homolog (yeast) |
| chr1_-_113247543 | 22.32 |
ENST00000414971.1
ENST00000534717.1 |
RHOC
|
ras homolog family member C |
| chr6_-_31620455 | 22.30 |
ENST00000437771.1
ENST00000404765.2 ENST00000375964.6 ENST00000211379.5 |
BAG6
|
BCL2-associated athanogene 6 |
| chr9_+_33265011 | 22.25 |
ENST00000419016.2
|
CHMP5
|
charged multivesicular body protein 5 |
| chr9_-_127177703 | 22.22 |
ENST00000259457.3
ENST00000536392.1 ENST00000441097.1 |
PSMB7
|
proteasome (prosome, macropain) subunit, beta type, 7 |
| chr11_+_9406169 | 22.17 |
ENST00000379719.3
ENST00000527431.1 |
IPO7
|
importin 7 |
| chr19_-_55791540 | 22.12 |
ENST00000433386.2
|
HSPBP1
|
HSPA (heat shock 70kDa) binding protein, cytoplasmic cochaperone 1 |
| chr5_+_125758865 | 21.96 |
ENST00000542322.1
ENST00000544396.1 |
GRAMD3
|
GRAM domain containing 3 |
| chrX_+_100075368 | 21.93 |
ENST00000415585.2
ENST00000372972.2 ENST00000413437.1 |
CSTF2
|
cleavage stimulation factor, 3' pre-RNA, subunit 2, 64kDa |
| chr3_+_130613001 | 21.82 |
ENST00000504948.1
ENST00000513801.1 ENST00000505072.1 |
ATP2C1
|
ATPase, Ca++ transporting, type 2C, member 1 |
| chr2_+_99225018 | 21.80 |
ENST00000357765.2
ENST00000409975.1 |
UNC50
|
unc-50 homolog (C. elegans) |
| chr22_+_39898325 | 21.66 |
ENST00000325301.2
ENST00000404569.1 |
MIEF1
|
mitochondrial elongation factor 1 |
| chr16_+_20818020 | 21.63 |
ENST00000564274.1
ENST00000563068.1 |
AC004381.6
|
Putative RNA exonuclease NEF-sp |
| chr9_+_133454943 | 21.63 |
ENST00000319725.9
|
FUBP3
|
far upstream element (FUSE) binding protein 3 |
| chr11_-_64084959 | 21.57 |
ENST00000535750.1
ENST00000535126.1 ENST00000539854.1 ENST00000308774.2 |
TRMT112
|
tRNA methyltransferase 11-2 homolog (S. cerevisiae) |
| chr1_+_174969262 | 21.50 |
ENST00000406752.1
ENST00000405362.1 |
CACYBP
|
calcyclin binding protein |
| chr8_-_77912431 | 21.48 |
ENST00000357039.4
ENST00000522527.1 |
PEX2
|
peroxisomal biogenesis factor 2 |
| chr3_+_130612803 | 21.41 |
ENST00000510168.1
ENST00000508532.1 |
ATP2C1
|
ATPase, Ca++ transporting, type 2C, member 1 |
| chr12_-_49351228 | 21.34 |
ENST00000541959.1
ENST00000447318.2 |
ARF3
|
ADP-ribosylation factor 3 |
| chr6_-_42981651 | 21.31 |
ENST00000244711.3
|
MEA1
|
male-enhanced antigen 1 |
| chr5_+_140071011 | 21.28 |
ENST00000230771.3
ENST00000509299.1 ENST00000503873.1 ENST00000435019.2 ENST00000437649.2 ENST00000432671.2 |
HARS2
|
histidyl-tRNA synthetase 2, mitochondrial |
| chr3_-_64009102 | 21.13 |
ENST00000478185.1
ENST00000482510.1 ENST00000497323.1 ENST00000492933.1 ENST00000295901.4 |
PSMD6
|
proteasome (prosome, macropain) 26S subunit, non-ATPase, 6 |
| chr2_-_207024233 | 21.08 |
ENST00000423725.1
ENST00000233190.6 |
NDUFS1
|
NADH dehydrogenase (ubiquinone) Fe-S protein 1, 75kDa (NADH-coenzyme Q reductase) |
Network of associatons between targets according to the STRING database.

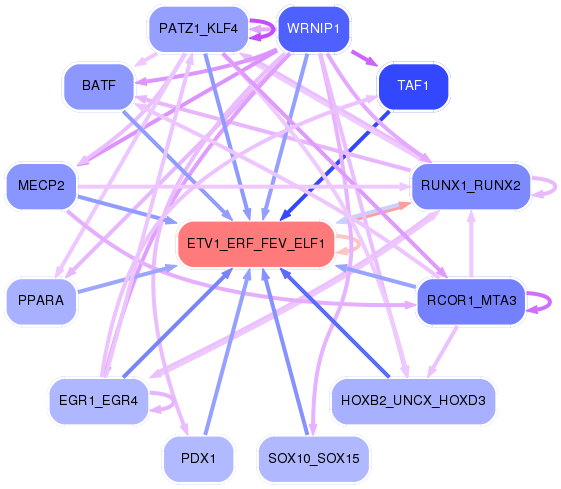
First level regulatory network of ETV1_ERF_FEV_ELF1
Gene Ontology Analysis
Gene overrepresentation in biological_process category:
| Log-likelihood per target | Total log-likelihood | Term | Description |
|---|---|---|---|
| 41.6 | 124.7 | GO:0006427 | histidyl-tRNA aminoacylation(GO:0006427) |
| 25.5 | 76.6 | GO:0071051 | polyadenylation-dependent snoRNA 3'-end processing(GO:0071051) |
| 20.9 | 167.0 | GO:0003065 | positive regulation of heart rate by epinephrine(GO:0003065) |
| 19.3 | 58.0 | GO:1903336 | negative regulation of vacuolar transport(GO:1903336) |
| 19.3 | 57.9 | GO:0048611 | ectodermal digestive tract development(GO:0007439) embryonic ectodermal digestive tract development(GO:0048611) |
| 17.6 | 52.7 | GO:0009051 | pentose-phosphate shunt, oxidative branch(GO:0009051) |
| 16.0 | 47.9 | GO:0006597 | spermine biosynthetic process(GO:0006597) |
| 15.5 | 77.6 | GO:0019348 | dolichol metabolic process(GO:0019348) |
| 15.2 | 45.7 | GO:0007057 | spindle assembly involved in female meiosis I(GO:0007057) |
| 14.2 | 56.8 | GO:1904327 | maintenance of unfolded protein(GO:0036506) protein localization to cytosolic proteasome complex(GO:1904327) maintenance of unfolded protein involved in ERAD pathway(GO:1904378) protein localization to cytosolic proteasome complex involved in ERAD pathway(GO:1904379) |
| 13.6 | 54.3 | GO:1902626 | assembly of large subunit precursor of preribosome(GO:1902626) |
| 12.3 | 36.8 | GO:0006624 | vacuolar protein processing(GO:0006624) |
| 12.2 | 109.5 | GO:0045039 | protein import into mitochondrial inner membrane(GO:0045039) |
| 12.2 | 24.3 | GO:0044878 | mitotic cytokinesis checkpoint(GO:0044878) |
| 12.2 | 48.6 | GO:0032218 | riboflavin transport(GO:0032218) |
| 12.1 | 48.3 | GO:0018364 | peptidyl-glutamine methylation(GO:0018364) |
| 11.5 | 11.5 | GO:0000729 | DNA double-strand break processing(GO:0000729) |
| 11.1 | 66.6 | GO:0032468 | Golgi calcium ion homeostasis(GO:0032468) |
| 10.5 | 42.0 | GO:1903772 | regulation of viral budding via host ESCRT complex(GO:1903772) |
| 10.0 | 29.9 | GO:0001300 | chronological cell aging(GO:0001300) |
| 9.9 | 29.8 | GO:0002184 | cytoplasmic translational termination(GO:0002184) |
| 9.9 | 49.5 | GO:0099590 | neurotransmitter receptor internalization(GO:0099590) |
| 9.8 | 39.2 | GO:0021539 | subthalamus development(GO:0021539) |
| 9.8 | 29.4 | GO:0006420 | arginyl-tRNA aminoacylation(GO:0006420) |
| 9.3 | 27.9 | GO:0019474 | L-lysine catabolic process to acetyl-CoA(GO:0019474) L-lysine catabolic process(GO:0019477) L-lysine metabolic process(GO:0046440) |
| 9.1 | 63.9 | GO:0007144 | female meiosis I(GO:0007144) |
| 9.0 | 36.1 | GO:0006203 | dGTP catabolic process(GO:0006203) |
| 8.9 | 44.6 | GO:1904578 | response to thapsigargin(GO:1904578) cellular response to thapsigargin(GO:1904579) |
| 8.8 | 26.5 | GO:1990022 | RNA polymerase II complex import to nucleus(GO:0044376) RNA polymerase III complex localization to nucleus(GO:1990022) |
| 8.8 | 43.9 | GO:0002084 | protein depalmitoylation(GO:0002084) |
| 8.6 | 25.7 | GO:0018283 | metal incorporation into metallo-sulfur cluster(GO:0018282) iron incorporation into metallo-sulfur cluster(GO:0018283) |
| 8.5 | 25.5 | GO:0036388 | pre-replicative complex assembly involved in nuclear cell cycle DNA replication(GO:0006267) pre-replicative complex assembly(GO:0036388) pre-replicative complex assembly involved in cell cycle DNA replication(GO:1902299) |
| 8.3 | 25.0 | GO:0006617 | SRP-dependent cotranslational protein targeting to membrane, signal sequence recognition(GO:0006617) |
| 8.3 | 91.5 | GO:0045176 | apical protein localization(GO:0045176) |
| 8.2 | 32.9 | GO:0000912 | assembly of actomyosin apparatus involved in cytokinesis(GO:0000912) actomyosin contractile ring assembly(GO:0000915) actomyosin contractile ring organization(GO:0044837) |
| 8.1 | 40.6 | GO:1900264 | regulation of DNA-directed DNA polymerase activity(GO:1900262) positive regulation of DNA-directed DNA polymerase activity(GO:1900264) |
| 8.0 | 95.9 | GO:0006228 | UTP biosynthetic process(GO:0006228) UTP metabolic process(GO:0046051) |
| 7.8 | 38.9 | GO:1904274 | tricellular tight junction assembly(GO:1904274) |
| 7.8 | 31.1 | GO:0090296 | regulation of mitochondrial DNA replication(GO:0090296) |
| 7.7 | 30.7 | GO:0006391 | transcription initiation from mitochondrial promoter(GO:0006391) |
| 7.6 | 30.4 | GO:0043321 | regulation of natural killer cell degranulation(GO:0043321) positive regulation of natural killer cell degranulation(GO:0043323) |
| 7.5 | 22.5 | GO:0042350 | GDP-L-fucose biosynthetic process(GO:0042350) 'de novo' GDP-L-fucose biosynthetic process(GO:0042351) |
| 7.4 | 37.0 | GO:0046203 | spermidine catabolic process(GO:0046203) |
| 7.3 | 29.1 | GO:0036228 | protein targeting to nuclear inner membrane(GO:0036228) |
| 7.3 | 50.9 | GO:0000290 | deadenylation-dependent decapping of nuclear-transcribed mRNA(GO:0000290) |
| 7.1 | 57.0 | GO:0006933 | negative regulation of cell adhesion involved in substrate-bound cell migration(GO:0006933) |
| 7.1 | 28.4 | GO:2000645 | negative regulation of receptor catabolic process(GO:2000645) |
| 6.8 | 20.3 | GO:0010796 | regulation of multivesicular body size(GO:0010796) |
| 6.5 | 19.4 | GO:0097359 | UDP-glucosylation(GO:0097359) |
| 6.4 | 19.2 | GO:0046946 | hydroxylysine metabolic process(GO:0046946) hydroxylysine biosynthetic process(GO:0046947) |
| 6.4 | 159.6 | GO:0045899 | positive regulation of RNA polymerase II transcriptional preinitiation complex assembly(GO:0045899) |
| 6.2 | 24.8 | GO:2000232 | regulation of rRNA processing(GO:2000232) |
| 6.2 | 18.5 | GO:0051086 | chaperone mediated protein folding independent of cofactor(GO:0051086) |
| 6.1 | 30.5 | GO:0030047 | actin modification(GO:0030047) |
| 6.0 | 35.9 | GO:0015742 | alpha-ketoglutarate transport(GO:0015742) |
| 6.0 | 17.9 | GO:0015883 | FAD transport(GO:0015883) FAD transmembrane transport(GO:0035350) |
| 5.9 | 17.8 | GO:0030327 | prenylated protein catabolic process(GO:0030327) |
| 5.9 | 29.5 | GO:0070131 | positive regulation of mitochondrial translation(GO:0070131) |
| 5.6 | 16.8 | GO:0046680 | regulation of cyclin-dependent protein serine/threonine kinase activity involved in G2/M transition of mitotic cell cycle(GO:0031660) positive regulation of cyclin-dependent protein serine/threonine kinase activity involved in G2/M transition of mitotic cell cycle(GO:0031662) response to DDT(GO:0046680) histone H3-S10 phosphorylation involved in chromosome condensation(GO:2000775) |
| 5.5 | 16.6 | GO:1903542 | negative regulation of exosomal secretion(GO:1903542) |
| 5.5 | 22.1 | GO:0006842 | tricarboxylic acid transport(GO:0006842) citrate transport(GO:0015746) |
| 5.5 | 11.0 | GO:0045715 | negative regulation of low-density lipoprotein particle receptor biosynthetic process(GO:0045715) |
| 5.5 | 43.7 | GO:2000825 | positive regulation of androgen receptor activity(GO:2000825) |
| 5.4 | 21.7 | GO:1902527 | positive regulation of protein monoubiquitination(GO:1902527) |
| 5.4 | 16.1 | GO:0018103 | protein C-linked glycosylation(GO:0018103) peptidyl-tryptophan modification(GO:0018211) protein C-linked glycosylation via tryptophan(GO:0018317) protein C-linked glycosylation via 2'-alpha-mannosyl-L-tryptophan(GO:0018406) |
| 5.3 | 15.9 | GO:0090034 | regulation of chaperone-mediated protein complex assembly(GO:0090034) positive regulation of chaperone-mediated protein complex assembly(GO:0090035) |
| 5.2 | 250.9 | GO:0006370 | 7-methylguanosine mRNA capping(GO:0006370) |
| 5.2 | 114.0 | GO:0034315 | regulation of Arp2/3 complex-mediated actin nucleation(GO:0034315) |
| 5.2 | 15.5 | GO:0097498 | endothelial tube lumen extension(GO:0097498) |
| 5.1 | 82.4 | GO:0043248 | proteasome assembly(GO:0043248) |
| 5.0 | 55.3 | GO:2000210 | positive regulation of anoikis(GO:2000210) |
| 5.0 | 70.0 | GO:0032802 | low-density lipoprotein particle receptor catabolic process(GO:0032802) |
| 5.0 | 119.9 | GO:0036120 | cellular response to platelet-derived growth factor stimulus(GO:0036120) |
| 5.0 | 15.0 | GO:0032707 | negative regulation of interleukin-23 production(GO:0032707) |
| 5.0 | 24.8 | GO:1901896 | positive regulation of calcium-transporting ATPase activity(GO:1901896) |
| 4.9 | 24.5 | GO:0019323 | pentose catabolic process(GO:0019323) |
| 4.9 | 68.2 | GO:0070389 | chaperone cofactor-dependent protein refolding(GO:0070389) |
| 4.8 | 52.9 | GO:0006983 | ER overload response(GO:0006983) |
| 4.8 | 14.3 | GO:0051083 | 'de novo' cotranslational protein folding(GO:0051083) |
| 4.7 | 137.4 | GO:0051131 | chaperone-mediated protein complex assembly(GO:0051131) |
| 4.6 | 13.7 | GO:0072313 | metanephric glomerular epithelium development(GO:0072244) metanephric glomerular visceral epithelial cell differentiation(GO:0072248) metanephric glomerular visceral epithelial cell development(GO:0072249) metanephric glomerular epithelial cell differentiation(GO:0072312) metanephric glomerular epithelial cell development(GO:0072313) |
| 4.5 | 85.3 | GO:0031163 | iron-sulfur cluster assembly(GO:0016226) metallo-sulfur cluster assembly(GO:0031163) |
| 4.5 | 67.1 | GO:0030150 | protein import into mitochondrial matrix(GO:0030150) |
| 4.4 | 71.1 | GO:0000338 | protein deneddylation(GO:0000338) |
| 4.4 | 53.2 | GO:1901673 | regulation of mitotic spindle assembly(GO:1901673) |
| 4.4 | 13.2 | GO:0060166 | olfactory pit development(GO:0060166) |
| 4.4 | 144.7 | GO:0006221 | pyrimidine nucleotide biosynthetic process(GO:0006221) |
| 4.4 | 48.2 | GO:0006930 | substrate-dependent cell migration, cell extension(GO:0006930) |
| 4.2 | 4.2 | GO:0009146 | purine nucleoside triphosphate catabolic process(GO:0009146) |
| 4.2 | 46.7 | GO:2000576 | positive regulation of microtubule motor activity(GO:2000576) regulation of ATP-dependent microtubule motor activity, plus-end-directed(GO:2000580) positive regulation of ATP-dependent microtubule motor activity, plus-end-directed(GO:2000582) |
| 4.2 | 16.9 | GO:0032487 | regulation of Rap protein signal transduction(GO:0032487) |
| 4.1 | 66.3 | GO:0045116 | protein neddylation(GO:0045116) |
| 4.1 | 12.4 | GO:0033341 | regulation of collagen binding(GO:0033341) |
| 4.1 | 32.7 | GO:0033088 | negative regulation of immature T cell proliferation in thymus(GO:0033088) |
| 4.1 | 300.3 | GO:0070125 | mitochondrial translational elongation(GO:0070125) mitochondrial translational termination(GO:0070126) |
| 4.0 | 72.0 | GO:0075713 | establishment of integrated proviral latency(GO:0075713) |
| 3.9 | 23.7 | GO:0070475 | rRNA base methylation(GO:0070475) |
| 3.9 | 7.9 | GO:0046070 | dGTP metabolic process(GO:0046070) |
| 3.9 | 15.7 | GO:0000350 | generation of catalytic spliceosome for second transesterification step(GO:0000350) |
| 3.9 | 31.0 | GO:0033211 | adiponectin-activated signaling pathway(GO:0033211) |
| 3.8 | 30.7 | GO:0051533 | positive regulation of NFAT protein import into nucleus(GO:0051533) |
| 3.8 | 11.3 | GO:1902309 | regulation of heart rate by hormone(GO:0003064) negative regulation of peptidyl-serine dephosphorylation(GO:1902309) |
| 3.8 | 30.0 | GO:0016559 | peroxisome fission(GO:0016559) |
| 3.7 | 7.4 | GO:1903233 | regulation of calcium ion-dependent exocytosis of neurotransmitter(GO:1903233) |
| 3.6 | 21.5 | GO:0000720 | pyrimidine dimer repair by nucleotide-excision repair(GO:0000720) |
| 3.6 | 10.7 | GO:0051031 | tRNA transport(GO:0051031) |
| 3.6 | 35.6 | GO:1904869 | regulation of protein localization to Cajal body(GO:1904869) positive regulation of protein localization to Cajal body(GO:1904871) |
| 3.5 | 24.5 | GO:0031118 | rRNA pseudouridine synthesis(GO:0031118) |
| 3.5 | 59.4 | GO:0060391 | positive regulation of SMAD protein import into nucleus(GO:0060391) |
| 3.4 | 3.4 | GO:0045053 | protein retention in Golgi apparatus(GO:0045053) |
| 3.4 | 10.2 | GO:0015680 | intracellular copper ion transport(GO:0015680) |
| 3.4 | 20.4 | GO:1902766 | skeletal muscle satellite cell migration(GO:1902766) |
| 3.4 | 27.1 | GO:2000189 | positive regulation of cholesterol homeostasis(GO:2000189) |
| 3.4 | 13.4 | GO:0019276 | UDP-N-acetylgalactosamine metabolic process(GO:0019276) |
| 3.3 | 23.4 | GO:0046984 | regulation of hemoglobin biosynthetic process(GO:0046984) |
| 3.3 | 13.3 | GO:0001188 | RNA polymerase I transcriptional preinitiation complex assembly(GO:0001188) RNA polymerase I transcriptional preinitiation complex assembly at the promoter for the nuclear large rRNA transcript(GO:0001189) |
| 3.3 | 13.2 | GO:0017198 | N-terminal peptidyl-serine acetylation(GO:0017198) N-terminal peptidyl-glutamic acid acetylation(GO:0018002) peptidyl-serine acetylation(GO:0030920) |
| 3.2 | 9.7 | GO:0002949 | tRNA threonylcarbamoyladenosine modification(GO:0002949) |
| 3.1 | 15.5 | GO:0071460 | cellular response to cell-matrix adhesion(GO:0071460) |
| 3.1 | 6.2 | GO:0019255 | glucose 1-phosphate metabolic process(GO:0019255) |
| 3.1 | 21.5 | GO:1904872 | regulation of telomerase RNA localization to Cajal body(GO:1904872) |
| 3.0 | 6.1 | GO:0051036 | regulation of endosome size(GO:0051036) |
| 2.9 | 20.5 | GO:1990592 | protein polyufmylation(GO:1990564) protein K69-linked ufmylation(GO:1990592) |
| 2.9 | 41.0 | GO:0034244 | negative regulation of transcription elongation from RNA polymerase II promoter(GO:0034244) |
| 2.9 | 8.7 | GO:0032765 | lymphotoxin A production(GO:0032641) positive regulation of mast cell cytokine production(GO:0032765) lymphotoxin A biosynthetic process(GO:0042109) |
| 2.9 | 17.4 | GO:0001692 | histamine metabolic process(GO:0001692) |
| 2.9 | 17.4 | GO:0006348 | chromatin silencing at telomere(GO:0006348) |
| 2.9 | 23.1 | GO:1901409 | positive regulation of phosphorylation of RNA polymerase II C-terminal domain(GO:1901409) |
| 2.9 | 11.5 | GO:0002408 | myeloid dendritic cell chemotaxis(GO:0002408) |
| 2.9 | 31.6 | GO:0033617 | mitochondrial respiratory chain complex IV assembly(GO:0033617) mitochondrial respiratory chain complex IV biogenesis(GO:0097034) |
| 2.9 | 14.3 | GO:0006436 | tryptophanyl-tRNA aminoacylation(GO:0006436) |
| 2.9 | 8.6 | GO:0002188 | translation reinitiation(GO:0002188) |
| 2.8 | 71.1 | GO:0006829 | zinc II ion transport(GO:0006829) |
| 2.8 | 28.3 | GO:0051256 | mitotic spindle midzone assembly(GO:0051256) |
| 2.8 | 14.1 | GO:0000973 | posttranscriptional tethering of RNA polymerase II gene DNA at nuclear periphery(GO:0000973) |
| 2.8 | 14.1 | GO:0015677 | copper ion import(GO:0015677) |
| 2.8 | 19.7 | GO:0039702 | viral budding via host ESCRT complex(GO:0039702) |
| 2.8 | 14.0 | GO:0000012 | single strand break repair(GO:0000012) |
| 2.8 | 13.8 | GO:1904885 | beta-catenin destruction complex assembly(GO:1904885) |
| 2.8 | 13.8 | GO:1901252 | regulation of intracellular transport of viral material(GO:1901252) |
| 2.8 | 8.3 | GO:0006428 | isoleucyl-tRNA aminoacylation(GO:0006428) |
| 2.7 | 38.0 | GO:0006488 | dolichol-linked oligosaccharide biosynthetic process(GO:0006488) |
| 2.7 | 37.5 | GO:0006293 | nucleotide-excision repair, preincision complex stabilization(GO:0006293) nucleotide-excision repair, DNA incision, 3'-to lesion(GO:0006295) |
| 2.7 | 45.4 | GO:0034063 | stress granule assembly(GO:0034063) |
| 2.7 | 5.3 | GO:0006121 | mitochondrial electron transport, succinate to ubiquinone(GO:0006121) |
| 2.7 | 29.2 | GO:0022417 | protein maturation by protein folding(GO:0022417) |
| 2.6 | 18.4 | GO:0007096 | regulation of exit from mitosis(GO:0007096) |
| 2.6 | 7.8 | GO:0048936 | peripheral nervous system neuron axonogenesis(GO:0048936) |
| 2.6 | 54.3 | GO:0006123 | mitochondrial electron transport, cytochrome c to oxygen(GO:0006123) |
| 2.6 | 12.8 | GO:1905098 | negative regulation of guanyl-nucleotide exchange factor activity(GO:1905098) |
| 2.6 | 17.9 | GO:1902897 | regulation of postsynaptic density protein 95 clustering(GO:1902897) |
| 2.5 | 7.6 | GO:1903371 | regulation of endoplasmic reticulum tubular network organization(GO:1903371) |
| 2.5 | 231.7 | GO:0051436 | negative regulation of ubiquitin-protein ligase activity involved in mitotic cell cycle(GO:0051436) regulation of ubiquitin-protein ligase activity involved in mitotic cell cycle(GO:0051439) |
| 2.5 | 5.0 | GO:2000525 | regulation of T cell costimulation(GO:2000523) positive regulation of T cell costimulation(GO:2000525) |
| 2.5 | 20.0 | GO:0010032 | meiotic chromosome condensation(GO:0010032) |
| 2.5 | 15.0 | GO:0007131 | reciprocal meiotic recombination(GO:0007131) reciprocal DNA recombination(GO:0035825) |
| 2.5 | 10.0 | GO:0006432 | phenylalanyl-tRNA aminoacylation(GO:0006432) |
| 2.5 | 32.4 | GO:0070911 | global genome nucleotide-excision repair(GO:0070911) |
| 2.5 | 24.7 | GO:0035986 | senescence-associated heterochromatin focus assembly(GO:0035986) |
| 2.4 | 12.2 | GO:1904154 | positive regulation of retrograde protein transport, ER to cytosol(GO:1904154) |
| 2.4 | 19.3 | GO:0071670 | smooth muscle cell chemotaxis(GO:0071670) |
| 2.4 | 31.4 | GO:0034975 | protein folding in endoplasmic reticulum(GO:0034975) |
| 2.4 | 14.5 | GO:0006065 | UDP-glucuronate biosynthetic process(GO:0006065) UDP-glucuronate metabolic process(GO:0046398) |
| 2.4 | 9.6 | GO:0007008 | outer mitochondrial membrane organization(GO:0007008) |
| 2.4 | 23.9 | GO:2000786 | positive regulation of autophagosome assembly(GO:2000786) |
| 2.4 | 45.4 | GO:0090110 | cargo loading into COPII-coated vesicle(GO:0090110) |
| 2.4 | 9.4 | GO:0071651 | positive regulation of chemokine (C-C motif) ligand 5 production(GO:0071651) |
| 2.3 | 43.8 | GO:0007220 | Notch receptor processing(GO:0007220) |
| 2.3 | 39.1 | GO:0006020 | inositol metabolic process(GO:0006020) |
| 2.3 | 16.0 | GO:0098789 | pre-mRNA cleavage required for polyadenylation(GO:0098789) |
| 2.3 | 175.6 | GO:0048208 | vesicle targeting, rough ER to cis-Golgi(GO:0048207) COPII vesicle coating(GO:0048208) |
| 2.3 | 15.9 | GO:0070294 | renal sodium ion absorption(GO:0070294) |
| 2.3 | 15.9 | GO:0070535 | negative regulation of histone ubiquitination(GO:0033183) histone H2A K63-linked ubiquitination(GO:0070535) negative regulation of protein K63-linked ubiquitination(GO:1900045) regulation of histone H2A K63-linked ubiquitination(GO:1901314) negative regulation of histone H2A K63-linked ubiquitination(GO:1901315) negative regulation of protein polyubiquitination(GO:1902915) |
| 2.3 | 83.8 | GO:0042407 | cristae formation(GO:0042407) |
| 2.3 | 4.5 | GO:0044111 | development involved in symbiotic interaction(GO:0044111) |
| 2.3 | 65.5 | GO:0045737 | positive regulation of cyclin-dependent protein serine/threonine kinase activity(GO:0045737) |
| 2.2 | 8.9 | GO:0021691 | cerebellar Purkinje cell layer maturation(GO:0021691) |
| 2.2 | 19.7 | GO:0002903 | negative regulation of B cell apoptotic process(GO:0002903) |
| 2.2 | 6.6 | GO:0032762 | mast cell cytokine production(GO:0032762) dense core granule biogenesis(GO:0061110) positive regulation of relaxation of cardiac muscle(GO:1901899) regulation of dense core granule biogenesis(GO:2000705) |
| 2.2 | 6.6 | GO:0000972 | transcription-dependent tethering of RNA polymerase II gene DNA at nuclear periphery(GO:0000972) |
| 2.2 | 17.4 | GO:0003433 | chondrocyte development involved in endochondral bone morphogenesis(GO:0003433) |
| 2.2 | 10.8 | GO:2000042 | negative regulation of double-strand break repair via homologous recombination(GO:2000042) |
| 2.1 | 21.2 | GO:0097500 | receptor localization to nonmotile primary cilium(GO:0097500) |
| 2.1 | 6.2 | GO:0019626 | short-chain fatty acid catabolic process(GO:0019626) |
| 2.1 | 24.9 | GO:0006105 | succinate metabolic process(GO:0006105) |
| 2.1 | 4.1 | GO:0051462 | cortisol secretion(GO:0043400) regulation of cortisol secretion(GO:0051462) |
| 2.1 | 57.6 | GO:0051123 | RNA polymerase II transcriptional preinitiation complex assembly(GO:0051123) |
| 2.1 | 37.0 | GO:0035641 | locomotory exploration behavior(GO:0035641) |
| 2.0 | 8.2 | GO:1904688 | regulation of cap-independent translational initiation(GO:1903677) positive regulation of cap-independent translational initiation(GO:1903679) regulation of cytoplasmic translational initiation(GO:1904688) positive regulation of cytoplasmic translational initiation(GO:1904690) |
| 2.0 | 16.1 | GO:0006621 | protein retention in ER lumen(GO:0006621) maintenance of protein localization in endoplasmic reticulum(GO:0035437) |
| 2.0 | 4.0 | GO:0021827 | cerebral cortex tangential migration using cell-cell interactions(GO:0021823) postnatal olfactory bulb interneuron migration(GO:0021827) chemorepulsion involved in postnatal olfactory bulb interneuron migration(GO:0021836) regulation of negative chemotaxis(GO:0050923) |
| 2.0 | 8.0 | GO:0000960 | mitochondrial RNA catabolic process(GO:0000957) regulation of mitochondrial RNA catabolic process(GO:0000960) |
| 2.0 | 14.0 | GO:1903895 | negative regulation of IRE1-mediated unfolded protein response(GO:1903895) |
| 2.0 | 6.0 | GO:0007206 | phospholipase C-activating G-protein coupled glutamate receptor signaling pathway(GO:0007206) |
| 2.0 | 9.9 | GO:0070863 | positive regulation of protein exit from endoplasmic reticulum(GO:0070863) |
| 2.0 | 17.8 | GO:2000270 | negative regulation of fibroblast apoptotic process(GO:2000270) |
| 2.0 | 23.6 | GO:0006108 | malate metabolic process(GO:0006108) |
| 2.0 | 17.6 | GO:0006268 | DNA unwinding involved in DNA replication(GO:0006268) |
| 1.9 | 3.9 | GO:0019087 | transformation of host cell by virus(GO:0019087) |
| 1.9 | 19.1 | GO:0051665 | membrane raft localization(GO:0051665) |
| 1.9 | 7.6 | GO:0070141 | response to UV-A(GO:0070141) cellular response to UV-A(GO:0071492) |
| 1.9 | 11.4 | GO:0016191 | synaptic vesicle uncoating(GO:0016191) |
| 1.9 | 9.4 | GO:0051414 | response to cortisol(GO:0051414) |
| 1.9 | 7.5 | GO:0060849 | radial pattern formation(GO:0009956) regulation of transcription involved in lymphatic endothelial cell fate commitment(GO:0060849) |
| 1.9 | 3.7 | GO:0060842 | arterial endothelial cell differentiation(GO:0060842) |
| 1.8 | 14.8 | GO:0018401 | peptidyl-proline hydroxylation to 4-hydroxy-L-proline(GO:0018401) |
| 1.8 | 20.3 | GO:0035360 | positive regulation of peroxisome proliferator activated receptor signaling pathway(GO:0035360) |
| 1.8 | 9.2 | GO:0034201 | response to oleic acid(GO:0034201) |
| 1.8 | 32.6 | GO:0070584 | mitochondrion morphogenesis(GO:0070584) |
| 1.8 | 5.4 | GO:0010286 | heat acclimation(GO:0010286) cellular heat acclimation(GO:0070370) |
| 1.8 | 25.1 | GO:0070979 | protein K11-linked ubiquitination(GO:0070979) |
| 1.8 | 85.8 | GO:0018279 | protein N-linked glycosylation via asparagine(GO:0018279) |
| 1.8 | 112.6 | GO:0006120 | mitochondrial electron transport, NADH to ubiquinone(GO:0006120) |
| 1.8 | 5.3 | GO:0002752 | leukocyte chemotaxis involved in inflammatory response(GO:0002232) cell surface pattern recognition receptor signaling pathway(GO:0002752) |
| 1.8 | 7.1 | GO:0032053 | ciliary basal body organization(GO:0032053) |
| 1.8 | 10.6 | GO:1901164 | negative regulation of trophoblast cell migration(GO:1901164) |
| 1.8 | 24.7 | GO:0008053 | mitochondrial fusion(GO:0008053) |
| 1.7 | 227.1 | GO:0006626 | protein targeting to mitochondrion(GO:0006626) |
| 1.7 | 7.0 | GO:1900245 | positive regulation of MDA-5 signaling pathway(GO:1900245) |
| 1.7 | 15.6 | GO:0031167 | rRNA methylation(GO:0031167) |
| 1.7 | 13.8 | GO:0060628 | regulation of ER to Golgi vesicle-mediated transport(GO:0060628) |
| 1.7 | 119.6 | GO:0042273 | ribosomal large subunit biogenesis(GO:0042273) |
| 1.7 | 10.2 | GO:0033504 | floor plate development(GO:0033504) |
| 1.7 | 3.4 | GO:0000393 | spliceosomal conformational changes to generate catalytic conformation(GO:0000393) |
| 1.7 | 8.4 | GO:1903026 | negative regulation of RNA polymerase II regulatory region sequence-specific DNA binding(GO:1903026) |
| 1.7 | 38.3 | GO:0045948 | positive regulation of translational initiation(GO:0045948) |
| 1.7 | 5.0 | GO:0006269 | DNA replication, synthesis of RNA primer(GO:0006269) |
| 1.7 | 6.6 | GO:0090362 | positive regulation of platelet-derived growth factor production(GO:0090362) |
| 1.7 | 29.9 | GO:0001682 | tRNA 5'-leader removal(GO:0001682) |
| 1.7 | 3.3 | GO:2000398 | regulation of T cell differentiation in thymus(GO:0033081) regulation of thymocyte aggregation(GO:2000398) |
| 1.6 | 45.7 | GO:0090190 | positive regulation of branching involved in ureteric bud morphogenesis(GO:0090190) |
| 1.6 | 8.1 | GO:0048133 | germ-line stem cell division(GO:0042078) male germ-line stem cell asymmetric division(GO:0048133) germline stem cell asymmetric division(GO:0098728) |
| 1.6 | 6.5 | GO:1990481 | mRNA pseudouridine synthesis(GO:1990481) |
| 1.6 | 8.0 | GO:0002415 | immunoglobulin transcytosis in epithelial cells mediated by polymeric immunoglobulin receptor(GO:0002415) |
| 1.6 | 4.8 | GO:0036079 | GDP-fucose transport(GO:0015783) purine nucleotide-sugar transport(GO:0036079) |
| 1.6 | 33.3 | GO:0034389 | lipid particle organization(GO:0034389) |
| 1.6 | 57.0 | GO:0007029 | endoplasmic reticulum organization(GO:0007029) |
| 1.6 | 36.2 | GO:0006144 | purine nucleobase metabolic process(GO:0006144) |
| 1.5 | 6.2 | GO:0060363 | cranial suture morphogenesis(GO:0060363) |
| 1.5 | 4.6 | GO:0010936 | negative regulation of macrophage cytokine production(GO:0010936) |
| 1.5 | 109.6 | GO:0006890 | retrograde vesicle-mediated transport, Golgi to ER(GO:0006890) |
| 1.5 | 6.1 | GO:0070897 | DNA-templated transcriptional preinitiation complex assembly(GO:0070897) |
| 1.5 | 12.1 | GO:1902969 | mitotic DNA replication(GO:1902969) |
| 1.5 | 16.5 | GO:0070200 | establishment of protein localization to telomere(GO:0070200) |
| 1.5 | 6.0 | GO:0097480 | synaptic vesicle transport(GO:0048489) synaptic vesicle localization(GO:0097479) establishment of synaptic vesicle localization(GO:0097480) |
| 1.5 | 3.0 | GO:0006780 | uroporphyrinogen III biosynthetic process(GO:0006780) uroporphyrinogen III metabolic process(GO:0046502) |
| 1.5 | 26.9 | GO:0035024 | negative regulation of Rho protein signal transduction(GO:0035024) |
| 1.5 | 4.4 | GO:0043137 | DNA replication, Okazaki fragment processing(GO:0033567) DNA replication, removal of RNA primer(GO:0043137) |
| 1.4 | 28.4 | GO:0016254 | preassembly of GPI anchor in ER membrane(GO:0016254) |
| 1.4 | 8.4 | GO:0006474 | N-terminal protein amino acid acetylation(GO:0006474) |
| 1.4 | 44.9 | GO:0090383 | phagosome acidification(GO:0090383) |
| 1.4 | 5.5 | GO:2000197 | regulation of mRNA export from nucleus(GO:0010793) regulation of ribonucleoprotein complex localization(GO:2000197) |
| 1.4 | 18.0 | GO:2000675 | negative regulation of type B pancreatic cell apoptotic process(GO:2000675) |
| 1.4 | 19.2 | GO:0038003 | opioid receptor signaling pathway(GO:0038003) |
| 1.4 | 4.1 | GO:0034227 | tRNA thio-modification(GO:0034227) |
| 1.4 | 4.1 | GO:0072683 | T cell extravasation(GO:0072683) |
| 1.3 | 10.7 | GO:0042775 | ATP synthesis coupled electron transport(GO:0042773) mitochondrial ATP synthesis coupled electron transport(GO:0042775) |
| 1.3 | 6.7 | GO:0006384 | transcription initiation from RNA polymerase III promoter(GO:0006384) |
| 1.3 | 40.1 | GO:0007339 | binding of sperm to zona pellucida(GO:0007339) |
| 1.3 | 5.3 | GO:0008616 | queuosine biosynthetic process(GO:0008616) queuosine metabolic process(GO:0046116) |
| 1.3 | 97.3 | GO:0032436 | positive regulation of proteasomal ubiquitin-dependent protein catabolic process(GO:0032436) |
| 1.3 | 22.3 | GO:0006415 | translational termination(GO:0006415) |
| 1.3 | 31.1 | GO:0007176 | regulation of epidermal growth factor-activated receptor activity(GO:0007176) |
| 1.3 | 2.6 | GO:0060295 | negative regulation of appetite by leptin-mediated signaling pathway(GO:0038108) regulation of cilium movement involved in cell motility(GO:0060295) regulation of cilium beat frequency involved in ciliary motility(GO:0060296) regulation of cilium-dependent cell motility(GO:1902019) |
| 1.3 | 7.7 | GO:0008627 | intrinsic apoptotic signaling pathway in response to osmotic stress(GO:0008627) |
| 1.3 | 7.7 | GO:1901977 | negative regulation of cell cycle checkpoint(GO:1901977) negative regulation of DNA damage checkpoint(GO:2000002) |
| 1.3 | 6.4 | GO:0070836 | caveola assembly(GO:0070836) |
| 1.3 | 3.8 | GO:1901873 | regulation of post-translational protein modification(GO:1901873) |
| 1.3 | 3.8 | GO:0002183 | cytoplasmic translational initiation(GO:0002183) |
| 1.3 | 7.6 | GO:0098881 | exocytic insertion of neurotransmitter receptor to plasma membrane(GO:0098881) exocytic insertion of neurotransmitter receptor to postsynaptic membrane(GO:0098967) |
| 1.3 | 6.3 | GO:0021553 | olfactory nerve development(GO:0021553) |
| 1.3 | 10.0 | GO:0001672 | regulation of chromatin assembly or disassembly(GO:0001672) |
| 1.2 | 8.7 | GO:0006102 | isocitrate metabolic process(GO:0006102) |
| 1.2 | 5.0 | GO:0042483 | negative regulation of odontogenesis(GO:0042483) |
| 1.2 | 1.2 | GO:0000965 | mitochondrial RNA 3'-end processing(GO:0000965) |
| 1.2 | 9.9 | GO:0033962 | cytoplasmic mRNA processing body assembly(GO:0033962) |
| 1.2 | 10.9 | GO:0006335 | DNA replication-dependent nucleosome assembly(GO:0006335) DNA replication-dependent nucleosome organization(GO:0034723) |
| 1.2 | 10.9 | GO:0048386 | positive regulation of retinoic acid receptor signaling pathway(GO:0048386) |
| 1.2 | 2.4 | GO:0006362 | transcription elongation from RNA polymerase I promoter(GO:0006362) |
| 1.2 | 56.0 | GO:1990090 | cellular response to nerve growth factor stimulus(GO:1990090) |
| 1.2 | 3.5 | GO:0061502 | early endosome to recycling endosome transport(GO:0061502) |
| 1.2 | 14.1 | GO:0060546 | negative regulation of necroptotic process(GO:0060546) |
| 1.2 | 38.6 | GO:0090503 | RNA phosphodiester bond hydrolysis, exonucleolytic(GO:0090503) |
| 1.2 | 33.9 | GO:0006903 | vesicle targeting(GO:0006903) |
| 1.2 | 4.7 | GO:0033590 | response to cobalamin(GO:0033590) |
| 1.2 | 9.3 | GO:0060717 | chorion development(GO:0060717) negative regulation of inclusion body assembly(GO:0090084) |
| 1.2 | 3.5 | GO:0000379 | tRNA-type intron splice site recognition and cleavage(GO:0000379) |
| 1.2 | 1.2 | GO:0010726 | positive regulation of hydrogen peroxide metabolic process(GO:0010726) |
| 1.2 | 13.9 | GO:0018206 | peptidyl-methionine modification(GO:0018206) |
| 1.1 | 1.1 | GO:0002386 | immune response in mucosal-associated lymphoid tissue(GO:0002386) |
| 1.1 | 6.9 | GO:0048630 | skeletal muscle tissue growth(GO:0048630) |
| 1.1 | 84.3 | GO:0033275 | muscle filament sliding(GO:0030049) actin-myosin filament sliding(GO:0033275) |
| 1.1 | 5.7 | GO:0010792 | DNA double-strand break processing involved in repair via single-strand annealing(GO:0010792) |
| 1.1 | 5.7 | GO:0060965 | negative regulation of gene silencing by miRNA(GO:0060965) |
| 1.1 | 5.7 | GO:0045213 | neurotransmitter receptor metabolic process(GO:0045213) |
| 1.1 | 9.0 | GO:0035845 | photoreceptor cell outer segment organization(GO:0035845) |
| 1.1 | 11.2 | GO:0044341 | sodium-dependent phosphate transport(GO:0044341) |
| 1.1 | 15.6 | GO:0000910 | cytokinesis(GO:0000910) |
| 1.1 | 4.4 | GO:0060325 | face morphogenesis(GO:0060325) |
| 1.1 | 3.3 | GO:0051754 | meiotic sister chromatid cohesion, centromeric(GO:0051754) |
| 1.1 | 2.2 | GO:0051771 | negative regulation of nitric-oxide synthase biosynthetic process(GO:0051771) |
| 1.1 | 3.3 | GO:1901355 | response to rapamycin(GO:1901355) |
| 1.1 | 12.0 | GO:0006662 | glycerol ether metabolic process(GO:0006662) |
| 1.1 | 5.5 | GO:1900119 | positive regulation of execution phase of apoptosis(GO:1900119) |
| 1.1 | 24.0 | GO:0032607 | interferon-alpha production(GO:0032607) |
| 1.1 | 5.4 | GO:0035105 | sterol regulatory element binding protein import into nucleus(GO:0035105) |
| 1.1 | 40.6 | GO:0043486 | histone exchange(GO:0043486) |
| 1.1 | 4.3 | GO:2001034 | positive regulation of double-strand break repair via nonhomologous end joining(GO:2001034) |
| 1.1 | 17.0 | GO:0006744 | ubiquinone biosynthetic process(GO:0006744) quinone biosynthetic process(GO:1901663) |
| 1.0 | 26.1 | GO:2000300 | regulation of synaptic vesicle exocytosis(GO:2000300) |
| 1.0 | 3.1 | GO:0006390 | transcription from mitochondrial promoter(GO:0006390) |
| 1.0 | 9.4 | GO:0000466 | maturation of 5.8S rRNA from tricistronic rRNA transcript (SSU-rRNA, 5.8S rRNA, LSU-rRNA)(GO:0000466) |
| 1.0 | 3.1 | GO:0017186 | peptidyl-pyroglutamic acid biosynthetic process, using glutaminyl-peptide cyclotransferase(GO:0017186) |
| 1.0 | 32.1 | GO:0032781 | positive regulation of ATPase activity(GO:0032781) |
| 1.0 | 14.4 | GO:0045835 | negative regulation of meiotic nuclear division(GO:0045835) |
| 1.0 | 7.1 | GO:0048368 | lateral mesoderm development(GO:0048368) |
| 1.0 | 37.3 | GO:0014003 | oligodendrocyte development(GO:0014003) |
| 1.0 | 3.0 | GO:0034982 | mitochondrial protein processing(GO:0034982) |
| 1.0 | 3.0 | GO:1903297 | regulation of hypoxia-induced intrinsic apoptotic signaling pathway(GO:1903297) negative regulation of hypoxia-induced intrinsic apoptotic signaling pathway(GO:1903298) intrinsic apoptotic signaling pathway in response to hypoxia(GO:1990144) |
| 1.0 | 8.0 | GO:0035269 | protein O-linked mannosylation(GO:0035269) |
| 1.0 | 4.0 | GO:0061743 | motor learning(GO:0061743) |
| 1.0 | 7.9 | GO:0002934 | desmosome organization(GO:0002934) |
| 1.0 | 4.9 | GO:0000963 | mitochondrial RNA processing(GO:0000963) |
| 1.0 | 3.9 | GO:0043126 | regulation of 1-phosphatidylinositol 4-kinase activity(GO:0043126) positive regulation of 1-phosphatidylinositol 4-kinase activity(GO:0043128) |
| 1.0 | 4.8 | GO:0033490 | cholesterol biosynthetic process via desmosterol(GO:0033489) cholesterol biosynthetic process via lathosterol(GO:0033490) |
| 1.0 | 6.7 | GO:0006307 | DNA dealkylation involved in DNA repair(GO:0006307) |
| 1.0 | 1.9 | GO:0036496 | regulation of translational initiation by eIF2 alpha dephosphorylation(GO:0036496) |
| 0.9 | 3.8 | GO:2001288 | positive regulation of caveolin-mediated endocytosis(GO:2001288) |
| 0.9 | 28.1 | GO:0031648 | protein destabilization(GO:0031648) |
| 0.9 | 7.5 | GO:0032836 | glomerular basement membrane development(GO:0032836) |
| 0.9 | 0.9 | GO:0090263 | positive regulation of canonical Wnt signaling pathway(GO:0090263) |
| 0.9 | 1.9 | GO:0072093 | ureteric bud invasion(GO:0072092) metanephric renal vesicle formation(GO:0072093) |
| 0.9 | 2.7 | GO:0000412 | histone peptidyl-prolyl isomerization(GO:0000412) |
| 0.9 | 2.7 | GO:0009597 | detection of virus(GO:0009597) |
| 0.9 | 3.6 | GO:0021891 | olfactory bulb interneuron development(GO:0021891) |
| 0.9 | 2.7 | GO:0010992 | ubiquitin homeostasis(GO:0010992) |
| 0.9 | 1.8 | GO:0036010 | protein localization to endosome(GO:0036010) |
| 0.9 | 6.2 | GO:0036438 | maintenance of lens transparency(GO:0036438) |
| 0.9 | 4.4 | GO:0032730 | positive regulation of interleukin-1 alpha production(GO:0032730) |
| 0.9 | 14.0 | GO:0006363 | termination of RNA polymerase I transcription(GO:0006363) |
| 0.9 | 6.1 | GO:0007040 | lysosome organization(GO:0007040) lytic vacuole organization(GO:0080171) |
| 0.9 | 4.3 | GO:0015865 | purine nucleotide transport(GO:0015865) purine ribonucleotide transport(GO:0015868) |
| 0.8 | 3.4 | GO:1901187 | regulation of ephrin receptor signaling pathway(GO:1901187) |
| 0.8 | 5.0 | GO:0007252 | I-kappaB phosphorylation(GO:0007252) |
| 0.8 | 9.0 | GO:0017004 | cytochrome complex assembly(GO:0017004) |
| 0.8 | 35.0 | GO:0035904 | aorta development(GO:0035904) |
| 0.8 | 3.9 | GO:0036150 | phosphatidylserine acyl-chain remodeling(GO:0036150) |
| 0.8 | 2.3 | GO:0000154 | rRNA modification(GO:0000154) |
| 0.8 | 1.5 | GO:0015747 | urate transport(GO:0015747) |
| 0.8 | 2.3 | GO:0006566 | threonine metabolic process(GO:0006566) |
| 0.8 | 2.3 | GO:0046294 | formaldehyde catabolic process(GO:0046294) |
| 0.7 | 3.7 | GO:1903361 | protein localization to basolateral plasma membrane(GO:1903361) |
| 0.7 | 2.2 | GO:0017185 | peptidyl-lysine hydroxylation(GO:0017185) |
| 0.7 | 11.1 | GO:0016024 | CDP-diacylglycerol biosynthetic process(GO:0016024) |
| 0.7 | 50.9 | GO:0006353 | DNA-templated transcription, termination(GO:0006353) |
| 0.7 | 27.0 | GO:0042733 | embryonic digit morphogenesis(GO:0042733) |
| 0.7 | 25.5 | GO:0035735 | intraciliary transport involved in cilium morphogenesis(GO:0035735) |
| 0.7 | 23.3 | GO:2000810 | regulation of bicellular tight junction assembly(GO:2000810) |
| 0.7 | 22.5 | GO:0001937 | negative regulation of endothelial cell proliferation(GO:0001937) |
| 0.7 | 14.5 | GO:0031146 | SCF-dependent proteasomal ubiquitin-dependent protein catabolic process(GO:0031146) |
| 0.7 | 3.6 | GO:0032508 | DNA duplex unwinding(GO:0032508) |
| 0.7 | 1.4 | GO:0072321 | chaperone-mediated protein transport(GO:0072321) |
| 0.7 | 7.1 | GO:0071847 | TNFSF11-mediated signaling pathway(GO:0071847) |
| 0.7 | 3.5 | GO:1903608 | protein localization to cytoplasmic stress granule(GO:1903608) |
| 0.7 | 2.1 | GO:2000864 | estrogen secretion(GO:0035937) estradiol secretion(GO:0035938) regulation of estrogen secretion(GO:2000861) regulation of estradiol secretion(GO:2000864) |
| 0.7 | 6.9 | GO:0030263 | apoptotic chromosome condensation(GO:0030263) |
| 0.7 | 8.2 | GO:0000098 | sulfur amino acid catabolic process(GO:0000098) |
| 0.7 | 14.2 | GO:0030539 | male genitalia development(GO:0030539) |
| 0.7 | 14.1 | GO:0006622 | protein targeting to lysosome(GO:0006622) |
| 0.7 | 16.1 | GO:0016338 | calcium-independent cell-cell adhesion via plasma membrane cell-adhesion molecules(GO:0016338) |
| 0.7 | 2.7 | GO:0019249 | lactate biosynthetic process(GO:0019249) |
| 0.7 | 6.6 | GO:0010815 | bradykinin catabolic process(GO:0010815) |
| 0.7 | 7.2 | GO:0048026 | positive regulation of mRNA splicing, via spliceosome(GO:0048026) |
| 0.7 | 10.5 | GO:0031987 | locomotion involved in locomotory behavior(GO:0031987) |
| 0.7 | 5.2 | GO:0032486 | Rap protein signal transduction(GO:0032486) |
| 0.7 | 4.6 | GO:0001833 | inner cell mass cell proliferation(GO:0001833) |
| 0.6 | 0.6 | GO:0090149 | mitochondrial membrane fission(GO:0090149) |
| 0.6 | 1.9 | GO:0006421 | asparaginyl-tRNA aminoacylation(GO:0006421) |
| 0.6 | 1.3 | GO:0051182 | coenzyme transport(GO:0051182) |
| 0.6 | 3.2 | GO:0017182 | peptidyl-diphthamide metabolic process(GO:0017182) peptidyl-diphthamide biosynthetic process from peptidyl-histidine(GO:0017183) |
| 0.6 | 8.3 | GO:0045008 | depyrimidination(GO:0045008) |
| 0.6 | 4.4 | GO:1901223 | negative regulation of NIK/NF-kappaB signaling(GO:1901223) |
| 0.6 | 2.5 | GO:0048254 | snoRNA localization(GO:0048254) |
| 0.6 | 6.7 | GO:0061339 | establishment of monopolar cell polarity(GO:0061162) establishment or maintenance of monopolar cell polarity(GO:0061339) |
| 0.6 | 2.4 | GO:0031860 | telomeric 3' overhang formation(GO:0031860) |
| 0.6 | 6.6 | GO:0046415 | urate metabolic process(GO:0046415) |
| 0.6 | 3.0 | GO:1904321 | response to forskolin(GO:1904321) cellular response to forskolin(GO:1904322) |
| 0.6 | 2.9 | GO:0030950 | establishment or maintenance of actin cytoskeleton polarity(GO:0030950) |
| 0.6 | 5.7 | GO:0035878 | nail development(GO:0035878) |
| 0.6 | 2.3 | GO:0097155 | fasciculation of sensory neuron axon(GO:0097155) |
| 0.6 | 1.7 | GO:2000586 | regulation of platelet-derived growth factor receptor-beta signaling pathway(GO:2000586) negative regulation of platelet-derived growth factor receptor-beta signaling pathway(GO:2000587) |
| 0.6 | 16.5 | GO:0006270 | DNA replication initiation(GO:0006270) |
| 0.6 | 1.7 | GO:2000298 | regulation of Rho-dependent protein serine/threonine kinase activity(GO:2000298) |
| 0.6 | 1.7 | GO:0003266 | regulation of secondary heart field cardioblast proliferation(GO:0003266) positive regulation of secondary heart field cardioblast proliferation(GO:0072513) |
| 0.6 | 10.2 | GO:0022900 | electron transport chain(GO:0022900) |
| 0.6 | 0.6 | GO:1904742 | regulation of telomeric DNA binding(GO:1904742) |
| 0.6 | 16.7 | GO:0032008 | positive regulation of TOR signaling(GO:0032008) |
| 0.6 | 5.0 | GO:0018916 | nitrobenzene metabolic process(GO:0018916) |
| 0.5 | 3.3 | GO:0038161 | prolactin signaling pathway(GO:0038161) |
| 0.5 | 15.3 | GO:0051220 | cytoplasmic sequestering of protein(GO:0051220) |
| 0.5 | 4.9 | GO:0043152 | induction of bacterial agglutination(GO:0043152) |
| 0.5 | 1.6 | GO:0090435 | protein localization to nuclear pore(GO:0090204) protein localization to nuclear envelope(GO:0090435) |
| 0.5 | 24.8 | GO:0006893 | Golgi to plasma membrane transport(GO:0006893) |
| 0.5 | 8.4 | GO:0070935 | 3'-UTR-mediated mRNA stabilization(GO:0070935) |
| 0.5 | 3.1 | GO:0046618 | drug export(GO:0046618) |
| 0.5 | 4.1 | GO:1900363 | regulation of mRNA polyadenylation(GO:1900363) |
| 0.5 | 0.5 | GO:0018202 | peptidyl-histidine modification(GO:0018202) |
| 0.5 | 17.0 | GO:1901985 | positive regulation of protein acetylation(GO:1901985) |
| 0.5 | 1.5 | GO:0003056 | regulation of vascular smooth muscle contraction(GO:0003056) |
| 0.5 | 1.5 | GO:0061343 | cell adhesion involved in heart morphogenesis(GO:0061343) |
| 0.5 | 2.0 | GO:0061101 | neuroendocrine cell differentiation(GO:0061101) |
| 0.5 | 2.9 | GO:1903385 | regulation of homophilic cell adhesion(GO:1903385) |
| 0.5 | 2.0 | GO:0015910 | peroxisomal long-chain fatty acid import(GO:0015910) |
| 0.5 | 16.0 | GO:0006656 | phosphatidylcholine biosynthetic process(GO:0006656) |
| 0.5 | 16.4 | GO:0006693 | prostanoid metabolic process(GO:0006692) prostaglandin metabolic process(GO:0006693) |
| 0.5 | 7.2 | GO:0099514 | anterograde synaptic vesicle transport(GO:0048490) synaptic vesicle cytoskeletal transport(GO:0099514) synaptic vesicle transport along microtubule(GO:0099517) |
| 0.5 | 2.4 | GO:0007172 | signal complex assembly(GO:0007172) |
| 0.5 | 4.3 | GO:0015727 | lactate transport(GO:0015727) lactate transmembrane transport(GO:0035873) |
| 0.5 | 6.1 | GO:0097031 | NADH dehydrogenase complex assembly(GO:0010257) mitochondrial respiratory chain complex I assembly(GO:0032981) mitochondrial respiratory chain complex I biogenesis(GO:0097031) |
| 0.5 | 5.6 | GO:0043518 | negative regulation of DNA damage response, signal transduction by p53 class mediator(GO:0043518) |
| 0.5 | 4.6 | GO:1902083 | negative regulation of peptidyl-cysteine S-nitrosylation(GO:1902083) |
| 0.5 | 1.8 | GO:0042796 | snRNA transcription from RNA polymerase III promoter(GO:0042796) |
| 0.5 | 6.0 | GO:0007026 | negative regulation of microtubule depolymerization(GO:0007026) regulation of microtubule depolymerization(GO:0031114) |
| 0.5 | 5.0 | GO:0051290 | protein heterotetramerization(GO:0051290) |
| 0.5 | 1.4 | GO:0000354 | cis assembly of pre-catalytic spliceosome(GO:0000354) |
| 0.5 | 3.6 | GO:0048096 | chromatin-mediated maintenance of transcription(GO:0048096) |
| 0.5 | 5.9 | GO:0032967 | positive regulation of collagen biosynthetic process(GO:0032967) |
| 0.4 | 6.7 | GO:0006283 | transcription-coupled nucleotide-excision repair(GO:0006283) |
| 0.4 | 10.4 | GO:0046039 | GTP metabolic process(GO:0046039) |
| 0.4 | 2.2 | GO:1905216 | positive regulation of RNA binding(GO:1905216) |
| 0.4 | 15.1 | GO:0090307 | mitotic spindle assembly(GO:0090307) |
| 0.4 | 10.7 | GO:0009206 | ATP biosynthetic process(GO:0006754) ribonucleoside triphosphate biosynthetic process(GO:0009201) purine ribonucleoside triphosphate biosynthetic process(GO:0009206) |
| 0.4 | 10.7 | GO:0036151 | phosphatidylcholine acyl-chain remodeling(GO:0036151) |
| 0.4 | 65.2 | GO:0006367 | transcription initiation from RNA polymerase II promoter(GO:0006367) |
| 0.4 | 0.4 | GO:1903031 | regulation of microtubule plus-end binding(GO:1903031) positive regulation of microtubule plus-end binding(GO:1903033) |
| 0.4 | 1.7 | GO:0010585 | glutamine secretion(GO:0010585) L-glutamine import(GO:0036229) L-glutamine import into cell(GO:1903803) |
| 0.4 | 3.7 | GO:0060576 | intestinal epithelial cell development(GO:0060576) |
| 0.4 | 7.4 | GO:0006012 | galactose metabolic process(GO:0006012) |
| 0.4 | 0.8 | GO:1905244 | regulation of modification of synaptic structure(GO:1905244) |
| 0.4 | 3.7 | GO:0048853 | forebrain morphogenesis(GO:0048853) |
| 0.4 | 2.0 | GO:0098502 | DNA dephosphorylation(GO:0098502) |
| 0.4 | 48.1 | GO:0000209 | protein polyubiquitination(GO:0000209) |
| 0.4 | 11.6 | GO:0008214 | protein demethylation(GO:0006482) protein dealkylation(GO:0008214) |
| 0.4 | 0.8 | GO:1902774 | late endosome to lysosome transport(GO:1902774) |
| 0.4 | 3.2 | GO:2000660 | negative regulation of interleukin-1-mediated signaling pathway(GO:2000660) |
| 0.4 | 27.4 | GO:0006110 | regulation of glycolytic process(GO:0006110) |
| 0.4 | 7.8 | GO:0072413 | signal transduction involved in cell cycle checkpoint(GO:0072395) signal transduction involved in DNA integrity checkpoint(GO:0072401) signal transduction involved in mitotic cell cycle checkpoint(GO:0072413) signal transduction involved in DNA damage checkpoint(GO:0072422) signal transduction involved in mitotic G1 DNA damage checkpoint(GO:0072431) intracellular signal transduction involved in G1 DNA damage checkpoint(GO:1902400) signal transduction involved in mitotic DNA damage checkpoint(GO:1902402) signal transduction involved in mitotic DNA integrity checkpoint(GO:1902403) |
| 0.4 | 5.0 | GO:0006891 | intra-Golgi vesicle-mediated transport(GO:0006891) |
| 0.4 | 3.8 | GO:0031532 | actin cytoskeleton reorganization(GO:0031532) |
| 0.4 | 12.8 | GO:0006406 | mRNA export from nucleus(GO:0006406) mRNA-containing ribonucleoprotein complex export from nucleus(GO:0071427) |
| 0.4 | 3.0 | GO:0031936 | negative regulation of chromatin silencing(GO:0031936) |
| 0.4 | 2.2 | GO:0018344 | protein geranylgeranylation(GO:0018344) |
| 0.4 | 1.1 | GO:0006658 | phosphatidylserine metabolic process(GO:0006658) |
| 0.4 | 22.0 | GO:0008033 | tRNA processing(GO:0008033) |
| 0.4 | 8.3 | GO:0050873 | brown fat cell differentiation(GO:0050873) |
| 0.4 | 14.8 | GO:0051028 | mRNA transport(GO:0051028) |
| 0.4 | 0.7 | GO:0038163 | thrombopoietin-mediated signaling pathway(GO:0038163) |
| 0.4 | 2.1 | GO:2001135 | regulation of endocytic recycling(GO:2001135) |
| 0.4 | 1.4 | GO:0065002 | intracellular protein transmembrane transport(GO:0065002) |
| 0.4 | 2.5 | GO:0032515 | negative regulation of phosphoprotein phosphatase activity(GO:0032515) |
| 0.3 | 4.2 | GO:0035635 | entry of bacterium into host cell(GO:0035635) |
| 0.3 | 2.4 | GO:0001829 | trophectodermal cell differentiation(GO:0001829) |
| 0.3 | 1.7 | GO:0021869 | forebrain ventricular zone progenitor cell division(GO:0021869) |
| 0.3 | 5.2 | GO:0046069 | cGMP catabolic process(GO:0046069) |
| 0.3 | 54.6 | GO:0006457 | protein folding(GO:0006457) |
| 0.3 | 4.1 | GO:0030422 | production of siRNA involved in RNA interference(GO:0030422) |
| 0.3 | 3.8 | GO:0031033 | myosin filament organization(GO:0031033) positive regulation of extrinsic apoptotic signaling pathway in absence of ligand(GO:2001241) |
| 0.3 | 9.2 | GO:0071526 | semaphorin-plexin signaling pathway(GO:0071526) |
| 0.3 | 2.0 | GO:0010452 | histone H3-K36 methylation(GO:0010452) |
| 0.3 | 1.4 | GO:0019046 | release from viral latency(GO:0019046) |
| 0.3 | 3.7 | GO:0060670 | branching involved in labyrinthine layer morphogenesis(GO:0060670) |
| 0.3 | 1.7 | GO:0032790 | ribosome disassembly(GO:0032790) |
| 0.3 | 4.3 | GO:0006450 | regulation of translational fidelity(GO:0006450) |
| 0.3 | 6.3 | GO:0006465 | signal peptide processing(GO:0006465) |
| 0.3 | 6.6 | GO:0046475 | glycerophospholipid catabolic process(GO:0046475) |
| 0.3 | 2.6 | GO:0035897 | proteolysis in other organism(GO:0035897) |
| 0.3 | 13.7 | GO:0007190 | activation of adenylate cyclase activity(GO:0007190) |
| 0.3 | 88.3 | GO:0043687 | post-translational protein modification(GO:0043687) |
| 0.3 | 46.1 | GO:0007156 | homophilic cell adhesion via plasma membrane adhesion molecules(GO:0007156) |
| 0.3 | 23.4 | GO:0043647 | inositol phosphate metabolic process(GO:0043647) |
| 0.3 | 1.5 | GO:0010756 | positive regulation of plasminogen activation(GO:0010756) |
| 0.3 | 3.0 | GO:0021942 | layer formation in cerebral cortex(GO:0021819) radial glia guided migration of Purkinje cell(GO:0021942) |
| 0.3 | 2.1 | GO:0009249 | protein lipoylation(GO:0009249) |
| 0.3 | 4.8 | GO:0072600 | establishment of protein localization to Golgi(GO:0072600) |
| 0.3 | 1.8 | GO:0016560 | protein import into peroxisome matrix, docking(GO:0016560) |
| 0.3 | 0.6 | GO:0021707 | cerebellar granular layer formation(GO:0021684) cerebellar granule cell differentiation(GO:0021707) |
| 0.3 | 5.9 | GO:0051457 | maintenance of protein location in nucleus(GO:0051457) |
| 0.3 | 0.8 | GO:0071918 | urea transmembrane transport(GO:0071918) |
| 0.3 | 1.7 | GO:0010269 | response to selenium ion(GO:0010269) |
| 0.3 | 4.2 | GO:0045725 | positive regulation of glycogen biosynthetic process(GO:0045725) |
| 0.3 | 0.8 | GO:0051973 | positive regulation of telomerase activity(GO:0051973) |
| 0.3 | 3.0 | GO:0032446 | protein modification by small protein conjugation(GO:0032446) |
| 0.3 | 3.3 | GO:0045161 | neuronal ion channel clustering(GO:0045161) |
| 0.3 | 2.4 | GO:0030308 | negative regulation of cell growth(GO:0030308) |
| 0.3 | 0.3 | GO:0098501 | polynucleotide dephosphorylation(GO:0098501) |
| 0.3 | 1.3 | GO:0009957 | epidermal cell fate specification(GO:0009957) |
| 0.3 | 13.9 | GO:0055007 | cardiac muscle cell differentiation(GO:0055007) |
| 0.3 | 3.9 | GO:0071549 | cellular response to dexamethasone stimulus(GO:0071549) |
| 0.3 | 1.0 | GO:0007185 | transmembrane receptor protein tyrosine phosphatase signaling pathway(GO:0007185) |
| 0.3 | 1.5 | GO:0051013 | microtubule severing(GO:0051013) |
| 0.3 | 5.8 | GO:0046580 | negative regulation of Ras protein signal transduction(GO:0046580) negative regulation of small GTPase mediated signal transduction(GO:0051058) |
| 0.3 | 2.0 | GO:0006531 | aspartate metabolic process(GO:0006531) |
| 0.2 | 0.7 | GO:0010592 | positive regulation of lamellipodium assembly(GO:0010592) |
| 0.2 | 1.2 | GO:0046604 | positive regulation of mitotic centrosome separation(GO:0046604) |
| 0.2 | 8.4 | GO:0019731 | antibacterial humoral response(GO:0019731) |
| 0.2 | 1.4 | GO:0000281 | mitotic cytokinesis(GO:0000281) |
| 0.2 | 0.2 | GO:2000969 | positive regulation of alpha-amino-3-hydroxy-5-methyl-4-isoxazole propionate selective glutamate receptor activity(GO:2000969) |
| 0.2 | 1.9 | GO:1900227 | positive regulation of NLRP3 inflammasome complex assembly(GO:1900227) |
| 0.2 | 7.1 | GO:0031398 | positive regulation of protein ubiquitination(GO:0031398) |
| 0.2 | 1.6 | GO:0021511 | spinal cord patterning(GO:0021511) |
| 0.2 | 7.6 | GO:0015721 | bile acid and bile salt transport(GO:0015721) |
| 0.2 | 6.2 | GO:0006368 | transcription elongation from RNA polymerase II promoter(GO:0006368) |
| 0.2 | 1.8 | GO:0033623 | regulation of integrin activation(GO:0033623) |
| 0.2 | 5.4 | GO:0097484 | dendrite extension(GO:0097484) |
| 0.2 | 0.7 | GO:0016082 | synaptic vesicle priming(GO:0016082) |
| 0.2 | 3.5 | GO:0030866 | cortical actin cytoskeleton organization(GO:0030866) |
| 0.2 | 1.9 | GO:0006564 | L-serine biosynthetic process(GO:0006564) |
| 0.2 | 5.1 | GO:0048384 | retinoic acid receptor signaling pathway(GO:0048384) |
| 0.2 | 1.3 | GO:0000707 | meiotic DNA recombinase assembly(GO:0000707) |
| 0.2 | 0.6 | GO:0006550 | isoleucine metabolic process(GO:0006549) isoleucine catabolic process(GO:0006550) |
| 0.2 | 1.0 | GO:0032480 | negative regulation of type I interferon production(GO:0032480) |
| 0.2 | 1.4 | GO:0097012 | cellular response to granulocyte macrophage colony-stimulating factor stimulus(GO:0097011) response to granulocyte macrophage colony-stimulating factor(GO:0097012) |
| 0.2 | 0.8 | GO:0044857 | plasma membrane raft assembly(GO:0044854) plasma membrane raft organization(GO:0044857) |
| 0.2 | 8.2 | GO:0016266 | O-glycan processing(GO:0016266) |
| 0.2 | 2.0 | GO:0050821 | protein stabilization(GO:0050821) |
| 0.2 | 2.4 | GO:0098927 | vesicle-mediated transport between endosomal compartments(GO:0098927) |
| 0.2 | 5.8 | GO:0045333 | cellular respiration(GO:0045333) |
| 0.2 | 0.4 | GO:1904502 | regulation of lipophagy(GO:1904502) positive regulation of lipophagy(GO:1904504) |
| 0.2 | 0.6 | GO:1901029 | negative regulation of mitochondrial outer membrane permeabilization involved in apoptotic signaling pathway(GO:1901029) |
| 0.2 | 1.5 | GO:0051291 | protein heterooligomerization(GO:0051291) |
| 0.2 | 5.6 | GO:0071392 | cellular response to estradiol stimulus(GO:0071392) |
| 0.2 | 7.3 | GO:1901222 | regulation of NIK/NF-kappaB signaling(GO:1901222) |
| 0.2 | 4.7 | GO:0008542 | visual learning(GO:0008542) |
| 0.2 | 5.2 | GO:0033500 | carbohydrate homeostasis(GO:0033500) glucose homeostasis(GO:0042593) |
| 0.2 | 48.9 | GO:0006936 | muscle contraction(GO:0006936) |
| 0.2 | 1.1 | GO:0010927 | cellular component assembly involved in morphogenesis(GO:0010927) |
| 0.2 | 0.3 | GO:0021764 | amygdala development(GO:0021764) |
| 0.2 | 0.3 | GO:1902714 | negative regulation of interferon-gamma secretion(GO:1902714) |
| 0.2 | 0.8 | GO:0032510 | endosome to lysosome transport via multivesicular body sorting pathway(GO:0032510) |
| 0.2 | 6.3 | GO:0032465 | regulation of cytokinesis(GO:0032465) |
| 0.2 | 0.5 | GO:0010216 | maintenance of DNA methylation(GO:0010216) |
| 0.2 | 0.5 | GO:0043163 | cell envelope organization(GO:0043163) external encapsulating structure organization(GO:0045229) |
| 0.2 | 0.5 | GO:0016259 | selenocysteine metabolic process(GO:0016259) selenocysteine biosynthetic process(GO:0016260) |
| 0.2 | 0.6 | GO:2000188 | regulation of cholesterol homeostasis(GO:2000188) |
| 0.1 | 1.0 | GO:1900181 | negative regulation of protein localization to nucleus(GO:1900181) |
| 0.1 | 5.3 | GO:0034249 | negative regulation of cellular amide metabolic process(GO:0034249) |
| 0.1 | 4.2 | GO:0045739 | positive regulation of DNA repair(GO:0045739) |
| 0.1 | 1.0 | GO:0070307 | lens fiber cell development(GO:0070307) |
| 0.1 | 0.4 | GO:0034587 | piRNA metabolic process(GO:0034587) |
| 0.1 | 0.1 | GO:0035610 | protein side chain deglutamylation(GO:0035610) |
| 0.1 | 0.3 | GO:0001675 | acrosome assembly(GO:0001675) |
| 0.1 | 1.3 | GO:0051683 | establishment of Golgi localization(GO:0051683) |
| 0.1 | 5.7 | GO:0070527 | platelet aggregation(GO:0070527) |
| 0.1 | 1.4 | GO:0001867 | complement activation, lectin pathway(GO:0001867) |
| 0.1 | 1.8 | GO:0035970 | peptidyl-threonine dephosphorylation(GO:0035970) |
| 0.1 | 1.3 | GO:1903830 | magnesium ion transmembrane transport(GO:1903830) |
| 0.1 | 0.3 | GO:0006423 | cysteinyl-tRNA aminoacylation(GO:0006423) |
| 0.1 | 0.4 | GO:0072526 | pyridine-containing compound catabolic process(GO:0072526) |
| 0.1 | 0.6 | GO:0038172 | interleukin-33-mediated signaling pathway(GO:0038172) |
| 0.1 | 2.7 | GO:0071300 | cellular response to retinoic acid(GO:0071300) |
| 0.1 | 0.7 | GO:0019919 | peptidyl-arginine methylation, to asymmetrical-dimethyl arginine(GO:0019919) |
| 0.1 | 1.0 | GO:0008635 | activation of cysteine-type endopeptidase activity involved in apoptotic process by cytochrome c(GO:0008635) |
| 0.1 | 1.7 | GO:0032012 | regulation of ARF protein signal transduction(GO:0032012) |
| 0.1 | 2.1 | GO:0007216 | G-protein coupled glutamate receptor signaling pathway(GO:0007216) |
| 0.1 | 2.9 | GO:0006826 | iron ion transport(GO:0006826) |
| 0.1 | 2.2 | GO:0001558 | regulation of cell growth(GO:0001558) |
| 0.1 | 1.8 | GO:0007638 | mechanosensory behavior(GO:0007638) |
| 0.1 | 2.3 | GO:0042572 | retinol metabolic process(GO:0042572) |
| 0.1 | 1.0 | GO:1903206 | negative regulation of hydrogen peroxide-induced cell death(GO:1903206) |
| 0.1 | 2.3 | GO:0010738 | regulation of protein kinase A signaling(GO:0010738) |
| 0.1 | 0.5 | GO:0010735 | positive regulation of transcription via serum response element binding(GO:0010735) |
| 0.1 | 0.5 | GO:0045668 | negative regulation of osteoblast differentiation(GO:0045668) |
| 0.1 | 10.3 | GO:0030449 | regulation of complement activation(GO:0030449) regulation of protein activation cascade(GO:2000257) |
| 0.1 | 0.3 | GO:0019254 | carnitine metabolic process, CoA-linked(GO:0019254) |
| 0.1 | 1.6 | GO:0006783 | heme biosynthetic process(GO:0006783) |
| 0.1 | 0.6 | GO:0060080 | inhibitory postsynaptic potential(GO:0060080) |
| 0.1 | 6.3 | GO:0043473 | pigmentation(GO:0043473) |
| 0.1 | 1.3 | GO:0050435 | beta-amyloid metabolic process(GO:0050435) |
| 0.1 | 0.2 | GO:0048548 | regulation of pinocytosis(GO:0048548) |
| 0.1 | 0.6 | GO:0042711 | maternal behavior(GO:0042711) parental behavior(GO:0060746) |
| 0.1 | 0.1 | GO:0061511 | centriole elongation(GO:0061511) |
| 0.1 | 2.9 | GO:0030516 | regulation of axon extension(GO:0030516) |
| 0.1 | 0.8 | GO:0035249 | synaptic transmission, glutamatergic(GO:0035249) |
| 0.1 | 0.5 | GO:0002863 | positive regulation of inflammatory response to antigenic stimulus(GO:0002863) |
| 0.1 | 0.5 | GO:0043508 | negative regulation of JUN kinase activity(GO:0043508) |
| 0.1 | 0.7 | GO:0010801 | negative regulation of peptidyl-threonine phosphorylation(GO:0010801) |
| 0.1 | 2.8 | GO:0001935 | endothelial cell proliferation(GO:0001935) |
| 0.1 | 0.5 | GO:0007184 | SMAD protein import into nucleus(GO:0007184) |
| 0.1 | 5.2 | GO:0046546 | male gonad development(GO:0008584) development of primary male sexual characteristics(GO:0046546) |
| 0.1 | 0.2 | GO:0000389 | mRNA 3'-splice site recognition(GO:0000389) |
| 0.1 | 0.2 | GO:0071850 | mitotic cell cycle arrest(GO:0071850) |
| 0.1 | 1.2 | GO:0019228 | neuronal action potential(GO:0019228) |
| 0.1 | 0.3 | GO:0019375 | galactosylceramide biosynthetic process(GO:0006682) galactolipid biosynthetic process(GO:0019375) |
| 0.1 | 0.8 | GO:0015813 | L-glutamate transport(GO:0015813) |
| 0.1 | 5.3 | GO:0032990 | cell part morphogenesis(GO:0032990) cell projection morphogenesis(GO:0048858) |
| 0.1 | 0.3 | GO:0032534 | regulation of microvillus assembly(GO:0032534) |
| 0.1 | 0.3 | GO:0042749 | regulation of circadian sleep/wake cycle(GO:0042749) regulation of circadian sleep/wake cycle, sleep(GO:0045187) |
| 0.0 | 0.2 | GO:0051934 | dopamine uptake involved in synaptic transmission(GO:0051583) catecholamine uptake involved in synaptic transmission(GO:0051934) catecholamine uptake(GO:0090493) dopamine uptake(GO:0090494) |
| 0.0 | 0.2 | GO:0032483 | regulation of Rab protein signal transduction(GO:0032483) |
| 0.0 | 0.9 | GO:0006337 | nucleosome disassembly(GO:0006337) chromatin disassembly(GO:0031498) |
| 0.0 | 1.9 | GO:0031497 | chromatin assembly(GO:0031497) |
| 0.0 | 0.3 | GO:0050765 | negative regulation of phagocytosis(GO:0050765) |
| 0.0 | 0.6 | GO:0031468 | nuclear envelope reassembly(GO:0031468) |
| 0.0 | 2.1 | GO:0006970 | response to osmotic stress(GO:0006970) |
| 0.0 | 0.4 | GO:0055022 | negative regulation of cardiac muscle tissue growth(GO:0055022) negative regulation of heart growth(GO:0061117) |
| 0.0 | 0.5 | GO:0060218 | hematopoietic stem cell differentiation(GO:0060218) |
| 0.0 | 0.8 | GO:0001580 | detection of chemical stimulus involved in sensory perception of bitter taste(GO:0001580) |
| 0.0 | 0.2 | GO:0070995 | NADPH oxidation(GO:0070995) |
| 0.0 | 0.7 | GO:0045104 | intermediate filament cytoskeleton organization(GO:0045104) |
| 0.0 | 10.1 | GO:0007283 | spermatogenesis(GO:0007283) male gamete generation(GO:0048232) |
| 0.0 | 0.4 | GO:0000186 | activation of MAPKK activity(GO:0000186) |
| 0.0 | 0.7 | GO:0045776 | negative regulation of blood pressure(GO:0045776) |
| 0.0 | 0.5 | GO:1903391 | regulation of focal adhesion assembly(GO:0051893) regulation of cell-substrate junction assembly(GO:0090109) regulation of adherens junction organization(GO:1903391) |
| 0.0 | 0.1 | GO:0070781 | response to biotin(GO:0070781) |
| 0.0 | 0.2 | GO:0019509 | L-methionine biosynthetic process from methylthioadenosine(GO:0019509) |
| 0.0 | 0.6 | GO:1901655 | cellular response to ketone(GO:1901655) |
| 0.0 | 0.4 | GO:0016445 | somatic diversification of immunoglobulins(GO:0016445) |
| 0.0 | 0.4 | GO:0007595 | lactation(GO:0007595) |
| 0.0 | 1.5 | GO:0070268 | cornification(GO:0070268) |
| 0.0 | 0.1 | GO:0042727 | flavin-containing compound biosynthetic process(GO:0042727) |
| 0.0 | 0.1 | GO:1903237 | negative regulation of leukocyte tethering or rolling(GO:1903237) negative regulation of leukocyte adhesion to vascular endothelial cell(GO:1904995) |
| 0.0 | 0.4 | GO:0007194 | negative regulation of adenylate cyclase activity(GO:0007194) |
| 0.0 | 1.1 | GO:0030574 | collagen catabolic process(GO:0030574) |
| 0.0 | 0.1 | GO:0030316 | osteoclast differentiation(GO:0030316) |
| 0.0 | 0.1 | GO:0016255 | attachment of GPI anchor to protein(GO:0016255) |
| 0.0 | 0.1 | GO:0016554 | cytidine to uridine editing(GO:0016554) |
| 0.0 | 0.5 | GO:0051168 | nuclear export(GO:0051168) |
| 0.0 | 0.2 | GO:0046710 | GDP metabolic process(GO:0046710) |
Gene overrepresentation in cellular_component category:
| Log-likelihood per target | Total log-likelihood | Term | Description |
|---|---|---|---|
| 32.5 | 130.2 | GO:0070985 | TFIIK complex(GO:0070985) |
| 27.5 | 82.4 | GO:0033185 | dolichol-phosphate-mannose synthase complex(GO:0033185) |
| 16.0 | 191.9 | GO:0031595 | nuclear proteasome complex(GO:0031595) |
| 14.8 | 59.1 | GO:0071818 | BAT3 complex(GO:0071818) ER membrane insertion complex(GO:0072379) |
| 14.7 | 88.4 | GO:0071817 | MMXD complex(GO:0071817) |
| 12.5 | 225.9 | GO:0034709 | methylosome(GO:0034709) |
| 12.5 | 49.9 | GO:1990745 | EARP complex(GO:1990745) |
| 12.0 | 84.3 | GO:1990726 | Lsm1-7-Pat1 complex(GO:1990726) |
| 10.8 | 32.4 | GO:0031372 | UBC13-MMS2 complex(GO:0031372) |
| 10.0 | 169.2 | GO:0032059 | bleb(GO:0032059) |
| 9.9 | 29.8 | GO:0018444 | translation release factor complex(GO:0018444) |
| 9.4 | 75.4 | GO:0042719 | mitochondrial intermembrane space protein transporter complex(GO:0042719) |
| 9.3 | 65.0 | GO:0016272 | prefoldin complex(GO:0016272) |
| 9.0 | 27.0 | GO:0097441 | basilar dendrite(GO:0097441) |
| 8.5 | 25.5 | GO:0005656 | nuclear pre-replicative complex(GO:0005656) pre-replicative complex(GO:0036387) |
| 8.5 | 8.5 | GO:0097651 | phosphatidylinositol 3-kinase complex, class IA(GO:0005943) phosphatidylinositol 3-kinase complex, class I(GO:0097651) |
| 8.5 | 67.7 | GO:0032133 | chromosome passenger complex(GO:0032133) |
| 8.4 | 75.8 | GO:0033588 | Elongator holoenzyme complex(GO:0033588) |
| 8.3 | 49.9 | GO:0005958 | DNA-dependent protein kinase-DNA ligase 4 complex(GO:0005958) |
| 8.0 | 40.1 | GO:0032021 | NELF complex(GO:0032021) |
| 8.0 | 40.1 | GO:0045272 | plasma membrane respiratory chain complex I(GO:0045272) |
| 8.0 | 40.0 | GO:0000408 | EKC/KEOPS complex(GO:0000408) |
| 7.9 | 31.8 | GO:0031510 | SUMO activating enzyme complex(GO:0031510) |
| 7.5 | 30.2 | GO:0045283 | mitochondrial respiratory chain complex II, succinate dehydrogenase complex (ubiquinone)(GO:0005749) succinate dehydrogenase complex (ubiquinone)(GO:0045257) respiratory chain complex II(GO:0045273) succinate dehydrogenase complex(GO:0045281) fumarate reductase complex(GO:0045283) |
| 7.5 | 89.6 | GO:0008250 | oligosaccharyltransferase complex(GO:0008250) |
| 7.4 | 81.1 | GO:0033018 | sarcoplasmic reticulum lumen(GO:0033018) |
| 7.1 | 35.5 | GO:1990425 | ryanodine receptor complex(GO:1990425) |
| 7.0 | 77.5 | GO:0000176 | nuclear exosome (RNase complex)(GO:0000176) |
| 6.8 | 33.9 | GO:0097149 | centralspindlin complex(GO:0097149) |
| 6.6 | 39.9 | GO:0031390 | Ctf18 RFC-like complex(GO:0031390) |
| 6.6 | 19.7 | GO:0030689 | Noc complex(GO:0030689) |
| 6.5 | 38.9 | GO:0061689 | tricellular tight junction(GO:0061689) |
| 6.4 | 44.5 | GO:0000813 | ESCRT I complex(GO:0000813) |
| 6.3 | 25.3 | GO:0032044 | DSIF complex(GO:0032044) |
| 6.3 | 119.5 | GO:0036020 | endolysosome membrane(GO:0036020) |
| 6.3 | 50.1 | GO:0005851 | eukaryotic translation initiation factor 2B complex(GO:0005851) |
| 6.3 | 56.3 | GO:0008541 | proteasome regulatory particle, lid subcomplex(GO:0008541) |
| 6.0 | 35.9 | GO:0070435 | Shc-EGFR complex(GO:0070435) |
| 5.9 | 53.2 | GO:0072546 | ER membrane protein complex(GO:0072546) |
| 5.8 | 174.4 | GO:0030687 | preribosome, large subunit precursor(GO:0030687) |
| 5.6 | 33.6 | GO:0008537 | proteasome activator complex(GO:0008537) |
| 5.6 | 27.8 | GO:0070847 | core mediator complex(GO:0070847) |
| 5.5 | 32.9 | GO:1902560 | GMP reductase complex(GO:1902560) |
| 5.5 | 21.8 | GO:0005846 | nuclear cap binding complex(GO:0005846) |
| 5.4 | 21.5 | GO:0044611 | nuclear pore inner ring(GO:0044611) |
| 5.3 | 16.0 | GO:1902636 | kinociliary basal body(GO:1902636) |
| 5.2 | 15.7 | GO:0071020 | post-spliceosomal complex(GO:0071020) |
| 5.2 | 99.1 | GO:0005832 | chaperonin-containing T-complex(GO:0005832) |
| 5.2 | 41.5 | GO:0005672 | transcription factor TFIIA complex(GO:0005672) |
| 5.1 | 50.7 | GO:0030126 | COPI vesicle coat(GO:0030126) |
| 4.9 | 14.8 | GO:0016222 | procollagen-proline 4-dioxygenase complex(GO:0016222) |
| 4.8 | 77.5 | GO:0016461 | unconventional myosin complex(GO:0016461) |
| 4.8 | 193.3 | GO:0005762 | organellar large ribosomal subunit(GO:0000315) mitochondrial large ribosomal subunit(GO:0005762) |
| 4.8 | 52.7 | GO:0070765 | gamma-secretase complex(GO:0070765) |
| 4.8 | 38.1 | GO:0005786 | signal recognition particle, endoplasmic reticulum targeting(GO:0005786) |
| 4.8 | 109.6 | GO:0005685 | U1 snRNP(GO:0005685) |
| 4.6 | 50.2 | GO:0005744 | mitochondrial inner membrane presequence translocase complex(GO:0005744) |
| 4.6 | 13.7 | GO:0005608 | laminin-3 complex(GO:0005608) |
| 4.4 | 30.6 | GO:0005956 | protein kinase CK2 complex(GO:0005956) |
| 4.4 | 47.9 | GO:0005750 | mitochondrial respiratory chain complex III(GO:0005750) respiratory chain complex III(GO:0045275) |
| 4.2 | 21.1 | GO:0098837 | postsynaptic recycling endosome(GO:0098837) |
| 4.2 | 29.6 | GO:0000172 | ribonuclease MRP complex(GO:0000172) |
| 4.2 | 75.2 | GO:0005736 | DNA-directed RNA polymerase I complex(GO:0005736) |
| 4.1 | 78.8 | GO:0070971 | endoplasmic reticulum exit site(GO:0070971) |
| 4.1 | 36.7 | GO:0097443 | sorting endosome(GO:0097443) |
| 4.1 | 24.5 | GO:0031429 | box H/ACA snoRNP complex(GO:0031429) box H/ACA RNP complex(GO:0072588) box H/ACA scaRNP complex(GO:0072589) box H/ACA telomerase RNP complex(GO:0090661) |
| 4.0 | 27.9 | GO:0045252 | oxoglutarate dehydrogenase complex(GO:0045252) |
| 3.9 | 85.1 | GO:0030127 | COPII vesicle coat(GO:0030127) |
| 3.8 | 42.3 | GO:0022624 | proteasome accessory complex(GO:0022624) |
| 3.8 | 41.6 | GO:0098799 | outer mitochondrial membrane protein complex(GO:0098799) |
| 3.7 | 11.1 | GO:0034685 | integrin alphav-beta6 complex(GO:0034685) integrin alphav-beta8 complex(GO:0034686) |
| 3.7 | 51.6 | GO:0001673 | male germ cell nucleus(GO:0001673) |
| 3.6 | 39.9 | GO:0043203 | axon hillock(GO:0043203) |
| 3.5 | 13.8 | GO:0071598 | neuronal ribonucleoprotein granule(GO:0071598) |
| 3.4 | 40.9 | GO:0030008 | TRAPP complex(GO:0030008) |
| 3.4 | 17.0 | GO:0071797 | LUBAC complex(GO:0071797) |
| 3.4 | 16.9 | GO:0071986 | Ragulator complex(GO:0071986) |
| 3.4 | 23.7 | GO:0061617 | MICOS complex(GO:0061617) |
| 3.4 | 30.4 | GO:0071541 | eukaryotic translation initiation factor 3 complex, eIF3m(GO:0071541) |
| 3.4 | 16.8 | GO:0097125 | cyclin B1-CDK1 complex(GO:0097125) |
| 3.3 | 53.4 | GO:0019774 | proteasome core complex, beta-subunit complex(GO:0019774) |
| 3.2 | 63.3 | GO:0031588 | nucleotide-activated protein kinase complex(GO:0031588) |
| 3.1 | 9.4 | GO:0034455 | t-UTP complex(GO:0034455) |
| 3.1 | 21.5 | GO:0070522 | nucleotide-excision repair factor 1 complex(GO:0000110) ERCC4-ERCC1 complex(GO:0070522) |
| 3.0 | 36.2 | GO:0005751 | mitochondrial respiratory chain complex IV(GO:0005751) |
| 2.7 | 86.6 | GO:0016592 | mediator complex(GO:0016592) |
| 2.7 | 37.3 | GO:0005662 | DNA replication factor A complex(GO:0005662) |
| 2.7 | 8.0 | GO:0035370 | UBC13-UEV1A complex(GO:0035370) |
| 2.6 | 31.7 | GO:0019773 | proteasome core complex, alpha-subunit complex(GO:0019773) |
| 2.6 | 23.7 | GO:0034464 | BBSome(GO:0034464) |
| 2.6 | 18.4 | GO:0000275 | mitochondrial proton-transporting ATP synthase complex, catalytic core F(1)(GO:0000275) |
| 2.6 | 7.9 | GO:0005953 | CAAX-protein geranylgeranyltransferase complex(GO:0005953) |
| 2.6 | 135.5 | GO:0008180 | COP9 signalosome(GO:0008180) |
| 2.6 | 93.6 | GO:0000421 | autophagosome membrane(GO:0000421) |
| 2.5 | 7.6 | GO:0042765 | GPI-anchor transamidase complex(GO:0042765) |
| 2.5 | 7.6 | GO:0071012 | catalytic step 1 spliceosome(GO:0071012) |
| 2.5 | 29.9 | GO:0005847 | mRNA cleavage and polyadenylation specificity factor complex(GO:0005847) |
| 2.5 | 44.6 | GO:0000276 | mitochondrial proton-transporting ATP synthase complex, coupling factor F(o)(GO:0000276) |
| 2.5 | 12.3 | GO:0005839 | proteasome core complex(GO:0005839) |
| 2.4 | 24.5 | GO:0097255 | R2TP complex(GO:0097255) |
| 2.4 | 26.9 | GO:1990023 | mitotic spindle midzone(GO:1990023) |
| 2.4 | 61.3 | GO:0031231 | integral component of peroxisomal membrane(GO:0005779) intrinsic component of peroxisomal membrane(GO:0031231) |
| 2.3 | 16.4 | GO:0031415 | NatA complex(GO:0031415) |
| 2.3 | 9.3 | GO:0005687 | U4 snRNP(GO:0005687) |
| 2.3 | 126.5 | GO:0019005 | SCF ubiquitin ligase complex(GO:0019005) |
| 2.2 | 134.9 | GO:0005747 | mitochondrial respiratory chain complex I(GO:0005747) NADH dehydrogenase complex(GO:0030964) respiratory chain complex I(GO:0045271) |
| 2.2 | 24.7 | GO:0035985 | senescence-associated heterochromatin focus(GO:0035985) |
| 2.2 | 13.4 | GO:0031371 | ubiquitin conjugating enzyme complex(GO:0031371) |
| 2.2 | 31.4 | GO:0036038 | MKS complex(GO:0036038) |
| 2.2 | 19.4 | GO:0005675 | holo TFIIH complex(GO:0005675) |
| 2.1 | 6.4 | GO:0031428 | box C/D snoRNP complex(GO:0031428) |
| 2.0 | 8.2 | GO:0070876 | SOSS complex(GO:0070876) |
| 2.0 | 6.1 | GO:0090498 | extrinsic component of Golgi membrane(GO:0090498) |
| 2.0 | 20.0 | GO:0000796 | condensin complex(GO:0000796) |
| 2.0 | 53.8 | GO:0005868 | cytoplasmic dynein complex(GO:0005868) |
| 1.9 | 15.3 | GO:0042382 | paraspeckles(GO:0042382) |
| 1.9 | 7.6 | GO:1990796 | photoreceptor cell terminal bouton(GO:1990796) |
| 1.8 | 9.2 | GO:0034388 | Pwp2p-containing subcomplex of 90S preribosome(GO:0034388) |
| 1.8 | 29.3 | GO:0030914 | STAGA complex(GO:0030914) |
| 1.8 | 27.1 | GO:0000812 | Swr1 complex(GO:0000812) |
| 1.8 | 5.3 | GO:0016938 | kinesin I complex(GO:0016938) |
| 1.7 | 8.7 | GO:0032449 | CBM complex(GO:0032449) |
| 1.7 | 8.7 | GO:0005602 | complement component C1 complex(GO:0005602) |
| 1.7 | 10.2 | GO:0005784 | Sec61 translocon complex(GO:0005784) translocon complex(GO:0071256) |
| 1.7 | 11.9 | GO:0031298 | replication fork protection complex(GO:0031298) |
| 1.7 | 5.0 | GO:0070939 | Dsl1p complex(GO:0070939) |
| 1.6 | 4.9 | GO:0072563 | endothelial microparticle(GO:0072563) |
| 1.6 | 16.2 | GO:0000506 | glycosylphosphatidylinositol-N-acetylglucosaminyltransferase (GPI-GnT) complex(GO:0000506) |
| 1.6 | 14.6 | GO:0000177 | cytoplasmic exosome (RNase complex)(GO:0000177) |
| 1.6 | 4.8 | GO:0097134 | Y chromosome(GO:0000806) cyclin A2-CDK2 complex(GO:0097124) cyclin E1-CDK2 complex(GO:0097134) |
| 1.6 | 23.9 | GO:0031080 | nuclear pore outer ring(GO:0031080) |
| 1.6 | 9.4 | GO:1990131 | EGO complex(GO:0034448) Gtr1-Gtr2 GTPase complex(GO:1990131) |
| 1.5 | 6.2 | GO:0032937 | SREBP-SCAP-Insig complex(GO:0032937) |
| 1.5 | 24.6 | GO:0036452 | ESCRT complex(GO:0036452) |
| 1.5 | 39.9 | GO:0090545 | NuRD complex(GO:0016581) CHD-type complex(GO:0090545) |
| 1.5 | 12.2 | GO:0070552 | BRISC complex(GO:0070552) |
| 1.5 | 55.8 | GO:0031941 | filamentous actin(GO:0031941) |
| 1.5 | 4.5 | GO:0030289 | protein phosphatase 4 complex(GO:0030289) |
| 1.5 | 71.8 | GO:0009295 | nucleoid(GO:0009295) mitochondrial nucleoid(GO:0042645) |
| 1.4 | 7.1 | GO:0005753 | mitochondrial proton-transporting ATP synthase complex(GO:0005753) |
| 1.4 | 7.1 | GO:0071148 | TEAD-1-YAP complex(GO:0071148) |
| 1.4 | 22.3 | GO:0033202 | Ino80 complex(GO:0031011) DNA helicase complex(GO:0033202) |
| 1.4 | 4.1 | GO:0071159 | NF-kappaB complex(GO:0071159) |
| 1.4 | 9.6 | GO:0034098 | VCP-NPL4-UFD1 AAA ATPase complex(GO:0034098) |
| 1.3 | 10.8 | GO:0034518 | mRNA cap binding complex(GO:0005845) RNA cap binding complex(GO:0034518) |
| 1.3 | 10.8 | GO:0044233 | ER-mitochondrion membrane contact site(GO:0044233) |
| 1.3 | 35.4 | GO:0002080 | acrosomal membrane(GO:0002080) |
| 1.3 | 5.2 | GO:0031414 | N-terminal protein acetyltransferase complex(GO:0031414) |
| 1.3 | 20.3 | GO:0005671 | Ada2/Gcn5/Ada3 transcription activator complex(GO:0005671) |
| 1.3 | 5.1 | GO:0009368 | endopeptidase Clp complex(GO:0009368) |
| 1.2 | 93.4 | GO:0005884 | actin filament(GO:0005884) |
| 1.2 | 10.5 | GO:0005955 | calcineurin complex(GO:0005955) |
| 1.2 | 4.6 | GO:0036449 | microtubule minus-end(GO:0036449) |
| 1.1 | 9.1 | GO:0033276 | transcription factor TFTC complex(GO:0033276) |
| 1.1 | 5.6 | GO:0000243 | commitment complex(GO:0000243) |
| 1.1 | 38.7 | GO:0016469 | proton-transporting two-sector ATPase complex(GO:0016469) |
| 1.1 | 4.3 | GO:0042587 | glycogen granule(GO:0042587) |
| 1.1 | 26.9 | GO:0000314 | organellar small ribosomal subunit(GO:0000314) mitochondrial small ribosomal subunit(GO:0005763) |
| 1.0 | 52.3 | GO:0005876 | spindle microtubule(GO:0005876) |
| 1.0 | 4.1 | GO:0000214 | tRNA-intron endonuclease complex(GO:0000214) |
| 1.0 | 9.1 | GO:0000808 | origin recognition complex(GO:0000808) nuclear origin of replication recognition complex(GO:0005664) |
| 1.0 | 9.1 | GO:0032797 | SMN complex(GO:0032797) |
| 1.0 | 9.1 | GO:0097431 | mitotic spindle pole(GO:0097431) |
| 1.0 | 6.0 | GO:0030905 | retromer, tubulation complex(GO:0030905) |
| 1.0 | 5.0 | GO:0005658 | alpha DNA polymerase:primase complex(GO:0005658) |
| 1.0 | 4.9 | GO:0000306 | extrinsic component of vacuolar membrane(GO:0000306) |
| 1.0 | 2.9 | GO:0005944 | phosphatidylinositol 3-kinase complex, class IB(GO:0005944) |
| 0.9 | 11.3 | GO:0042555 | MCM complex(GO:0042555) |
| 0.9 | 3.8 | GO:0070695 | FHF complex(GO:0070695) |
| 0.9 | 21.5 | GO:0099738 | cell cortex region(GO:0099738) |
| 0.9 | 4.7 | GO:0005732 | small nucleolar ribonucleoprotein complex(GO:0005732) |
| 0.9 | 73.7 | GO:0000777 | condensed chromosome kinetochore(GO:0000777) |
| 0.9 | 19.2 | GO:0030867 | rough endoplasmic reticulum membrane(GO:0030867) |
| 0.9 | 61.6 | GO:0005637 | nuclear inner membrane(GO:0005637) |
| 0.9 | 9.9 | GO:0005669 | transcription factor TFIID complex(GO:0005669) |
| 0.9 | 262.9 | GO:0005743 | mitochondrial inner membrane(GO:0005743) |
| 0.9 | 50.4 | GO:0010494 | cytoplasmic stress granule(GO:0010494) |
| 0.9 | 20.1 | GO:0005680 | anaphase-promoting complex(GO:0005680) |
| 0.9 | 6.1 | GO:0000120 | RNA polymerase I transcription factor complex(GO:0000120) |
| 0.9 | 6.8 | GO:0030123 | AP-3 adaptor complex(GO:0030123) |
| 0.8 | 5.9 | GO:0012507 | ER to Golgi transport vesicle membrane(GO:0012507) |
| 0.8 | 27.6 | GO:0005871 | kinesin complex(GO:0005871) |
| 0.8 | 38.4 | GO:0031463 | Cul3-RING ubiquitin ligase complex(GO:0031463) |
| 0.8 | 7.4 | GO:0097470 | ribbon synapse(GO:0097470) |
| 0.8 | 10.6 | GO:0035631 | CD40 receptor complex(GO:0035631) |
| 0.8 | 17.1 | GO:0032420 | stereocilium(GO:0032420) |
| 0.8 | 16.3 | GO:0000502 | proteasome complex(GO:0000502) |
| 0.8 | 4.1 | GO:0005899 | insulin receptor complex(GO:0005899) |
| 0.8 | 1.6 | GO:0090568 | nuclear transcriptional repressor complex(GO:0090568) |
| 0.8 | 5.6 | GO:0005787 | signal peptidase complex(GO:0005787) |
| 0.8 | 12.7 | GO:0034663 | endoplasmic reticulum chaperone complex(GO:0034663) |
| 0.8 | 14.9 | GO:0005665 | DNA-directed RNA polymerase II, core complex(GO:0005665) |
| 0.8 | 168.2 | GO:0001726 | ruffle(GO:0001726) |
| 0.8 | 3.1 | GO:0008024 | cyclin/CDK positive transcription elongation factor complex(GO:0008024) |
| 0.8 | 5.4 | GO:0005638 | lamin filament(GO:0005638) |
| 0.8 | 13.0 | GO:0000164 | protein phosphatase type 1 complex(GO:0000164) |
| 0.8 | 28.2 | GO:0005758 | mitochondrial intermembrane space(GO:0005758) |
| 0.7 | 2.9 | GO:0060091 | kinocilium(GO:0060091) |
| 0.7 | 2.2 | GO:0001940 | male pronucleus(GO:0001940) |
| 0.7 | 14.6 | GO:0032040 | small-subunit processome(GO:0032040) |
| 0.7 | 1.4 | GO:0034274 | Atg12-Atg5-Atg16 complex(GO:0034274) |
| 0.7 | 1.4 | GO:0014802 | terminal cisterna(GO:0014802) |
| 0.7 | 2.1 | GO:0031211 | serine C-palmitoyltransferase complex(GO:0017059) endoplasmic reticulum palmitoyltransferase complex(GO:0031211) |
| 0.7 | 0.7 | GO:0033269 | internode region of axon(GO:0033269) |
| 0.7 | 35.4 | GO:1904813 | ficolin-1-rich granule(GO:0101002) ficolin-1-rich granule lumen(GO:1904813) |
| 0.7 | 26.3 | GO:0033017 | sarcoplasmic reticulum membrane(GO:0033017) |
| 0.7 | 5.2 | GO:0005689 | U12-type spliceosomal complex(GO:0005689) |
| 0.6 | 10.9 | GO:0000145 | exocyst(GO:0000145) |
| 0.6 | 81.7 | GO:0005793 | endoplasmic reticulum-Golgi intermediate compartment(GO:0005793) |
| 0.6 | 4.4 | GO:0030137 | COPI-coated vesicle(GO:0030137) |
| 0.6 | 5.7 | GO:0061574 | ASAP complex(GO:0061574) |
| 0.6 | 8.1 | GO:0016580 | Sin3 complex(GO:0016580) |
| 0.6 | 20.6 | GO:0016327 | apicolateral plasma membrane(GO:0016327) |
| 0.6 | 3.7 | GO:0030134 | ER to Golgi transport vesicle(GO:0030134) |
| 0.6 | 1.9 | GO:0097427 | microtubule bundle(GO:0097427) |
| 0.6 | 3.7 | GO:0097025 | MPP7-DLG1-LIN7 complex(GO:0097025) |
| 0.6 | 3.6 | GO:0032009 | early phagosome(GO:0032009) |
| 0.6 | 20.3 | GO:0090544 | BAF-type complex(GO:0090544) |
| 0.6 | 6.6 | GO:0042583 | chromaffin granule(GO:0042583) |
| 0.6 | 1.7 | GO:0031466 | Cul5-RING ubiquitin ligase complex(GO:0031466) |
| 0.6 | 29.0 | GO:0005834 | heterotrimeric G-protein complex(GO:0005834) |
| 0.6 | 60.0 | GO:0030176 | integral component of endoplasmic reticulum membrane(GO:0030176) |
| 0.6 | 11.8 | GO:0017101 | aminoacyl-tRNA synthetase multienzyme complex(GO:0017101) |
| 0.6 | 2.2 | GO:0005968 | Rab-protein geranylgeranyltransferase complex(GO:0005968) |
| 0.5 | 4.9 | GO:0000931 | gamma-tubulin large complex(GO:0000931) gamma-tubulin ring complex(GO:0008274) |
| 0.5 | 22.2 | GO:0016235 | aggresome(GO:0016235) |
| 0.5 | 1.1 | GO:0044232 | organelle membrane contact site(GO:0044232) |
| 0.5 | 9.1 | GO:0030285 | integral component of synaptic vesicle membrane(GO:0030285) intrinsic component of synaptic vesicle membrane(GO:0098563) |
| 0.5 | 4.3 | GO:0035861 | site of double-strand break(GO:0035861) |
| 0.5 | 255.4 | GO:0044429 | mitochondrial part(GO:0044429) |
| 0.5 | 10.1 | GO:0031082 | BLOC complex(GO:0031082) |
| 0.5 | 5.0 | GO:0005686 | U2 snRNP(GO:0005686) |
| 0.5 | 18.5 | GO:0030669 | clathrin-coated endocytic vesicle membrane(GO:0030669) |
| 0.5 | 2.5 | GO:0030686 | 90S preribosome(GO:0030686) |
| 0.5 | 49.3 | GO:0031093 | platelet alpha granule lumen(GO:0031093) |
| 0.5 | 18.1 | GO:0043198 | dendritic shaft(GO:0043198) |
| 0.5 | 2.9 | GO:0038201 | TORC2 complex(GO:0031932) TOR complex(GO:0038201) |
| 0.5 | 3.9 | GO:0031362 | anchored component of external side of plasma membrane(GO:0031362) |
| 0.5 | 7.7 | GO:0033270 | paranode region of axon(GO:0033270) |
| 0.5 | 7.2 | GO:0031258 | lamellipodium membrane(GO:0031258) |
| 0.4 | 4.9 | GO:0005666 | DNA-directed RNA polymerase III complex(GO:0005666) |
| 0.4 | 1.7 | GO:0019907 | cyclin-dependent protein kinase activating kinase holoenzyme complex(GO:0019907) |
| 0.4 | 0.4 | GO:0030981 | cortical microtubule cytoskeleton(GO:0030981) |
| 0.4 | 4.8 | GO:0097225 | sperm midpiece(GO:0097225) |
| 0.4 | 25.8 | GO:0030175 | filopodium(GO:0030175) |
| 0.4 | 0.7 | GO:0036195 | muscle cell projection(GO:0036194) muscle cell projection membrane(GO:0036195) |
| 0.4 | 275.2 | GO:0005739 | mitochondrion(GO:0005739) |
| 0.4 | 8.6 | GO:0005861 | troponin complex(GO:0005861) |
| 0.4 | 1.8 | GO:0045323 | interleukin-1 receptor complex(GO:0045323) |
| 0.4 | 5.0 | GO:0035102 | PRC1 complex(GO:0035102) |
| 0.4 | 47.3 | GO:0030018 | Z disc(GO:0030018) |
| 0.3 | 2.0 | GO:0031931 | TORC1 complex(GO:0031931) |
| 0.3 | 25.0 | GO:0005643 | nuclear pore(GO:0005643) |
| 0.3 | 1.3 | GO:0033061 | DNA recombinase mediator complex(GO:0033061) Rad51B-Rad51C-Rad51D-XRCC2 complex(GO:0033063) |
| 0.3 | 9.3 | GO:0005605 | basal lamina(GO:0005605) |
| 0.3 | 1.2 | GO:0070852 | cell body fiber(GO:0070852) |
| 0.3 | 6.9 | GO:0005892 | acetylcholine-gated channel complex(GO:0005892) |
| 0.3 | 26.6 | GO:0000151 | ubiquitin ligase complex(GO:0000151) |
| 0.3 | 2.4 | GO:0031105 | septin complex(GO:0031105) |
| 0.3 | 19.8 | GO:0005913 | cell-cell adherens junction(GO:0005913) |
| 0.3 | 4.3 | GO:0005922 | connexon complex(GO:0005922) |
| 0.3 | 2.5 | GO:0016281 | eukaryotic translation initiation factor 4F complex(GO:0016281) |
| 0.2 | 5.2 | GO:0044291 | cell-cell contact zone(GO:0044291) |
| 0.2 | 4.0 | GO:0055038 | recycling endosome membrane(GO:0055038) |
| 0.2 | 23.8 | GO:0043209 | myelin sheath(GO:0043209) |
| 0.2 | 3.6 | GO:0031089 | platelet dense granule lumen(GO:0031089) |
| 0.2 | 5.1 | GO:0001527 | microfibril(GO:0001527) fibril(GO:0043205) |
| 0.2 | 0.2 | GO:0044354 | pinosome(GO:0044352) macropinosome(GO:0044354) |
| 0.2 | 62.4 | GO:0005788 | endoplasmic reticulum lumen(GO:0005788) |
| 0.2 | 2.7 | GO:0005778 | peroxisomal membrane(GO:0005778) microbody membrane(GO:0031903) |
| 0.2 | 0.7 | GO:0035577 | azurophil granule membrane(GO:0035577) |
| 0.2 | 41.5 | GO:0031967 | organelle envelope(GO:0031967) envelope(GO:0031975) |
| 0.2 | 17.3 | GO:0043197 | dendritic spine(GO:0043197) |
| 0.2 | 2.5 | GO:0031265 | CD95 death-inducing signaling complex(GO:0031265) |
| 0.2 | 1.5 | GO:1990124 | messenger ribonucleoprotein complex(GO:1990124) |
| 0.2 | 4.0 | GO:0002102 | podosome(GO:0002102) |
| 0.2 | 0.4 | GO:0089701 | U2AF(GO:0089701) |
| 0.2 | 8.6 | GO:0000794 | condensed nuclear chromosome(GO:0000794) |
| 0.2 | 10.4 | GO:0022627 | cytosolic small ribosomal subunit(GO:0022627) |
| 0.2 | 1.6 | GO:0097610 | cleavage furrow(GO:0032154) cell surface furrow(GO:0097610) |
| 0.2 | 0.2 | GO:0035032 | phosphatidylinositol 3-kinase complex, class III(GO:0035032) |
| 0.2 | 4.0 | GO:0005881 | cytoplasmic microtubule(GO:0005881) |
| 0.2 | 28.7 | GO:0005874 | microtubule(GO:0005874) |
| 0.2 | 9.7 | GO:0048770 | melanosome(GO:0042470) pigment granule(GO:0048770) |
| 0.2 | 1.4 | GO:0005579 | membrane attack complex(GO:0005579) |
| 0.2 | 10.5 | GO:0035580 | specific granule lumen(GO:0035580) |
| 0.1 | 4.4 | GO:0000793 | condensed chromosome(GO:0000793) |
| 0.1 | 12.1 | GO:0005796 | Golgi lumen(GO:0005796) |
| 0.1 | 6.2 | GO:0005901 | caveola(GO:0005901) |
| 0.1 | 0.4 | GO:0005674 | transcription factor TFIIF complex(GO:0005674) |
| 0.1 | 124.9 | GO:0005783 | endoplasmic reticulum(GO:0005783) |
| 0.1 | 4.2 | GO:0001725 | stress fiber(GO:0001725) contractile actin filament bundle(GO:0097517) |
| 0.1 | 6.0 | GO:0070160 | occluding junction(GO:0070160) |
| 0.1 | 0.4 | GO:0071546 | pi-body(GO:0071546) |
| 0.1 | 1.7 | GO:0030426 | growth cone(GO:0030426) |
| 0.1 | 9.5 | GO:0009898 | cytoplasmic side of plasma membrane(GO:0009898) |
| 0.1 | 0.8 | GO:0005852 | eukaryotic translation initiation factor 3 complex(GO:0005852) |
| 0.1 | 4.8 | GO:0043202 | lysosomal lumen(GO:0043202) |
| 0.1 | 0.7 | GO:0009925 | basal plasma membrane(GO:0009925) |
| 0.1 | 0.7 | GO:0045178 | basal part of cell(GO:0045178) |
| 0.1 | 0.4 | GO:0016593 | Cdc73/Paf1 complex(GO:0016593) |
| 0.1 | 1.4 | GO:0005581 | collagen trimer(GO:0005581) |
| 0.1 | 87.0 | GO:0070062 | extracellular exosome(GO:0070062) |
| 0.1 | 0.4 | GO:0030017 | sarcomere(GO:0030017) |
| 0.0 | 2.9 | GO:0031225 | anchored component of membrane(GO:0031225) |
| 0.0 | 1.3 | GO:0005604 | basement membrane(GO:0005604) |
| 0.0 | 0.6 | GO:0005811 | lipid particle(GO:0005811) |
| 0.0 | 1.5 | GO:0005911 | cell-cell junction(GO:0005911) |
| 0.0 | 0.5 | GO:0098636 | protein complex involved in cell adhesion(GO:0098636) |
| 0.0 | 1.5 | GO:0030672 | synaptic vesicle membrane(GO:0030672) exocytic vesicle membrane(GO:0099501) |
| 0.0 | 0.3 | GO:0001533 | cornified envelope(GO:0001533) |
| 0.0 | 0.6 | GO:0035327 | transcriptionally active chromatin(GO:0035327) |
| 0.0 | 2.7 | GO:0045111 | intermediate filament cytoskeleton(GO:0045111) |
| 0.0 | 3.9 | GO:0005578 | proteinaceous extracellular matrix(GO:0005578) |
| 0.0 | 1.5 | GO:0008076 | voltage-gated potassium channel complex(GO:0008076) potassium channel complex(GO:0034705) |
| 0.0 | 0.6 | GO:0031012 | extracellular matrix(GO:0031012) |
| 0.0 | 0.6 | GO:0000118 | histone deacetylase complex(GO:0000118) |
| 0.0 | 17.0 | GO:0005856 | cytoskeleton(GO:0005856) |
| 0.0 | 0.1 | GO:0016010 | dystrophin-associated glycoprotein complex(GO:0016010) glycoprotein complex(GO:0090665) |
| 0.0 | 0.4 | GO:0070821 | tertiary granule membrane(GO:0070821) |
| 0.0 | 1.4 | GO:0005929 | cilium(GO:0005929) |
Gene overrepresentation in molecular_function category:
| Log-likelihood per target | Total log-likelihood | Term | Description |
|---|---|---|---|
| 41.6 | 124.7 | GO:0004821 | histidine-tRNA ligase activity(GO:0004821) |
| 27.5 | 82.4 | GO:0004582 | dolichyl-phosphate beta-D-mannosyltransferase activity(GO:0004582) |
| 18.4 | 55.3 | GO:0004045 | aminoacyl-tRNA hydrolase activity(GO:0004045) |
| 17.6 | 52.7 | GO:0004345 | glucose-6-phosphate dehydrogenase activity(GO:0004345) |
| 14.6 | 160.3 | GO:0036402 | proteasome-activating ATPase activity(GO:0036402) |
| 13.6 | 95.3 | GO:0035614 | snRNA stem-loop binding(GO:0035614) |
| 13.4 | 93.5 | GO:0061575 | cyclin-dependent protein serine/threonine kinase activator activity(GO:0061575) |
| 12.3 | 37.0 | GO:0034038 | deoxyhypusine synthase activity(GO:0034038) |
| 12.2 | 48.6 | GO:0032217 | riboflavin transporter activity(GO:0032217) |
| 12.0 | 36.1 | GO:0035539 | 8-oxo-7,8-dihydroguanosine triphosphate pyrophosphatase activity(GO:0008413) 8-oxo-7,8-dihydrodeoxyguanosine triphosphate pyrophosphatase activity(GO:0035539) |
| 10.5 | 52.3 | GO:0000179 | rRNA (adenine-N6,N6-)-dimethyltransferase activity(GO:0000179) |
| 10.2 | 30.6 | GO:0051538 | 3 iron, 4 sulfur cluster binding(GO:0051538) |
| 9.8 | 29.4 | GO:0004814 | arginine-tRNA ligase activity(GO:0004814) |
| 9.4 | 47.2 | GO:0008079 | translation release factor activity(GO:0003747) translation termination factor activity(GO:0008079) |
| 9.4 | 46.9 | GO:0043023 | ribosomal large subunit binding(GO:0043023) |
| 8.9 | 89.4 | GO:0004579 | dolichyl-diphosphooligosaccharide-protein glycotransferase activity(GO:0004579) |
| 8.2 | 32.8 | GO:0004307 | ethanolaminephosphotransferase activity(GO:0004307) |
| 8.0 | 39.9 | GO:0061676 | importin-alpha family protein binding(GO:0061676) |
| 8.0 | 39.8 | GO:0033857 | diphosphoinositol-pentakisphosphate kinase activity(GO:0033857) |
| 7.6 | 38.1 | GO:0030942 | endoplasmic reticulum signal peptide binding(GO:0030942) |
| 7.6 | 68.3 | GO:0035174 | histone serine kinase activity(GO:0035174) |
| 7.2 | 35.9 | GO:0015140 | malate transmembrane transporter activity(GO:0015140) |
| 7.2 | 28.7 | GO:0052827 | inositol pentakisphosphate phosphatase activity(GO:0052827) |
| 7.1 | 49.9 | GO:0008121 | ubiquinol-cytochrome-c reductase activity(GO:0008121) oxidoreductase activity, acting on diphenols and related substances as donors, cytochrome as acceptor(GO:0016681) |
| 7.0 | 27.9 | GO:0016748 | succinyltransferase activity(GO:0016748) |
| 6.5 | 19.4 | GO:0003980 | UDP-glucose:glycoprotein glucosyltransferase activity(GO:0003980) |
| 6.4 | 19.2 | GO:0008475 | procollagen-lysine 5-dioxygenase activity(GO:0008475) procollagen glucosyltransferase activity(GO:0033823) procollagen galactosyltransferase activity(GO:0050211) |
| 6.0 | 35.9 | GO:0048408 | epidermal growth factor binding(GO:0048408) |
| 6.0 | 17.9 | GO:0015230 | FAD transmembrane transporter activity(GO:0015230) |
| 5.8 | 40.6 | GO:0003689 | DNA clamp loader activity(GO:0003689) protein-DNA loading ATPase activity(GO:0033170) |
| 5.8 | 17.3 | GO:0016309 | 1-phosphatidylinositol-5-phosphate 4-kinase activity(GO:0016309) |
| 5.7 | 17.2 | GO:0030984 | kininogen binding(GO:0030984) |
| 5.7 | 34.2 | GO:0016531 | copper chaperone activity(GO:0016531) |
| 5.6 | 56.5 | GO:0015450 | P-P-bond-hydrolysis-driven protein transmembrane transporter activity(GO:0015450) |
| 5.5 | 22.1 | GO:0015142 | citrate transmembrane transporter activity(GO:0015137) tricarboxylic acid transmembrane transporter activity(GO:0015142) |
| 5.5 | 33.0 | GO:1990446 | U1 snRNP binding(GO:1990446) |
| 5.5 | 43.9 | GO:0098599 | palmitoyl-(protein) hydrolase activity(GO:0008474) palmitoyl hydrolase activity(GO:0098599) |
| 5.5 | 32.9 | GO:0003920 | GMP reductase activity(GO:0003920) oxidoreductase activity, acting on NAD(P)H, nitrogenous group as acceptor(GO:0016657) |
| 5.4 | 124.4 | GO:0008353 | RNA polymerase II carboxy-terminal domain kinase activity(GO:0008353) |
| 5.3 | 31.8 | GO:0044388 | small protein activating enzyme binding(GO:0044388) |
| 5.3 | 15.9 | GO:0000033 | alpha-1,3-mannosyltransferase activity(GO:0000033) |
| 5.3 | 26.4 | GO:0071208 | histone pre-mRNA DCP binding(GO:0071208) |
| 4.9 | 29.5 | GO:1901612 | cardiolipin binding(GO:1901612) |
| 4.8 | 33.6 | GO:0061133 | endopeptidase activator activity(GO:0061133) |
| 4.7 | 23.6 | GO:0030060 | L-malate dehydrogenase activity(GO:0030060) |
| 4.7 | 111.9 | GO:0008327 | methyl-CpG binding(GO:0008327) |
| 4.6 | 101.5 | GO:0000339 | RNA cap binding(GO:0000339) |
| 4.6 | 95.9 | GO:0004550 | nucleoside diphosphate kinase activity(GO:0004550) |
| 4.4 | 232.9 | GO:0005154 | epidermal growth factor receptor binding(GO:0005154) |
| 4.4 | 48.3 | GO:0004679 | AMP-activated protein kinase activity(GO:0004679) |
| 4.2 | 34.0 | GO:0032050 | clathrin heavy chain binding(GO:0032050) |
| 4.2 | 75.2 | GO:0001054 | RNA polymerase I activity(GO:0001054) |
| 4.1 | 87.0 | GO:0098748 | clathrin adaptor activity(GO:0035615) endocytic adaptor activity(GO:0098748) |
| 4.1 | 78.3 | GO:0070273 | phosphatidylinositol-4-phosphate binding(GO:0070273) |
| 4.1 | 24.5 | GO:0034513 | box H/ACA snoRNA binding(GO:0034513) |
| 4.0 | 11.9 | GO:0016731 | ferredoxin-NADP+ reductase activity(GO:0004324) NADPH-adrenodoxin reductase activity(GO:0015039) oxidoreductase activity, acting on iron-sulfur proteins as donors(GO:0016730) oxidoreductase activity, acting on iron-sulfur proteins as donors, NAD or NADP as acceptor(GO:0016731) |
| 3.9 | 23.2 | GO:0070739 | protein-glutamic acid ligase activity(GO:0070739) |
| 3.8 | 26.9 | GO:0050815 | phosphoserine binding(GO:0050815) |
| 3.7 | 33.6 | GO:0008158 | hedgehog receptor activity(GO:0008158) |
| 3.7 | 73.1 | GO:0070628 | proteasome binding(GO:0070628) |
| 3.6 | 10.9 | GO:0008310 | single-stranded DNA 3'-5' exodeoxyribonuclease activity(GO:0008310) |
| 3.5 | 14.0 | GO:0033743 | peptide-methionine (R)-S-oxide reductase activity(GO:0033743) |
| 3.4 | 3.4 | GO:0004677 | DNA-dependent protein kinase activity(GO:0004677) |
| 3.4 | 50.7 | GO:0019707 | protein-cysteine S-palmitoyltransferase activity(GO:0019706) protein-cysteine S-acyltransferase activity(GO:0019707) |
| 3.4 | 124.1 | GO:0000175 | 3'-5'-exoribonuclease activity(GO:0000175) |
| 3.3 | 16.6 | GO:0047374 | methylumbelliferyl-acetate deacetylase activity(GO:0047374) |
| 3.3 | 13.2 | GO:1990190 | peptide-glutamate-N-acetyltransferase activity(GO:1990190) |
| 3.2 | 171.2 | GO:0050136 | NADH dehydrogenase (ubiquinone) activity(GO:0008137) NADH dehydrogenase (quinone) activity(GO:0050136) |
| 3.2 | 19.2 | GO:0042296 | ISG15 transferase activity(GO:0042296) |
| 3.2 | 12.6 | GO:0070290 | N-acylphosphatidylethanolamine-specific phospholipase D activity(GO:0070290) |
| 3.1 | 21.5 | GO:1990599 | 3' overhang single-stranded DNA endodeoxyribonuclease activity(GO:1990599) |
| 3.0 | 105.8 | GO:0001671 | ATPase activator activity(GO:0001671) |
| 3.0 | 93.0 | GO:0008574 | ATP-dependent microtubule motor activity, plus-end-directed(GO:0008574) |
| 3.0 | 18.0 | GO:0010859 | calcium-dependent cysteine-type endopeptidase inhibitor activity(GO:0010859) |
| 3.0 | 23.8 | GO:0016846 | carbon-sulfur lyase activity(GO:0016846) |
| 3.0 | 14.8 | GO:0004656 | procollagen-proline 4-dioxygenase activity(GO:0004656) procollagen-proline dioxygenase activity(GO:0019798) |
| 2.9 | 23.2 | GO:0031543 | peptidyl-proline dioxygenase activity(GO:0031543) |
| 2.9 | 40.4 | GO:0034713 | type I transforming growth factor beta receptor binding(GO:0034713) |
| 2.9 | 14.3 | GO:0004830 | tryptophan-tRNA ligase activity(GO:0004830) |
| 2.8 | 14.2 | GO:0002046 | opsin binding(GO:0002046) |
| 2.8 | 11.2 | GO:0008508 | bile acid:sodium symporter activity(GO:0008508) |
| 2.8 | 11.2 | GO:0015319 | sodium:inorganic phosphate symporter activity(GO:0015319) |
| 2.8 | 83.7 | GO:0004298 | threonine-type endopeptidase activity(GO:0004298) threonine-type peptidase activity(GO:0070003) |
| 2.8 | 8.3 | GO:0004822 | isoleucine-tRNA ligase activity(GO:0004822) |
| 2.7 | 8.2 | GO:0034511 | U3 snoRNA binding(GO:0034511) |
| 2.7 | 16.2 | GO:0043141 | ATP-dependent 5'-3' DNA helicase activity(GO:0043141) |
| 2.7 | 10.7 | GO:0042500 | aspartic endopeptidase activity, intramembrane cleaving(GO:0042500) |
| 2.6 | 34.2 | GO:1990247 | N6-methyladenosine-containing RNA binding(GO:1990247) |
| 2.6 | 7.9 | GO:0004662 | CAAX-protein geranylgeranyltransferase activity(GO:0004662) |
| 2.6 | 96.0 | GO:0044183 | protein binding involved in protein folding(GO:0044183) |
| 2.5 | 10.1 | GO:0035473 | lipase binding(GO:0035473) |
| 2.5 | 7.6 | GO:0003923 | GPI-anchor transamidase activity(GO:0003923) |
| 2.5 | 10.0 | GO:0004826 | phenylalanine-tRNA ligase activity(GO:0004826) |
| 2.5 | 32.2 | GO:0004716 | receptor signaling protein tyrosine kinase activity(GO:0004716) |
| 2.4 | 24.1 | GO:0031386 | protein tag(GO:0031386) |
| 2.4 | 236.7 | GO:0008307 | structural constituent of muscle(GO:0008307) |
| 2.4 | 2.4 | GO:0016262 | protein N-acetylglucosaminyltransferase activity(GO:0016262) |
| 2.4 | 26.1 | GO:0008649 | rRNA methyltransferase activity(GO:0008649) |
| 2.4 | 23.5 | GO:0030911 | TPR domain binding(GO:0030911) |
| 2.3 | 2.3 | GO:0070990 | snRNP binding(GO:0070990) |
| 2.3 | 9.3 | GO:0034046 | poly(G) binding(GO:0034046) |
| 2.3 | 7.0 | GO:0042134 | rRNA primary transcript binding(GO:0042134) |
| 2.2 | 9.0 | GO:0005046 | KDEL sequence binding(GO:0005046) |
| 2.2 | 55.9 | GO:0005092 | GDP-dissociation inhibitor activity(GO:0005092) |
| 2.2 | 11.1 | GO:1990430 | extracellular matrix protein binding(GO:1990430) |
| 2.2 | 24.3 | GO:0046790 | virion binding(GO:0046790) |
| 2.2 | 6.6 | GO:0071566 | UFM1 activating enzyme activity(GO:0071566) |
| 2.1 | 4.2 | GO:0035529 | NADH pyrophosphatase activity(GO:0035529) |
| 2.1 | 6.3 | GO:0050510 | N-acetylgalactosaminyl-proteoglycan 3-beta-glucuronosyltransferase activity(GO:0050510) |
| 2.1 | 6.2 | GO:0033858 | N-acetylgalactosamine kinase activity(GO:0033858) |
| 2.1 | 8.3 | GO:0000702 | oxidized base lesion DNA N-glycosylase activity(GO:0000702) |
| 2.1 | 16.5 | GO:0004865 | protein serine/threonine phosphatase inhibitor activity(GO:0004865) |
| 2.1 | 10.3 | GO:0016427 | tRNA (cytosine) methyltransferase activity(GO:0016427) |
| 2.0 | 38.7 | GO:0008093 | cytoskeletal adaptor activity(GO:0008093) |
| 2.0 | 76.3 | GO:0004864 | protein phosphatase inhibitor activity(GO:0004864) |
| 2.0 | 8.0 | GO:0004169 | dolichyl-phosphate-mannose-protein mannosyltransferase activity(GO:0004169) |
| 2.0 | 33.3 | GO:0003688 | DNA replication origin binding(GO:0003688) |
| 1.9 | 23.3 | GO:0016857 | racemase and epimerase activity, acting on carbohydrates and derivatives(GO:0016857) |
| 1.9 | 5.7 | GO:0019961 | interferon binding(GO:0019961) |
| 1.9 | 30.3 | GO:0017160 | Ral GTPase binding(GO:0017160) |
| 1.9 | 54.6 | GO:0005388 | calcium-transporting ATPase activity(GO:0005388) |
| 1.9 | 29.9 | GO:0004526 | ribonuclease P activity(GO:0004526) |
| 1.9 | 11.2 | GO:0036042 | long-chain fatty acyl-CoA binding(GO:0036042) |
| 1.9 | 29.7 | GO:0016783 | sulfurtransferase activity(GO:0016783) |
| 1.8 | 10.9 | GO:0051022 | GDP-dissociation inhibitor binding(GO:0051021) Rho GDP-dissociation inhibitor binding(GO:0051022) |
| 1.8 | 5.4 | GO:0030272 | 5-formyltetrahydrofolate cyclo-ligase activity(GO:0030272) |
| 1.8 | 5.3 | GO:0000104 | succinate dehydrogenase activity(GO:0000104) |
| 1.8 | 49.5 | GO:0016676 | cytochrome-c oxidase activity(GO:0004129) heme-copper terminal oxidase activity(GO:0015002) oxidoreductase activity, acting on a heme group of donors, oxygen as acceptor(GO:0016676) |
| 1.8 | 14.1 | GO:0005375 | copper ion transmembrane transporter activity(GO:0005375) |
| 1.7 | 27.8 | GO:0042809 | vitamin D receptor binding(GO:0042809) |
| 1.7 | 5.2 | GO:0004694 | eukaryotic translation initiation factor 2alpha kinase activity(GO:0004694) |
| 1.7 | 30.9 | GO:0005522 | profilin binding(GO:0005522) |
| 1.7 | 3.4 | GO:0016882 | cyclo-ligase activity(GO:0016882) |
| 1.7 | 18.5 | GO:0043047 | single-stranded telomeric DNA binding(GO:0043047) |
| 1.7 | 18.5 | GO:0032036 | myosin heavy chain binding(GO:0032036) |
| 1.7 | 6.7 | GO:0032810 | sterol response element binding(GO:0032810) |
| 1.7 | 5.0 | GO:0051377 | mannose-ethanolamine phosphotransferase activity(GO:0051377) |
| 1.7 | 1.7 | GO:0004576 | oligosaccharyl transferase activity(GO:0004576) |
| 1.7 | 5.0 | GO:0005150 | interleukin-1, Type I receptor binding(GO:0005150) |
| 1.6 | 6.6 | GO:0008889 | glycerophosphodiester phosphodiesterase activity(GO:0008889) |
| 1.6 | 11.4 | GO:0035005 | 1-phosphatidylinositol-4-phosphate 3-kinase activity(GO:0035005) |
| 1.6 | 16.2 | GO:0017176 | phosphatidylinositol N-acetylglucosaminyltransferase activity(GO:0017176) |
| 1.6 | 116.0 | GO:0019003 | GDP binding(GO:0019003) |
| 1.6 | 4.8 | GO:0005457 | GDP-fucose transmembrane transporter activity(GO:0005457) purine nucleotide-sugar transmembrane transporter activity(GO:0036080) |
| 1.6 | 11.2 | GO:0005087 | Ran guanyl-nucleotide exchange factor activity(GO:0005087) |
| 1.6 | 6.3 | GO:0005166 | neurotrophin p75 receptor binding(GO:0005166) |
| 1.6 | 20.3 | GO:0031489 | myosin V binding(GO:0031489) |
| 1.6 | 3.1 | GO:0001034 | RNA polymerase III transcription factor activity, sequence-specific DNA binding(GO:0001034) |
| 1.6 | 18.6 | GO:0000774 | adenyl-nucleotide exchange factor activity(GO:0000774) |
| 1.6 | 18.6 | GO:0030515 | snoRNA binding(GO:0030515) |
| 1.5 | 12.3 | GO:0003993 | acid phosphatase activity(GO:0003993) |
| 1.5 | 47.8 | GO:0016538 | cyclin-dependent protein serine/threonine kinase regulator activity(GO:0016538) |
| 1.5 | 43.5 | GO:0017056 | structural constituent of nuclear pore(GO:0017056) |
| 1.5 | 23.9 | GO:0070513 | death domain binding(GO:0070513) |
| 1.5 | 4.4 | GO:0004523 | RNA-DNA hybrid ribonuclease activity(GO:0004523) |
| 1.5 | 7.4 | GO:0047179 | platelet-activating factor acetyltransferase activity(GO:0047179) |
| 1.5 | 19.2 | GO:0004985 | opioid receptor activity(GO:0004985) |
| 1.5 | 126.9 | GO:0051082 | unfolded protein binding(GO:0051082) |
| 1.4 | 8.6 | GO:0060698 | endoribonuclease inhibitor activity(GO:0060698) |
| 1.4 | 4.3 | GO:0003684 | damaged DNA binding(GO:0003684) |
| 1.4 | 5.4 | GO:0030620 | U2 snRNA binding(GO:0030620) |
| 1.3 | 86.2 | GO:0003743 | translation initiation factor activity(GO:0003743) |
| 1.3 | 14.8 | GO:0004030 | aldehyde dehydrogenase [NAD(P)+] activity(GO:0004030) |
| 1.3 | 5.3 | GO:0008479 | queuine tRNA-ribosyltransferase activity(GO:0008479) |
| 1.3 | 18.6 | GO:0008170 | N-methyltransferase activity(GO:0008170) |
| 1.3 | 7.9 | GO:0008553 | hydrogen-exporting ATPase activity, phosphorylative mechanism(GO:0008553) |
| 1.3 | 25.1 | GO:0097602 | cullin family protein binding(GO:0097602) |
| 1.3 | 7.9 | GO:0019136 | deoxynucleoside kinase activity(GO:0019136) |
| 1.3 | 14.3 | GO:0016290 | palmitoyl-CoA hydrolase activity(GO:0016290) |
| 1.3 | 2.6 | GO:0001129 | RNA polymerase II transcription factor activity, TBP-class protein binding, involved in preinitiation complex assembly(GO:0001129) RNA polymerase II transcription factor activity, TBP-class protein binding(GO:0001132) |
| 1.3 | 1.3 | GO:0051185 | coenzyme transporter activity(GO:0051185) |
| 1.3 | 66.8 | GO:0030374 | ligand-dependent nuclear receptor transcription coactivator activity(GO:0030374) |
| 1.2 | 64.6 | GO:0017112 | Rab guanyl-nucleotide exchange factor activity(GO:0017112) |
| 1.2 | 27.8 | GO:0070008 | serine-type exopeptidase activity(GO:0070008) |
| 1.2 | 14.4 | GO:0008603 | cAMP-dependent protein kinase regulator activity(GO:0008603) |
| 1.2 | 4.7 | GO:0004549 | tRNA-specific ribonuclease activity(GO:0004549) |
| 1.2 | 10.5 | GO:0030346 | protein phosphatase 2B binding(GO:0030346) |
| 1.2 | 2.3 | GO:0055104 | ligase inhibitor activity(GO:0055104) ubiquitin ligase inhibitor activity(GO:1990948) |
| 1.2 | 20.8 | GO:0043495 | protein anchor(GO:0043495) |
| 1.1 | 3.4 | GO:0046921 | glycoprotein 6-alpha-L-fucosyltransferase activity(GO:0008424) alpha-(1->6)-fucosyltransferase activity(GO:0046921) |
| 1.1 | 31.2 | GO:0008139 | nuclear localization sequence binding(GO:0008139) |
| 1.1 | 2.2 | GO:0004661 | protein geranylgeranyltransferase activity(GO:0004661) Rab geranylgeranyltransferase activity(GO:0004663) |
| 1.1 | 2.2 | GO:0050220 | prostaglandin-E synthase activity(GO:0050220) |
| 1.1 | 17.7 | GO:0005537 | mannose binding(GO:0005537) |
| 1.1 | 13.8 | GO:0016018 | cyclosporin A binding(GO:0016018) |
| 1.1 | 3.2 | GO:0043142 | single-stranded DNA-dependent ATPase activity(GO:0043142) |
| 1.1 | 5.3 | GO:0004105 | choline-phosphate cytidylyltransferase activity(GO:0004105) |
| 1.1 | 8.4 | GO:0071933 | Arp2/3 complex binding(GO:0071933) |
| 1.0 | 3.1 | GO:0016603 | glutaminyl-peptide cyclotransferase activity(GO:0016603) |
| 1.0 | 43.6 | GO:0001103 | RNA polymerase II repressing transcription factor binding(GO:0001103) |
| 1.0 | 4.1 | GO:0097100 | oxidized DNA binding(GO:0032356) oxidized purine DNA binding(GO:0032357) supercoiled DNA binding(GO:0097100) |
| 1.0 | 3.1 | GO:0004382 | guanosine-diphosphatase activity(GO:0004382) |
| 1.0 | 7.2 | GO:0019784 | NEDD8-specific protease activity(GO:0019784) |
| 1.0 | 6.2 | GO:0004614 | phosphoglucomutase activity(GO:0004614) |
| 1.0 | 12.2 | GO:0008143 | poly(A) binding(GO:0008143) |
| 1.0 | 13.2 | GO:0008179 | adenylate cyclase binding(GO:0008179) |
| 1.0 | 2.0 | GO:0004515 | nicotinate-nucleotide adenylyltransferase activity(GO:0004515) |
| 1.0 | 11.9 | GO:0045505 | dynein intermediate chain binding(GO:0045505) |
| 1.0 | 7.9 | GO:0005049 | nuclear export signal receptor activity(GO:0005049) |
| 1.0 | 9.8 | GO:0001055 | RNA polymerase II activity(GO:0001055) |
| 1.0 | 3.9 | GO:0033906 | protein tyrosine kinase inhibitor activity(GO:0030292) hyaluronoglucuronidase activity(GO:0033906) |
| 1.0 | 4.8 | GO:0016717 | oxidoreductase activity, acting on paired donors, with oxidation of a pair of donors resulting in the reduction of molecular oxygen to two molecules of water(GO:0016717) |
| 1.0 | 4.8 | GO:0010858 | calcium-dependent protein kinase regulator activity(GO:0010858) |
| 0.9 | 12.3 | GO:0052629 | phosphatidylinositol-3,5-bisphosphate 3-phosphatase activity(GO:0052629) |
| 0.9 | 22.3 | GO:0070577 | lysine-acetylated histone binding(GO:0070577) |
| 0.9 | 13.0 | GO:0019966 | interleukin-1 binding(GO:0019966) |
| 0.9 | 70.9 | GO:0015078 | hydrogen ion transmembrane transporter activity(GO:0015078) |
| 0.9 | 11.0 | GO:0019870 | potassium channel inhibitor activity(GO:0019870) |
| 0.9 | 1.8 | GO:0008384 | IkappaB kinase activity(GO:0008384) |
| 0.9 | 79.6 | GO:0001104 | RNA polymerase II transcription cofactor activity(GO:0001104) |
| 0.9 | 87.6 | GO:0003697 | single-stranded DNA binding(GO:0003697) |
| 0.9 | 40.4 | GO:0004527 | exonuclease activity(GO:0004527) |
| 0.9 | 26.8 | GO:0017091 | AU-rich element binding(GO:0017091) |
| 0.9 | 6.2 | GO:0008109 | N-acetyllactosaminide beta-1,6-N-acetylglucosaminyltransferase activity(GO:0008109) |
| 0.9 | 7.0 | GO:0043008 | ATP-dependent protein binding(GO:0043008) |
| 0.9 | 62.8 | GO:0008565 | protein transporter activity(GO:0008565) |
| 0.9 | 41.7 | GO:0031491 | nucleosome binding(GO:0031491) |
| 0.9 | 19.9 | GO:0017025 | TBP-class protein binding(GO:0017025) |
| 0.9 | 30.3 | GO:0003785 | actin monomer binding(GO:0003785) |
| 0.8 | 10.2 | GO:0017049 | GTP-Rho binding(GO:0017049) |
| 0.8 | 9.2 | GO:0047760 | butyrate-CoA ligase activity(GO:0047760) |
| 0.8 | 8.2 | GO:0016312 | inositol bisphosphate phosphatase activity(GO:0016312) |
| 0.8 | 15.6 | GO:0005385 | zinc ion transmembrane transporter activity(GO:0005385) |
| 0.8 | 6.5 | GO:0009982 | pseudouridine synthase activity(GO:0009982) |
| 0.8 | 23.4 | GO:0048306 | calcium-dependent protein binding(GO:0048306) |
| 0.8 | 7.2 | GO:0051400 | BH domain binding(GO:0051400) |
| 0.8 | 3.1 | GO:0030337 | DNA polymerase processivity factor activity(GO:0030337) |
| 0.8 | 262.3 | GO:0005525 | GTP binding(GO:0005525) |
| 0.8 | 2.3 | GO:0098518 | polynucleotide phosphatase activity(GO:0098518) |
| 0.8 | 58.8 | GO:0016765 | transferase activity, transferring alkyl or aryl (other than methyl) groups(GO:0016765) |
| 0.7 | 16.5 | GO:0008242 | omega peptidase activity(GO:0008242) |
| 0.7 | 3.7 | GO:0010340 | carboxyl-O-methyltransferase activity(GO:0010340) protein carboxyl O-methyltransferase activity(GO:0051998) |
| 0.7 | 3.0 | GO:0004449 | isocitrate dehydrogenase (NAD+) activity(GO:0004449) |
| 0.7 | 3.7 | GO:0097016 | L27 domain binding(GO:0097016) |
| 0.7 | 2.2 | GO:0031731 | CCR6 chemokine receptor binding(GO:0031731) |
| 0.7 | 5.1 | GO:0000268 | peroxisome targeting sequence binding(GO:0000268) |
| 0.7 | 18.3 | GO:0098641 | cadherin binding involved in cell-cell adhesion(GO:0098641) |
| 0.7 | 2.9 | GO:0022865 | transmembrane electron transfer carrier(GO:0022865) |
| 0.7 | 28.9 | GO:0003777 | microtubule motor activity(GO:0003777) |
| 0.7 | 42.5 | GO:0008235 | metalloexopeptidase activity(GO:0008235) |
| 0.7 | 8.1 | GO:0035256 | G-protein coupled glutamate receptor binding(GO:0035256) |
| 0.7 | 2.7 | GO:0015232 | heme transporter activity(GO:0015232) |
| 0.7 | 4.0 | GO:0008046 | axon guidance receptor activity(GO:0008046) |
| 0.7 | 3.3 | GO:0004925 | prolactin receptor activity(GO:0004925) |
| 0.7 | 5.9 | GO:0043422 | protein kinase B binding(GO:0043422) |
| 0.6 | 4.5 | GO:0004704 | NF-kappaB-inducing kinase activity(GO:0004704) |
| 0.6 | 2.6 | GO:0005471 | ATP:ADP antiporter activity(GO:0005471) adenine transmembrane transporter activity(GO:0015207) |
| 0.6 | 10.1 | GO:0043021 | ribonucleoprotein complex binding(GO:0043021) |
| 0.6 | 5.0 | GO:0008559 | xenobiotic-transporting ATPase activity(GO:0008559) |
| 0.6 | 8.6 | GO:0031014 | troponin T binding(GO:0031014) |
| 0.6 | 4.8 | GO:0035173 | histone kinase activity(GO:0035173) |
| 0.6 | 8.9 | GO:0033130 | acetylcholine receptor binding(GO:0033130) |
| 0.6 | 0.6 | GO:0051731 | ATP-dependent polydeoxyribonucleotide 5'-hydroxyl-kinase activity(GO:0046404) polynucleotide 5'-hydroxyl-kinase activity(GO:0051731) polydeoxyribonucleotide kinase activity(GO:0051733) ATP-dependent polynucleotide kinase activity(GO:0051734) |
| 0.6 | 21.6 | GO:0005546 | phosphatidylinositol-4,5-bisphosphate binding(GO:0005546) |
| 0.6 | 1.7 | GO:0070679 | inositol 1,4,5 trisphosphate binding(GO:0070679) |
| 0.6 | 5.8 | GO:0070182 | DNA polymerase binding(GO:0070182) |
| 0.6 | 2.3 | GO:0016972 | flavin-linked sulfhydryl oxidase activity(GO:0016971) thiol oxidase activity(GO:0016972) |
| 0.6 | 10.7 | GO:0016500 | protein-hormone receptor activity(GO:0016500) |
| 0.6 | 3.9 | GO:1990459 | transferrin receptor binding(GO:1990459) |
| 0.6 | 3.9 | GO:0052739 | phosphatidylserine 1-acylhydrolase activity(GO:0052739) |
| 0.6 | 2.8 | GO:0008607 | phosphorylase kinase regulator activity(GO:0008607) |
| 0.5 | 3.8 | GO:0001162 | RNA polymerase II intronic transcription regulatory region sequence-specific DNA binding(GO:0001162) |
| 0.5 | 4.9 | GO:0001056 | RNA polymerase III activity(GO:0001056) |
| 0.5 | 8.2 | GO:0004653 | polypeptide N-acetylgalactosaminyltransferase activity(GO:0004653) |
| 0.5 | 2.7 | GO:0030628 | pre-mRNA 3'-splice site binding(GO:0030628) |
| 0.5 | 1.1 | GO:0051373 | FATZ binding(GO:0051373) |
| 0.5 | 22.1 | GO:0061650 | ubiquitin conjugating enzyme activity(GO:0061631) ubiquitin-like protein conjugating enzyme activity(GO:0061650) |
| 0.5 | 0.5 | GO:0019826 | oxygen sensor activity(GO:0019826) |
| 0.5 | 55.1 | GO:0005070 | SH3/SH2 adaptor activity(GO:0005070) |
| 0.5 | 11.1 | GO:0042171 | 1-acylglycerol-3-phosphate O-acyltransferase activity(GO:0003841) lysophosphatidic acid acyltransferase activity(GO:0042171) lysophospholipid acyltransferase activity(GO:0071617) |
| 0.5 | 2.5 | GO:0047134 | protein-disulfide reductase activity(GO:0047134) |
| 0.5 | 3.0 | GO:0004634 | phosphopyruvate hydratase activity(GO:0004634) |
| 0.5 | 7.5 | GO:0015037 | peptide disulfide oxidoreductase activity(GO:0015037) |
| 0.5 | 5.5 | GO:0101005 | thiol-dependent ubiquitinyl hydrolase activity(GO:0036459) ubiquitinyl hydrolase activity(GO:0101005) |
| 0.5 | 3.0 | GO:0005487 | nucleocytoplasmic transporter activity(GO:0005487) |
| 0.5 | 1.5 | GO:0004157 | dihydropyrimidinase activity(GO:0004157) |
| 0.5 | 3.9 | GO:0046966 | thyroid hormone receptor binding(GO:0046966) |
| 0.5 | 2.5 | GO:0047237 | glucuronylgalactosylproteoglycan 4-beta-N-acetylgalactosaminyltransferase activity(GO:0047237) |
| 0.5 | 11.2 | GO:0031210 | phosphatidylcholine binding(GO:0031210) |
| 0.5 | 9.0 | GO:0048365 | Rac GTPase binding(GO:0048365) |
| 0.5 | 4.3 | GO:0015129 | lactate transmembrane transporter activity(GO:0015129) |
| 0.5 | 10.6 | GO:0008191 | metalloendopeptidase inhibitor activity(GO:0008191) |
| 0.5 | 5.5 | GO:0022889 | L-serine transmembrane transporter activity(GO:0015194) serine transmembrane transporter activity(GO:0022889) |
| 0.5 | 3.7 | GO:0004064 | arylesterase activity(GO:0004064) |
| 0.5 | 0.5 | GO:0016781 | selenide, water dikinase activity(GO:0004756) phosphotransferase activity, paired acceptors(GO:0016781) |
| 0.5 | 6.8 | GO:0008140 | cAMP response element binding protein binding(GO:0008140) |
| 0.5 | 5.0 | GO:0097027 | ubiquitin-protein transferase activator activity(GO:0097027) |
| 0.4 | 53.7 | GO:0005262 | calcium channel activity(GO:0005262) |
| 0.4 | 39.8 | GO:0019905 | syntaxin binding(GO:0019905) |
| 0.4 | 15.2 | GO:0017134 | fibroblast growth factor binding(GO:0017134) |
| 0.4 | 47.1 | GO:0004867 | serine-type endopeptidase inhibitor activity(GO:0004867) |
| 0.4 | 14.2 | GO:0000049 | tRNA binding(GO:0000049) |
| 0.4 | 10.2 | GO:0005527 | macrolide binding(GO:0005527) FK506 binding(GO:0005528) |
| 0.4 | 23.9 | GO:0015399 | primary active transmembrane transporter activity(GO:0015399) P-P-bond-hydrolysis-driven transmembrane transporter activity(GO:0015405) ATPase activity, coupled to transmembrane movement of substances(GO:0042626) |
| 0.4 | 4.8 | GO:0016866 | intramolecular transferase activity(GO:0016866) |
| 0.4 | 7.7 | GO:1905030 | voltage-gated sodium channel activity(GO:0005248) voltage-gated ion channel activity involved in regulation of postsynaptic membrane potential(GO:1905030) |
| 0.4 | 4.7 | GO:0042975 | peroxisome proliferator activated receptor binding(GO:0042975) |
| 0.4 | 6.4 | GO:0070034 | telomerase RNA binding(GO:0070034) |
| 0.4 | 5.1 | GO:0051537 | 2 iron, 2 sulfur cluster binding(GO:0051537) |
| 0.4 | 4.5 | GO:0004332 | fructose-bisphosphate aldolase activity(GO:0004332) |
| 0.4 | 1.6 | GO:0060002 | plus-end directed microfilament motor activity(GO:0060002) |
| 0.4 | 8.1 | GO:0016702 | oxidoreductase activity, acting on single donors with incorporation of molecular oxygen, incorporation of two atoms of oxygen(GO:0016702) |
| 0.4 | 2.0 | GO:0016453 | C-acetyltransferase activity(GO:0016453) |
| 0.4 | 2.0 | GO:0004839 | ubiquitin activating enzyme activity(GO:0004839) |
| 0.4 | 2.4 | GO:0019776 | Atg8 ligase activity(GO:0019776) |
| 0.4 | 0.4 | GO:0004004 | ATP-dependent RNA helicase activity(GO:0004004) RNA-dependent ATPase activity(GO:0008186) |
| 0.4 | 1.2 | GO:0050501 | hyaluronan synthase activity(GO:0050501) |
| 0.4 | 1.2 | GO:0003865 | 3-oxo-5-alpha-steroid 4-dehydrogenase activity(GO:0003865) steroid dehydrogenase activity, acting on the CH-CH group of donors(GO:0033765) cholestenone 5-alpha-reductase activity(GO:0047751) |
| 0.4 | 1.9 | GO:0004647 | phosphoserine phosphatase activity(GO:0004647) |
| 0.4 | 40.4 | GO:0047485 | protein N-terminus binding(GO:0047485) |
| 0.4 | 9.1 | GO:0031624 | ubiquitin conjugating enzyme binding(GO:0031624) |
| 0.4 | 11.6 | GO:0005520 | insulin-like growth factor binding(GO:0005520) |
| 0.4 | 4.6 | GO:0017166 | vinculin binding(GO:0017166) |
| 0.4 | 1.1 | GO:0017130 | poly(C) RNA binding(GO:0017130) |
| 0.3 | 6.9 | GO:0022848 | acetylcholine-gated cation channel activity(GO:0022848) |
| 0.3 | 14.6 | GO:0045182 | translation regulator activity(GO:0045182) |
| 0.3 | 0.6 | GO:0070363 | mitochondrial light strand promoter sense binding(GO:0070363) |
| 0.3 | 9.7 | GO:0005031 | tumor necrosis factor-activated receptor activity(GO:0005031) death receptor activity(GO:0005035) |
| 0.3 | 3.7 | GO:0031593 | polyubiquitin binding(GO:0031593) |
| 0.3 | 4.3 | GO:0005243 | gap junction channel activity(GO:0005243) |
| 0.3 | 2.7 | GO:0060229 | phospholipase activator activity(GO:0016004) lipase activator activity(GO:0060229) |
| 0.3 | 106.5 | GO:0019787 | ubiquitin-like protein transferase activity(GO:0019787) |
| 0.3 | 91.5 | GO:0045296 | cadherin binding(GO:0045296) |
| 0.3 | 2.0 | GO:0046975 | histone methyltransferase activity (H3-K36 specific)(GO:0046975) |
| 0.3 | 9.1 | GO:0000149 | SNARE binding(GO:0000149) |
| 0.3 | 52.6 | GO:0003735 | structural constituent of ribosome(GO:0003735) |
| 0.3 | 17.5 | GO:0009055 | electron carrier activity(GO:0009055) |
| 0.3 | 3.5 | GO:0030898 | actin-dependent ATPase activity(GO:0030898) |
| 0.3 | 2.1 | GO:0016891 | endoribonuclease activity, producing 5'-phosphomonoesters(GO:0016891) |
| 0.3 | 1.3 | GO:0004945 | angiotensin receptor activity(GO:0001595) angiotensin type II receptor activity(GO:0004945) |
| 0.3 | 4.6 | GO:0033612 | receptor serine/threonine kinase binding(GO:0033612) |
| 0.3 | 1.5 | GO:0008568 | microtubule-severing ATPase activity(GO:0008568) |
| 0.2 | 7.5 | GO:0001972 | retinoic acid binding(GO:0001972) |
| 0.2 | 9.9 | GO:0008138 | protein tyrosine/serine/threonine phosphatase activity(GO:0008138) |
| 0.2 | 1.1 | GO:0032795 | heterotrimeric G-protein binding(GO:0032795) |
| 0.2 | 3.1 | GO:0043015 | gamma-tubulin binding(GO:0043015) |
| 0.2 | 1.3 | GO:0003998 | acylphosphatase activity(GO:0003998) |
| 0.2 | 1.1 | GO:0016273 | arginine N-methyltransferase activity(GO:0016273) protein-arginine N-methyltransferase activity(GO:0016274) |
| 0.2 | 1.7 | GO:0004726 | non-membrane spanning protein tyrosine phosphatase activity(GO:0004726) |
| 0.2 | 0.4 | GO:0000386 | second spliceosomal transesterification activity(GO:0000386) |
| 0.2 | 0.6 | GO:0002113 | interleukin-33 binding(GO:0002113) |
| 0.2 | 5.3 | GO:0004709 | MAP kinase kinase kinase activity(GO:0004709) |
| 0.2 | 10.5 | GO:0008276 | protein methyltransferase activity(GO:0008276) |
| 0.2 | 5.2 | GO:0047555 | 3',5'-cyclic-GMP phosphodiesterase activity(GO:0047555) |
| 0.2 | 1.5 | GO:0005452 | inorganic anion exchanger activity(GO:0005452) |
| 0.2 | 4.1 | GO:0004115 | 3',5'-cyclic-AMP phosphodiesterase activity(GO:0004115) |
| 0.2 | 2.1 | GO:0030331 | estrogen receptor binding(GO:0030331) |
| 0.2 | 0.9 | GO:0039706 | co-receptor binding(GO:0039706) |
| 0.2 | 0.4 | GO:0048039 | ubiquinone binding(GO:0048039) |
| 0.2 | 0.6 | GO:0003958 | NADPH-hemoprotein reductase activity(GO:0003958) |
| 0.2 | 3.1 | GO:0000993 | RNA polymerase II core binding(GO:0000993) |
| 0.2 | 8.0 | GO:0000979 | RNA polymerase II core promoter sequence-specific DNA binding(GO:0000979) |
| 0.2 | 1.6 | GO:0015143 | urate transmembrane transporter activity(GO:0015143) salt transmembrane transporter activity(GO:1901702) |
| 0.2 | 3.4 | GO:0046875 | ephrin receptor binding(GO:0046875) |
| 0.2 | 1.4 | GO:0030742 | GTP-dependent protein binding(GO:0030742) |
| 0.2 | 11.0 | GO:0030165 | PDZ domain binding(GO:0030165) |
| 0.2 | 1.4 | GO:0034062 | DNA-directed RNA polymerase activity(GO:0003899) RNA polymerase activity(GO:0034062) |
| 0.2 | 5.6 | GO:0002039 | p53 binding(GO:0002039) |
| 0.2 | 0.8 | GO:0015204 | urea transmembrane transporter activity(GO:0015204) |
| 0.2 | 40.7 | GO:0046873 | metal ion transmembrane transporter activity(GO:0046873) |
| 0.2 | 9.2 | GO:0034212 | peptide N-acetyltransferase activity(GO:0034212) |
| 0.2 | 1.3 | GO:0005004 | GPI-linked ephrin receptor activity(GO:0005004) |
| 0.2 | 2.0 | GO:0051787 | misfolded protein binding(GO:0051787) |
| 0.2 | 20.2 | GO:0005179 | hormone activity(GO:0005179) |
| 0.2 | 11.4 | GO:0044325 | ion channel binding(GO:0044325) |
| 0.2 | 1.1 | GO:0004652 | polynucleotide adenylyltransferase activity(GO:0004652) |
| 0.1 | 1.8 | GO:0015248 | sterol transporter activity(GO:0015248) |
| 0.1 | 26.5 | GO:0004857 | enzyme inhibitor activity(GO:0004857) |
| 0.1 | 0.4 | GO:0004514 | nicotinate-nucleotide diphosphorylase (carboxylating) activity(GO:0004514) |
| 0.1 | 3.1 | GO:0042288 | MHC class I protein binding(GO:0042288) |
| 0.1 | 4.3 | GO:0019239 | deaminase activity(GO:0019239) |
| 0.1 | 1.4 | GO:0019841 | retinol binding(GO:0019841) |
| 0.1 | 3.5 | GO:0008329 | signaling pattern recognition receptor activity(GO:0008329) pattern recognition receptor activity(GO:0038187) |
| 0.1 | 4.2 | GO:0004407 | histone deacetylase activity(GO:0004407) |
| 0.1 | 0.5 | GO:0001609 | G-protein coupled adenosine receptor activity(GO:0001609) |
| 0.1 | 1.9 | GO:0005161 | platelet-derived growth factor receptor binding(GO:0005161) |
| 0.1 | 0.3 | GO:0004040 | amidase activity(GO:0004040) |
| 0.1 | 9.3 | GO:0005201 | extracellular matrix structural constituent(GO:0005201) |
| 0.1 | 0.4 | GO:0004758 | serine C-palmitoyltransferase activity(GO:0004758) C-palmitoyltransferase activity(GO:0016454) |
| 0.1 | 0.9 | GO:0043548 | phosphatidylinositol 3-kinase binding(GO:0043548) |
| 0.1 | 0.3 | GO:0070905 | serine binding(GO:0070905) |
| 0.1 | 1.6 | GO:0017151 | DEAD/H-box RNA helicase binding(GO:0017151) |
| 0.1 | 0.3 | GO:0015220 | choline transmembrane transporter activity(GO:0015220) |
| 0.1 | 65.8 | GO:0005509 | calcium ion binding(GO:0005509) |
| 0.1 | 1.7 | GO:0043531 | ADP binding(GO:0043531) |
| 0.1 | 0.1 | GO:0000995 | transcription factor activity, core RNA polymerase III binding(GO:0000995) |
| 0.1 | 1.8 | GO:0031005 | filamin binding(GO:0031005) |
| 0.1 | 0.6 | GO:0052655 | branched-chain-amino-acid transaminase activity(GO:0004084) L-leucine transaminase activity(GO:0052654) L-valine transaminase activity(GO:0052655) L-isoleucine transaminase activity(GO:0052656) |
| 0.1 | 2.3 | GO:0004806 | triglyceride lipase activity(GO:0004806) |
| 0.1 | 96.8 | GO:0003723 | RNA binding(GO:0003723) |
| 0.1 | 1.3 | GO:0035035 | histone acetyltransferase binding(GO:0035035) |
| 0.1 | 9.4 | GO:0015631 | tubulin binding(GO:0015631) |
| 0.1 | 0.3 | GO:0047275 | glucosaminylgalactosylglucosylceramide beta-galactosyltransferase activity(GO:0047275) |
| 0.1 | 0.3 | GO:0016401 | palmitoyl-CoA oxidase activity(GO:0016401) |
| 0.1 | 18.4 | GO:0004252 | serine-type endopeptidase activity(GO:0004252) |
| 0.1 | 0.2 | GO:0001165 | RNA polymerase I upstream control element sequence-specific DNA binding(GO:0001165) |
| 0.1 | 6.3 | GO:0035091 | phosphatidylinositol binding(GO:0035091) |
| 0.1 | 5.4 | GO:0016887 | ATPase activity(GO:0016887) |
| 0.1 | 2.3 | GO:0005507 | copper ion binding(GO:0005507) |
| 0.1 | 4.1 | GO:0051015 | actin filament binding(GO:0051015) |
| 0.1 | 0.7 | GO:0035381 | extracellular ATP-gated cation channel activity(GO:0004931) ATP-gated ion channel activity(GO:0035381) |
| 0.1 | 2.9 | GO:0016651 | oxidoreductase activity, acting on NAD(P)H(GO:0016651) |
| 0.1 | 0.3 | GO:0016499 | orexin receptor activity(GO:0016499) |
| 0.1 | 0.5 | GO:0005545 | 1-phosphatidylinositol binding(GO:0005545) |
| 0.1 | 1.0 | GO:0005212 | structural constituent of eye lens(GO:0005212) |
| 0.1 | 0.7 | GO:0043236 | laminin binding(GO:0043236) |
| 0.1 | 1.8 | GO:0003682 | chromatin binding(GO:0003682) |
| 0.1 | 0.4 | GO:0004969 | histamine receptor activity(GO:0004969) |
| 0.1 | 0.3 | GO:0003796 | lysozyme activity(GO:0003796) |
| 0.0 | 0.8 | GO:0098811 | transcriptional activator activity, RNA polymerase II transcription factor binding(GO:0001190) transcriptional repressor activity, RNA polymerase II activating transcription factor binding(GO:0098811) |
| 0.0 | 6.0 | GO:0001078 | transcriptional repressor activity, RNA polymerase II core promoter proximal region sequence-specific binding(GO:0001078) |
| 0.0 | 0.3 | GO:0000980 | RNA polymerase II distal enhancer sequence-specific DNA binding(GO:0000980) |
| 0.0 | 1.0 | GO:0005109 | frizzled binding(GO:0005109) |
| 0.0 | 0.7 | GO:0000981 | RNA polymerase II transcription factor activity, sequence-specific DNA binding(GO:0000981) |
| 0.0 | 0.2 | GO:0004331 | 6-phosphofructo-2-kinase activity(GO:0003873) fructose-2,6-bisphosphate 2-phosphatase activity(GO:0004331) |
| 0.0 | 1.5 | GO:0032947 | protein complex scaffold(GO:0032947) |
| 0.0 | 0.4 | GO:0048487 | beta-tubulin binding(GO:0048487) |
| 0.0 | 23.7 | GO:0042802 | identical protein binding(GO:0042802) |
| 0.0 | 0.6 | GO:0004708 | MAP kinase kinase activity(GO:0004708) |
| 0.0 | 0.3 | GO:0043395 | heparan sulfate proteoglycan binding(GO:0043395) |
| 0.0 | 2.3 | GO:0008237 | metallopeptidase activity(GO:0008237) |
| 0.0 | 4.3 | GO:0005198 | structural molecule activity(GO:0005198) |
| 0.0 | 0.1 | GO:0070840 | dynein complex binding(GO:0070840) |
| 0.0 | 0.0 | GO:0005005 | transmembrane-ephrin receptor activity(GO:0005005) |
| 0.0 | 0.1 | GO:0005041 | low-density lipoprotein receptor activity(GO:0005041) |
| 0.0 | 0.2 | GO:0004385 | guanylate kinase activity(GO:0004385) |
| 0.0 | 0.1 | GO:0051378 | amine binding(GO:0043176) serotonin binding(GO:0051378) |
Gene overrepresentation in C2:CP category:
| Log-likelihood per target | Total log-likelihood | Term | Description |
|---|---|---|---|
| 8.2 | 114.6 | SA G2 AND M PHASES | Cdc25 activates the cdc2/cyclin B complex to induce the G2/M transition. |
| 5.4 | 141.7 | PID ARF 3PATHWAY | Arf1 pathway |
| 3.1 | 130.5 | PID EPHA FWDPATHWAY | EPHA forward signaling |
| 3.0 | 84.9 | PID DNA PK PATHWAY | DNA-PK pathway in nonhomologous end joining |
| 3.0 | 168.3 | PID AURORA A PATHWAY | Aurora A signaling |
| 2.8 | 73.4 | SA G1 AND S PHASES | Cdk2, 4, and 6 bind cyclin D in G1, while cdk2/cyclin E promotes the G1/S transition. |
| 2.8 | 95.9 | PID SYNDECAN 3 PATHWAY | Syndecan-3-mediated signaling events |
| 2.5 | 92.1 | PID HIF1A PATHWAY | Hypoxic and oxygen homeostasis regulation of HIF-1-alpha |
| 2.3 | 24.8 | PID RANBP2 PATHWAY | Sumoylation by RanBP2 regulates transcriptional repression |
| 2.2 | 93.6 | PID SYNDECAN 2 PATHWAY | Syndecan-2-mediated signaling events |
| 2.2 | 50.7 | SA TRKA RECEPTOR | The TrkA receptor binds nerve growth factor to activate MAP kinase pathways and promote cell growth. |
| 2.1 | 114.6 | PID FOXM1 PATHWAY | FOXM1 transcription factor network |
| 2.0 | 46.9 | PID ERB GENOMIC PATHWAY | Validated nuclear estrogen receptor beta network |
| 1.8 | 34.6 | PID ALK2 PATHWAY | ALK2 signaling events |
| 1.5 | 27.2 | PID ARF6 DOWNSTREAM PATHWAY | Arf6 downstream pathway |
| 1.3 | 32.2 | PID ERBB NETWORK PATHWAY | ErbB receptor signaling network |
| 1.3 | 3.8 | PID SYNDECAN 1 PATHWAY | Syndecan-1-mediated signaling events |
| 1.3 | 66.7 | PID ATR PATHWAY | ATR signaling pathway |
| 1.2 | 60.7 | PID CDC42 REG PATHWAY | Regulation of CDC42 activity |
| 1.2 | 21.6 | PID PRL SIGNALING EVENTS PATHWAY | Signaling events mediated by PRL |
| 1.2 | 8.3 | ST PHOSPHOINOSITIDE 3 KINASE PATHWAY | PI3K Pathway |
| 1.2 | 37.4 | PID LIS1 PATHWAY | Lissencephaly gene (LIS1) in neuronal migration and development |
| 1.1 | 10.2 | PID FAK PATHWAY | Signaling events mediated by focal adhesion kinase |
| 1.1 | 42.5 | PID MYC PATHWAY | C-MYC pathway |
| 1.1 | 52.8 | PID AURORA B PATHWAY | Aurora B signaling |
| 1.1 | 25.7 | PID RAC1 PATHWAY | RAC1 signaling pathway |
| 1.0 | 30.0 | PID HIF2PATHWAY | HIF-2-alpha transcription factor network |
| 1.0 | 22.5 | PID S1P S1P1 PATHWAY | S1P1 pathway |
| 0.9 | 27.1 | PID P38 ALPHA BETA PATHWAY | Regulation of p38-alpha and p38-beta |
| 0.8 | 13.7 | PID INTEGRIN4 PATHWAY | Alpha6 beta4 integrin-ligand interactions |
| 0.7 | 25.4 | PID IL1 PATHWAY | IL1-mediated signaling events |
| 0.7 | 22.7 | PID PS1 PATHWAY | Presenilin action in Notch and Wnt signaling |
| 0.7 | 11.8 | PID HEDGEHOG 2PATHWAY | Signaling events mediated by the Hedgehog family |
| 0.7 | 41.4 | PID AJDISS 2PATHWAY | Posttranslational regulation of adherens junction stability and dissassembly |
| 0.7 | 12.4 | ST GA12 PATHWAY | G alpha 12 Pathway |
| 0.6 | 18.7 | PID EPHB FWD PATHWAY | EPHB forward signaling |
| 0.6 | 1.9 | PID ECADHERIN KERATINOCYTE PATHWAY | E-cadherin signaling in keratinocytes |
| 0.6 | 21.9 | PID ERBB1 INTERNALIZATION PATHWAY | Internalization of ErbB1 |
| 0.6 | 35.0 | PID HNF3A PATHWAY | FOXA1 transcription factor network |
| 0.6 | 13.2 | SA PROGRAMMED CELL DEATH | Programmed cell death, or apoptosis, eliminates damaged or unneeded cells. |
| 0.6 | 10.1 | PID ERBB2 ERBB3 PATHWAY | ErbB2/ErbB3 signaling events |
| 0.5 | 12.0 | PID MAPK TRK PATHWAY | Trk receptor signaling mediated by the MAPK pathway |
| 0.5 | 12.0 | PID RETINOIC ACID PATHWAY | Retinoic acid receptors-mediated signaling |
| 0.5 | 6.4 | PID TCR RAS PATHWAY | Ras signaling in the CD4+ TCR pathway |
| 0.5 | 48.0 | PID MYC ACTIV PATHWAY | Validated targets of C-MYC transcriptional activation |
| 0.5 | 19.2 | SIG INSULIN RECEPTOR PATHWAY IN CARDIAC MYOCYTES | Genes related to the insulin receptor pathway |
| 0.5 | 5.8 | PID NECTIN PATHWAY | Nectin adhesion pathway |
| 0.4 | 15.0 | PID VEGFR1 2 PATHWAY | Signaling events mediated by VEGFR1 and VEGFR2 |
| 0.4 | 4.3 | PID ALK1 PATHWAY | ALK1 signaling events |
| 0.4 | 12.4 | PID ANGIOPOIETIN RECEPTOR PATHWAY | Angiopoietin receptor Tie2-mediated signaling |
| 0.4 | 23.7 | PID TAP63 PATHWAY | Validated transcriptional targets of TAp63 isoforms |
| 0.4 | 24.6 | PID TGFBR PATHWAY | TGF-beta receptor signaling |
| 0.4 | 11.4 | PID ALPHA SYNUCLEIN PATHWAY | Alpha-synuclein signaling |
| 0.4 | 12.8 | PID HES HEY PATHWAY | Notch-mediated HES/HEY network |
| 0.4 | 28.1 | PID ERBB1 DOWNSTREAM PATHWAY | ErbB1 downstream signaling |
| 0.4 | 5.4 | ST G ALPHA S PATHWAY | G alpha s Pathway |
| 0.4 | 23.6 | PID TRKR PATHWAY | Neurotrophic factor-mediated Trk receptor signaling |
| 0.4 | 20.8 | PID ILK PATHWAY | Integrin-linked kinase signaling |
| 0.3 | 4.7 | SIG CD40PATHWAYMAP | Genes related to CD40 signaling |
| 0.3 | 5.0 | PID ECADHERIN NASCENT AJ PATHWAY | E-cadherin signaling in the nascent adherens junction |
| 0.3 | 3.7 | PID ERBB4 PATHWAY | ErbB4 signaling events |
| 0.3 | 3.5 | PID PI3K PLC TRK PATHWAY | Trk receptor signaling mediated by PI3K and PLC-gamma |
| 0.3 | 2.2 | PID IFNG PATHWAY | IFN-gamma pathway |
| 0.3 | 5.2 | PID INSULIN PATHWAY | Insulin Pathway |
| 0.2 | 56.1 | NABA ECM REGULATORS | Genes encoding enzymes and their regulators involved in the remodeling of the extracellular matrix |
| 0.2 | 43.0 | NABA ECM GLYCOPROTEINS | Genes encoding structural ECM glycoproteins |
| 0.2 | 9.0 | PID ERA GENOMIC PATHWAY | Validated nuclear estrogen receptor alpha network |
| 0.2 | 2.2 | PID FOXO PATHWAY | FoxO family signaling |
| 0.2 | 5.7 | PID INTEGRIN A4B1 PATHWAY | Alpha4 beta1 integrin signaling events |
| 0.2 | 8.4 | PID AR TF PATHWAY | Regulation of Androgen receptor activity |
| 0.2 | 5.5 | PID NCADHERIN PATHWAY | N-cadherin signaling events |
| 0.2 | 6.6 | ST INTEGRIN SIGNALING PATHWAY | Integrin Signaling Pathway |
| 0.2 | 0.8 | PID IL8 CXCR1 PATHWAY | IL8- and CXCR1-mediated signaling events |
| 0.2 | 7.4 | ST FAS SIGNALING PATHWAY | Fas Signaling Pathway |
| 0.1 | 2.7 | PID CIRCADIAN PATHWAY | Circadian rhythm pathway |
| 0.1 | 1.9 | PID NETRIN PATHWAY | Netrin-mediated signaling events |
| 0.1 | 2.4 | PID ER NONGENOMIC PATHWAY | Plasma membrane estrogen receptor signaling |
| 0.1 | 4.1 | PID AP1 PATHWAY | AP-1 transcription factor network |
| 0.1 | 6.4 | PID CMYB PATHWAY | C-MYB transcription factor network |
| 0.1 | 0.9 | PID BARD1 PATHWAY | BARD1 signaling events |
| 0.1 | 2.4 | PID TCR CALCIUM PATHWAY | Calcium signaling in the CD4+ TCR pathway |
| 0.1 | 2.2 | PID CERAMIDE PATHWAY | Ceramide signaling pathway |
| 0.1 | 0.3 | SIG PIP3 SIGNALING IN CARDIAC MYOCTES | Genes related to PIP3 signaling in cardiac myocytes |
| 0.0 | 7.8 | NABA ECM AFFILIATED | Genes encoding proteins affiliated structurally or functionally to extracellular matrix proteins |
| 0.0 | 0.3 | PID GLYPICAN 1PATHWAY | Glypican 1 network |
| 0.0 | 0.4 | PID BETA CATENIN DEG PATHWAY | Degradation of beta catenin |
Gene overrepresentation in C2:CP:REACTOME category:
| Log-likelihood per target | Total log-likelihood | Term | Description |
|---|---|---|---|
| 8.4 | 75.7 | REACTOME MRNA DECAY BY 3 TO 5 EXORIBONUCLEASE | Genes involved in mRNA Decay by 3' to 5' Exoribonuclease |
| 7.4 | 44.5 | REACTOME MEMBRANE BINDING AND TARGETTING OF GAG PROTEINS | Genes involved in Membrane binding and targetting of GAG proteins |
| 7.0 | 204.1 | REACTOME FORMATION OF INCISION COMPLEX IN GG NER | Genes involved in Formation of incision complex in GG-NER |
| 6.6 | 125.3 | REACTOME PECAM1 INTERACTIONS | Genes involved in PECAM1 interactions |
| 5.9 | 94.2 | REACTOME SLBP DEPENDENT PROCESSING OF REPLICATION DEPENDENT HISTONE PRE MRNAS | Genes involved in SLBP Dependent Processing of Replication-Dependent Histone Pre-mRNAs |
| 5.7 | 465.0 | REACTOME VIF MEDIATED DEGRADATION OF APOBEC3G | Genes involved in Vif-mediated degradation of APOBEC3G |
| 5.7 | 125.8 | REACTOME RETROGRADE NEUROTROPHIN SIGNALLING | Genes involved in Retrograde neurotrophin signalling |
| 5.6 | 88.8 | REACTOME SYNTHESIS OF SUBSTRATES IN N GLYCAN BIOSYTHESIS | Genes involved in Synthesis of substrates in N-glycan biosythesis |
| 4.9 | 301.2 | REACTOME MITOCHONDRIAL PROTEIN IMPORT | Genes involved in Mitochondrial Protein Import |
| 4.8 | 72.6 | REACTOME MRNA DECAY BY 5 TO 3 EXORIBONUCLEASE | Genes involved in mRNA Decay by 5' to 3' Exoribonuclease |
| 4.6 | 23.1 | REACTOME INHIBITION OF THE PROTEOLYTIC ACTIVITY OF APC C REQUIRED FOR THE ONSET OF ANAPHASE BY MITOTIC SPINDLE CHECKPOINT COMPONENTS | Genes involved in Inhibition of the proteolytic activity of APC/C required for the onset of anaphase by mitotic spindle checkpoint components |
| 4.4 | 96.9 | REACTOME SCFSKP2 MEDIATED DEGRADATION OF P27 P21 | Genes involved in SCF(Skp2)-mediated degradation of p27/p21 |
| 4.3 | 85.3 | REACTOME CITRIC ACID CYCLE TCA CYCLE | Genes involved in Citric acid cycle (TCA cycle) |
| 4.2 | 267.4 | REACTOME SMOOTH MUSCLE CONTRACTION | Genes involved in Smooth Muscle Contraction |
| 4.2 | 70.6 | REACTOME ENDOSOMAL SORTING COMPLEX REQUIRED FOR TRANSPORT ESCRT | Genes involved in Endosomal Sorting Complex Required For Transport (ESCRT) |
| 4.1 | 41.1 | REACTOME COPI MEDIATED TRANSPORT | Genes involved in COPI Mediated Transport |
| 4.0 | 16.1 | REACTOME SYNTHESIS OF PIPS AT THE LATE ENDOSOME MEMBRANE | Genes involved in Synthesis of PIPs at the late endosome membrane |
| 4.0 | 72.0 | REACTOME INTEGRATION OF PROVIRUS | Genes involved in Integration of provirus |
| 3.8 | 61.5 | REACTOME FORMATION OF ATP BY CHEMIOSMOTIC COUPLING | Genes involved in Formation of ATP by chemiosmotic coupling |
| 3.7 | 3.7 | REACTOME FORMATION OF TUBULIN FOLDING INTERMEDIATES BY CCT TRIC | Genes involved in Formation of tubulin folding intermediates by CCT/TriC |
| 3.5 | 59.7 | REACTOME NRIF SIGNALS CELL DEATH FROM THE NUCLEUS | Genes involved in NRIF signals cell death from the nucleus |
| 3.4 | 271.0 | REACTOME RESPIRATORY ELECTRON TRANSPORT | Genes involved in Respiratory electron transport |
| 3.4 | 16.8 | REACTOME APC C CDC20 MEDIATED DEGRADATION OF CYCLIN B | Genes involved in APC/C:Cdc20 mediated degradation of Cyclin B |
| 3.2 | 45.3 | REACTOME PROCESSING OF CAPPED INTRONLESS PRE MRNA | Genes involved in Processing of Capped Intronless Pre-mRNA |
| 3.0 | 88.1 | REACTOME FORMATION OF THE HIV1 EARLY ELONGATION COMPLEX | Genes involved in Formation of the HIV-1 Early Elongation Complex |
| 3.0 | 41.8 | REACTOME ROLE OF DCC IN REGULATING APOPTOSIS | Genes involved in Role of DCC in regulating apoptosis |
| 2.9 | 87.1 | REACTOME APC C CDH1 MEDIATED DEGRADATION OF CDC20 AND OTHER APC C CDH1 TARGETED PROTEINS IN LATE MITOSIS EARLY G1 | Genes involved in APC/C:Cdh1 mediated degradation of Cdc20 and other APC/C:Cdh1 targeted proteins in late mitosis/early G1 |
| 2.9 | 154.2 | REACTOME TRNA AMINOACYLATION | Genes involved in tRNA Aminoacylation |
| 2.9 | 54.2 | REACTOME SHC MEDIATED SIGNALLING | Genes involved in SHC-mediated signalling |
| 2.8 | 33.7 | REACTOME REPAIR SYNTHESIS FOR GAP FILLING BY DNA POL IN TC NER | Genes involved in Repair synthesis for gap-filling by DNA polymerase in TC-NER |
| 2.8 | 108.2 | REACTOME PREFOLDIN MEDIATED TRANSFER OF SUBSTRATE TO CCT TRIC | Genes involved in Prefoldin mediated transfer of substrate to CCT/TriC |
| 2.7 | 48.2 | REACTOME N GLYCAN TRIMMING IN THE ER AND CALNEXIN CALRETICULIN CYCLE | Genes involved in N-glycan trimming in the ER and Calnexin/Calreticulin cycle |
| 2.7 | 69.6 | REACTOME KINESINS | Genes involved in Kinesins |
| 2.7 | 82.7 | REACTOME ADVANCED GLYCOSYLATION ENDPRODUCT RECEPTOR SIGNALING | Genes involved in Advanced glycosylation endproduct receptor signaling |
| 2.4 | 23.6 | REACTOME E2F ENABLED INHIBITION OF PRE REPLICATION COMPLEX FORMATION | Genes involved in E2F-enabled inhibition of pre-replication complex formation |
| 2.1 | 34.2 | REACTOME SEMA3A PLEXIN REPULSION SIGNALING BY INHIBITING INTEGRIN ADHESION | Genes involved in SEMA3A-Plexin repulsion signaling by inhibiting Integrin adhesion |
| 2.0 | 48.9 | REACTOME REGULATION OF AMPK ACTIVITY VIA LKB1 | Genes involved in Regulation of AMPK activity via LKB1 |
| 2.0 | 24.4 | REACTOME TRAF6 MEDIATED IRF7 ACTIVATION IN TLR7 8 OR 9 SIGNALING | Genes involved in TRAF6 mediated IRF7 activation in TLR7/8 or 9 signaling |
| 1.9 | 48.1 | REACTOME METABOLISM OF POLYAMINES | Genes involved in Metabolism of polyamines |
| 1.8 | 42.9 | REACTOME RNA POL II TRANSCRIPTION PRE INITIATION AND PROMOTER OPENING | Genes involved in RNA Polymerase II Transcription Pre-Initiation And Promoter Opening |
| 1.7 | 41.0 | REACTOME ACTIVATION OF THE PRE REPLICATIVE COMPLEX | Genes involved in Activation of the pre-replicative complex |
| 1.7 | 152.3 | REACTOME MHC CLASS II ANTIGEN PRESENTATION | Genes involved in MHC class II antigen presentation |
| 1.6 | 30.9 | REACTOME SYNTHESIS OF PIPS AT THE GOLGI MEMBRANE | Genes involved in Synthesis of PIPs at the Golgi membrane |
| 1.6 | 40.3 | REACTOME PURINE SALVAGE | Genes involved in Purine salvage |
| 1.6 | 9.3 | REACTOME SIGNAL ATTENUATION | Genes involved in Signal attenuation |
| 1.5 | 43.9 | REACTOME INSULIN RECEPTOR RECYCLING | Genes involved in Insulin receptor recycling |
| 1.5 | 24.0 | REACTOME EXTENSION OF TELOMERES | Genes involved in Extension of Telomeres |
| 1.5 | 32.2 | REACTOME GRB2 EVENTS IN ERBB2 SIGNALING | Genes involved in GRB2 events in ERBB2 signaling |
| 1.4 | 32.6 | REACTOME SYNTHESIS OF GLYCOSYLPHOSPHATIDYLINOSITOL GPI | Genes involved in Synthesis of glycosylphosphatidylinositol (GPI) |
| 1.4 | 30.1 | REACTOME RECYCLING PATHWAY OF L1 | Genes involved in Recycling pathway of L1 |
| 1.3 | 26.8 | REACTOME TGF BETA RECEPTOR SIGNALING IN EMT EPITHELIAL TO MESENCHYMAL TRANSITION | Genes involved in TGF-beta receptor signaling in EMT (epithelial to mesenchymal transition) |
| 1.3 | 71.7 | REACTOME ION TRANSPORT BY P TYPE ATPASES | Genes involved in Ion transport by P-type ATPases |
| 1.3 | 49.8 | REACTOME NEP NS2 INTERACTS WITH THE CELLULAR EXPORT MACHINERY | Genes involved in NEP/NS2 Interacts with the Cellular Export Machinery |
| 1.2 | 29.7 | REACTOME METAL ION SLC TRANSPORTERS | Genes involved in Metal ion SLC transporters |
| 1.2 | 4.9 | REACTOME FORMATION OF TRANSCRIPTION COUPLED NER TC NER REPAIR COMPLEX | Genes involved in Formation of transcription-coupled NER (TC-NER) repair complex |
| 1.2 | 13.0 | REACTOME TRAF6 MEDIATED INDUCTION OF TAK1 COMPLEX | Genes involved in TRAF6 mediated induction of TAK1 complex |
| 1.2 | 2.3 | REACTOME SCF BETA TRCP MEDIATED DEGRADATION OF EMI1 | Genes involved in SCF-beta-TrCP mediated degradation of Emi1 |
| 1.1 | 9.0 | REACTOME SEMA3A PAK DEPENDENT AXON REPULSION | Genes involved in Sema3A PAK dependent Axon repulsion |
| 1.1 | 2.2 | REACTOME ACTIVATED TAK1 MEDIATES P38 MAPK ACTIVATION | Genes involved in activated TAK1 mediates p38 MAPK activation |
| 1.1 | 25.5 | REACTOME SIGNAL TRANSDUCTION BY L1 | Genes involved in Signal transduction by L1 |
| 1.1 | 41.6 | REACTOME PTM GAMMA CARBOXYLATION HYPUSINE FORMATION AND ARYLSULFATASE ACTIVATION | Genes involved in PTM: gamma carboxylation, hypusine formation and arylsulfatase activation |
| 1.1 | 8.7 | REACTOME ACTIVATION OF NF KAPPAB IN B CELLS | Genes involved in Activation of NF-kappaB in B Cells |
| 1.1 | 20.7 | REACTOME ALPHA LINOLENIC ACID ALA METABOLISM | Genes involved in alpha-linolenic acid (ALA) metabolism |
| 1.1 | 7.6 | REACTOME POST TRANSLATIONAL MODIFICATION SYNTHESIS OF GPI ANCHORED PROTEINS | Genes involved in Post-translational modification: synthesis of GPI-anchored proteins |
| 1.1 | 176.2 | REACTOME ANTIGEN PROCESSING UBIQUITINATION PROTEASOME DEGRADATION | Genes involved in Antigen processing: Ubiquitination & Proteasome degradation |
| 1.0 | 22.8 | REACTOME SIGNALLING TO RAS | Genes involved in Signalling to RAS |
| 1.0 | 25.1 | REACTOME CELL EXTRACELLULAR MATRIX INTERACTIONS | Genes involved in Cell-extracellular matrix interactions |
| 1.0 | 22.9 | REACTOME RNA POL III TRANSCRIPTION INITIATION FROM TYPE 3 PROMOTER | Genes involved in RNA Polymerase III Transcription Initiation From Type 3 Promoter |
| 0.9 | 27.4 | REACTOME BMAL1 CLOCK NPAS2 ACTIVATES CIRCADIAN EXPRESSION | Genes involved in BMAL1:CLOCK/NPAS2 Activates Circadian Expression |
| 0.9 | 7.8 | REACTOME POST CHAPERONIN TUBULIN FOLDING PATHWAY | Genes involved in Post-chaperonin tubulin folding pathway |
| 0.9 | 82.0 | REACTOME TRANSCRIPTIONAL REGULATION OF WHITE ADIPOCYTE DIFFERENTIATION | Genes involved in Transcriptional Regulation of White Adipocyte Differentiation |
| 0.8 | 21.9 | REACTOME SIGNALING BY HIPPO | Genes involved in Signaling by Hippo |
| 0.8 | 54.7 | REACTOME COLLAGEN FORMATION | Genes involved in Collagen formation |
| 0.8 | 15.1 | REACTOME METABOLISM OF NON CODING RNA | Genes involved in Metabolism of non-coding RNA |
| 0.8 | 13.6 | REACTOME INTRINSIC PATHWAY | Genes involved in Intrinsic Pathway |
| 0.8 | 8.7 | REACTOME CREATION OF C4 AND C2 ACTIVATORS | Genes involved in Creation of C4 and C2 activators |
| 0.7 | 30.9 | REACTOME DARPP 32 EVENTS | Genes involved in DARPP-32 events |
| 0.7 | 2.9 | REACTOME CONVERSION FROM APC C CDC20 TO APC C CDH1 IN LATE ANAPHASE | Genes involved in Conversion from APC/C:Cdc20 to APC/C:Cdh1 in late anaphase |
| 0.7 | 40.5 | REACTOME GLUCONEOGENESIS | Genes involved in Gluconeogenesis |
| 0.7 | 8.3 | REACTOME DESTABILIZATION OF MRNA BY KSRP | Genes involved in Destabilization of mRNA by KSRP |
| 0.7 | 22.6 | REACTOME SYNTHESIS AND INTERCONVERSION OF NUCLEOTIDE DI AND TRIPHOSPHATES | Genes involved in Synthesis and interconversion of nucleotide di- and triphosphates |
| 0.6 | 10.8 | REACTOME ADENYLATE CYCLASE INHIBITORY PATHWAY | Genes involved in Adenylate cyclase inhibitory pathway |
| 0.6 | 67.2 | REACTOME RESPONSE TO ELEVATED PLATELET CYTOSOLIC CA2 | Genes involved in Response to elevated platelet cytosolic Ca2+ |
| 0.6 | 14.5 | REACTOME GLUCURONIDATION | Genes involved in Glucuronidation |
| 0.5 | 17.7 | REACTOME G1 PHASE | Genes involved in G1 Phase |
| 0.5 | 5.0 | REACTOME ABACAVIR TRANSPORT AND METABOLISM | Genes involved in Abacavir transport and metabolism |
| 0.5 | 13.7 | REACTOME INTEGRIN CELL SURFACE INTERACTIONS | Genes involved in Integrin cell surface interactions |
| 0.5 | 16.0 | REACTOME TIGHT JUNCTION INTERACTIONS | Genes involved in Tight junction interactions |
| 0.4 | 17.2 | REACTOME REGULATION OF WATER BALANCE BY RENAL AQUAPORINS | Genes involved in Regulation of Water Balance by Renal Aquaporins |
| 0.4 | 6.1 | REACTOME RNA POL I TRANSCRIPTION TERMINATION | Genes involved in RNA Polymerase I Transcription Termination |
| 0.4 | 20.4 | REACTOME ANTIVIRAL MECHANISM BY IFN STIMULATED GENES | Genes involved in Antiviral mechanism by IFN-stimulated genes |
| 0.4 | 7.3 | REACTOME SYNTHESIS SECRETION AND INACTIVATION OF GIP | Genes involved in Synthesis, Secretion, and Inactivation of Glucose-dependent Insulinotropic Polypeptide (GIP) |
| 0.4 | 6.9 | REACTOME PRESYNAPTIC NICOTINIC ACETYLCHOLINE RECEPTORS | Genes involved in Presynaptic nicotinic acetylcholine receptors |
| 0.4 | 27.9 | REACTOME METABOLISM OF VITAMINS AND COFACTORS | Genes involved in Metabolism of vitamins and cofactors |
| 0.4 | 6.4 | REACTOME NONSENSE MEDIATED DECAY ENHANCED BY THE EXON JUNCTION COMPLEX | Genes involved in Nonsense Mediated Decay Enhanced by the Exon Junction Complex |
| 0.4 | 10.7 | REACTOME SEMA4D INDUCED CELL MIGRATION AND GROWTH CONE COLLAPSE | Genes involved in Sema4D induced cell migration and growth-cone collapse |
| 0.4 | 6.5 | REACTOME MITOCHONDRIAL FATTY ACID BETA OXIDATION | Genes involved in Mitochondrial Fatty Acid Beta-Oxidation |
| 0.3 | 8.4 | REACTOME SIGNALING BY BMP | Genes involved in Signaling by BMP |
| 0.3 | 3.3 | REACTOME PROLACTIN RECEPTOR SIGNALING | Genes involved in Prolactin receptor signaling |
| 0.3 | 3.7 | REACTOME MTORC1 MEDIATED SIGNALLING | Genes involved in mTORC1-mediated signalling |
| 0.3 | 3.0 | REACTOME G BETA GAMMA SIGNALLING THROUGH PI3KGAMMA | Genes involved in G beta:gamma signalling through PI3Kgamma |
| 0.3 | 1.4 | REACTOME DOWNREGULATION OF ERBB2 ERBB3 SIGNALING | Genes involved in Downregulation of ERBB2:ERBB3 signaling |
| 0.3 | 19.4 | REACTOME P75 NTR RECEPTOR MEDIATED SIGNALLING | Genes involved in p75 NTR receptor-mediated signalling |
| 0.2 | 7.7 | REACTOME INTERACTION BETWEEN L1 AND ANKYRINS | Genes involved in Interaction between L1 and Ankyrins |
| 0.2 | 5.4 | REACTOME INSULIN SYNTHESIS AND PROCESSING | Genes involved in Insulin Synthesis and Processing |
| 0.2 | 4.3 | REACTOME GAP JUNCTION ASSEMBLY | Genes involved in Gap junction assembly |
| 0.2 | 16.1 | REACTOME FORMATION OF THE TERNARY COMPLEX AND SUBSEQUENTLY THE 43S COMPLEX | Genes involved in Formation of the ternary complex, and subsequently, the 43S complex |
| 0.2 | 3.2 | REACTOME REVERSIBLE HYDRATION OF CARBON DIOXIDE | Genes involved in Reversible Hydration of Carbon Dioxide |
| 0.2 | 6.3 | REACTOME SYNTHESIS OF PA | Genes involved in Synthesis of PA |
| 0.2 | 5.6 | REACTOME SYNTHESIS OF PC | Genes involved in Synthesis of PC |
| 0.2 | 3.4 | REACTOME PURINE RIBONUCLEOSIDE MONOPHOSPHATE BIOSYNTHESIS | Genes involved in Purine ribonucleoside monophosphate biosynthesis |
| 0.2 | 3.1 | REACTOME ORGANIC CATION ANION ZWITTERION TRANSPORT | Genes involved in Organic cation/anion/zwitterion transport |
| 0.2 | 8.2 | REACTOME O LINKED GLYCOSYLATION OF MUCINS | Genes involved in O-linked glycosylation of mucins |
| 0.2 | 3.8 | REACTOME MRNA SPLICING MINOR PATHWAY | Genes involved in mRNA Splicing - Minor Pathway |
| 0.2 | 3.3 | REACTOME ENOS ACTIVATION AND REGULATION | Genes involved in eNOS activation and regulation |
| 0.2 | 3.0 | REACTOME ACTIVATION OF RAC | Genes involved in Activation of Rac |
| 0.2 | 8.8 | REACTOME GLYCEROPHOSPHOLIPID BIOSYNTHESIS | Genes involved in Glycerophospholipid biosynthesis |
| 0.2 | 38.7 | REACTOME METABOLISM OF CARBOHYDRATES | Genes involved in Metabolism of carbohydrates |
| 0.2 | 8.6 | REACTOME MUSCLE CONTRACTION | Genes involved in Muscle contraction |
| 0.2 | 6.4 | REACTOME CGMP EFFECTS | Genes involved in cGMP effects |
| 0.2 | 3.9 | REACTOME TGF BETA RECEPTOR SIGNALING ACTIVATES SMADS | Genes involved in TGF-beta receptor signaling activates SMADs |
| 0.1 | 4.7 | REACTOME GLUTATHIONE CONJUGATION | Genes involved in Glutathione conjugation |
| 0.1 | 6.1 | REACTOME TRANSPORT OF VITAMINS NUCLEOSIDES AND RELATED MOLECULES | Genes involved in Transport of vitamins, nucleosides, and related molecules |
| 0.1 | 3.0 | REACTOME METABOLISM OF PORPHYRINS | Genes involved in Metabolism of porphyrins |
| 0.1 | 7.8 | REACTOME DEPOSITION OF NEW CENPA CONTAINING NUCLEOSOMES AT THE CENTROMERE | Genes involved in Deposition of New CENPA-containing Nucleosomes at the Centromere |
| 0.1 | 2.8 | REACTOME INTRINSIC PATHWAY FOR APOPTOSIS | Genes involved in Intrinsic Pathway for Apoptosis |
| 0.1 | 9.4 | REACTOME SIGNALING BY RHO GTPASES | Genes involved in Signaling by Rho GTPases |
| 0.1 | 1.2 | REACTOME ANDROGEN BIOSYNTHESIS | Genes involved in Androgen biosynthesis |
| 0.1 | 0.7 | REACTOME FACILITATIVE NA INDEPENDENT GLUCOSE TRANSPORTERS | Genes involved in Facilitative Na+-independent glucose transporters |
| 0.1 | 0.5 | REACTOME CD28 DEPENDENT VAV1 PATHWAY | Genes involved in CD28 dependent Vav1 pathway |
| 0.1 | 0.3 | REACTOME SYNTHESIS SECRETION AND INACTIVATION OF GLP1 | Genes involved in Synthesis, Secretion, and Inactivation of Glucagon-like Peptide-1 (GLP-1) |
| 0.1 | 4.6 | REACTOME MRNA SPLICING | Genes involved in mRNA Splicing |
| 0.0 | 1.5 | REACTOME CELL CELL JUNCTION ORGANIZATION | Genes involved in Cell-cell junction organization |
| 0.0 | 1.7 | REACTOME COMPLEMENT CASCADE | Genes involved in Complement cascade |
| 0.0 | 4.4 | REACTOME DIABETES PATHWAYS | Genes involved in Diabetes pathways |
| 0.0 | 2.8 | REACTOME APOPTOTIC CLEAVAGE OF CELLULAR PROTEINS | Genes involved in Apoptotic cleavage of cellular proteins |
| 0.0 | 0.8 | REACTOME PEROXISOMAL LIPID METABOLISM | Genes involved in Peroxisomal lipid metabolism |
| 0.0 | 1.0 | REACTOME AMINE COMPOUND SLC TRANSPORTERS | Genes involved in Amine compound SLC transporters |
| 0.0 | 0.5 | REACTOME REGULATION OF HYPOXIA INDUCIBLE FACTOR HIF BY OXYGEN | Genes involved in Regulation of Hypoxia-inducible Factor (HIF) by Oxygen |
| 0.0 | 0.3 | REACTOME G PROTEIN ACTIVATION | Genes involved in G-protein activation |
| 0.0 | 1.3 | REACTOME CLASS B 2 SECRETIN FAMILY RECEPTORS | Genes involved in Class B/2 (Secretin family receptors) |
| 0.0 | 2.5 | REACTOME G ALPHA S SIGNALLING EVENTS | Genes involved in G alpha (s) signalling events |
| 0.0 | 0.6 | REACTOME AMINO ACID SYNTHESIS AND INTERCONVERSION TRANSAMINATION | Genes involved in Amino acid synthesis and interconversion (transamination) |
| 0.0 | 0.2 | REACTOME SIGNALING BY WNT | Genes involved in Signaling by Wnt |
| 0.0 | 0.4 | REACTOME AMYLOIDS | Genes involved in Amyloids |