Project
GNF SymAtlas + NCI-60 cancer cell lines, comparison of cancers vs non-cancers, human (Su, 2004; Ross, 2000)
Navigation
Downloads
Results for ETV4_ETS2
Z-value: 0.28
Motif logo
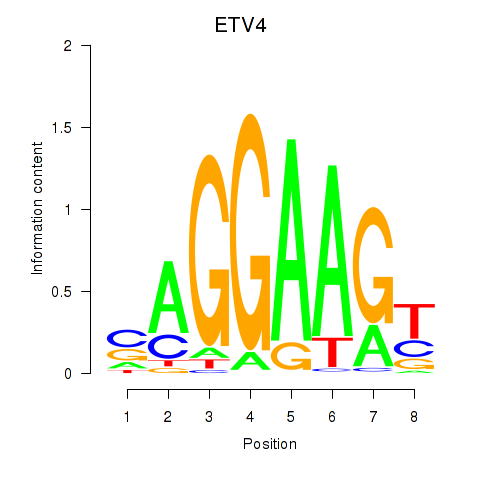
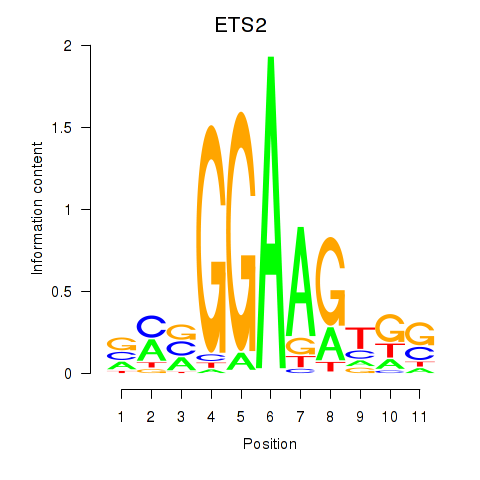
Transcription factors associated with ETV4_ETS2
| Gene Symbol | Gene ID | Gene Info |
|---|---|---|
|
ETV4
|
ENSG00000175832.8 | ETS variant transcription factor 4 |
|
ETS2
|
ENSG00000157557.7 | ETS proto-oncogene 2, transcription factor |
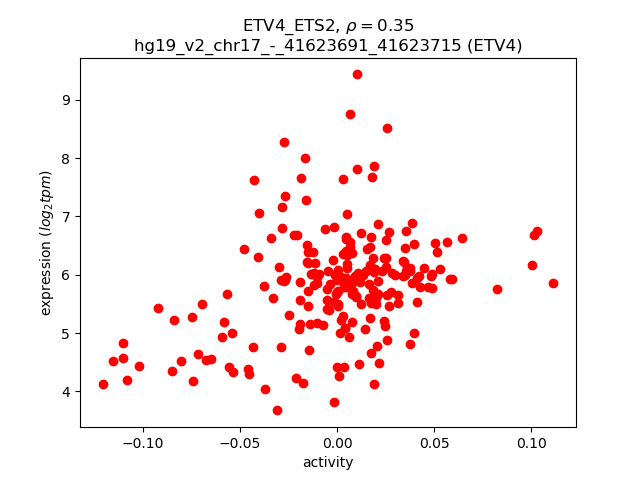
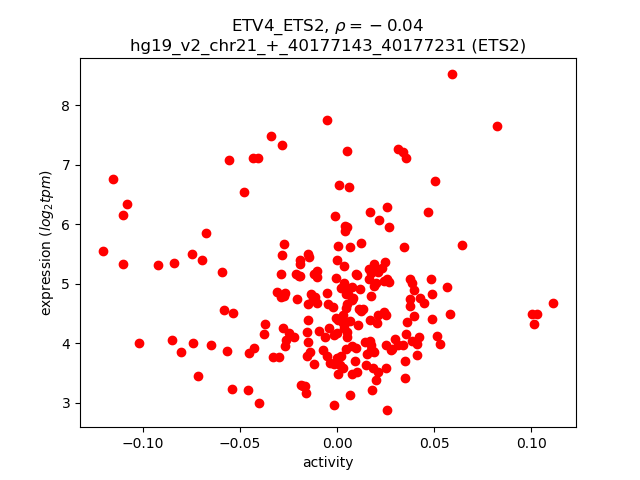
Activity-expression correlation:
| Gene | Promoter | Pearson corr. coef. | P-value | Plot |
|---|---|---|---|---|
| ETV4 | hg19_v2_chr17_-_41623691_41623715, hg19_v2_chr17_-_41623075_41623101 | 0.35 | 1.4e-07 | Click! |
| ETS2 | hg19_v2_chr21_+_40177143_40177231, hg19_v2_chr21_+_40177755_40177875 | -0.04 | 6.0e-01 | Click! |
Activity profile of ETV4_ETS2 motif
Sorted Z-values of ETV4_ETS2 motif
| Promoter | Log-likelihood | Transcript | Gene | Gene Info |
|---|---|---|---|---|
| chr2_-_99224915 | 29.26 |
ENST00000328709.3
ENST00000409997.1 |
COA5
|
cytochrome c oxidase assembly factor 5 |
| chr10_-_15902449 | 25.13 |
ENST00000277632.3
|
FAM188A
|
family with sequence similarity 188, member A |
| chr16_-_31085514 | 21.01 |
ENST00000300849.4
|
ZNF668
|
zinc finger protein 668 |
| chr11_-_46722117 | 19.41 |
ENST00000311956.4
|
ARHGAP1
|
Rho GTPase activating protein 1 |
| chr6_+_31620191 | 18.40 |
ENST00000375918.2
ENST00000375920.4 |
APOM
|
apolipoprotein M |
| chr2_-_37193606 | 16.94 |
ENST00000379213.2
ENST00000263918.4 |
STRN
|
striatin, calmodulin binding protein |
| chr11_+_46722368 | 16.88 |
ENST00000311764.2
|
ZNF408
|
zinc finger protein 408 |
| chr1_+_169337172 | 15.86 |
ENST00000367807.3
ENST00000367808.3 ENST00000329281.2 ENST00000420531.1 |
BLZF1
|
basic leucine zipper nuclear factor 1 |
| chr3_+_15468862 | 15.43 |
ENST00000396842.2
|
EAF1
|
ELL associated factor 1 |
| chr12_+_53443680 | 15.34 |
ENST00000314250.6
ENST00000451358.1 |
TENC1
|
tensin like C1 domain containing phosphatase (tensin 2) |
| chr16_+_23652773 | 15.33 |
ENST00000563998.1
ENST00000568589.1 ENST00000568272.1 |
DCTN5
|
dynactin 5 (p25) |
| chr3_+_57541975 | 15.05 |
ENST00000487257.1
ENST00000311180.8 |
PDE12
|
phosphodiesterase 12 |
| chr12_-_6233828 | 14.55 |
ENST00000572068.1
ENST00000261405.5 |
VWF
|
von Willebrand factor |
| chr11_+_2421718 | 14.21 |
ENST00000380996.5
ENST00000333256.6 ENST00000380992.1 ENST00000437110.1 ENST00000435795.1 |
TSSC4
|
tumor suppressing subtransferable candidate 4 |
| chr12_+_53443963 | 13.94 |
ENST00000546602.1
ENST00000552570.1 ENST00000549700.1 |
TENC1
|
tensin like C1 domain containing phosphatase (tensin 2) |
| chr1_+_156698234 | 13.92 |
ENST00000368218.4
ENST00000368216.4 |
RRNAD1
|
ribosomal RNA adenine dimethylase domain containing 1 |
| chr14_-_45431091 | 13.42 |
ENST00000579157.1
ENST00000396128.4 ENST00000556500.1 |
KLHL28
|
kelch-like family member 28 |
| chr1_+_156698708 | 13.15 |
ENST00000519086.1
|
RRNAD1
|
ribosomal RNA adenine dimethylase domain containing 1 |
| chr11_-_64885111 | 12.54 |
ENST00000528598.1
ENST00000310597.4 |
ZNHIT2
|
zinc finger, HIT-type containing 2 |
| chr3_-_128879875 | 12.47 |
ENST00000418265.1
ENST00000393292.3 ENST00000273541.8 |
ISY1-RAB43
ISY1
|
ISY1-RAB43 readthrough ISY1 splicing factor homolog (S. cerevisiae) |
| chr20_+_49575342 | 11.38 |
ENST00000244051.1
|
MOCS3
|
molybdenum cofactor synthesis 3 |
| chr20_-_48532019 | 11.13 |
ENST00000289431.5
|
SPATA2
|
spermatogenesis associated 2 |
| chr12_-_6798616 | 10.84 |
ENST00000355772.4
ENST00000417772.3 ENST00000396801.3 ENST00000396799.2 |
ZNF384
|
zinc finger protein 384 |
| chr6_+_111580508 | 10.84 |
ENST00000368847.4
|
KIAA1919
|
KIAA1919 |
| chr8_+_104427581 | 10.48 |
ENST00000521716.1
ENST00000521971.1 ENST00000519682.1 |
DCAF13
|
DDB1 and CUL4 associated factor 13 |
| chr5_+_140739537 | 10.47 |
ENST00000522605.1
|
PCDHGB2
|
protocadherin gamma subfamily B, 2 |
| chr11_+_71791849 | 10.46 |
ENST00000423494.2
ENST00000539587.1 ENST00000538478.1 ENST00000324866.7 ENST00000439209.1 |
LRTOMT
|
leucine rich transmembrane and O-methyltransferase domain containing |
| chr2_-_110371664 | 10.35 |
ENST00000545389.1
ENST00000423520.1 |
SEPT10
|
septin 10 |
| chr1_-_109618566 | 10.33 |
ENST00000338366.5
|
TAF13
|
TAF13 RNA polymerase II, TATA box binding protein (TBP)-associated factor, 18kDa |
| chr16_+_29674540 | 10.33 |
ENST00000436527.1
ENST00000360121.3 ENST00000449759.1 |
SPN
QPRT
|
sialophorin quinolinate phosphoribosyltransferase |
| chr1_-_118472216 | 10.28 |
ENST00000369443.5
|
GDAP2
|
ganglioside induced differentiation associated protein 2 |
| chr2_+_32502952 | 10.24 |
ENST00000238831.4
|
YIPF4
|
Yip1 domain family, member 4 |
| chr17_+_1674982 | 9.69 |
ENST00000572048.1
ENST00000573763.1 |
SERPINF1
|
serpin peptidase inhibitor, clade F (alpha-2 antiplasmin, pigment epithelium derived factor), member 1 |
| chr14_+_45431379 | 9.65 |
ENST00000361577.3
ENST00000361462.2 ENST00000382233.2 |
FAM179B
|
family with sequence similarity 179, member B |
| chr18_-_72265035 | 9.57 |
ENST00000585279.1
ENST00000580048.1 |
LINC00909
|
long intergenic non-protein coding RNA 909 |
| chr11_+_47270475 | 9.53 |
ENST00000481889.2
ENST00000436778.1 ENST00000531660.1 ENST00000407404.1 |
NR1H3
|
nuclear receptor subfamily 1, group H, member 3 |
| chr11_+_71791693 | 9.39 |
ENST00000289488.2
ENST00000447974.1 |
LRTOMT
|
leucine rich transmembrane and O-methyltransferase domain containing |
| chr5_-_132202329 | 9.12 |
ENST00000378673.2
|
GDF9
|
growth differentiation factor 9 |
| chr20_+_44746885 | 9.10 |
ENST00000372285.3
|
CD40
|
CD40 molecule, TNF receptor superfamily member 5 |
| chr6_+_31515337 | 9.09 |
ENST00000376148.4
ENST00000376145.4 |
NFKBIL1
|
nuclear factor of kappa light polypeptide gene enhancer in B-cells inhibitor-like 1 |
| chr12_-_12491608 | 9.06 |
ENST00000545735.1
|
MANSC1
|
MANSC domain containing 1 |
| chr16_+_31085714 | 9.06 |
ENST00000300850.5
ENST00000564189.1 ENST00000428260.1 |
ZNF646
|
zinc finger protein 646 |
| chr15_+_90808919 | 9.03 |
ENST00000379095.3
|
NGRN
|
neugrin, neurite outgrowth associated |
| chr6_-_33239712 | 9.02 |
ENST00000436044.2
|
VPS52
|
vacuolar protein sorting 52 homolog (S. cerevisiae) |
| chrX_+_16737718 | 9.01 |
ENST00000380155.3
|
SYAP1
|
synapse associated protein 1 |
| chr19_+_56186606 | 8.98 |
ENST00000085079.7
|
EPN1
|
epsin 1 |
| chr3_-_72897545 | 8.97 |
ENST00000325599.8
|
SHQ1
|
SHQ1, H/ACA ribonucleoprotein assembly factor |
| chr14_-_53417732 | 8.86 |
ENST00000399304.3
ENST00000395631.2 ENST00000341590.3 ENST00000343279.4 |
FERMT2
|
fermitin family member 2 |
| chr3_+_32726774 | 8.79 |
ENST00000538368.1
|
CNOT10
|
CCR4-NOT transcription complex, subunit 10 |
| chr11_+_47270436 | 8.79 |
ENST00000395397.3
ENST00000405576.1 |
NR1H3
|
nuclear receptor subfamily 1, group H, member 3 |
| chr12_-_123215306 | 8.74 |
ENST00000356987.2
ENST00000436083.2 |
HCAR1
|
hydroxycarboxylic acid receptor 1 |
| chr15_+_71184931 | 8.74 |
ENST00000560369.1
ENST00000260382.5 |
LRRC49
|
leucine rich repeat containing 49 |
| chr10_+_127408110 | 8.61 |
ENST00000356792.4
|
C10orf137
|
erythroid differentiation regulatory factor 1 |
| chr20_+_43104508 | 8.61 |
ENST00000262605.4
ENST00000372904.3 |
TTPAL
|
tocopherol (alpha) transfer protein-like |
| chr19_-_16653226 | 8.56 |
ENST00000198939.6
|
CHERP
|
calcium homeostasis endoplasmic reticulum protein |
| chr16_+_4784458 | 8.47 |
ENST00000590191.1
|
C16orf71
|
chromosome 16 open reading frame 71 |
| chr19_+_56186557 | 8.46 |
ENST00000270460.6
|
EPN1
|
epsin 1 |
| chr19_-_16653325 | 8.39 |
ENST00000546361.2
|
CHERP
|
calcium homeostasis endoplasmic reticulum protein |
| chr4_-_140005341 | 8.21 |
ENST00000379549.2
ENST00000512627.1 |
ELF2
|
E74-like factor 2 (ets domain transcription factor) |
| chr17_-_18218270 | 8.18 |
ENST00000321105.5
|
TOP3A
|
topoisomerase (DNA) III alpha |
| chr10_+_124320156 | 8.11 |
ENST00000338354.3
ENST00000344338.3 ENST00000330163.4 ENST00000368909.3 ENST00000368955.3 ENST00000368956.2 |
DMBT1
|
deleted in malignant brain tumors 1 |
| chr5_-_35230434 | 8.10 |
ENST00000504500.1
|
PRLR
|
prolactin receptor |
| chr17_+_37844331 | 8.04 |
ENST00000578199.1
ENST00000406381.2 |
ERBB2
|
v-erb-b2 avian erythroblastic leukemia viral oncogene homolog 2 |
| chr22_-_27620603 | 7.98 |
ENST00000418271.1
ENST00000444114.1 |
RP5-1172A22.1
|
RP5-1172A22.1 |
| chr12_+_94071129 | 7.93 |
ENST00000552983.1
ENST00000332896.3 ENST00000552033.1 ENST00000548483.1 |
CRADD
|
CASP2 and RIPK1 domain containing adaptor with death domain |
| chr11_-_47270341 | 7.88 |
ENST00000529444.1
ENST00000530453.1 ENST00000537863.1 ENST00000529788.1 ENST00000444355.2 ENST00000527256.1 ENST00000529663.1 ENST00000256997.3 |
ACP2
|
acid phosphatase 2, lysosomal |
| chr1_-_169337176 | 7.87 |
ENST00000472647.1
ENST00000367811.3 |
NME7
|
NME/NM23 family member 7 |
| chr12_-_6798523 | 7.84 |
ENST00000319770.3
|
ZNF384
|
zinc finger protein 384 |
| chr12_-_6798410 | 7.79 |
ENST00000361959.3
ENST00000436774.2 ENST00000544482.1 |
ZNF384
|
zinc finger protein 384 |
| chr3_+_47324424 | 7.75 |
ENST00000437353.1
ENST00000232766.5 ENST00000455924.2 |
KLHL18
|
kelch-like family member 18 |
| chr17_-_37844267 | 7.74 |
ENST00000579146.1
ENST00000378011.4 ENST00000429199.2 ENST00000300658.4 |
PGAP3
|
post-GPI attachment to proteins 3 |
| chr1_+_228353495 | 7.71 |
ENST00000366711.3
|
IBA57
|
IBA57, iron-sulfur cluster assembly homolog (S. cerevisiae) |
| chr19_-_4559814 | 7.57 |
ENST00000586582.1
|
SEMA6B
|
sema domain, transmembrane domain (TM), and cytoplasmic domain, (semaphorin) 6B |
| chr16_+_29674277 | 7.53 |
ENST00000395389.2
|
SPN
|
sialophorin |
| chr13_+_31191920 | 7.48 |
ENST00000255304.4
|
USPL1
|
ubiquitin specific peptidase like 1 |
| chr5_-_93447333 | 7.47 |
ENST00000395965.3
ENST00000505869.1 ENST00000509163.1 |
FAM172A
|
family with sequence similarity 172, member A |
| chrX_-_40594755 | 7.42 |
ENST00000324817.1
|
MED14
|
mediator complex subunit 14 |
| chr10_+_124320195 | 7.37 |
ENST00000359586.6
|
DMBT1
|
deleted in malignant brain tumors 1 |
| chr15_+_74833518 | 7.34 |
ENST00000346246.5
|
ARID3B
|
AT rich interactive domain 3B (BRIGHT-like) |
| chr16_-_3306587 | 7.25 |
ENST00000541159.1
ENST00000536379.1 ENST00000219596.1 ENST00000339854.4 |
MEFV
|
Mediterranean fever |
| chr1_+_10003486 | 7.25 |
ENST00000403197.1
ENST00000377205.1 |
NMNAT1
|
nicotinamide nucleotide adenylyltransferase 1 |
| chr17_+_4843679 | 7.23 |
ENST00000576229.1
|
RNF167
|
ring finger protein 167 |
| chr15_+_51200871 | 7.19 |
ENST00000560508.1
|
AP4E1
|
adaptor-related protein complex 4, epsilon 1 subunit |
| chr5_+_82373317 | 7.14 |
ENST00000282268.3
ENST00000338635.6 |
XRCC4
|
X-ray repair complementing defective repair in Chinese hamster cells 4 |
| chr12_+_53773944 | 7.03 |
ENST00000551969.1
ENST00000327443.4 |
SP1
|
Sp1 transcription factor |
| chr11_+_131781290 | 7.03 |
ENST00000425719.2
ENST00000374784.1 |
NTM
|
neurotrimin |
| chr2_+_138721850 | 6.99 |
ENST00000329366.4
ENST00000280097.3 |
HNMT
|
histamine N-methyltransferase |
| chr2_-_242556900 | 6.97 |
ENST00000402545.1
ENST00000402136.1 |
THAP4
|
THAP domain containing 4 |
| chr12_+_94071341 | 6.97 |
ENST00000542893.2
|
CRADD
|
CASP2 and RIPK1 domain containing adaptor with death domain |
| chr19_+_15218180 | 6.90 |
ENST00000342784.2
ENST00000597977.1 ENST00000600440.1 |
SYDE1
|
synapse defective 1, Rho GTPase, homolog 1 (C. elegans) |
| chr15_+_51200859 | 6.89 |
ENST00000261842.5
|
AP4E1
|
adaptor-related protein complex 4, epsilon 1 subunit |
| chr17_+_56315936 | 6.83 |
ENST00000543544.1
|
LPO
|
lactoperoxidase |
| chr5_+_149380256 | 6.83 |
ENST00000502717.1
|
HMGXB3
|
HMG box domain containing 3 |
| chr4_+_76439665 | 6.83 |
ENST00000508105.1
ENST00000311638.3 ENST00000380837.3 ENST00000507556.1 ENST00000504190.1 ENST00000507885.1 ENST00000502620.1 ENST00000514480.1 |
THAP6
|
THAP domain containing 6 |
| chr5_+_82373379 | 6.77 |
ENST00000396027.4
ENST00000511817.1 |
XRCC4
|
X-ray repair complementing defective repair in Chinese hamster cells 4 |
| chr17_+_4843413 | 6.75 |
ENST00000572430.1
ENST00000262482.6 |
RNF167
|
ring finger protein 167 |
| chr14_-_81687197 | 6.72 |
ENST00000553612.1
|
GTF2A1
|
general transcription factor IIA, 1, 19/37kDa |
| chr7_-_35734730 | 6.72 |
ENST00000396081.1
ENST00000311350.3 |
HERPUD2
|
HERPUD family member 2 |
| chr6_+_30524663 | 6.72 |
ENST00000376560.3
|
PRR3
|
proline rich 3 |
| chr21_-_36421535 | 6.70 |
ENST00000416754.1
ENST00000437180.1 ENST00000455571.1 |
RUNX1
|
runt-related transcription factor 1 |
| chr1_+_24969755 | 6.67 |
ENST00000447431.2
ENST00000374389.4 |
SRRM1
|
serine/arginine repetitive matrix 1 |
| chr13_-_33760216 | 6.65 |
ENST00000255486.4
|
STARD13
|
StAR-related lipid transfer (START) domain containing 13 |
| chr5_-_137090028 | 6.61 |
ENST00000314940.4
|
HNRNPA0
|
heterogeneous nuclear ribonucleoprotein A0 |
| chr1_+_43766642 | 6.58 |
ENST00000372476.3
|
TIE1
|
tyrosine kinase with immunoglobulin-like and EGF-like domains 1 |
| chr6_-_11382478 | 6.57 |
ENST00000397378.3
ENST00000513989.1 ENST00000508546.1 ENST00000504387.1 |
NEDD9
|
neural precursor cell expressed, developmentally down-regulated 9 |
| chr20_+_44746939 | 6.54 |
ENST00000372276.3
|
CD40
|
CD40 molecule, TNF receptor superfamily member 5 |
| chr3_+_119316721 | 6.53 |
ENST00000488919.1
ENST00000495992.1 |
PLA1A
|
phospholipase A1 member A |
| chr17_+_4843654 | 6.51 |
ENST00000575111.1
|
RNF167
|
ring finger protein 167 |
| chr14_+_93389425 | 6.51 |
ENST00000216492.5
ENST00000334654.4 |
CHGA
|
chromogranin A (parathyroid secretory protein 1) |
| chr14_-_81687575 | 6.51 |
ENST00000434192.2
|
GTF2A1
|
general transcription factor IIA, 1, 19/37kDa |
| chr11_-_104035088 | 6.47 |
ENST00000302251.5
|
PDGFD
|
platelet derived growth factor D |
| chr11_-_104034827 | 6.47 |
ENST00000393158.2
|
PDGFD
|
platelet derived growth factor D |
| chr2_-_238323007 | 6.45 |
ENST00000295550.4
|
COL6A3
|
collagen, type VI, alpha 3 |
| chr10_-_79789291 | 6.44 |
ENST00000372371.3
|
POLR3A
|
polymerase (RNA) III (DNA directed) polypeptide A, 155kDa |
| chrX_-_50557014 | 6.41 |
ENST00000376020.2
|
SHROOM4
|
shroom family member 4 |
| chr2_+_54198210 | 6.41 |
ENST00000607452.1
ENST00000422521.2 |
ACYP2
|
acylphosphatase 2, muscle type |
| chr7_-_44924939 | 6.40 |
ENST00000395699.2
|
PURB
|
purine-rich element binding protein B |
| chr2_-_238322770 | 6.39 |
ENST00000472056.1
|
COL6A3
|
collagen, type VI, alpha 3 |
| chr11_-_6502580 | 6.32 |
ENST00000423813.2
ENST00000396777.3 |
ARFIP2
|
ADP-ribosylation factor interacting protein 2 |
| chr12_+_50794730 | 6.31 |
ENST00000523389.1
ENST00000518561.1 ENST00000347328.5 ENST00000550260.1 |
LARP4
|
La ribonucleoprotein domain family, member 4 |
| chr3_-_15469006 | 6.28 |
ENST00000443029.1
ENST00000383790.3 ENST00000383789.5 |
METTL6
|
methyltransferase like 6 |
| chr2_-_238322800 | 6.27 |
ENST00000392004.3
ENST00000433762.1 ENST00000347401.3 ENST00000353578.4 ENST00000346358.4 ENST00000392003.2 |
COL6A3
|
collagen, type VI, alpha 3 |
| chr18_+_71815743 | 6.26 |
ENST00000169551.6
ENST00000580087.1 |
TIMM21
|
translocase of inner mitochondrial membrane 21 homolog (yeast) |
| chr17_-_79269067 | 6.23 |
ENST00000288439.5
ENST00000374759.3 |
SLC38A10
|
solute carrier family 38, member 10 |
| chr7_-_129845188 | 6.21 |
ENST00000462753.1
ENST00000471077.1 ENST00000473456.1 ENST00000336804.8 |
TMEM209
|
transmembrane protein 209 |
| chr2_+_110371905 | 6.18 |
ENST00000356454.3
|
SOWAHC
|
sosondowah ankyrin repeat domain family member C |
| chr6_+_126240442 | 6.16 |
ENST00000448104.1
ENST00000438495.1 ENST00000444128.1 |
NCOA7
|
nuclear receptor coactivator 7 |
| chr5_-_79287060 | 6.14 |
ENST00000512560.1
ENST00000509852.1 ENST00000512528.1 |
MTX3
|
metaxin 3 |
| chr6_+_43543864 | 6.11 |
ENST00000372236.4
ENST00000535400.1 |
POLH
|
polymerase (DNA directed), eta |
| chr14_-_77923897 | 6.09 |
ENST00000343765.2
ENST00000327028.4 ENST00000556412.1 ENST00000557466.1 ENST00000448935.2 ENST00000553888.1 ENST00000557658.1 |
VIPAS39
|
VPS33B interacting protein, apical-basolateral polarity regulator, spe-39 homolog |
| chr2_-_69870835 | 6.09 |
ENST00000409085.4
ENST00000406297.3 |
AAK1
|
AP2 associated kinase 1 |
| chr6_+_36853607 | 6.08 |
ENST00000480824.2
ENST00000355190.3 ENST00000373685.1 |
C6orf89
|
chromosome 6 open reading frame 89 |
| chr19_+_16999654 | 6.03 |
ENST00000248076.3
|
F2RL3
|
coagulation factor II (thrombin) receptor-like 3 |
| chr6_+_30525051 | 6.01 |
ENST00000376557.3
|
PRR3
|
proline rich 3 |
| chr9_+_35732312 | 5.98 |
ENST00000353704.2
|
CREB3
|
cAMP responsive element binding protein 3 |
| chr1_+_1260147 | 5.92 |
ENST00000343938.4
|
GLTPD1
|
glycolipid transfer protein domain containing 1 |
| chr16_+_66968343 | 5.91 |
ENST00000417689.1
ENST00000561697.1 ENST00000317091.4 ENST00000566182.1 |
CES2
|
carboxylesterase 2 |
| chr9_-_91793675 | 5.90 |
ENST00000375835.4
ENST00000375830.1 |
SHC3
|
SHC (Src homology 2 domain containing) transforming protein 3 |
| chr3_-_38071122 | 5.87 |
ENST00000334661.4
|
PLCD1
|
phospholipase C, delta 1 |
| chr1_+_11866270 | 5.82 |
ENST00000376497.3
ENST00000376487.3 ENST00000376496.3 |
CLCN6
|
chloride channel, voltage-sensitive 6 |
| chr21_-_36421626 | 5.81 |
ENST00000300305.3
|
RUNX1
|
runt-related transcription factor 1 |
| chrX_-_10851762 | 5.80 |
ENST00000380785.1
ENST00000380787.1 |
MID1
|
midline 1 (Opitz/BBB syndrome) |
| chr5_+_141303373 | 5.80 |
ENST00000432126.2
ENST00000194118.4 |
KIAA0141
|
KIAA0141 |
| chr8_-_56685859 | 5.80 |
ENST00000523423.1
ENST00000523073.1 ENST00000519784.1 ENST00000434581.2 ENST00000519780.1 ENST00000521229.1 ENST00000522576.1 ENST00000523180.1 ENST00000522090.1 |
TMEM68
|
transmembrane protein 68 |
| chr1_-_157108266 | 5.77 |
ENST00000326786.4
|
ETV3
|
ets variant 3 |
| chr19_-_4338783 | 5.76 |
ENST00000601482.1
ENST00000600324.1 |
STAP2
|
signal transducing adaptor family member 2 |
| chr9_-_130616915 | 5.65 |
ENST00000344849.3
|
ENG
|
endoglin |
| chr17_+_32582293 | 5.57 |
ENST00000580907.1
ENST00000225831.4 |
CCL2
|
chemokine (C-C motif) ligand 2 |
| chr7_-_44530479 | 5.57 |
ENST00000355451.7
|
NUDCD3
|
NudC domain containing 3 |
| chr19_+_47759716 | 5.57 |
ENST00000221922.6
|
CCDC9
|
coiled-coil domain containing 9 |
| chr6_-_31620403 | 5.57 |
ENST00000451898.1
ENST00000439687.2 ENST00000362049.6 ENST00000424480.1 |
BAG6
|
BCL2-associated athanogene 6 |
| chr9_-_130617029 | 5.54 |
ENST00000373203.4
|
ENG
|
endoglin |
| chr3_+_119316689 | 5.54 |
ENST00000273371.4
|
PLA1A
|
phospholipase A1 member A |
| chr11_-_3862059 | 5.47 |
ENST00000396978.1
|
RHOG
|
ras homolog family member G |
| chr1_+_204485503 | 5.44 |
ENST00000367182.3
ENST00000507825.2 |
MDM4
|
Mdm4 p53 binding protein homolog (mouse) |
| chr6_+_71122974 | 5.43 |
ENST00000418814.2
|
FAM135A
|
family with sequence similarity 135, member A |
| chr2_+_25016282 | 5.42 |
ENST00000260662.1
|
CENPO
|
centromere protein O |
| chr11_+_63655987 | 5.34 |
ENST00000509502.2
ENST00000512060.1 |
MARK2
|
MAP/microtubule affinity-regulating kinase 2 |
| chr4_-_17812309 | 5.28 |
ENST00000382247.1
ENST00000536863.1 |
DCAF16
|
DDB1 and CUL4 associated factor 16 |
| chr15_-_41120896 | 5.25 |
ENST00000299174.5
ENST00000427255.2 |
PPP1R14D
|
protein phosphatase 1, regulatory (inhibitor) subunit 14D |
| chr5_-_58652788 | 5.25 |
ENST00000405755.2
|
PDE4D
|
phosphodiesterase 4D, cAMP-specific |
| chr2_+_17935119 | 5.24 |
ENST00000317402.7
|
GEN1
|
GEN1 Holliday junction 5' flap endonuclease |
| chr7_-_99149715 | 5.21 |
ENST00000449309.1
|
FAM200A
|
family with sequence similarity 200, member A |
| chr12_+_108908962 | 5.20 |
ENST00000552695.1
ENST00000552758.1 ENST00000361549.2 |
FICD
|
FIC domain containing |
| chr2_+_25015968 | 5.19 |
ENST00000380834.2
ENST00000473706.1 |
CENPO
|
centromere protein O |
| chr8_-_56685966 | 5.18 |
ENST00000334667.2
|
TMEM68
|
transmembrane protein 68 |
| chr19_-_4338838 | 5.17 |
ENST00000594605.1
|
STAP2
|
signal transducing adaptor family member 2 |
| chr5_-_43412418 | 5.16 |
ENST00000537013.1
ENST00000361115.4 |
CCL28
|
chemokine (C-C motif) ligand 28 |
| chr3_-_120170052 | 5.14 |
ENST00000295633.3
|
FSTL1
|
follistatin-like 1 |
| chr7_-_129845313 | 5.13 |
ENST00000397622.2
|
TMEM209
|
transmembrane protein 209 |
| chr15_-_90234006 | 5.09 |
ENST00000300056.3
ENST00000559170.1 |
PEX11A
|
peroxisomal biogenesis factor 11 alpha |
| chr3_-_149688655 | 5.08 |
ENST00000461930.1
ENST00000423691.2 ENST00000490975.1 ENST00000461868.1 ENST00000452853.2 |
PFN2
|
profilin 2 |
| chr6_-_30524951 | 5.06 |
ENST00000376621.3
|
GNL1
|
guanine nucleotide binding protein-like 1 |
| chr17_-_74722672 | 5.03 |
ENST00000397625.4
ENST00000445478.2 |
JMJD6
|
jumonji domain containing 6 |
| chr6_+_43739697 | 5.03 |
ENST00000230480.6
|
VEGFA
|
vascular endothelial growth factor A |
| chr20_-_43883197 | 5.02 |
ENST00000338380.2
|
SLPI
|
secretory leukocyte peptidase inhibitor |
| chr4_+_48833234 | 5.00 |
ENST00000510824.1
ENST00000425583.2 |
OCIAD1
|
OCIA domain containing 1 |
| chr16_+_69373323 | 5.00 |
ENST00000254940.5
|
NIP7
|
NIP7, nucleolar pre-rRNA processing protein |
| chr2_+_118846008 | 4.99 |
ENST00000245787.4
|
INSIG2
|
insulin induced gene 2 |
| chr2_-_220173685 | 4.97 |
ENST00000423636.2
ENST00000442029.1 ENST00000412847.1 |
PTPRN
|
protein tyrosine phosphatase, receptor type, N |
| chr7_-_130080818 | 4.96 |
ENST00000343969.5
ENST00000541543.1 ENST00000489512.1 |
CEP41
|
centrosomal protein 41kDa |
| chr4_+_48833119 | 4.93 |
ENST00000444354.2
ENST00000509963.1 ENST00000509246.1 |
OCIAD1
|
OCIA domain containing 1 |
| chr1_-_113615699 | 4.91 |
ENST00000421157.1
|
RP11-31F15.2
|
RP11-31F15.2 |
| chr1_-_144995074 | 4.91 |
ENST00000534536.1
|
PDE4DIP
|
phosphodiesterase 4D interacting protein |
| chr11_+_6502675 | 4.91 |
ENST00000254616.6
ENST00000530751.1 |
TIMM10B
|
translocase of inner mitochondrial membrane 10 homolog B (yeast) |
| chr8_-_134309335 | 4.90 |
ENST00000522890.1
ENST00000323851.7 ENST00000518176.1 ENST00000354944.5 ENST00000537882.1 ENST00000522476.1 ENST00000518066.1 ENST00000521544.1 ENST00000518480.1 ENST00000523892.1 |
NDRG1
|
N-myc downstream regulated 1 |
| chr19_-_10341948 | 4.89 |
ENST00000590320.1
ENST00000592342.1 ENST00000588952.1 |
S1PR2
DNMT1
|
sphingosine-1-phosphate receptor 2 DNA (cytosine-5-)-methyltransferase 1 |
| chr6_-_112575687 | 4.88 |
ENST00000521398.1
ENST00000424408.2 ENST00000243219.3 |
LAMA4
|
laminin, alpha 4 |
| chr20_+_43595115 | 4.86 |
ENST00000372806.3
ENST00000396731.4 ENST00000372801.1 ENST00000499879.2 |
STK4
|
serine/threonine kinase 4 |
| chr16_-_71843047 | 4.85 |
ENST00000299980.4
ENST00000393512.3 |
AP1G1
|
adaptor-related protein complex 1, gamma 1 subunit |
| chr6_+_43543942 | 4.84 |
ENST00000372226.1
ENST00000443535.1 |
POLH
|
polymerase (DNA directed), eta |
| chr20_-_48532046 | 4.82 |
ENST00000543716.1
|
SPATA2
|
spermatogenesis associated 2 |
| chr7_+_156742399 | 4.81 |
ENST00000275820.3
|
NOM1
|
nucleolar protein with MIF4G domain 1 |
| chr4_-_46911248 | 4.80 |
ENST00000355591.3
ENST00000505102.1 |
COX7B2
|
cytochrome c oxidase subunit VIIb2 |
| chr11_-_102401469 | 4.76 |
ENST00000260227.4
|
MMP7
|
matrix metallopeptidase 7 (matrilysin, uterine) |
| chr11_+_65479702 | 4.75 |
ENST00000530446.1
ENST00000534104.1 ENST00000530605.1 ENST00000528198.1 ENST00000531880.1 ENST00000534650.1 |
KAT5
|
K(lysine) acetyltransferase 5 |
| chr20_-_34287259 | 4.73 |
ENST00000397425.1
ENST00000540053.1 ENST00000541387.1 ENST00000374092.4 |
NFS1
|
NFS1 cysteine desulfurase |
| chr6_-_33168391 | 4.72 |
ENST00000374685.4
ENST00000413614.2 ENST00000374680.3 |
RXRB
|
retinoid X receptor, beta |
| chr8_-_42397037 | 4.72 |
ENST00000342228.3
|
SLC20A2
|
solute carrier family 20 (phosphate transporter), member 2 |
| chr2_-_225266711 | 4.71 |
ENST00000389874.3
|
FAM124B
|
family with sequence similarity 124B |
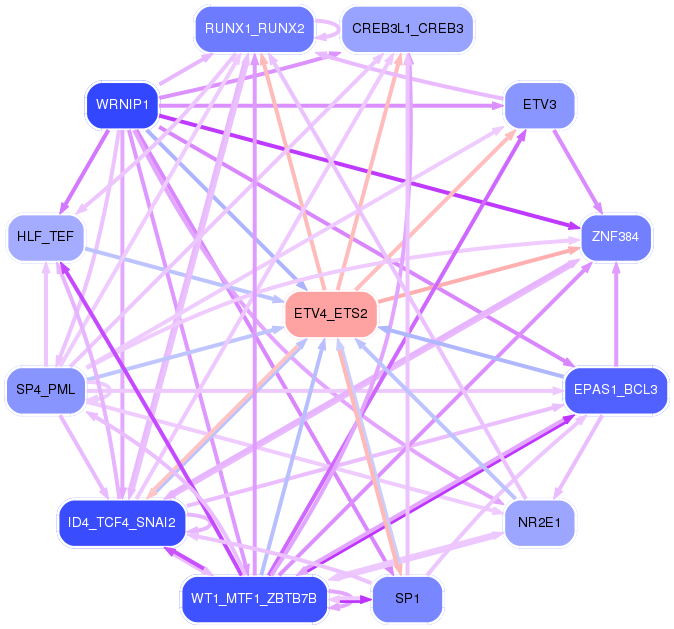
Network of associatons between targets according to the STRING database.

First level regulatory network of ETV4_ETS2
Gene Ontology Analysis
Gene overrepresentation in biological_process category:
| Log-likelihood per target | Total log-likelihood | Term | Description |
|---|---|---|---|
| 6.2 | 18.6 | GO:1903336 | negative regulation of vacuolar transport(GO:1903336) |
| 6.1 | 18.3 | GO:0090341 | negative regulation of secretion of lysosomal enzymes(GO:0090341) |
| 4.6 | 18.4 | GO:0034445 | regulation of plasma lipoprotein particle oxidation(GO:0034444) negative regulation of plasma lipoprotein particle oxidation(GO:0034445) |
| 4.5 | 17.9 | GO:0002884 | regulation of type IV hypersensitivity(GO:0001807) negative regulation of hypersensitivity(GO:0002884) |
| 4.4 | 13.2 | GO:0007439 | ectodermal digestive tract development(GO:0007439) embryonic ectodermal digestive tract development(GO:0048611) |
| 4.3 | 12.9 | GO:2000439 | positive regulation of monocyte extravasation(GO:2000439) |
| 4.2 | 12.7 | GO:0034227 | tRNA thio-modification(GO:0034227) |
| 3.8 | 3.8 | GO:1900195 | positive regulation of oocyte maturation(GO:1900195) |
| 3.7 | 11.2 | GO:0001300 | chronological cell aging(GO:0001300) |
| 3.0 | 9.1 | GO:2000870 | regulation of progesterone secretion(GO:2000870) |
| 2.8 | 19.6 | GO:0033590 | response to cobalamin(GO:0033590) |
| 2.7 | 35.5 | GO:0033617 | mitochondrial respiratory chain complex IV assembly(GO:0033617) mitochondrial respiratory chain complex IV biogenesis(GO:0097034) |
| 2.5 | 9.9 | GO:0000350 | generation of catalytic spliceosome for second transesterification step(GO:0000350) |
| 2.4 | 7.3 | GO:0018282 | metal incorporation into metallo-sulfur cluster(GO:0018282) iron incorporation into metallo-sulfur cluster(GO:0018283) |
| 2.4 | 7.3 | GO:1900226 | negative regulation of NLRP3 inflammasome complex assembly(GO:1900226) |
| 2.4 | 11.9 | GO:0071279 | cellular response to cobalt ion(GO:0071279) |
| 2.4 | 7.1 | GO:1990502 | dense core granule maturation(GO:1990502) |
| 2.4 | 7.1 | GO:0055048 | regulation of spindle elongation(GO:0032887) regulation of mitotic spindle elongation(GO:0032888) anastral spindle assembly(GO:0055048) protein localization to spindle pole body(GO:0071988) regulation of protein localization to spindle pole body(GO:1902363) positive regulation of protein localization to spindle pole body(GO:1902365) positive regulation of mitotic spindle elongation(GO:1902846) |
| 2.3 | 7.0 | GO:0072683 | T cell extravasation(GO:0072683) |
| 2.3 | 9.2 | GO:1904379 | maintenance of unfolded protein(GO:0036506) protein localization to cytosolic proteasome complex(GO:1904327) maintenance of unfolded protein involved in ERAD pathway(GO:1904378) protein localization to cytosolic proteasome complex involved in ERAD pathway(GO:1904379) |
| 2.3 | 4.5 | GO:0036369 | transcription factor catabolic process(GO:0036369) |
| 2.2 | 2.2 | GO:0071505 | response to mycophenolic acid(GO:0071505) cellular response to mycophenolic acid(GO:0071506) |
| 2.2 | 6.5 | GO:1901899 | dense core granule biogenesis(GO:0061110) positive regulation of relaxation of cardiac muscle(GO:1901899) regulation of dense core granule biogenesis(GO:2000705) |
| 2.1 | 12.8 | GO:0038161 | prolactin signaling pathway(GO:0038161) |
| 2.1 | 17.0 | GO:0051533 | positive regulation of NFAT protein import into nucleus(GO:0051533) |
| 2.1 | 8.4 | GO:0044375 | regulation of peroxisome size(GO:0044375) |
| 2.1 | 8.4 | GO:0043321 | regulation of natural killer cell degranulation(GO:0043321) positive regulation of natural killer cell degranulation(GO:0043323) |
| 1.9 | 3.8 | GO:0032607 | interferon-alpha production(GO:0032607) |
| 1.9 | 3.7 | GO:0010637 | negative regulation of mitochondrial fusion(GO:0010637) |
| 1.8 | 14.7 | GO:0033088 | negative regulation of immature T cell proliferation in thymus(GO:0033088) |
| 1.8 | 9.1 | GO:2000189 | positive regulation of cholesterol homeostasis(GO:2000189) |
| 1.8 | 14.5 | GO:0017185 | peptidyl-lysine hydroxylation(GO:0017185) |
| 1.8 | 8.8 | GO:0070829 | response to vitamin B2(GO:0033274) heterochromatin maintenance(GO:0070829) |
| 1.7 | 8.7 | GO:0019323 | pentose catabolic process(GO:0019323) |
| 1.7 | 5.2 | GO:0071139 | resolution of recombination intermediates(GO:0071139) resolution of mitotic recombination intermediates(GO:0071140) |
| 1.7 | 5.0 | GO:1903570 | regulation of protein kinase D signaling(GO:1903570) positive regulation of protein kinase D signaling(GO:1903572) |
| 1.7 | 1.7 | GO:0031860 | telomeric 3' overhang formation(GO:0031860) |
| 1.6 | 4.9 | GO:0002589 | regulation of antigen processing and presentation of peptide antigen via MHC class I(GO:0002589) negative regulation of antigen processing and presentation of peptide antigen via MHC class I(GO:0002590) positive regulation of iron ion transport(GO:0034758) positive regulation of iron ion transmembrane transport(GO:0034761) regulation of iron ion import(GO:1900390) regulation of ferrous iron import into cell(GO:1903989) positive regulation of ferrous iron import into cell(GO:1903991) regulation of ferrous iron binding(GO:1904432) positive regulation of ferrous iron binding(GO:1904434) regulation of transferrin receptor binding(GO:1904435) positive regulation of transferrin receptor binding(GO:1904437) regulation of ferrous iron import across plasma membrane(GO:1904438) positive regulation of ferrous iron import across plasma membrane(GO:1904440) response to iron ion starvation(GO:1990641) |
| 1.6 | 16.3 | GO:2000601 | positive regulation of Arp2/3 complex-mediated actin nucleation(GO:2000601) |
| 1.6 | 10.9 | GO:0071494 | cellular response to UV-C(GO:0071494) |
| 1.5 | 15.5 | GO:0043152 | induction of bacterial agglutination(GO:0043152) |
| 1.5 | 7.7 | GO:0046203 | spermidine catabolic process(GO:0046203) |
| 1.5 | 4.6 | GO:0002071 | glandular epithelial cell maturation(GO:0002071) type B pancreatic cell maturation(GO:0072560) |
| 1.5 | 4.5 | GO:0050748 | negative regulation of lipoprotein metabolic process(GO:0050748) |
| 1.5 | 1.5 | GO:0035331 | negative regulation of hippo signaling(GO:0035331) |
| 1.4 | 4.3 | GO:0006265 | DNA topological change(GO:0006265) |
| 1.4 | 1.4 | GO:1902263 | apoptotic process involved in embryonic digit morphogenesis(GO:1902263) |
| 1.4 | 5.7 | GO:2000232 | regulation of rRNA processing(GO:2000232) |
| 1.4 | 7.1 | GO:0051946 | regulation of amino acid uptake involved in synaptic transmission(GO:0051941) regulation of glutamate uptake involved in transmission of nerve impulse(GO:0051946) regulation of L-glutamate import(GO:1900920) |
| 1.4 | 1.4 | GO:0007089 | traversing start control point of mitotic cell cycle(GO:0007089) |
| 1.4 | 4.1 | GO:0014033 | neural crest cell development(GO:0014032) neural crest cell differentiation(GO:0014033) |
| 1.3 | 3.9 | GO:0006524 | alanine metabolic process(GO:0006522) alanine catabolic process(GO:0006524) pyruvate family amino acid metabolic process(GO:0009078) pyruvate family amino acid catabolic process(GO:0009080) |
| 1.3 | 5.1 | GO:0032053 | ciliary basal body organization(GO:0032053) |
| 1.3 | 5.1 | GO:1901165 | positive regulation of trophoblast cell migration(GO:1901165) |
| 1.3 | 3.8 | GO:0045210 | negative regulation of dendritic cell cytokine production(GO:0002731) FasL biosynthetic process(GO:0045210) |
| 1.3 | 3.8 | GO:1900104 | hyaluranon cable assembly(GO:0036118) regulation of hyaluranon cable assembly(GO:1900104) positive regulation of hyaluranon cable assembly(GO:1900106) |
| 1.2 | 9.9 | GO:0015693 | magnesium ion transport(GO:0015693) |
| 1.2 | 6.2 | GO:0003322 | pancreatic A cell development(GO:0003322) |
| 1.2 | 7.4 | GO:0001692 | histamine metabolic process(GO:0001692) |
| 1.2 | 23.4 | GO:0019336 | phenol-containing compound catabolic process(GO:0019336) |
| 1.2 | 4.9 | GO:0010216 | maintenance of DNA methylation(GO:0010216) |
| 1.2 | 6.1 | GO:1901727 | positive regulation of histone deacetylase activity(GO:1901727) |
| 1.2 | 7.2 | GO:0010897 | negative regulation of triglyceride catabolic process(GO:0010897) secretory granule localization(GO:0032252) |
| 1.2 | 6.0 | GO:0006990 | positive regulation of transcription from RNA polymerase II promoter involved in unfolded protein response(GO:0006990) |
| 1.2 | 7.1 | GO:0030421 | defecation(GO:0030421) |
| 1.2 | 3.5 | GO:0036371 | protein localization to M-band(GO:0036309) protein localization to T-tubule(GO:0036371) |
| 1.2 | 8.2 | GO:0023035 | CD40 signaling pathway(GO:0023035) |
| 1.2 | 7.0 | GO:1900239 | phenotypic switching(GO:0036166) regulation of phenotypic switching(GO:1900239) |
| 1.2 | 5.8 | GO:1904579 | response to thapsigargin(GO:1904578) cellular response to thapsigargin(GO:1904579) |
| 1.1 | 5.5 | GO:0043653 | mitochondrial fragmentation involved in apoptotic process(GO:0043653) |
| 1.1 | 4.4 | GO:0045872 | positive regulation of rhodopsin gene expression(GO:0045872) |
| 1.1 | 8.7 | GO:0060363 | cranial suture morphogenesis(GO:0060363) |
| 1.1 | 5.4 | GO:0035936 | testosterone secretion(GO:0035936) regulation of testosterone secretion(GO:2000843) positive regulation of testosterone secretion(GO:2000845) |
| 1.1 | 3.2 | GO:0070428 | negative regulation of interleukin-23 production(GO:0032707) regulation of nucleotide-binding oligomerization domain containing 1 signaling pathway(GO:0070428) |
| 1.1 | 4.3 | GO:0021539 | subthalamus development(GO:0021539) |
| 1.1 | 4.2 | GO:0016559 | peroxisome fission(GO:0016559) |
| 1.0 | 3.1 | GO:0031446 | regulation of fast-twitch skeletal muscle fiber contraction(GO:0031446) positive regulation of fast-twitch skeletal muscle fiber contraction(GO:0031448) relaxation of skeletal muscle(GO:0090076) |
| 1.0 | 5.2 | GO:1903237 | negative regulation of leukocyte tethering or rolling(GO:1903237) |
| 1.0 | 4.0 | GO:0045875 | negative regulation of sister chromatid cohesion(GO:0045875) |
| 1.0 | 3.0 | GO:0072716 | response to actinomycin D(GO:0072716) |
| 1.0 | 6.9 | GO:2000286 | receptor internalization involved in canonical Wnt signaling pathway(GO:2000286) |
| 1.0 | 4.9 | GO:0060800 | regulation of cell differentiation involved in embryonic placenta development(GO:0060800) |
| 1.0 | 3.9 | GO:0019276 | UDP-N-acetylgalactosamine metabolic process(GO:0019276) |
| 1.0 | 2.9 | GO:0019072 | viral genome packaging(GO:0019072) viral RNA genome packaging(GO:0019074) |
| 0.9 | 3.8 | GO:1900229 | biofilm formation(GO:0042710) single-species biofilm formation(GO:0044010) single-species biofilm formation in or on host organism(GO:0044407) regulation of single-species biofilm formation(GO:1900190) negative regulation of single-species biofilm formation(GO:1900191) regulation of single-species biofilm formation in or on host organism(GO:1900228) negative regulation of single-species biofilm formation in or on host organism(GO:1900229) |
| 0.9 | 7.5 | GO:0016926 | protein desumoylation(GO:0016926) |
| 0.9 | 3.7 | GO:1903935 | response to sodium arsenite(GO:1903935) cellular response to sodium arsenite(GO:1903936) |
| 0.9 | 3.7 | GO:0035720 | signal transduction downstream of smoothened(GO:0007227) intraciliary anterograde transport(GO:0035720) ciliary receptor clustering involved in smoothened signaling pathway(GO:0060830) |
| 0.9 | 7.4 | GO:0097084 | vascular smooth muscle cell development(GO:0097084) |
| 0.9 | 18.4 | GO:0031167 | rRNA methylation(GO:0031167) |
| 0.9 | 4.6 | GO:1904274 | tricellular tight junction assembly(GO:1904274) |
| 0.9 | 4.5 | GO:0097498 | endothelial tube lumen extension(GO:0097498) |
| 0.9 | 3.5 | GO:0070317 | negative regulation of G0 to G1 transition(GO:0070317) |
| 0.9 | 12.4 | GO:0034315 | regulation of Arp2/3 complex-mediated actin nucleation(GO:0034315) |
| 0.9 | 13.9 | GO:0071285 | cellular response to lithium ion(GO:0071285) |
| 0.9 | 4.3 | GO:0006398 | mRNA 3'-end processing by stem-loop binding and cleavage(GO:0006398) |
| 0.9 | 4.3 | GO:0097102 | vestibulocochlear nerve structural organization(GO:0021649) neuropilin signaling pathway(GO:0038189) VEGF-activated neuropilin signaling pathway(GO:0038190) positive regulation of cytokine activity(GO:0060301) ganglion morphogenesis(GO:0061552) endothelial tip cell fate specification(GO:0097102) positive regulation of retinal ganglion cell axon guidance(GO:1902336) VEGF-activated neuropilin signaling pathway involved in axon guidance(GO:1902378) dorsal root ganglion morphogenesis(GO:1904835) otic placode development(GO:1905040) |
| 0.9 | 1.7 | GO:0044111 | development involved in symbiotic interaction(GO:0044111) |
| 0.8 | 3.4 | GO:2000645 | negative regulation of receptor catabolic process(GO:2000645) |
| 0.8 | 5.0 | GO:0018095 | protein polyglutamylation(GO:0018095) |
| 0.8 | 9.7 | GO:0097012 | cellular response to granulocyte macrophage colony-stimulating factor stimulus(GO:0097011) response to granulocyte macrophage colony-stimulating factor(GO:0097012) |
| 0.8 | 7.3 | GO:0006531 | aspartate metabolic process(GO:0006531) |
| 0.8 | 2.3 | GO:0021997 | neural plate axis specification(GO:0021997) |
| 0.8 | 5.4 | GO:0045023 | G0 to G1 transition(GO:0045023) |
| 0.8 | 4.7 | GO:0000480 | endonucleolytic cleavage in 5'-ETS of tricistronic rRNA transcript (SSU-rRNA, 5.8S rRNA, LSU-rRNA)(GO:0000480) |
| 0.8 | 4.7 | GO:0098535 | de novo centriole assembly(GO:0098535) |
| 0.8 | 6.2 | GO:1904262 | negative regulation of TORC1 signaling(GO:1904262) |
| 0.8 | 3.1 | GO:0010716 | negative regulation of extracellular matrix disassembly(GO:0010716) melanocyte proliferation(GO:0097325) |
| 0.8 | 2.3 | GO:0006420 | arginyl-tRNA aminoacylation(GO:0006420) |
| 0.8 | 3.8 | GO:0061511 | centriole elongation(GO:0061511) |
| 0.8 | 6.0 | GO:0060155 | platelet dense granule organization(GO:0060155) |
| 0.7 | 2.2 | GO:0003147 | neural crest cell migration involved in heart formation(GO:0003147) cell migration involved in heart formation(GO:0060974) anterior neural tube closure(GO:0061713) |
| 0.7 | 3.0 | GO:1903691 | positive regulation of wound healing, spreading of epidermal cells(GO:1903691) |
| 0.7 | 8.2 | GO:0032287 | peripheral nervous system myelin maintenance(GO:0032287) |
| 0.7 | 2.2 | GO:0070563 | negative regulation of vitamin D receptor signaling pathway(GO:0070563) |
| 0.7 | 2.9 | GO:0021886 | hypothalamus gonadotrophin-releasing hormone neuron differentiation(GO:0021886) hypothalamus gonadotrophin-releasing hormone neuron development(GO:0021888) |
| 0.7 | 2.9 | GO:0061358 | negative regulation of Wnt protein secretion(GO:0061358) |
| 0.7 | 2.2 | GO:0046619 | optic placode formation involved in camera-type eye formation(GO:0046619) |
| 0.7 | 1.4 | GO:0060057 | apoptotic process involved in mammary gland involution(GO:0060057) positive regulation of apoptotic process involved in mammary gland involution(GO:0060058) positive regulation of apoptotic process involved in morphogenesis(GO:1902339) regulation of mammary gland involution(GO:1903519) positive regulation of mammary gland involution(GO:1903521) positive regulation of apoptotic process involved in development(GO:1904747) |
| 0.7 | 3.6 | GO:0006651 | diacylglycerol biosynthetic process(GO:0006651) |
| 0.7 | 15.6 | GO:0007597 | blood coagulation, intrinsic pathway(GO:0007597) |
| 0.7 | 2.8 | GO:0030822 | positive regulation of cyclic nucleotide catabolic process(GO:0030807) positive regulation of cAMP catabolic process(GO:0030822) positive regulation of purine nucleotide catabolic process(GO:0033123) |
| 0.7 | 3.5 | GO:0030047 | actin modification(GO:0030047) |
| 0.7 | 2.8 | GO:1903564 | regulation of protein localization to cilium(GO:1903564) |
| 0.7 | 2.7 | GO:2001271 | negative regulation of cysteine-type endopeptidase activity involved in execution phase of apoptosis(GO:2001271) |
| 0.7 | 4.7 | GO:0044341 | sodium-dependent phosphate transport(GO:0044341) |
| 0.7 | 8.1 | GO:0031665 | negative regulation of lipopolysaccharide-mediated signaling pathway(GO:0031665) |
| 0.7 | 2.6 | GO:0030643 | cellular phosphate ion homeostasis(GO:0030643) cellular trivalent inorganic anion homeostasis(GO:0072502) |
| 0.7 | 2.0 | GO:1990637 | response to prolactin(GO:1990637) |
| 0.7 | 2.0 | GO:0018153 | isopeptide cross-linking via N6-(L-isoglutamyl)-L-lysine(GO:0018153) isopeptide cross-linking(GO:0018262) |
| 0.7 | 7.9 | GO:0006228 | UTP biosynthetic process(GO:0006228) UTP metabolic process(GO:0046051) |
| 0.7 | 2.0 | GO:0038193 | thromboxane A2 signaling pathway(GO:0038193) |
| 0.7 | 5.9 | GO:0086024 | adrenergic receptor signaling pathway involved in positive regulation of heart rate(GO:0086024) |
| 0.6 | 2.6 | GO:0038155 | interleukin-23-mediated signaling pathway(GO:0038155) |
| 0.6 | 1.9 | GO:0008355 | olfactory learning(GO:0008355) |
| 0.6 | 0.6 | GO:2000137 | negative regulation of cell proliferation involved in heart morphogenesis(GO:2000137) |
| 0.6 | 1.3 | GO:1902732 | positive regulation of chondrocyte proliferation(GO:1902732) |
| 0.6 | 4.4 | GO:0048280 | vesicle fusion with Golgi apparatus(GO:0048280) |
| 0.6 | 3.1 | GO:0010966 | regulation of phosphate transport(GO:0010966) |
| 0.6 | 1.9 | GO:0014807 | regulation of somitogenesis(GO:0014807) |
| 0.6 | 4.4 | GO:0010735 | positive regulation of transcription via serum response element binding(GO:0010735) |
| 0.6 | 3.1 | GO:0031119 | tRNA pseudouridine synthesis(GO:0031119) |
| 0.6 | 1.9 | GO:0045229 | cell envelope organization(GO:0043163) external encapsulating structure organization(GO:0045229) |
| 0.6 | 5.5 | GO:0060717 | chorion development(GO:0060717) |
| 0.6 | 2.4 | GO:0055014 | atrial cardiac muscle cell differentiation(GO:0055011) atrial cardiac muscle cell development(GO:0055014) |
| 0.6 | 3.0 | GO:0060684 | epithelial-mesenchymal cell signaling(GO:0060684) |
| 0.6 | 1.8 | GO:0006711 | estrogen catabolic process(GO:0006711) |
| 0.6 | 2.4 | GO:0019087 | transformation of host cell by virus(GO:0019087) |
| 0.6 | 1.2 | GO:0021812 | neuronal-glial interaction involved in cerebral cortex radial glia guided migration(GO:0021812) |
| 0.6 | 2.4 | GO:0014816 | skeletal muscle satellite cell differentiation(GO:0014816) |
| 0.6 | 1.8 | GO:0086054 | pulmonary valve formation(GO:0003193) atrial ventricular junction remodeling(GO:0003294) foramen ovale closure(GO:0035922) atrial cardiac muscle cell to AV node cell communication by electrical coupling(GO:0086044) bundle of His cell to Purkinje myocyte communication by electrical coupling(GO:0086054) Purkinje myocyte to ventricular cardiac muscle cell communication by electrical coupling(GO:0086055) regulation of Purkinje myocyte action potential(GO:0098906) vasomotion(GO:1990029) |
| 0.6 | 1.8 | GO:0003402 | planar cell polarity pathway involved in axis elongation(GO:0003402) |
| 0.6 | 1.8 | GO:0070940 | dephosphorylation of RNA polymerase II C-terminal domain(GO:0070940) |
| 0.6 | 0.6 | GO:0035359 | negative regulation of peroxisome proliferator activated receptor signaling pathway(GO:0035359) |
| 0.6 | 3.5 | GO:0051122 | hepoxilin metabolic process(GO:0051121) hepoxilin biosynthetic process(GO:0051122) |
| 0.6 | 4.6 | GO:0090160 | Golgi to lysosome transport(GO:0090160) |
| 0.6 | 1.7 | GO:0006114 | glycerol biosynthetic process(GO:0006114) |
| 0.6 | 1.7 | GO:0070301 | cellular response to hydrogen peroxide(GO:0070301) |
| 0.6 | 2.9 | GO:0035694 | mitochondrial protein catabolic process(GO:0035694) |
| 0.6 | 16.5 | GO:0000732 | strand displacement(GO:0000732) |
| 0.6 | 1.7 | GO:0000412 | histone peptidyl-prolyl isomerization(GO:0000412) |
| 0.6 | 1.7 | GO:1903347 | negative regulation of bicellular tight junction assembly(GO:1903347) |
| 0.5 | 1.6 | GO:0072093 | ureteric bud invasion(GO:0072092) metanephric renal vesicle formation(GO:0072093) |
| 0.5 | 4.3 | GO:0060841 | venous blood vessel development(GO:0060841) |
| 0.5 | 1.1 | GO:2000330 | positive regulation of T-helper 17 cell lineage commitment(GO:2000330) |
| 0.5 | 4.8 | GO:0060267 | positive regulation of respiratory burst(GO:0060267) |
| 0.5 | 1.0 | GO:0015747 | urate transport(GO:0015747) |
| 0.5 | 1.6 | GO:0050916 | sensory perception of sweet taste(GO:0050916) |
| 0.5 | 8.3 | GO:0060716 | labyrinthine layer blood vessel development(GO:0060716) |
| 0.5 | 1.5 | GO:1903625 | negative regulation of DNA catabolic process(GO:1903625) |
| 0.5 | 1.5 | GO:0006269 | DNA replication, synthesis of RNA primer(GO:0006269) |
| 0.5 | 1.5 | GO:1903465 | vacuolar phosphate transport(GO:0007037) positive regulation of mitotic cell cycle DNA replication(GO:1903465) positive regulation of parathyroid hormone secretion(GO:2000830) |
| 0.5 | 11.6 | GO:0036150 | phosphatidylserine acyl-chain remodeling(GO:0036150) |
| 0.5 | 4.0 | GO:1901525 | negative regulation of macromitophagy(GO:1901525) |
| 0.5 | 2.0 | GO:0042483 | negative regulation of odontogenesis(GO:0042483) |
| 0.5 | 1.5 | GO:0051710 | regulation of cytolysis in other organism(GO:0051710) |
| 0.5 | 2.9 | GO:0042428 | serotonin metabolic process(GO:0042428) |
| 0.5 | 2.0 | GO:0072675 | multinuclear osteoclast differentiation(GO:0072674) osteoclast fusion(GO:0072675) |
| 0.5 | 3.4 | GO:0007256 | activation of JNKK activity(GO:0007256) |
| 0.5 | 3.4 | GO:0032472 | Golgi calcium ion transport(GO:0032472) |
| 0.5 | 5.6 | GO:0010991 | negative regulation of SMAD protein complex assembly(GO:0010991) |
| 0.5 | 2.3 | GO:0007197 | adenylate cyclase-inhibiting G-protein coupled acetylcholine receptor signaling pathway(GO:0007197) |
| 0.5 | 1.4 | GO:1990737 | response to manganese-induced endoplasmic reticulum stress(GO:1990737) |
| 0.5 | 2.7 | GO:0010836 | negative regulation of protein ADP-ribosylation(GO:0010836) |
| 0.4 | 2.2 | GO:0070091 | glucagon secretion(GO:0070091) regulation of glucagon secretion(GO:0070092) |
| 0.4 | 4.0 | GO:0000395 | mRNA 5'-splice site recognition(GO:0000395) |
| 0.4 | 1.3 | GO:0007181 | transforming growth factor beta receptor complex assembly(GO:0007181) |
| 0.4 | 2.7 | GO:0010455 | positive regulation of cell fate commitment(GO:0010455) |
| 0.4 | 2.2 | GO:0035105 | sterol regulatory element binding protein import into nucleus(GO:0035105) |
| 0.4 | 2.2 | GO:0006127 | glycerophosphate shuttle(GO:0006127) |
| 0.4 | 5.8 | GO:0035372 | protein localization to microtubule(GO:0035372) |
| 0.4 | 1.3 | GO:0002661 | B cell tolerance induction(GO:0002514) regulation of B cell tolerance induction(GO:0002661) positive regulation of B cell tolerance induction(GO:0002663) |
| 0.4 | 12.4 | GO:0033622 | integrin activation(GO:0033622) |
| 0.4 | 2.2 | GO:0016476 | regulation of embryonic cell shape(GO:0016476) |
| 0.4 | 1.7 | GO:0051771 | negative regulation of nitric-oxide synthase biosynthetic process(GO:0051771) |
| 0.4 | 1.7 | GO:0042796 | snRNA transcription from RNA polymerase III promoter(GO:0042796) |
| 0.4 | 2.6 | GO:2001300 | lipoxin metabolic process(GO:2001300) |
| 0.4 | 2.6 | GO:1902715 | positive regulation of interferon-gamma secretion(GO:1902715) |
| 0.4 | 0.9 | GO:1902774 | late endosome to lysosome transport(GO:1902774) |
| 0.4 | 3.0 | GO:0070170 | regulation of tooth mineralization(GO:0070170) |
| 0.4 | 2.5 | GO:0036438 | maintenance of lens transparency(GO:0036438) |
| 0.4 | 3.4 | GO:1902412 | regulation of mitotic cytokinesis(GO:1902412) |
| 0.4 | 2.5 | GO:0015742 | alpha-ketoglutarate transport(GO:0015742) |
| 0.4 | 9.5 | GO:2000369 | regulation of clathrin-mediated endocytosis(GO:2000369) |
| 0.4 | 10.8 | GO:0001580 | detection of chemical stimulus involved in sensory perception of bitter taste(GO:0001580) |
| 0.4 | 4.5 | GO:0031146 | SCF-dependent proteasomal ubiquitin-dependent protein catabolic process(GO:0031146) |
| 0.4 | 0.8 | GO:2000566 | positive regulation of CD4-positive, alpha-beta T cell proliferation(GO:2000563) positive regulation of CD8-positive, alpha-beta T cell proliferation(GO:2000566) |
| 0.4 | 3.7 | GO:0051045 | negative regulation of membrane protein ectodomain proteolysis(GO:0051045) |
| 0.4 | 3.7 | GO:2000394 | positive regulation of lamellipodium morphogenesis(GO:2000394) |
| 0.4 | 0.8 | GO:0010936 | negative regulation of macrophage cytokine production(GO:0010936) |
| 0.4 | 3.2 | GO:0032790 | ribosome disassembly(GO:0032790) |
| 0.4 | 2.8 | GO:0042118 | endothelial cell activation(GO:0042118) |
| 0.4 | 2.4 | GO:0001865 | NK T cell differentiation(GO:0001865) |
| 0.4 | 19.6 | GO:0003281 | ventricular septum development(GO:0003281) |
| 0.4 | 1.6 | GO:0019918 | peptidyl-arginine methylation, to symmetrical-dimethyl arginine(GO:0019918) |
| 0.4 | 0.4 | GO:0090309 | positive regulation of methylation-dependent chromatin silencing(GO:0090309) |
| 0.4 | 5.9 | GO:0060670 | branching involved in labyrinthine layer morphogenesis(GO:0060670) |
| 0.4 | 2.4 | GO:0046324 | regulation of glucose transport(GO:0010827) regulation of glucose import(GO:0046324) |
| 0.4 | 1.2 | GO:2000660 | negative regulation of interleukin-1-mediated signaling pathway(GO:2000660) |
| 0.4 | 25.4 | GO:0070830 | bicellular tight junction assembly(GO:0070830) |
| 0.4 | 1.1 | GO:0036148 | phosphatidylglycerol acyl-chain remodeling(GO:0036148) |
| 0.4 | 2.3 | GO:0015853 | adenine transport(GO:0015853) |
| 0.4 | 3.1 | GO:0045905 | translational frameshifting(GO:0006452) peptidyl-lysine modification to peptidyl-hypusine(GO:0008612) positive regulation of translational termination(GO:0045905) |
| 0.4 | 1.9 | GO:0043380 | regulation of memory T cell differentiation(GO:0043380) |
| 0.4 | 1.1 | GO:0052501 | induction of programmed cell death(GO:0012502) positive regulation of apoptotic process in other organism(GO:0044533) positive regulation by symbiont of host programmed cell death(GO:0052042) positive regulation by organism of programmed cell death in other organism involved in symbiotic interaction(GO:0052330) positive regulation by organism of apoptotic process in other organism involved in symbiotic interaction(GO:0052501) |
| 0.4 | 5.7 | GO:0001946 | lymphangiogenesis(GO:0001946) |
| 0.4 | 4.1 | GO:0098789 | pre-mRNA cleavage required for polyadenylation(GO:0098789) |
| 0.4 | 1.1 | GO:0060484 | lung-associated mesenchyme development(GO:0060484) |
| 0.4 | 0.4 | GO:0050968 | detection of chemical stimulus involved in sensory perception of pain(GO:0050968) |
| 0.4 | 1.8 | GO:1990834 | response to odorant(GO:1990834) |
| 0.4 | 2.2 | GO:0038003 | opioid receptor signaling pathway(GO:0038003) |
| 0.4 | 0.7 | GO:1902474 | positive regulation of protein localization to synapse(GO:1902474) |
| 0.4 | 2.5 | GO:0070836 | caveola assembly(GO:0070836) |
| 0.4 | 1.8 | GO:0033133 | positive regulation of glucokinase activity(GO:0033133) positive regulation of hexokinase activity(GO:1903301) |
| 0.4 | 1.5 | GO:0019086 | late viral transcription(GO:0019086) |
| 0.4 | 3.3 | GO:1904714 | chaperone-mediated autophagy(GO:0061684) regulation of chaperone-mediated autophagy(GO:1904714) |
| 0.4 | 4.7 | GO:0035878 | nail development(GO:0035878) |
| 0.4 | 7.2 | GO:0070816 | phosphorylation of RNA polymerase II C-terminal domain(GO:0070816) |
| 0.4 | 0.7 | GO:0034472 | snRNA 3'-end processing(GO:0034472) |
| 0.4 | 2.5 | GO:0045653 | negative regulation of megakaryocyte differentiation(GO:0045653) |
| 0.4 | 3.2 | GO:0071670 | smooth muscle cell chemotaxis(GO:0071670) |
| 0.4 | 2.1 | GO:0006196 | AMP catabolic process(GO:0006196) |
| 0.4 | 2.1 | GO:0061484 | hematopoietic stem cell homeostasis(GO:0061484) |
| 0.3 | 2.4 | GO:0006449 | regulation of translational termination(GO:0006449) |
| 0.3 | 1.7 | GO:0009732 | detection of carbohydrate stimulus(GO:0009730) detection of hexose stimulus(GO:0009732) detection of monosaccharide stimulus(GO:0034287) detection of glucose(GO:0051594) |
| 0.3 | 2.0 | GO:0061737 | leukotriene signaling pathway(GO:0061737) |
| 0.3 | 1.0 | GO:0010025 | wax biosynthetic process(GO:0010025) wax metabolic process(GO:0010166) |
| 0.3 | 1.7 | GO:0061668 | mitochondrial ribosome assembly(GO:0061668) mitochondrial large ribosomal subunit assembly(GO:1902775) |
| 0.3 | 1.3 | GO:0032661 | regulation of interleukin-18 production(GO:0032661) |
| 0.3 | 5.7 | GO:0006020 | inositol metabolic process(GO:0006020) |
| 0.3 | 1.3 | GO:0030174 | regulation of DNA-dependent DNA replication initiation(GO:0030174) |
| 0.3 | 1.3 | GO:0001188 | RNA polymerase I transcriptional preinitiation complex assembly(GO:0001188) RNA polymerase I transcriptional preinitiation complex assembly at the promoter for the nuclear large rRNA transcript(GO:0001189) |
| 0.3 | 12.3 | GO:0051131 | chaperone-mediated protein complex assembly(GO:0051131) |
| 0.3 | 21.2 | GO:0006977 | DNA damage response, signal transduction by p53 class mediator resulting in cell cycle arrest(GO:0006977) |
| 0.3 | 13.8 | GO:0090503 | RNA phosphodiester bond hydrolysis, exonucleolytic(GO:0090503) |
| 0.3 | 1.9 | GO:0031065 | positive regulation of histone deacetylation(GO:0031065) |
| 0.3 | 1.3 | GO:0033216 | ferric iron import(GO:0033216) ferric iron import into cell(GO:0097461) ferric iron import across plasma membrane(GO:0098706) |
| 0.3 | 8.3 | GO:0035024 | negative regulation of Rho protein signal transduction(GO:0035024) |
| 0.3 | 2.8 | GO:0036066 | protein O-linked fucosylation(GO:0036066) |
| 0.3 | 0.9 | GO:0050717 | positive regulation of gamma-aminobutyric acid secretion(GO:0014054) positive regulation of interleukin-1 alpha secretion(GO:0050717) |
| 0.3 | 3.1 | GO:0060137 | maternal process involved in parturition(GO:0060137) |
| 0.3 | 1.2 | GO:2000807 | regulation of synaptic vesicle clustering(GO:2000807) |
| 0.3 | 1.9 | GO:0007598 | blood coagulation, extrinsic pathway(GO:0007598) |
| 0.3 | 1.6 | GO:0048505 | regulation of development, heterochronic(GO:0040034) regulation of timing of cell differentiation(GO:0048505) |
| 0.3 | 2.2 | GO:0002467 | germinal center formation(GO:0002467) |
| 0.3 | 5.6 | GO:0006490 | oligosaccharide-lipid intermediate biosynthetic process(GO:0006490) |
| 0.3 | 1.2 | GO:0006476 | protein deacetylation(GO:0006476) |
| 0.3 | 2.2 | GO:0034086 | maintenance of sister chromatid cohesion(GO:0034086) maintenance of mitotic sister chromatid cohesion(GO:0034088) |
| 0.3 | 2.8 | GO:0043508 | negative regulation of JUN kinase activity(GO:0043508) |
| 0.3 | 4.0 | GO:0021942 | radial glia guided migration of Purkinje cell(GO:0021942) |
| 0.3 | 1.8 | GO:1903385 | regulation of homophilic cell adhesion(GO:1903385) |
| 0.3 | 0.6 | GO:0032286 | central nervous system myelin maintenance(GO:0032286) |
| 0.3 | 2.7 | GO:0006273 | lagging strand elongation(GO:0006273) |
| 0.3 | 6.6 | GO:0071577 | zinc II ion transmembrane transport(GO:0071577) |
| 0.3 | 4.8 | GO:0048820 | hair follicle maturation(GO:0048820) |
| 0.3 | 9.3 | GO:0006783 | heme biosynthetic process(GO:0006783) |
| 0.3 | 1.5 | GO:0007217 | tachykinin receptor signaling pathway(GO:0007217) |
| 0.3 | 2.7 | GO:0006707 | cholesterol catabolic process(GO:0006707) sterol catabolic process(GO:0016127) |
| 0.3 | 4.8 | GO:0044849 | estrous cycle(GO:0044849) |
| 0.3 | 1.2 | GO:0090362 | positive regulation of platelet-derived growth factor production(GO:0090362) |
| 0.3 | 0.9 | GO:0055099 | response to high density lipoprotein particle(GO:0055099) |
| 0.3 | 2.0 | GO:0003096 | renal sodium ion transport(GO:0003096) renal sodium ion absorption(GO:0070294) |
| 0.3 | 3.1 | GO:0002292 | T cell differentiation involved in immune response(GO:0002292) |
| 0.3 | 2.5 | GO:0010727 | negative regulation of hydrogen peroxide metabolic process(GO:0010727) |
| 0.3 | 0.8 | GO:0000915 | assembly of actomyosin apparatus involved in cytokinesis(GO:0000912) actomyosin contractile ring assembly(GO:0000915) actomyosin contractile ring organization(GO:0044837) |
| 0.3 | 0.8 | GO:1902548 | negative regulation of cellular response to vascular endothelial growth factor stimulus(GO:1902548) |
| 0.3 | 6.5 | GO:0015012 | heparan sulfate proteoglycan biosynthetic process(GO:0015012) |
| 0.3 | 7.0 | GO:0006957 | complement activation, alternative pathway(GO:0006957) |
| 0.3 | 3.4 | GO:2000404 | regulation of T cell migration(GO:2000404) |
| 0.3 | 4.4 | GO:0030539 | male genitalia development(GO:0030539) |
| 0.3 | 1.1 | GO:0006842 | tricarboxylic acid transport(GO:0006842) citrate transport(GO:0015746) |
| 0.3 | 0.8 | GO:0006550 | isoleucine catabolic process(GO:0006550) |
| 0.3 | 0.5 | GO:0090080 | positive regulation of MAPKKK cascade by fibroblast growth factor receptor signaling pathway(GO:0090080) |
| 0.3 | 1.9 | GO:0002934 | desmosome organization(GO:0002934) |
| 0.3 | 1.6 | GO:0017062 | respiratory chain complex III assembly(GO:0017062) mitochondrial respiratory chain complex III assembly(GO:0034551) mitochondrial respiratory chain complex III biogenesis(GO:0097033) |
| 0.3 | 5.7 | GO:0019800 | peptide cross-linking via chondroitin 4-sulfate glycosaminoglycan(GO:0019800) |
| 0.3 | 2.7 | GO:0071493 | cellular response to UV-B(GO:0071493) |
| 0.3 | 2.1 | GO:0099566 | regulation of postsynaptic cytosolic calcium ion concentration(GO:0099566) |
| 0.3 | 1.1 | GO:0038018 | Wnt receptor catabolic process(GO:0038018) |
| 0.3 | 2.3 | GO:0006271 | DNA strand elongation involved in DNA replication(GO:0006271) |
| 0.3 | 6.5 | GO:0000083 | regulation of transcription involved in G1/S transition of mitotic cell cycle(GO:0000083) |
| 0.3 | 0.8 | GO:0043011 | myeloid dendritic cell differentiation(GO:0043011) |
| 0.3 | 3.0 | GO:1902187 | negative regulation of viral release from host cell(GO:1902187) |
| 0.3 | 1.3 | GO:0098967 | exocytic insertion of neurotransmitter receptor to plasma membrane(GO:0098881) exocytic insertion of neurotransmitter receptor to postsynaptic membrane(GO:0098967) |
| 0.3 | 0.5 | GO:1902723 | negative regulation of skeletal muscle cell proliferation(GO:0014859) negative regulation of skeletal muscle satellite cell proliferation(GO:1902723) |
| 0.3 | 2.8 | GO:2000251 | positive regulation of actin cytoskeleton reorganization(GO:2000251) |
| 0.2 | 3.2 | GO:0031297 | replication fork processing(GO:0031297) |
| 0.2 | 2.5 | GO:0033119 | negative regulation of RNA splicing(GO:0033119) |
| 0.2 | 1.7 | GO:0032510 | endosome to lysosome transport via multivesicular body sorting pathway(GO:0032510) |
| 0.2 | 2.7 | GO:0070493 | thrombin receptor signaling pathway(GO:0070493) |
| 0.2 | 0.7 | GO:0023021 | termination of signal transduction(GO:0023021) |
| 0.2 | 1.7 | GO:0006477 | protein sulfation(GO:0006477) |
| 0.2 | 1.2 | GO:0048341 | paraxial mesoderm formation(GO:0048341) odontoblast differentiation(GO:0071895) |
| 0.2 | 4.3 | GO:1903204 | negative regulation of oxidative stress-induced neuron death(GO:1903204) |
| 0.2 | 1.2 | GO:0006696 | ergosterol biosynthetic process(GO:0006696) ergosterol metabolic process(GO:0008204) |
| 0.2 | 0.9 | GO:0034344 | type III interferon production(GO:0034343) regulation of type III interferon production(GO:0034344) |
| 0.2 | 0.2 | GO:0010641 | positive regulation of platelet-derived growth factor receptor signaling pathway(GO:0010641) |
| 0.2 | 1.6 | GO:0006335 | DNA replication-dependent nucleosome assembly(GO:0006335) DNA replication-dependent nucleosome organization(GO:0034723) |
| 0.2 | 1.4 | GO:0006370 | 7-methylguanosine mRNA capping(GO:0006370) |
| 0.2 | 5.7 | GO:2000352 | negative regulation of endothelial cell apoptotic process(GO:2000352) |
| 0.2 | 2.3 | GO:1900112 | regulation of histone H3-K9 trimethylation(GO:1900112) |
| 0.2 | 13.7 | GO:0001570 | vasculogenesis(GO:0001570) |
| 0.2 | 4.2 | GO:0070286 | axonemal dynein complex assembly(GO:0070286) |
| 0.2 | 2.2 | GO:0034638 | phosphatidylcholine catabolic process(GO:0034638) |
| 0.2 | 0.2 | GO:0072434 | signal transduction involved in G2 DNA damage checkpoint(GO:0072425) signal transduction involved in mitotic G2 DNA damage checkpoint(GO:0072434) |
| 0.2 | 6.2 | GO:0034080 | CENP-A containing nucleosome assembly(GO:0034080) CENP-A containing chromatin organization(GO:0061641) |
| 0.2 | 5.1 | GO:0070935 | 3'-UTR-mediated mRNA stabilization(GO:0070935) |
| 0.2 | 1.1 | GO:0002693 | positive regulation of cellular extravasation(GO:0002693) |
| 0.2 | 1.3 | GO:0017196 | N-terminal peptidyl-methionine acetylation(GO:0017196) |
| 0.2 | 5.3 | GO:0006884 | cell volume homeostasis(GO:0006884) |
| 0.2 | 0.6 | GO:0009449 | gamma-aminobutyric acid biosynthetic process(GO:0009449) |
| 0.2 | 1.3 | GO:0061502 | early endosome to recycling endosome transport(GO:0061502) |
| 0.2 | 1.9 | GO:0007212 | dopamine receptor signaling pathway(GO:0007212) |
| 0.2 | 1.9 | GO:0060707 | trophoblast giant cell differentiation(GO:0060707) |
| 0.2 | 3.1 | GO:0010457 | centriole-centriole cohesion(GO:0010457) |
| 0.2 | 1.4 | GO:0050703 | interleukin-1 alpha secretion(GO:0050703) |
| 0.2 | 2.4 | GO:0046415 | urate metabolic process(GO:0046415) |
| 0.2 | 1.4 | GO:2000389 | regulation of neutrophil extravasation(GO:2000389) |
| 0.2 | 8.4 | GO:0051646 | mitochondrion localization(GO:0051646) |
| 0.2 | 1.4 | GO:0015793 | glycerol transport(GO:0015793) |
| 0.2 | 0.8 | GO:2001286 | regulation of caveolin-mediated endocytosis(GO:2001286) positive regulation of caveolin-mediated endocytosis(GO:2001288) |
| 0.2 | 2.2 | GO:0090557 | establishment of endothelial intestinal barrier(GO:0090557) |
| 0.2 | 3.3 | GO:0006704 | glucocorticoid biosynthetic process(GO:0006704) |
| 0.2 | 2.7 | GO:0001973 | adenosine receptor signaling pathway(GO:0001973) |
| 0.2 | 0.6 | GO:0050894 | determination of affect(GO:0050894) |
| 0.2 | 5.7 | GO:0048265 | response to pain(GO:0048265) |
| 0.2 | 13.7 | GO:0030574 | collagen catabolic process(GO:0030574) |
| 0.2 | 1.7 | GO:0000491 | small nucleolar ribonucleoprotein complex assembly(GO:0000491) |
| 0.2 | 1.5 | GO:0060088 | auditory receptor cell morphogenesis(GO:0002093) auditory receptor cell stereocilium organization(GO:0060088) |
| 0.2 | 0.7 | GO:0045629 | negative regulation of T-helper 2 cell differentiation(GO:0045629) |
| 0.2 | 6.6 | GO:2000300 | regulation of synaptic vesicle exocytosis(GO:2000300) |
| 0.2 | 0.6 | GO:0042276 | error-prone translesion synthesis(GO:0042276) |
| 0.2 | 1.7 | GO:0000187 | activation of MAPK activity(GO:0000187) |
| 0.2 | 1.6 | GO:2001054 | negative regulation of mesenchymal cell apoptotic process(GO:2001054) |
| 0.2 | 1.3 | GO:0051823 | regulation of synapse structural plasticity(GO:0051823) |
| 0.2 | 5.0 | GO:0019731 | antibacterial humoral response(GO:0019731) |
| 0.2 | 1.1 | GO:0021603 | cranial nerve formation(GO:0021603) |
| 0.2 | 8.8 | GO:0050911 | detection of chemical stimulus involved in sensory perception of smell(GO:0050911) |
| 0.2 | 0.9 | GO:0035811 | negative regulation of urine volume(GO:0035811) |
| 0.2 | 2.3 | GO:0007076 | mitotic chromosome condensation(GO:0007076) |
| 0.2 | 0.5 | GO:0086073 | cardiac muscle cell-cardiac muscle cell adhesion(GO:0086042) bundle of His cell-Purkinje myocyte adhesion involved in cell communication(GO:0086073) |
| 0.2 | 1.5 | GO:0070307 | lens fiber cell development(GO:0070307) |
| 0.2 | 2.1 | GO:0046599 | regulation of centriole replication(GO:0046599) |
| 0.2 | 1.7 | GO:0006621 | protein retention in ER lumen(GO:0006621) |
| 0.2 | 0.7 | GO:0010585 | glutamine secretion(GO:0010585) L-glutamine import(GO:0036229) L-glutamine import into cell(GO:1903803) |
| 0.2 | 1.9 | GO:0001867 | complement activation, lectin pathway(GO:0001867) |
| 0.2 | 4.7 | GO:0010667 | negative regulation of cardiac muscle cell apoptotic process(GO:0010667) |
| 0.2 | 2.2 | GO:0060037 | pharyngeal system development(GO:0060037) |
| 0.2 | 0.8 | GO:0097151 | positive regulation of inhibitory postsynaptic potential(GO:0097151) modulation of inhibitory postsynaptic potential(GO:0098828) |
| 0.2 | 22.9 | GO:0007156 | homophilic cell adhesion via plasma membrane adhesion molecules(GO:0007156) |
| 0.2 | 1.8 | GO:0003197 | endocardial cushion development(GO:0003197) |
| 0.2 | 1.3 | GO:2000178 | negative regulation of neural precursor cell proliferation(GO:2000178) |
| 0.2 | 5.3 | GO:0007194 | negative regulation of adenylate cyclase activity(GO:0007194) |
| 0.2 | 4.8 | GO:0007608 | sensory perception of smell(GO:0007608) |
| 0.2 | 1.5 | GO:0038028 | insulin receptor signaling pathway via phosphatidylinositol 3-kinase(GO:0038028) |
| 0.2 | 1.5 | GO:0002903 | negative regulation of B cell apoptotic process(GO:0002903) |
| 0.2 | 6.8 | GO:0008038 | neuron recognition(GO:0008038) |
| 0.2 | 1.3 | GO:1904896 | ESCRT complex disassembly(GO:1904896) ESCRT III complex disassembly(GO:1904903) |
| 0.2 | 0.8 | GO:1903361 | protein localization to basolateral plasma membrane(GO:1903361) |
| 0.2 | 3.6 | GO:0060292 | long term synaptic depression(GO:0060292) |
| 0.2 | 0.8 | GO:0035063 | nuclear speck organization(GO:0035063) |
| 0.2 | 1.1 | GO:0070127 | tRNA aminoacylation for mitochondrial protein translation(GO:0070127) |
| 0.2 | 1.7 | GO:0055003 | cardiac myofibril assembly(GO:0055003) |
| 0.2 | 1.2 | GO:0048563 | post-embryonic organ morphogenesis(GO:0048563) |
| 0.2 | 1.1 | GO:0098532 | histone H3-K27 trimethylation(GO:0098532) |
| 0.1 | 1.9 | GO:0006559 | L-phenylalanine metabolic process(GO:0006558) L-phenylalanine catabolic process(GO:0006559) erythrose 4-phosphate/phosphoenolpyruvate family amino acid metabolic process(GO:1902221) erythrose 4-phosphate/phosphoenolpyruvate family amino acid catabolic process(GO:1902222) |
| 0.1 | 3.0 | GO:0006853 | carnitine shuttle(GO:0006853) |
| 0.1 | 1.3 | GO:2000786 | positive regulation of autophagosome assembly(GO:2000786) |
| 0.1 | 1.0 | GO:0034501 | protein localization to kinetochore(GO:0034501) protein localization to chromosome, centromeric region(GO:0071459) |
| 0.1 | 12.4 | GO:0045995 | regulation of embryonic development(GO:0045995) |
| 0.1 | 1.7 | GO:0048485 | sympathetic nervous system development(GO:0048485) |
| 0.1 | 1.1 | GO:0045725 | positive regulation of glycogen biosynthetic process(GO:0045725) |
| 0.1 | 0.3 | GO:0070827 | chromatin maintenance(GO:0070827) |
| 0.1 | 4.0 | GO:0045843 | negative regulation of striated muscle tissue development(GO:0045843) |
| 0.1 | 1.1 | GO:0035635 | entry of bacterium into host cell(GO:0035635) |
| 0.1 | 2.0 | GO:0048791 | calcium ion-regulated exocytosis of neurotransmitter(GO:0048791) |
| 0.1 | 3.4 | GO:0033198 | response to ATP(GO:0033198) |
| 0.1 | 0.3 | GO:1900264 | regulation of DNA-directed DNA polymerase activity(GO:1900262) positive regulation of DNA-directed DNA polymerase activity(GO:1900264) |
| 0.1 | 1.3 | GO:0018026 | peptidyl-lysine monomethylation(GO:0018026) |
| 0.1 | 0.8 | GO:0002933 | lipid hydroxylation(GO:0002933) |
| 0.1 | 1.4 | GO:0048245 | eosinophil chemotaxis(GO:0048245) |
| 0.1 | 0.6 | GO:0010172 | embryonic body morphogenesis(GO:0010172) |
| 0.1 | 1.4 | GO:1904776 | regulation of protein localization to cell cortex(GO:1904776) positive regulation of protein localization to cell cortex(GO:1904778) |
| 0.1 | 1.3 | GO:0008627 | intrinsic apoptotic signaling pathway in response to osmotic stress(GO:0008627) |
| 0.1 | 2.5 | GO:0006622 | protein targeting to lysosome(GO:0006622) |
| 0.1 | 0.4 | GO:1900220 | semaphorin-plexin signaling pathway involved in bone trabecula morphogenesis(GO:1900220) |
| 0.1 | 0.4 | GO:0002949 | tRNA threonylcarbamoyladenosine modification(GO:0002949) |
| 0.1 | 0.2 | GO:0002232 | leukocyte chemotaxis involved in inflammatory response(GO:0002232) cell surface pattern recognition receptor signaling pathway(GO:0002752) |
| 0.1 | 2.7 | GO:0030488 | tRNA methylation(GO:0030488) |
| 0.1 | 3.4 | GO:0006693 | prostanoid metabolic process(GO:0006692) prostaglandin metabolic process(GO:0006693) |
| 0.1 | 0.6 | GO:0010499 | proteasomal ubiquitin-independent protein catabolic process(GO:0010499) |
| 0.1 | 2.0 | GO:1903861 | positive regulation of dendrite extension(GO:1903861) |
| 0.1 | 2.1 | GO:0070936 | protein K48-linked ubiquitination(GO:0070936) |
| 0.1 | 3.7 | GO:0042059 | negative regulation of epidermal growth factor receptor signaling pathway(GO:0042059) |
| 0.1 | 0.7 | GO:0046618 | drug export(GO:0046618) |
| 0.1 | 1.4 | GO:0007016 | cytoskeletal anchoring at plasma membrane(GO:0007016) |
| 0.1 | 1.9 | GO:0010510 | regulation of acetyl-CoA biosynthetic process from pyruvate(GO:0010510) regulation of acyl-CoA biosynthetic process(GO:0050812) |
| 0.1 | 2.0 | GO:0006895 | Golgi to endosome transport(GO:0006895) |
| 0.1 | 3.9 | GO:0006699 | bile acid biosynthetic process(GO:0006699) |
| 0.1 | 0.6 | GO:0006701 | progesterone biosynthetic process(GO:0006701) |
| 0.1 | 0.6 | GO:0003014 | renal system process(GO:0003014) |
| 0.1 | 1.1 | GO:0042738 | exogenous drug catabolic process(GO:0042738) |
| 0.1 | 2.5 | GO:0016338 | calcium-independent cell-cell adhesion via plasma membrane cell-adhesion molecules(GO:0016338) |
| 0.1 | 0.6 | GO:0032494 | response to peptidoglycan(GO:0032494) |
| 0.1 | 0.7 | GO:0035860 | glial cell-derived neurotrophic factor receptor signaling pathway(GO:0035860) |
| 0.1 | 1.0 | GO:0030322 | stabilization of membrane potential(GO:0030322) |
| 0.1 | 1.0 | GO:0043249 | erythrocyte maturation(GO:0043249) |
| 0.1 | 3.3 | GO:1903146 | regulation of mitophagy(GO:1903146) |
| 0.1 | 1.4 | GO:0070498 | interleukin-1-mediated signaling pathway(GO:0070498) |
| 0.1 | 2.5 | GO:0000038 | very long-chain fatty acid metabolic process(GO:0000038) |
| 0.1 | 1.6 | GO:0043486 | histone exchange(GO:0043486) |
| 0.1 | 1.7 | GO:0009435 | NAD biosynthetic process(GO:0009435) |
| 0.1 | 1.1 | GO:0007176 | regulation of epidermal growth factor-activated receptor activity(GO:0007176) |
| 0.1 | 1.3 | GO:0016024 | CDP-diacylglycerol biosynthetic process(GO:0016024) |
| 0.1 | 1.2 | GO:0001502 | cartilage condensation(GO:0001502) |
| 0.1 | 1.0 | GO:0070070 | proton-transporting V-type ATPase complex assembly(GO:0070070) vacuolar proton-transporting V-type ATPase complex assembly(GO:0070072) |
| 0.1 | 2.4 | GO:0048247 | lymphocyte chemotaxis(GO:0048247) |
| 0.1 | 0.7 | GO:0017004 | cytochrome complex assembly(GO:0017004) |
| 0.1 | 1.4 | GO:0005513 | detection of calcium ion(GO:0005513) |
| 0.1 | 1.2 | GO:0048742 | regulation of skeletal muscle fiber development(GO:0048742) |
| 0.1 | 2.0 | GO:0006400 | tRNA modification(GO:0006400) |
| 0.1 | 0.3 | GO:0071306 | cellular response to vitamin E(GO:0071306) pancreatic stellate cell proliferation(GO:0072343) response to metformin(GO:1901558) regulation of pancreatic stellate cell proliferation(GO:2000229) negative regulation of pancreatic stellate cell proliferation(GO:2000230) |
| 0.1 | 0.9 | GO:0034260 | negative regulation of GTPase activity(GO:0034260) |
| 0.1 | 1.0 | GO:0060177 | regulation of angiotensin levels in blood(GO:0002002) angiotensin maturation(GO:0002003) regulation of angiotensin metabolic process(GO:0060177) |
| 0.1 | 0.4 | GO:0000963 | mitochondrial RNA processing(GO:0000963) |
| 0.1 | 0.7 | GO:0034349 | glial cell apoptotic process(GO:0034349) |
| 0.1 | 0.2 | GO:1903371 | regulation of endoplasmic reticulum tubular network organization(GO:1903371) |
| 0.1 | 3.9 | GO:0015701 | bicarbonate transport(GO:0015701) |
| 0.1 | 1.3 | GO:0046597 | negative regulation of viral entry into host cell(GO:0046597) |
| 0.1 | 2.6 | GO:0007339 | binding of sperm to zona pellucida(GO:0007339) |
| 0.1 | 1.1 | GO:0043114 | regulation of vascular permeability(GO:0043114) |
| 0.1 | 3.5 | GO:0032526 | response to retinoic acid(GO:0032526) |
| 0.1 | 0.4 | GO:0000733 | DNA strand renaturation(GO:0000733) |
| 0.1 | 1.7 | GO:0051457 | maintenance of protein location in nucleus(GO:0051457) |
| 0.1 | 1.8 | GO:0000042 | protein targeting to Golgi(GO:0000042) |
| 0.1 | 11.3 | GO:0007266 | Rho protein signal transduction(GO:0007266) |
| 0.1 | 2.4 | GO:0035249 | synaptic transmission, glutamatergic(GO:0035249) |
| 0.1 | 1.3 | GO:0003334 | keratinocyte development(GO:0003334) |
| 0.1 | 0.8 | GO:0048536 | spleen development(GO:0048536) |
| 0.1 | 0.5 | GO:0042268 | regulation of cytolysis(GO:0042268) positive regulation of cytolysis(GO:0045919) |
| 0.1 | 1.6 | GO:1902230 | negative regulation of intrinsic apoptotic signaling pathway in response to DNA damage(GO:1902230) |
| 0.1 | 0.3 | GO:0090074 | negative regulation of protein homodimerization activity(GO:0090074) |
| 0.1 | 0.4 | GO:0030321 | transepithelial chloride transport(GO:0030321) |
| 0.1 | 1.4 | GO:0071108 | protein K48-linked deubiquitination(GO:0071108) |
| 0.1 | 0.5 | GO:1900363 | regulation of mRNA polyadenylation(GO:1900363) |
| 0.1 | 0.5 | GO:0042448 | progesterone metabolic process(GO:0042448) |
| 0.1 | 1.0 | GO:0042177 | negative regulation of protein catabolic process(GO:0042177) |
| 0.1 | 5.8 | GO:0007188 | adenylate cyclase-modulating G-protein coupled receptor signaling pathway(GO:0007188) |
| 0.1 | 4.2 | GO:0031338 | regulation of vesicle fusion(GO:0031338) |
| 0.1 | 0.6 | GO:0000183 | chromatin silencing at rDNA(GO:0000183) |
| 0.1 | 2.8 | GO:0048384 | retinoic acid receptor signaling pathway(GO:0048384) |
| 0.1 | 0.7 | GO:0000098 | sulfur amino acid catabolic process(GO:0000098) |
| 0.1 | 1.6 | GO:0014003 | oligodendrocyte development(GO:0014003) |
| 0.1 | 1.1 | GO:0032467 | positive regulation of cytokinesis(GO:0032467) |
| 0.1 | 0.5 | GO:1901998 | toxin transport(GO:1901998) |
| 0.1 | 0.7 | GO:0060325 | face morphogenesis(GO:0060325) |
| 0.1 | 1.6 | GO:0050771 | negative regulation of axonogenesis(GO:0050771) |
| 0.1 | 0.3 | GO:0032483 | regulation of Rab protein signal transduction(GO:0032483) |
| 0.1 | 0.5 | GO:0021756 | striatum development(GO:0021756) |
| 0.0 | 1.5 | GO:0070884 | regulation of calcineurin-NFAT signaling cascade(GO:0070884) |
| 0.0 | 1.0 | GO:0090090 | negative regulation of canonical Wnt signaling pathway(GO:0090090) |
| 0.0 | 0.7 | GO:0032780 | negative regulation of ATPase activity(GO:0032780) |
| 0.0 | 0.3 | GO:0001783 | B cell apoptotic process(GO:0001783) |
| 0.0 | 0.6 | GO:0010039 | response to iron ion(GO:0010039) |
| 0.0 | 1.5 | GO:0015804 | neutral amino acid transport(GO:0015804) |
| 0.0 | 0.3 | GO:0050708 | regulation of protein secretion(GO:0050708) |
| 0.0 | 6.2 | GO:0006814 | sodium ion transport(GO:0006814) |
| 0.0 | 0.6 | GO:0032754 | positive regulation of interleukin-5 production(GO:0032754) |
| 0.0 | 0.1 | GO:0051177 | meiotic sister chromatid cohesion(GO:0051177) meiotic sister chromatid cohesion, centromeric(GO:0051754) |
| 0.0 | 0.6 | GO:0039692 | single stranded viral RNA replication via double stranded DNA intermediate(GO:0039692) |
| 0.0 | 0.9 | GO:0030970 | retrograde protein transport, ER to cytosol(GO:0030970) |
| 0.0 | 0.9 | GO:0000462 | maturation of SSU-rRNA from tricistronic rRNA transcript (SSU-rRNA, 5.8S rRNA, LSU-rRNA)(GO:0000462) |
| 0.0 | 16.0 | GO:0007283 | spermatogenesis(GO:0007283) male gamete generation(GO:0048232) |
| 0.0 | 0.9 | GO:0051058 | negative regulation of Ras protein signal transduction(GO:0046580) negative regulation of small GTPase mediated signal transduction(GO:0051058) |
| 0.0 | 1.5 | GO:2000134 | negative regulation of G1/S transition of mitotic cell cycle(GO:2000134) |
| 0.0 | 0.5 | GO:0010886 | positive regulation of cholesterol storage(GO:0010886) |
| 0.0 | 0.5 | GO:0070327 | thyroid hormone transport(GO:0070327) |
| 0.0 | 0.4 | GO:0009650 | UV protection(GO:0009650) |
| 0.0 | 0.9 | GO:0018208 | protein peptidyl-prolyl isomerization(GO:0000413) peptidyl-proline modification(GO:0018208) |
| 0.0 | 0.4 | GO:0033146 | regulation of intracellular estrogen receptor signaling pathway(GO:0033146) |
| 0.0 | 0.6 | GO:0015813 | acidic amino acid transport(GO:0015800) L-glutamate transport(GO:0015813) |
| 0.0 | 1.3 | GO:0008277 | regulation of G-protein coupled receptor protein signaling pathway(GO:0008277) |
| 0.0 | 2.0 | GO:0033275 | muscle filament sliding(GO:0030049) actin-myosin filament sliding(GO:0033275) |
| 0.0 | 2.1 | GO:0006937 | regulation of muscle contraction(GO:0006937) |
| 0.0 | 0.9 | GO:0003018 | vascular process in circulatory system(GO:0003018) |
| 0.0 | 1.2 | GO:0048678 | response to axon injury(GO:0048678) |
| 0.0 | 0.2 | GO:0019852 | L-ascorbic acid metabolic process(GO:0019852) |
| 0.0 | 0.4 | GO:0010801 | negative regulation of peptidyl-threonine phosphorylation(GO:0010801) |
| 0.0 | 0.2 | GO:0015812 | gamma-aminobutyric acid transport(GO:0015812) |
| 0.0 | 0.6 | GO:0007409 | axonogenesis(GO:0007409) |
| 0.0 | 0.1 | GO:0072733 | response to staurosporine(GO:0072733) cellular response to staurosporine(GO:0072734) |
| 0.0 | 0.1 | GO:0021759 | globus pallidus development(GO:0021759) |
| 0.0 | 0.6 | GO:0008156 | negative regulation of DNA replication(GO:0008156) |
| 0.0 | 0.4 | GO:0043252 | sodium-independent organic anion transport(GO:0043252) |
| 0.0 | 0.7 | GO:0045600 | positive regulation of fat cell differentiation(GO:0045600) |
| 0.0 | 0.0 | GO:0045113 | integrin biosynthetic process(GO:0045112) regulation of integrin biosynthetic process(GO:0045113) positive regulation of integrin biosynthetic process(GO:0045726) |
| 0.0 | 0.6 | GO:0051781 | positive regulation of cell division(GO:0051781) |
| 0.0 | 1.6 | GO:0002576 | platelet degranulation(GO:0002576) |
| 0.0 | 0.4 | GO:0043525 | positive regulation of neuron apoptotic process(GO:0043525) |
| 0.0 | 0.2 | GO:1901099 | negative regulation of signal transduction in absence of ligand(GO:1901099) negative regulation of extrinsic apoptotic signaling pathway in absence of ligand(GO:2001240) |
| 0.0 | 0.3 | GO:0006517 | protein deglycosylation(GO:0006517) |
| 0.0 | 0.2 | GO:0016973 | poly(A)+ mRNA export from nucleus(GO:0016973) |
| 0.0 | 0.3 | GO:0060021 | palate development(GO:0060021) |
Gene overrepresentation in cellular_component category:
| Log-likelihood per target | Total log-likelihood | Term | Description |
|---|---|---|---|
| 6.1 | 18.4 | GO:0034365 | discoidal high-density lipoprotein particle(GO:0034365) |
| 3.7 | 11.2 | GO:0072563 | endothelial microparticle(GO:0072563) |
| 3.3 | 13.2 | GO:1990745 | EARP complex(GO:1990745) |
| 3.3 | 9.9 | GO:0071020 | post-spliceosomal complex(GO:0071020) |
| 2.4 | 7.2 | GO:0005944 | phosphatidylinositol 3-kinase complex, class IB(GO:0005944) |
| 2.4 | 7.1 | GO:0061673 | cortical microtubule(GO:0055028) mitotic spindle astral microtubule(GO:0061673) |
| 2.3 | 13.9 | GO:0005958 | DNA-dependent protein kinase-DNA ligase 4 complex(GO:0005958) DNA ligase IV complex(GO:0032807) |
| 2.0 | 15.6 | GO:0043196 | varicosity(GO:0043196) |
| 1.9 | 20.6 | GO:0097443 | sorting endosome(GO:0097443) |
| 1.8 | 5.5 | GO:0044609 | DBIRD complex(GO:0044609) |
| 1.7 | 14.0 | GO:0005672 | transcription factor TFIIA complex(GO:0005672) |
| 1.7 | 1.7 | GO:0005953 | CAAX-protein geranylgeranyltransferase complex(GO:0005953) |
| 1.7 | 6.8 | GO:0071818 | BAT3 complex(GO:0071818) ER membrane insertion complex(GO:0072379) |
| 1.5 | 1.5 | GO:0097651 | phosphatidylinositol 3-kinase complex, class IA(GO:0005943) phosphatidylinositol 3-kinase complex, class I(GO:0097651) |
| 1.4 | 19.1 | GO:0098647 | collagen type VI trimer(GO:0005589) collagen beaded filament(GO:0098647) |
| 1.3 | 3.9 | GO:0097489 | multivesicular body, internal vesicle lumen(GO:0097489) |
| 1.2 | 5.0 | GO:0032937 | SREBP-SCAP-Insig complex(GO:0032937) |
| 1.2 | 14.5 | GO:0033093 | Weibel-Palade body(GO:0033093) |
| 1.2 | 4.8 | GO:0032777 | Piccolo NuA4 histone acetyltransferase complex(GO:0032777) |
| 1.1 | 13.5 | GO:0043203 | axon hillock(GO:0043203) |
| 1.1 | 7.6 | GO:0097427 | microtubule bundle(GO:0097427) |
| 1.1 | 5.3 | GO:0071797 | LUBAC complex(GO:0071797) |
| 1.1 | 7.4 | GO:1903439 | calcitonin family receptor complex(GO:1903439) amylin receptor complex(GO:1903440) |
| 1.1 | 5.3 | GO:0070847 | core mediator complex(GO:0070847) |
| 1.1 | 4.2 | GO:0033596 | TSC1-TSC2 complex(GO:0033596) |
| 1.0 | 16.7 | GO:0042589 | zymogen granule membrane(GO:0042589) |
| 0.9 | 4.6 | GO:0020018 | ciliary pocket(GO:0020016) ciliary pocket membrane(GO:0020018) |
| 0.8 | 4.2 | GO:0034388 | Pwp2p-containing subcomplex of 90S preribosome(GO:0034388) |
| 0.8 | 4.9 | GO:1990357 | terminal web(GO:1990357) |
| 0.8 | 3.9 | GO:0010370 | perinucleolar chromocenter(GO:0010370) |
| 0.8 | 4.6 | GO:0061689 | tricellular tight junction(GO:0061689) |
| 0.8 | 3.8 | GO:0008275 | gamma-tubulin small complex(GO:0008275) |
| 0.7 | 4.5 | GO:1990130 | Iml1 complex(GO:1990130) |
| 0.7 | 2.2 | GO:0034685 | integrin alphav-beta6 complex(GO:0034685) integrin alphav-beta8 complex(GO:0034686) |
| 0.7 | 5.9 | GO:0005579 | membrane attack complex(GO:0005579) |
| 0.6 | 17.5 | GO:0002080 | acrosomal membrane(GO:0002080) |
| 0.6 | 2.6 | GO:0072536 | interleukin-23 receptor complex(GO:0072536) |
| 0.6 | 3.7 | GO:0030991 | intraciliary transport particle A(GO:0030991) |
| 0.6 | 16.0 | GO:0031231 | integral component of peroxisomal membrane(GO:0005779) intrinsic component of peroxisomal membrane(GO:0031231) |
| 0.6 | 7.7 | GO:0005664 | origin recognition complex(GO:0000808) nuclear origin of replication recognition complex(GO:0005664) |
| 0.6 | 6.9 | GO:0005744 | mitochondrial inner membrane presequence translocase complex(GO:0005744) |
| 0.6 | 2.3 | GO:0071062 | alphav-beta3 integrin-vitronectin complex(GO:0071062) |
| 0.6 | 4.0 | GO:0061617 | MICOS complex(GO:0061617) |
| 0.5 | 2.1 | GO:0038038 | G-protein coupled receptor homodimeric complex(GO:0038038) |
| 0.5 | 8.8 | GO:0030014 | CCR4-NOT complex(GO:0030014) |
| 0.5 | 8.8 | GO:0045277 | respiratory chain complex IV(GO:0045277) |
| 0.5 | 7.2 | GO:0035102 | PRC1 complex(GO:0035102) |
| 0.5 | 2.4 | GO:0000235 | astral microtubule(GO:0000235) aster(GO:0005818) |
| 0.5 | 1.5 | GO:0030689 | Noc complex(GO:0030689) |
| 0.4 | 9.0 | GO:0005849 | mRNA cleavage factor complex(GO:0005849) |
| 0.4 | 2.7 | GO:0033018 | sarcoplasmic reticulum lumen(GO:0033018) |
| 0.4 | 1.3 | GO:0000806 | Y chromosome(GO:0000806) cyclin A2-CDK2 complex(GO:0097124) cyclin E1-CDK2 complex(GO:0097134) |
| 0.4 | 2.9 | GO:0070852 | cell body fiber(GO:0070852) |
| 0.4 | 2.9 | GO:0001520 | outer dense fiber(GO:0001520) |
| 0.4 | 20.1 | GO:0033017 | sarcoplasmic reticulum membrane(GO:0033017) |
| 0.4 | 1.2 | GO:0005607 | laminin-2 complex(GO:0005607) |
| 0.4 | 6.5 | GO:0042583 | chromaffin granule(GO:0042583) |
| 0.4 | 2.2 | GO:0009331 | glycerol-3-phosphate dehydrogenase complex(GO:0009331) |
| 0.4 | 5.1 | GO:0030897 | HOPS complex(GO:0030897) |
| 0.4 | 3.6 | GO:0005883 | neurofilament(GO:0005883) |
| 0.4 | 1.4 | GO:0000138 | Golgi trans cisterna(GO:0000138) |
| 0.4 | 1.1 | GO:0070435 | Shc-EGFR complex(GO:0070435) |
| 0.3 | 1.0 | GO:0043291 | RAVE complex(GO:0043291) |
| 0.3 | 1.0 | GO:0000818 | nuclear MIS12/MIND complex(GO:0000818) |
| 0.3 | 2.0 | GO:1990769 | proximal neuron projection(GO:1990769) |
| 0.3 | 6.4 | GO:0005666 | DNA-directed RNA polymerase III complex(GO:0005666) |
| 0.3 | 1.7 | GO:1990393 | 3M complex(GO:1990393) |
| 0.3 | 1.3 | GO:0034673 | inhibin-betaglycan-ActRII complex(GO:0034673) |
| 0.3 | 11.1 | GO:0080008 | Cul4-RING E3 ubiquitin ligase complex(GO:0080008) |
| 0.3 | 1.7 | GO:0005726 | perichromatin fibrils(GO:0005726) |
| 0.3 | 1.3 | GO:0005736 | DNA-directed RNA polymerase I complex(GO:0005736) |
| 0.3 | 19.5 | GO:0031904 | endosome lumen(GO:0031904) |
| 0.3 | 2.3 | GO:0016272 | prefoldin complex(GO:0016272) |
| 0.3 | 2.9 | GO:0008024 | cyclin/CDK positive transcription elongation factor complex(GO:0008024) |
| 0.3 | 6.1 | GO:0005832 | chaperonin-containing T-complex(GO:0005832) |
| 0.3 | 12.6 | GO:0005605 | basal lamina(GO:0005605) |
| 0.3 | 24.7 | GO:0005604 | basement membrane(GO:0005604) |
| 0.3 | 1.0 | GO:0016589 | NURF complex(GO:0016589) |
| 0.3 | 1.9 | GO:0031313 | extrinsic component of endosome membrane(GO:0031313) |
| 0.3 | 1.6 | GO:0000836 | Hrd1p ubiquitin ligase complex(GO:0000836) |
| 0.3 | 2.2 | GO:0042719 | mitochondrial intermembrane space protein transporter complex(GO:0042719) |
| 0.3 | 1.6 | GO:0045298 | tubulin complex(GO:0045298) |
| 0.3 | 4.6 | GO:0031362 | anchored component of external side of plasma membrane(GO:0031362) |
| 0.3 | 0.9 | GO:0005873 | plus-end kinesin complex(GO:0005873) |
| 0.3 | 3.0 | GO:0000439 | core TFIIH complex(GO:0000439) |
| 0.3 | 10.6 | GO:0031258 | lamellipodium membrane(GO:0031258) |
| 0.3 | 2.7 | GO:0045275 | mitochondrial respiratory chain complex III(GO:0005750) respiratory chain complex III(GO:0045275) |
| 0.3 | 4.8 | GO:0031089 | platelet dense granule lumen(GO:0031089) |
| 0.3 | 2.7 | GO:0071953 | elastic fiber(GO:0071953) |
| 0.3 | 2.3 | GO:0044294 | dendritic growth cone(GO:0044294) |
| 0.3 | 2.0 | GO:0070069 | cytochrome complex(GO:0070069) |
| 0.3 | 3.6 | GO:0048188 | Set1C/COMPASS complex(GO:0048188) |
| 0.3 | 10.8 | GO:0005669 | transcription factor TFIID complex(GO:0005669) |
| 0.3 | 1.7 | GO:0097165 | nuclear stress granule(GO:0097165) |
| 0.3 | 2.4 | GO:0005955 | calcineurin complex(GO:0005955) |
| 0.3 | 4.8 | GO:0005922 | connexon complex(GO:0005922) |
| 0.3 | 1.1 | GO:0036449 | microtubule minus-end(GO:0036449) |
| 0.3 | 1.5 | GO:0005658 | alpha DNA polymerase:primase complex(GO:0005658) |
| 0.2 | 4.9 | GO:0031588 | nucleotide-activated protein kinase complex(GO:0031588) |
| 0.2 | 0.7 | GO:0033647 | viral replication complex(GO:0019034) host intracellular organelle(GO:0033647) host intracellular membrane-bounded organelle(GO:0033648) host cell nucleus(GO:0042025) host cell nuclear part(GO:0044094) |
| 0.2 | 4.1 | GO:0001518 | voltage-gated sodium channel complex(GO:0001518) |
| 0.2 | 6.4 | GO:0016323 | basolateral plasma membrane(GO:0016323) |
| 0.2 | 8.1 | GO:0000159 | protein phosphatase type 2A complex(GO:0000159) |
| 0.2 | 1.4 | GO:1990037 | Lewy body core(GO:1990037) |
| 0.2 | 2.3 | GO:0000796 | condensin complex(GO:0000796) |
| 0.2 | 1.1 | GO:0005899 | insulin receptor complex(GO:0005899) |
| 0.2 | 7.2 | GO:0090568 | nuclear transcriptional repressor complex(GO:0090568) |
| 0.2 | 1.8 | GO:0036056 | filtration diaphragm(GO:0036056) slit diaphragm(GO:0036057) |
| 0.2 | 23.3 | GO:0005796 | Golgi lumen(GO:0005796) |
| 0.2 | 1.5 | GO:0097013 | phagocytic vesicle lumen(GO:0097013) |
| 0.2 | 1.7 | GO:0030914 | STAGA complex(GO:0030914) |
| 0.2 | 13.2 | GO:0031463 | Cul3-RING ubiquitin ligase complex(GO:0031463) |
| 0.2 | 18.1 | GO:0043195 | terminal bouton(GO:0043195) |
| 0.2 | 2.9 | GO:0005858 | axonemal dynein complex(GO:0005858) |
| 0.2 | 1.6 | GO:0005851 | eukaryotic translation initiation factor 2B complex(GO:0005851) |
| 0.2 | 7.6 | GO:0009925 | basal plasma membrane(GO:0009925) |
| 0.2 | 5.9 | GO:0005868 | cytoplasmic dynein complex(GO:0005868) |
| 0.2 | 0.8 | GO:0005771 | multivesicular body(GO:0005771) |
| 0.2 | 1.9 | GO:0045254 | pyruvate dehydrogenase complex(GO:0045254) |
| 0.2 | 0.8 | GO:0033588 | Elongator holoenzyme complex(GO:0033588) |
| 0.2 | 0.7 | GO:0043293 | apoptosome(GO:0043293) |
| 0.2 | 0.9 | GO:0001939 | female pronucleus(GO:0001939) |
| 0.2 | 1.6 | GO:0097038 | perinuclear endoplasmic reticulum(GO:0097038) |
| 0.2 | 0.8 | GO:0097149 | centralspindlin complex(GO:0097149) |
| 0.2 | 2.6 | GO:0042599 | lamellar body(GO:0042599) |
| 0.2 | 1.1 | GO:0097452 | GAIT complex(GO:0097452) |
| 0.2 | 16.7 | GO:0000777 | condensed chromosome kinetochore(GO:0000777) |
| 0.2 | 2.6 | GO:0005640 | nuclear outer membrane(GO:0005640) |
| 0.2 | 0.6 | GO:0061200 | clathrin-sculpted gamma-aminobutyric acid transport vesicle(GO:0061200) clathrin-sculpted gamma-aminobutyric acid transport vesicle membrane(GO:0061202) |
| 0.2 | 1.1 | GO:0043240 | Fanconi anaemia nuclear complex(GO:0043240) |
| 0.2 | 5.7 | GO:0030131 | clathrin adaptor complex(GO:0030131) |
| 0.2 | 1.7 | GO:0035631 | CD40 receptor complex(GO:0035631) |
| 0.1 | 0.7 | GO:0089701 | U2AF(GO:0089701) |
| 0.1 | 2.0 | GO:0005662 | DNA replication factor A complex(GO:0005662) |
| 0.1 | 3.6 | GO:0000314 | organellar small ribosomal subunit(GO:0000314) mitochondrial small ribosomal subunit(GO:0005763) |
| 0.1 | 1.7 | GO:0046658 | anchored component of plasma membrane(GO:0046658) |
| 0.1 | 0.8 | GO:0097025 | MPP7-DLG1-LIN7 complex(GO:0097025) |
| 0.1 | 4.1 | GO:0000421 | autophagosome membrane(GO:0000421) |
| 0.1 | 0.5 | GO:0030136 | clathrin-coated vesicle(GO:0030136) |
| 0.1 | 5.9 | GO:0005891 | voltage-gated calcium channel complex(GO:0005891) |
| 0.1 | 2.3 | GO:0051233 | spindle midzone(GO:0051233) |
| 0.1 | 0.9 | GO:0031931 | TORC1 complex(GO:0031931) |
| 0.1 | 1.4 | GO:0008091 | spectrin(GO:0008091) |
| 0.1 | 3.8 | GO:0005902 | microvillus(GO:0005902) |
| 0.1 | 0.6 | GO:0033553 | rDNA heterochromatin(GO:0033553) |
| 0.1 | 2.8 | GO:0008074 | guanylate cyclase complex, soluble(GO:0008074) |
| 0.1 | 5.7 | GO:0005801 | cis-Golgi network(GO:0005801) |
| 0.1 | 4.3 | GO:0031430 | M band(GO:0031430) |
| 0.1 | 1.2 | GO:1990907 | beta-catenin-TCF complex(GO:1990907) |
| 0.1 | 0.2 | GO:0070939 | Dsl1p complex(GO:0070939) |
| 0.1 | 11.8 | GO:0005814 | centriole(GO:0005814) |
| 0.1 | 1.3 | GO:0000815 | ESCRT III complex(GO:0000815) |
| 0.1 | 10.4 | GO:0031093 | platelet alpha granule lumen(GO:0031093) |
| 0.1 | 1.3 | GO:0097440 | apical dendrite(GO:0097440) |
| 0.1 | 0.6 | GO:0042406 | extrinsic component of endoplasmic reticulum membrane(GO:0042406) |
| 0.1 | 1.4 | GO:0005833 | hemoglobin complex(GO:0005833) |
| 0.1 | 2.9 | GO:0016327 | apicolateral plasma membrane(GO:0016327) |
| 0.1 | 2.9 | GO:0044322 | endoplasmic reticulum quality control compartment(GO:0044322) |
| 0.1 | 1.8 | GO:0005862 | muscle thin filament tropomyosin(GO:0005862) |
| 0.1 | 4.6 | GO:0005782 | peroxisomal matrix(GO:0005782) microbody lumen(GO:0031907) |
| 0.1 | 0.3 | GO:0005846 | nuclear cap binding complex(GO:0005846) |
| 0.1 | 5.1 | GO:0005581 | collagen trimer(GO:0005581) |
| 0.1 | 2.1 | GO:0005859 | muscle myosin complex(GO:0005859) |
| 0.1 | 3.4 | GO:0000791 | euchromatin(GO:0000791) |
| 0.1 | 17.6 | GO:0005578 | proteinaceous extracellular matrix(GO:0005578) |
| 0.1 | 1.1 | GO:0005790 | smooth endoplasmic reticulum(GO:0005790) |
| 0.1 | 7.2 | GO:0043202 | lysosomal lumen(GO:0043202) |
| 0.1 | 1.4 | GO:0005721 | pericentric heterochromatin(GO:0005721) |
| 0.1 | 2.9 | GO:0032590 | dendrite membrane(GO:0032590) |
| 0.1 | 1.8 | GO:0016010 | dystrophin-associated glycoprotein complex(GO:0016010) glycoprotein complex(GO:0090665) |
| 0.1 | 1.1 | GO:0016580 | Sin3 complex(GO:0016580) |
| 0.1 | 0.8 | GO:0034098 | VCP-NPL4-UFD1 AAA ATPase complex(GO:0034098) |
| 0.1 | 0.5 | GO:0005916 | fascia adherens(GO:0005916) |
| 0.1 | 7.7 | GO:0005875 | microtubule associated complex(GO:0005875) |
| 0.1 | 4.0 | GO:0033116 | endoplasmic reticulum-Golgi intermediate compartment membrane(GO:0033116) |
| 0.1 | 1.9 | GO:0030057 | desmosome(GO:0030057) |
| 0.1 | 4.9 | GO:0070603 | SWI/SNF superfamily-type complex(GO:0070603) |
| 0.1 | 2.0 | GO:0001533 | cornified envelope(GO:0001533) |
| 0.1 | 8.7 | GO:0045111 | intermediate filament cytoskeleton(GO:0045111) |
| 0.1 | 2.2 | GO:0034364 | high-density lipoprotein particle(GO:0034364) |
| 0.1 | 0.5 | GO:0097197 | tetraspanin-enriched microdomain(GO:0097197) |
| 0.1 | 2.2 | GO:0016592 | mediator complex(GO:0016592) |
| 0.1 | 0.1 | GO:0031466 | Cul5-RING ubiquitin ligase complex(GO:0031466) |
| 0.1 | 0.9 | GO:0005639 | integral component of nuclear inner membrane(GO:0005639) intrinsic component of nuclear inner membrane(GO:0031229) nuclear membrane part(GO:0044453) |
| 0.1 | 0.9 | GO:0031235 | intrinsic component of the cytoplasmic side of the plasma membrane(GO:0031235) |
| 0.1 | 0.4 | GO:0002116 | semaphorin receptor complex(GO:0002116) |
| 0.1 | 1.0 | GO:0034045 | pre-autophagosomal structure membrane(GO:0034045) |
| 0.1 | 3.5 | GO:0031526 | brush border membrane(GO:0031526) |
| 0.1 | 2.3 | GO:0043679 | axon terminus(GO:0043679) |
| 0.1 | 0.6 | GO:0017146 | NMDA selective glutamate receptor complex(GO:0017146) |
| 0.1 | 1.3 | GO:0005905 | clathrin-coated pit(GO:0005905) |
| 0.1 | 0.5 | GO:0061574 | ASAP complex(GO:0061574) |
| 0.1 | 0.6 | GO:0032045 | guanyl-nucleotide exchange factor complex(GO:0032045) |
| 0.0 | 1.8 | GO:0016328 | lateral plasma membrane(GO:0016328) |
| 0.0 | 1.6 | GO:0048786 | presynaptic active zone(GO:0048786) |
| 0.0 | 0.3 | GO:0031390 | Ctf18 RFC-like complex(GO:0031390) |
| 0.0 | 2.6 | GO:0005811 | lipid particle(GO:0005811) |
| 0.0 | 0.3 | GO:0033180 | proton-transporting V-type ATPase, V1 domain(GO:0033180) |
| 0.0 | 4.4 | GO:0090575 | RNA polymerase II transcription factor complex(GO:0090575) |
| 0.0 | 1.0 | GO:0031082 | BLOC complex(GO:0031082) |
| 0.0 | 0.3 | GO:0031298 | replication fork protection complex(GO:0031298) |
| 0.0 | 0.2 | GO:0044614 | nuclear pore cytoplasmic filaments(GO:0044614) |
| 0.0 | 0.3 | GO:0034706 | sodium channel complex(GO:0034706) |
| 0.0 | 0.4 | GO:0097225 | sperm midpiece(GO:0097225) |
| 0.0 | 3.4 | GO:0016605 | PML body(GO:0016605) |
| 0.0 | 0.2 | GO:0072487 | MSL complex(GO:0072487) |
| 0.0 | 0.1 | GO:0071439 | clathrin complex(GO:0071439) |
| 0.0 | 4.8 | GO:0005788 | endoplasmic reticulum lumen(GO:0005788) |
| 0.0 | 0.9 | GO:0008023 | transcription elongation factor complex(GO:0008023) |
| 0.0 | 0.2 | GO:0008385 | IkappaB kinase complex(GO:0008385) |
| 0.0 | 1.0 | GO:0055037 | recycling endosome(GO:0055037) |
| 0.0 | 3.3 | GO:0030424 | axon(GO:0030424) |
| 0.0 | 1.2 | GO:0031514 | motile cilium(GO:0031514) |
| 0.0 | 0.2 | GO:0030867 | rough endoplasmic reticulum membrane(GO:0030867) |
| 0.0 | 3.8 | GO:0016324 | apical plasma membrane(GO:0016324) |
| 0.0 | 0.1 | GO:1990752 | microtubule end(GO:1990752) |
| 0.0 | 0.1 | GO:0033269 | internode region of axon(GO:0033269) |
| 0.0 | 0.0 | GO:0071438 | invadopodium membrane(GO:0071438) |
| 0.0 | 0.6 | GO:0030658 | transport vesicle membrane(GO:0030658) |
| 0.0 | 2.0 | GO:0001726 | ruffle(GO:0001726) |
| 0.0 | 9.2 | GO:0005615 | extracellular space(GO:0005615) |
| 0.0 | 0.9 | GO:0008076 | voltage-gated potassium channel complex(GO:0008076) potassium channel complex(GO:0034705) |
| 0.0 | 0.2 | GO:0000118 | histone deacetylase complex(GO:0000118) |
Gene overrepresentation in molecular_function category:
| Log-likelihood per target | Total log-likelihood | Term | Description |
|---|---|---|---|
| 5.9 | 29.4 | GO:0000179 | rRNA (adenine-N6,N6-)-dimethyltransferase activity(GO:0000179) |
| 4.6 | 18.3 | GO:0032810 | sterol response element binding(GO:0032810) |
| 3.4 | 10.3 | GO:0004514 | nicotinate-nucleotide diphosphorylase (carboxylating) activity(GO:0004514) |
| 2.8 | 19.8 | GO:0016206 | catechol O-methyltransferase activity(GO:0016206) |
| 2.8 | 16.7 | GO:0003917 | DNA topoisomerase type I activity(GO:0003917) |
| 2.6 | 7.7 | GO:0034038 | deoxyhypusine synthase activity(GO:0034038) |
| 2.6 | 12.8 | GO:0004925 | prolactin receptor activity(GO:0004925) |
| 2.4 | 7.3 | GO:0004515 | nicotinate-nucleotide adenylyltransferase activity(GO:0004515) |
| 2.3 | 7.0 | GO:0031727 | CCR2 chemokine receptor binding(GO:0031727) |
| 2.2 | 6.5 | GO:0015018 | galactosylgalactosylxylosylprotein 3-beta-glucuronosyltransferase activity(GO:0015018) |
| 1.9 | 11.4 | GO:0004792 | thiosulfate sulfurtransferase activity(GO:0004792) |
| 1.9 | 9.4 | GO:0070815 | peptidyl-lysine 5-dioxygenase activity(GO:0070815) |
| 1.8 | 8.8 | GO:0004489 | methylenetetrahydrofolate reductase (NAD(P)H) activity(GO:0004489) |
| 1.7 | 1.7 | GO:0004661 | protein geranylgeranyltransferase activity(GO:0004661) CAAX-protein geranylgeranyltransferase activity(GO:0004662) |
| 1.7 | 12.1 | GO:0052739 | phosphatidylserine 1-acylhydrolase activity(GO:0052739) |
| 1.7 | 18.8 | GO:0001042 | RNA polymerase I core binding(GO:0001042) |
| 1.5 | 14.9 | GO:0005114 | type II transforming growth factor beta receptor binding(GO:0005114) |
| 1.5 | 5.9 | GO:0000702 | oxidized base lesion DNA N-glycosylase activity(GO:0000702) |
| 1.5 | 8.7 | GO:0015057 | thrombin receptor activity(GO:0015057) |
| 1.4 | 5.6 | GO:0004376 | glycolipid mannosyltransferase activity(GO:0004376) |
| 1.3 | 3.8 | GO:0003845 | 11-beta-hydroxysteroid dehydrogenase [NAD(P)] activity(GO:0003845) |
| 1.3 | 3.8 | GO:0050501 | hyaluronan synthase activity(GO:0050501) |
| 1.2 | 8.7 | GO:0035005 | 1-phosphatidylinositol-4-phosphate 3-kinase activity(GO:0035005) |
| 1.2 | 3.6 | GO:0045322 | unmethylated CpG binding(GO:0045322) |
| 1.2 | 5.9 | GO:0047374 | methylumbelliferyl-acetate deacetylase activity(GO:0047374) |
| 1.2 | 4.7 | GO:0004886 | 9-cis retinoic acid receptor activity(GO:0004886) |
| 1.2 | 4.7 | GO:0015319 | sodium:inorganic phosphate symporter activity(GO:0015319) |
| 1.1 | 5.6 | GO:0001132 | RNA polymerase II transcription factor activity, TBP-class protein binding, involved in preinitiation complex assembly(GO:0001129) RNA polymerase II transcription factor activity, TBP-class protein binding(GO:0001132) |
| 1.1 | 6.4 | GO:0003998 | acylphosphatase activity(GO:0003998) |
| 1.1 | 3.2 | GO:0071209 | U7 snRNA binding(GO:0071209) |
| 1.1 | 7.4 | GO:0097643 | amylin receptor activity(GO:0097643) |
| 1.0 | 2.9 | GO:0033765 | 3-oxo-5-alpha-steroid 4-dehydrogenase activity(GO:0003865) steroid dehydrogenase activity, acting on the CH-CH group of donors(GO:0033765) cholestenone 5-alpha-reductase activity(GO:0047751) |
| 0.9 | 7.5 | GO:0016929 | SUMO-specific protease activity(GO:0016929) |
| 0.9 | 3.6 | GO:0070290 | N-acylphosphatidylethanolamine-specific phospholipase D activity(GO:0070290) |
| 0.9 | 20.3 | GO:0005161 | platelet-derived growth factor receptor binding(GO:0005161) |
| 0.9 | 14.9 | GO:0070513 | death domain binding(GO:0070513) |
| 0.9 | 3.5 | GO:0050473 | arachidonate 15-lipoxygenase activity(GO:0050473) |
| 0.9 | 8.6 | GO:0016783 | sulfurtransferase activity(GO:0016783) |
| 0.9 | 2.6 | GO:0016309 | 1-phosphatidylinositol-5-phosphate 4-kinase activity(GO:0016309) |
| 0.9 | 2.6 | GO:0004464 | leukotriene-C4 synthase activity(GO:0004464) |
| 0.8 | 15.0 | GO:0004535 | poly(A)-specific ribonuclease activity(GO:0004535) |
| 0.8 | 3.3 | GO:0033743 | peptide-methionine (R)-S-oxide reductase activity(GO:0033743) |
| 0.8 | 4.9 | GO:0003886 | DNA (cytosine-5-)-methyltransferase activity(GO:0003886) |
| 0.8 | 2.4 | GO:0005330 | dopamine:sodium symporter activity(GO:0005330) |
| 0.8 | 3.9 | GO:0005006 | epidermal growth factor-activated receptor activity(GO:0005006) |
| 0.8 | 2.3 | GO:0004814 | arginine-tRNA ligase activity(GO:0004814) |
| 0.8 | 4.6 | GO:0005134 | interleukin-2 receptor binding(GO:0005134) |
| 0.8 | 3.0 | GO:0016361 | activin receptor activity, type I(GO:0016361) |
| 0.7 | 2.2 | GO:0032767 | copper-dependent protein binding(GO:0032767) |
| 0.7 | 14.5 | GO:0051787 | misfolded protein binding(GO:0051787) |
| 0.7 | 2.9 | GO:0038047 | beta-endorphin receptor activity(GO:0004979) morphine receptor activity(GO:0038047) |
| 0.7 | 3.5 | GO:0016427 | tRNA (cytosine) methyltransferase activity(GO:0016427) |
| 0.7 | 2.0 | GO:0019961 | interferon binding(GO:0019961) |
| 0.7 | 9.3 | GO:0003993 | acid phosphatase activity(GO:0003993) |
| 0.7 | 2.0 | GO:0051538 | 3 iron, 4 sulfur cluster binding(GO:0051538) |
| 0.7 | 2.0 | GO:0004961 | thromboxane receptor activity(GO:0004960) thromboxane A2 receptor activity(GO:0004961) |
| 0.6 | 11.7 | GO:0043522 | leucine zipper domain binding(GO:0043522) |
| 0.6 | 22.6 | GO:0030742 | GTP-dependent protein binding(GO:0030742) |
| 0.6 | 2.6 | GO:0042019 | interleukin-23 binding(GO:0042019) interleukin-23 receptor activity(GO:0042020) |
| 0.6 | 11.3 | GO:0070016 | armadillo repeat domain binding(GO:0070016) |
| 0.6 | 8.7 | GO:0015095 | magnesium ion transmembrane transporter activity(GO:0015095) |
| 0.6 | 7.4 | GO:1990459 | transferrin receptor binding(GO:1990459) |
| 0.6 | 8.1 | GO:0035612 | AP-2 adaptor complex binding(GO:0035612) |
| 0.6 | 4.3 | GO:0038085 | vascular endothelial growth factor binding(GO:0038085) |
| 0.6 | 2.4 | GO:0000822 | inositol hexakisphosphate binding(GO:0000822) |
| 0.6 | 2.4 | GO:0033906 | protein tyrosine kinase inhibitor activity(GO:0030292) hyaluronoglucuronidase activity(GO:0033906) |
| 0.6 | 4.2 | GO:0030160 | GKAP/Homer scaffold activity(GO:0030160) |
| 0.6 | 3.6 | GO:0004800 | thyroxine 5'-deiodinase activity(GO:0004800) |
| 0.6 | 1.8 | GO:0086076 | gap junction channel activity involved in atrial cardiac muscle cell-AV node cell electrical coupling(GO:0086076) gap junction channel activity involved in bundle of His cell-Purkinje myocyte electrical coupling(GO:0086078) gap junction channel activity involved in Purkinje myocyte-ventricular cardiac muscle cell electrical coupling(GO:0086079) |
| 0.6 | 1.8 | GO:0070699 | type II activin receptor binding(GO:0070699) |
| 0.6 | 1.7 | GO:0015226 | amino-acid betaine transmembrane transporter activity(GO:0015199) carnitine transmembrane transporter activity(GO:0015226) |
| 0.6 | 1.7 | GO:0004613 | phosphoenolpyruvate carboxykinase activity(GO:0004611) phosphoenolpyruvate carboxykinase (GTP) activity(GO:0004613) |
| 0.6 | 2.3 | GO:0005471 | ATP:ADP antiporter activity(GO:0005471) adenine transmembrane transporter activity(GO:0015207) |
| 0.6 | 17.7 | GO:0005031 | tumor necrosis factor-activated receptor activity(GO:0005031) death receptor activity(GO:0005035) |
| 0.6 | 1.1 | GO:0019828 | aspartic-type endopeptidase inhibitor activity(GO:0019828) |
| 0.6 | 7.9 | GO:0030215 | semaphorin receptor binding(GO:0030215) |
| 0.6 | 15.3 | GO:0038187 | signaling pattern recognition receptor activity(GO:0008329) pattern recognition receptor activity(GO:0038187) |
| 0.6 | 2.2 | GO:0061714 | folic acid receptor activity(GO:0061714) |
| 0.6 | 2.2 | GO:0052591 | sn-glycerol-3-phosphate:ubiquinone oxidoreductase activity(GO:0052590) sn-glycerol-3-phosphate:ubiquinone-8 oxidoreductase activity(GO:0052591) |
| 0.5 | 7.1 | GO:0051011 | microtubule minus-end binding(GO:0051011) |
| 0.5 | 6.3 | GO:0005078 | MAP-kinase scaffold activity(GO:0005078) |
| 0.5 | 2.6 | GO:0047237 | glucuronylgalactosylproteoglycan 4-beta-N-acetylgalactosaminyltransferase activity(GO:0047237) |
| 0.5 | 3.0 | GO:0008310 | single-stranded DNA 3'-5' exodeoxyribonuclease activity(GO:0008310) |
| 0.5 | 1.5 | GO:0047696 | beta-adrenergic receptor kinase activity(GO:0047696) |
| 0.5 | 13.9 | GO:0003887 | DNA-directed DNA polymerase activity(GO:0003887) |
| 0.5 | 7.5 | GO:0017151 | DEAD/H-box RNA helicase binding(GO:0017151) |
| 0.5 | 2.5 | GO:0015140 | malate transmembrane transporter activity(GO:0015140) |
| 0.5 | 18.9 | GO:0001103 | RNA polymerase II repressing transcription factor binding(GO:0001103) |
| 0.5 | 1.9 | GO:0004505 | phenylalanine 4-monooxygenase activity(GO:0004505) |
| 0.5 | 3.9 | GO:0004064 | arylesterase activity(GO:0004064) |
| 0.5 | 1.9 | GO:0004739 | pyruvate dehydrogenase (acetyl-transferring) activity(GO:0004739) |
| 0.5 | 4.3 | GO:0004969 | histamine receptor activity(GO:0004969) |
| 0.5 | 2.3 | GO:0097108 | smoothened binding(GO:0005119) hedgehog family protein binding(GO:0097108) |
| 0.5 | 1.9 | GO:0001588 | dopamine neurotransmitter receptor activity, coupled via Gs(GO:0001588) |
| 0.5 | 2.3 | GO:0016907 | G-protein coupled acetylcholine receptor activity(GO:0016907) |
| 0.5 | 5.9 | GO:0001087 | transcription factor activity, sequence-specific DNA binding, RNA polymerase recruiting(GO:0001011) transcription factor activity, RNA polymerase II basal transcription factor binding(GO:0001083) transcription factor activity, TFIIB-class binding(GO:0001087) |
| 0.5 | 2.7 | GO:0008430 | selenium binding(GO:0008430) |
| 0.4 | 4.9 | GO:0004679 | AMP-activated protein kinase activity(GO:0004679) |
| 0.4 | 2.2 | GO:0044729 | hemi-methylated DNA-binding(GO:0044729) |
| 0.4 | 1.3 | GO:0071566 | UFM1 activating enzyme activity(GO:0071566) |
| 0.4 | 2.2 | GO:1990430 | extracellular matrix protein binding(GO:1990430) |
| 0.4 | 1.7 | GO:0050262 | ribosylnicotinamide kinase activity(GO:0050262) ribosylnicotinate kinase activity(GO:0061769) |
| 0.4 | 2.6 | GO:0070891 | lipoteichoic acid binding(GO:0070891) |
| 0.4 | 47.2 | GO:0004867 | serine-type endopeptidase inhibitor activity(GO:0004867) |
| 0.4 | 2.2 | GO:0008142 | oxysterol binding(GO:0008142) |
| 0.4 | 11.5 | GO:0008093 | cytoskeletal adaptor activity(GO:0008093) |
| 0.4 | 3.8 | GO:0035174 | histone serine kinase activity(GO:0035174) |
| 0.4 | 2.1 | GO:0001016 | RNA polymerase III regulatory region DNA binding(GO:0001016) |
| 0.4 | 8.0 | GO:0031698 | beta-2 adrenergic receptor binding(GO:0031698) |
| 0.4 | 4.6 | GO:1904264 | ubiquitin protein ligase activity involved in ERAD pathway(GO:1904264) |
| 0.4 | 1.7 | GO:0008384 | IkappaB kinase activity(GO:0008384) |
| 0.4 | 2.1 | GO:0035252 | UDP-xylosyltransferase activity(GO:0035252) xylosyltransferase activity(GO:0042285) |
| 0.4 | 2.0 | GO:0004974 | leukotriene receptor activity(GO:0004974) |
| 0.4 | 4.0 | GO:0001135 | transcription factor activity, RNA polymerase II transcription factor recruiting(GO:0001135) |
| 0.4 | 3.2 | GO:1990932 | 5.8S rRNA binding(GO:1990932) |
| 0.4 | 1.6 | GO:0035243 | protein-arginine omega-N symmetric methyltransferase activity(GO:0035243) |
| 0.4 | 1.2 | GO:0005150 | interleukin-1, Type I receptor binding(GO:0005150) |
| 0.4 | 1.6 | GO:0008889 | glycerophosphodiester phosphodiesterase activity(GO:0008889) |
| 0.4 | 2.7 | GO:0001609 | G-protein coupled adenosine receptor activity(GO:0001609) |
| 0.4 | 7.7 | GO:0050321 | tau-protein kinase activity(GO:0050321) |
| 0.4 | 2.7 | GO:0008121 | ubiquinol-cytochrome-c reductase activity(GO:0008121) oxidoreductase activity, acting on diphenols and related substances as donors, cytochrome as acceptor(GO:0016681) |
| 0.4 | 1.9 | GO:0036312 | phosphatidylinositol 3-kinase regulatory subunit binding(GO:0036312) |
| 0.4 | 7.9 | GO:0004550 | nucleoside diphosphate kinase activity(GO:0004550) |
| 0.4 | 2.9 | GO:0097322 | 7SK snRNA binding(GO:0097322) |
| 0.4 | 5.9 | GO:0019841 | retinol binding(GO:0019841) |
| 0.4 | 1.8 | GO:0070095 | fructose-6-phosphate binding(GO:0070095) |
| 0.4 | 4.0 | GO:0016290 | palmitoyl-CoA hydrolase activity(GO:0016290) |
| 0.4 | 2.5 | GO:0008109 | N-acetyllactosaminide beta-1,6-N-acetylglucosaminyltransferase activity(GO:0008109) |
| 0.4 | 2.2 | GO:0043237 | laminin-1 binding(GO:0043237) |
| 0.4 | 1.4 | GO:0004461 | lactose synthase activity(GO:0004461) |
| 0.4 | 1.1 | GO:0050613 | delta14-sterol reductase activity(GO:0050613) |
| 0.4 | 1.8 | GO:0008420 | CTD phosphatase activity(GO:0008420) |
| 0.4 | 2.8 | GO:0017034 | Rap guanyl-nucleotide exchange factor activity(GO:0017034) |
| 0.4 | 1.4 | GO:0015254 | glycerol channel activity(GO:0015254) |
| 0.3 | 6.6 | GO:0005385 | zinc ion transmembrane transporter activity(GO:0005385) |
| 0.3 | 6.6 | GO:0043015 | gamma-tubulin binding(GO:0043015) |
| 0.3 | 7.8 | GO:0008191 | metalloendopeptidase inhibitor activity(GO:0008191) |
| 0.3 | 1.0 | GO:0080019 | fatty-acyl-CoA reductase (alcohol-forming) activity(GO:0080019) |
| 0.3 | 3.3 | GO:0004117 | calmodulin-dependent cyclic-nucleotide phosphodiesterase activity(GO:0004117) |
| 0.3 | 1.0 | GO:0080025 | phosphatidylinositol-3,5-bisphosphate binding(GO:0080025) |
| 0.3 | 1.3 | GO:0008823 | cupric reductase activity(GO:0008823) ferric-chelate reductase (NADPH) activity(GO:0052851) |
| 0.3 | 1.0 | GO:0032422 | purine-rich negative regulatory element binding(GO:0032422) |
| 0.3 | 5.4 | GO:0030169 | low-density lipoprotein particle binding(GO:0030169) |
| 0.3 | 1.3 | GO:0005412 | glucose:sodium symporter activity(GO:0005412) |
| 0.3 | 1.3 | GO:0050544 | icosanoid binding(GO:0050542) icosatetraenoic acid binding(GO:0050543) arachidonic acid binding(GO:0050544) fatty acid derivative binding(GO:1901567) |
| 0.3 | 5.7 | GO:0070300 | phosphatidic acid binding(GO:0070300) |
| 0.3 | 2.5 | GO:0004176 | ATP-dependent peptidase activity(GO:0004176) |
| 0.3 | 3.9 | GO:0001222 | transcription corepressor binding(GO:0001222) |
| 0.3 | 3.2 | GO:0030274 | LIM domain binding(GO:0030274) |
| 0.3 | 1.7 | GO:0008046 | axon guidance receptor activity(GO:0008046) |
| 0.3 | 6.0 | GO:0035497 | cAMP response element binding(GO:0035497) |
| 0.3 | 6.2 | GO:0030374 | ligand-dependent nuclear receptor transcription coactivator activity(GO:0030374) |
| 0.3 | 0.8 | GO:0034041 | sterol-transporting ATPase activity(GO:0034041) |
| 0.3 | 1.1 | GO:0015137 | citrate transmembrane transporter activity(GO:0015137) tricarboxylic acid transmembrane transporter activity(GO:0015142) |
| 0.3 | 2.7 | GO:0003910 | DNA ligase (ATP) activity(GO:0003910) |
| 0.3 | 1.1 | GO:0048408 | epidermal growth factor binding(GO:0048408) |
| 0.3 | 2.9 | GO:0070182 | DNA polymerase binding(GO:0070182) |
| 0.3 | 2.1 | GO:0099583 | neurotransmitter receptor activity involved in regulation of postsynaptic cytosolic calcium ion concentration(GO:0099583) |
| 0.3 | 5.8 | GO:0005247 | voltage-gated chloride channel activity(GO:0005247) |
| 0.3 | 7.6 | GO:0004129 | cytochrome-c oxidase activity(GO:0004129) heme-copper terminal oxidase activity(GO:0015002) oxidoreductase activity, acting on a heme group of donors, oxygen as acceptor(GO:0016676) |
| 0.3 | 3.1 | GO:0016857 | racemase and epimerase activity, acting on carbohydrates and derivatives(GO:0016857) |
| 0.2 | 28.2 | GO:0005070 | SH3/SH2 adaptor activity(GO:0005070) |
| 0.2 | 0.7 | GO:0098640 | integrin binding involved in cell-matrix adhesion(GO:0098640) |
| 0.2 | 3.9 | GO:0016641 | oxidoreductase activity, acting on the CH-NH2 group of donors, oxygen as acceptor(GO:0016641) |
| 0.2 | 3.4 | GO:0042809 | vitamin D receptor binding(GO:0042809) |
| 0.2 | 2.4 | GO:0033192 | calmodulin-dependent protein phosphatase activity(GO:0033192) |
| 0.2 | 2.2 | GO:0019211 | phosphatase activator activity(GO:0019211) |
| 0.2 | 0.2 | GO:0010314 | phosphatidylinositol-5-phosphate binding(GO:0010314) |
| 0.2 | 3.1 | GO:0031491 | nucleosome binding(GO:0031491) |
| 0.2 | 2.1 | GO:0047623 | AMP deaminase activity(GO:0003876) adenosine-phosphate deaminase activity(GO:0047623) |
| 0.2 | 1.9 | GO:0003810 | protein-glutamine gamma-glutamyltransferase activity(GO:0003810) |
| 0.2 | 4.2 | GO:0004115 | 3',5'-cyclic-AMP phosphodiesterase activity(GO:0004115) |
| 0.2 | 9.9 | GO:0030507 | spectrin binding(GO:0030507) |
| 0.2 | 0.6 | GO:0017002 | activin-activated receptor activity(GO:0017002) |
| 0.2 | 7.7 | GO:0044183 | protein binding involved in protein folding(GO:0044183) |
| 0.2 | 3.4 | GO:0005158 | insulin receptor binding(GO:0005158) |
| 0.2 | 2.5 | GO:0016208 | AMP binding(GO:0016208) |
| 0.2 | 9.6 | GO:0008009 | chemokine activity(GO:0008009) |
| 0.2 | 0.8 | GO:0035473 | lipase binding(GO:0035473) |
| 0.2 | 8.5 | GO:0003785 | actin monomer binding(GO:0003785) |
| 0.2 | 8.1 | GO:0043539 | protein serine/threonine kinase activator activity(GO:0043539) |
| 0.2 | 2.7 | GO:0052629 | phosphatidylinositol-3,5-bisphosphate 3-phosphatase activity(GO:0052629) |
| 0.2 | 3.7 | GO:0019789 | SUMO transferase activity(GO:0019789) |
| 0.2 | 1.0 | GO:0039706 | co-receptor binding(GO:0039706) |
| 0.2 | 0.8 | GO:0005105 | type 1 fibroblast growth factor receptor binding(GO:0005105) |
| 0.2 | 0.8 | GO:0019871 | sodium channel inhibitor activity(GO:0019871) |
| 0.2 | 3.7 | GO:0032183 | SUMO binding(GO:0032183) |
| 0.2 | 1.2 | GO:0035591 | signaling adaptor activity(GO:0035591) |
| 0.2 | 2.5 | GO:0030306 | ADP-ribosylation factor binding(GO:0030306) |
| 0.2 | 9.2 | GO:0005160 | transforming growth factor beta receptor binding(GO:0005160) |
| 0.2 | 1.7 | GO:0046923 | ER retention sequence binding(GO:0046923) |
| 0.2 | 1.7 | GO:0004499 | N,N-dimethylaniline monooxygenase activity(GO:0004499) |
| 0.2 | 0.5 | GO:0030275 | LRR domain binding(GO:0030275) |
| 0.2 | 3.0 | GO:0008353 | RNA polymerase II carboxy-terminal domain kinase activity(GO:0008353) |
| 0.2 | 0.7 | GO:0050220 | prostaglandin-E synthase activity(GO:0050220) |
| 0.2 | 8.8 | GO:0004984 | olfactory receptor activity(GO:0004984) |
| 0.2 | 4.1 | GO:0005248 | voltage-gated sodium channel activity(GO:0005248) voltage-gated ion channel activity involved in regulation of postsynaptic membrane potential(GO:1905030) |
| 0.2 | 1.0 | GO:0016941 | natriuretic peptide receptor activity(GO:0016941) |
| 0.2 | 21.9 | GO:0005319 | lipid transporter activity(GO:0005319) |
| 0.2 | 1.0 | GO:0016854 | racemase and epimerase activity(GO:0016854) |
| 0.2 | 3.9 | GO:0030544 | Hsp70 protein binding(GO:0030544) |
| 0.2 | 1.3 | GO:0008821 | crossover junction endodeoxyribonuclease activity(GO:0008821) |
| 0.2 | 0.9 | GO:0004522 | ribonuclease A activity(GO:0004522) |
| 0.2 | 0.6 | GO:0004351 | glutamate decarboxylase activity(GO:0004351) |
| 0.2 | 1.4 | GO:1901702 | urate transmembrane transporter activity(GO:0015143) salt transmembrane transporter activity(GO:1901702) |
| 0.2 | 1.1 | GO:0050733 | RS domain binding(GO:0050733) |
| 0.2 | 1.5 | GO:0005007 | fibroblast growth factor-activated receptor activity(GO:0005007) |
| 0.2 | 2.4 | GO:0017049 | GTP-Rho binding(GO:0017049) |
| 0.1 | 2.4 | GO:0031005 | filamin binding(GO:0031005) |
| 0.1 | 6.7 | GO:0005546 | phosphatidylinositol-4,5-bisphosphate binding(GO:0005546) |
| 0.1 | 0.7 | GO:0019798 | procollagen-proline 4-dioxygenase activity(GO:0004656) procollagen-proline dioxygenase activity(GO:0019798) |
| 0.1 | 1.1 | GO:0031543 | peptidyl-proline dioxygenase activity(GO:0031543) |
| 0.1 | 0.7 | GO:0015307 | drug:proton antiporter activity(GO:0015307) |
| 0.1 | 0.7 | GO:0030628 | pre-mRNA 3'-splice site binding(GO:0030628) |
| 0.1 | 13.2 | GO:0005089 | Rho guanyl-nucleotide exchange factor activity(GO:0005089) |
| 0.1 | 2.2 | GO:0017134 | fibroblast growth factor binding(GO:0017134) |
| 0.1 | 2.9 | GO:0043395 | heparan sulfate proteoglycan binding(GO:0043395) |
| 0.1 | 3.6 | GO:0005523 | tropomyosin binding(GO:0005523) |
| 0.1 | 0.8 | GO:0004084 | branched-chain-amino-acid transaminase activity(GO:0004084) L-leucine transaminase activity(GO:0052654) L-valine transaminase activity(GO:0052655) L-isoleucine transaminase activity(GO:0052656) |
| 0.1 | 0.7 | GO:0016846 | carbon-sulfur lyase activity(GO:0016846) |
| 0.1 | 0.4 | GO:0047631 | ADP-ribose diphosphatase activity(GO:0047631) |
| 0.1 | 2.8 | GO:0004383 | guanylate cyclase activity(GO:0004383) |
| 0.1 | 12.1 | GO:0005201 | extracellular matrix structural constituent(GO:0005201) |
| 0.1 | 6.9 | GO:0004601 | peroxidase activity(GO:0004601) |
| 0.1 | 9.6 | GO:0046332 | SMAD binding(GO:0046332) |
| 0.1 | 2.8 | GO:0045503 | dynein light chain binding(GO:0045503) |
| 0.1 | 2.1 | GO:0003688 | DNA replication origin binding(GO:0003688) |
| 0.1 | 3.2 | GO:0003746 | translation elongation factor activity(GO:0003746) |
| 0.1 | 3.1 | GO:0016805 | dipeptidase activity(GO:0016805) |
| 0.1 | 2.2 | GO:0003755 | peptidyl-prolyl cis-trans isomerase activity(GO:0003755) cis-trans isomerase activity(GO:0016859) |
| 0.1 | 7.5 | GO:0004714 | transmembrane receptor protein tyrosine kinase activity(GO:0004714) |
| 0.1 | 17.8 | GO:0001078 | transcriptional repressor activity, RNA polymerase II core promoter proximal region sequence-specific binding(GO:0001078) |
| 0.1 | 8.1 | GO:0005518 | collagen binding(GO:0005518) |
| 0.1 | 12.3 | GO:0004222 | metalloendopeptidase activity(GO:0004222) |
| 0.1 | 1.0 | GO:0022841 | potassium ion leak channel activity(GO:0022841) |
| 0.1 | 15.9 | GO:0008083 | growth factor activity(GO:0008083) |
| 0.1 | 3.4 | GO:0001102 | RNA polymerase II activating transcription factor binding(GO:0001102) |
| 0.1 | 1.1 | GO:0001161 | intronic transcription regulatory region sequence-specific DNA binding(GO:0001161) intronic transcription regulatory region DNA binding(GO:0044213) |
| 0.1 | 0.6 | GO:0000293 | ferric-chelate reductase activity(GO:0000293) |
| 0.1 | 2.2 | GO:0032934 | sterol binding(GO:0032934) |
| 0.1 | 0.8 | GO:0042975 | peroxisome proliferator activated receptor binding(GO:0042975) |
| 0.1 | 3.2 | GO:0005109 | frizzled binding(GO:0005109) |
| 0.1 | 0.7 | GO:0016167 | glial cell-derived neurotrophic factor receptor activity(GO:0016167) |
| 0.1 | 1.0 | GO:0000774 | adenyl-nucleotide exchange factor activity(GO:0000774) |
| 0.1 | 1.5 | GO:0015347 | sodium-independent organic anion transmembrane transporter activity(GO:0015347) |
| 0.1 | 3.5 | GO:0008139 | nuclear localization sequence binding(GO:0008139) |
| 0.1 | 0.7 | GO:0015186 | L-glutamine transmembrane transporter activity(GO:0015186) |
| 0.1 | 1.5 | GO:0035173 | histone kinase activity(GO:0035173) |
| 0.1 | 2.3 | GO:1990841 | promoter-specific chromatin binding(GO:1990841) |
| 0.1 | 4.2 | GO:0042162 | telomeric DNA binding(GO:0042162) |
| 0.1 | 1.4 | GO:0005149 | interleukin-1 receptor binding(GO:0005149) |
| 0.1 | 1.8 | GO:0032266 | phosphatidylinositol-3-phosphate binding(GO:0032266) |
| 0.1 | 5.4 | GO:0002039 | p53 binding(GO:0002039) |
| 0.1 | 1.9 | GO:0016712 | oxidoreductase activity, acting on paired donors, with incorporation or reduction of molecular oxygen, reduced flavin or flavoprotein as one donor, and incorporation of one atom of oxygen(GO:0016712) |
| 0.1 | 12.9 | GO:0017137 | Rab GTPase binding(GO:0017137) |
| 0.1 | 0.6 | GO:0050700 | CARD domain binding(GO:0050700) |
| 0.1 | 0.9 | GO:0004931 | extracellular ATP-gated cation channel activity(GO:0004931) ATP-gated ion channel activity(GO:0035381) |
| 0.1 | 7.2 | GO:0008170 | N-methyltransferase activity(GO:0008170) |
| 0.1 | 2.1 | GO:0005527 | macrolide binding(GO:0005527) FK506 binding(GO:0005528) |
| 0.1 | 1.3 | GO:0030898 | actin-dependent ATPase activity(GO:0030898) |
| 0.1 | 0.4 | GO:0032050 | clathrin heavy chain binding(GO:0032050) |
| 0.1 | 1.9 | GO:0005547 | phosphatidylinositol-3,4,5-trisphosphate binding(GO:0005547) |
| 0.1 | 0.3 | GO:0050692 | DBD domain binding(GO:0050692) |
| 0.1 | 0.2 | GO:0035650 | AP-1 adaptor complex binding(GO:0035650) |
| 0.1 | 0.5 | GO:0035368 | selenocysteine insertion sequence binding(GO:0035368) |
| 0.1 | 2.0 | GO:0005388 | calcium-transporting ATPase activity(GO:0005388) |
| 0.1 | 0.4 | GO:0044736 | acid-sensing ion channel activity(GO:0044736) |
| 0.1 | 0.7 | GO:0004767 | sphingomyelin phosphodiesterase activity(GO:0004767) |
| 0.1 | 0.8 | GO:0097016 | L27 domain binding(GO:0097016) |
| 0.1 | 2.5 | GO:0008081 | phosphoric diester hydrolase activity(GO:0008081) |
| 0.1 | 0.3 | GO:0000990 | transcription factor activity, core RNA polymerase binding(GO:0000990) |
| 0.1 | 1.1 | GO:0051879 | Hsp90 protein binding(GO:0051879) |
| 0.1 | 0.4 | GO:0045029 | UDP-activated nucleotide receptor activity(GO:0045029) |
| 0.1 | 1.2 | GO:0004190 | aspartic-type endopeptidase activity(GO:0004190) aspartic-type peptidase activity(GO:0070001) |
| 0.1 | 2.0 | GO:0005044 | scavenger receptor activity(GO:0005044) |
| 0.1 | 0.6 | GO:0047498 | calcium-dependent phospholipase A2 activity(GO:0047498) |
| 0.1 | 2.2 | GO:0017091 | AU-rich element binding(GO:0017091) |
| 0.1 | 0.4 | GO:0070739 | protein-glutamic acid ligase activity(GO:0070739) |
| 0.1 | 2.4 | GO:0004683 | calmodulin-dependent protein kinase activity(GO:0004683) |
| 0.1 | 1.3 | GO:0003841 | 1-acylglycerol-3-phosphate O-acyltransferase activity(GO:0003841) |
| 0.1 | 0.5 | GO:0086083 | cell adhesive protein binding involved in bundle of His cell-Purkinje myocyte communication(GO:0086083) |
| 0.1 | 1.9 | GO:0005184 | neuropeptide hormone activity(GO:0005184) |
| 0.1 | 1.4 | GO:0030331 | estrogen receptor binding(GO:0030331) |
| 0.1 | 1.8 | GO:0015020 | glucuronosyltransferase activity(GO:0015020) |
| 0.1 | 0.7 | GO:0000175 | 3'-5'-exoribonuclease activity(GO:0000175) |
| 0.1 | 2.4 | GO:0008013 | beta-catenin binding(GO:0008013) |
| 0.1 | 2.3 | GO:0050681 | androgen receptor binding(GO:0050681) |
| 0.1 | 0.8 | GO:0008417 | fucosyltransferase activity(GO:0008417) |
| 0.1 | 1.0 | GO:0008656 | cysteine-type endopeptidase activator activity involved in apoptotic process(GO:0008656) |
| 0.1 | 0.8 | GO:0042813 | Wnt-activated receptor activity(GO:0042813) |
| 0.0 | 1.5 | GO:0005212 | structural constituent of eye lens(GO:0005212) |
| 0.0 | 3.9 | GO:0008307 | structural constituent of muscle(GO:0008307) |
| 0.0 | 0.6 | GO:0001164 | RNA polymerase I regulatory region DNA binding(GO:0001013) RNA polymerase I regulatory region sequence-specific DNA binding(GO:0001163) RNA polymerase I CORE element sequence-specific DNA binding(GO:0001164) |
| 0.0 | 0.3 | GO:0000340 | RNA 7-methylguanosine cap binding(GO:0000340) |
| 0.0 | 1.0 | GO:0004181 | metallocarboxypeptidase activity(GO:0004181) |
| 0.0 | 0.2 | GO:0005328 | neurotransmitter:sodium symporter activity(GO:0005328) |
| 0.0 | 0.1 | GO:0004958 | prostaglandin F receptor activity(GO:0004958) |
| 0.0 | 0.3 | GO:0043142 | DNA clamp loader activity(GO:0003689) protein-DNA loading ATPase activity(GO:0033170) single-stranded DNA-dependent ATPase activity(GO:0043142) |
| 0.0 | 0.7 | GO:0016702 | oxidoreductase activity, acting on single donors with incorporation of molecular oxygen, incorporation of two atoms of oxygen(GO:0016702) |
| 0.0 | 1.7 | GO:0030971 | receptor tyrosine kinase binding(GO:0030971) |
| 0.0 | 0.5 | GO:0003899 | DNA-directed RNA polymerase activity(GO:0003899) RNA polymerase activity(GO:0034062) |
| 0.0 | 2.0 | GO:0003777 | microtubule motor activity(GO:0003777) |
| 0.0 | 2.3 | GO:0030674 | protein binding, bridging(GO:0030674) |
| 0.0 | 0.2 | GO:0015185 | gamma-aminobutyric acid:sodium symporter activity(GO:0005332) gamma-aminobutyric acid transmembrane transporter activity(GO:0015185) |
| 0.0 | 0.2 | GO:0016416 | carnitine O-palmitoyltransferase activity(GO:0004095) O-palmitoyltransferase activity(GO:0016416) |
| 0.0 | 0.3 | GO:0016312 | inositol bisphosphate phosphatase activity(GO:0016312) |
| 0.0 | 0.4 | GO:0043024 | ribosomal small subunit binding(GO:0043024) |
| 0.0 | 0.3 | GO:0015280 | ligand-gated sodium channel activity(GO:0015280) |
| 0.0 | 1.6 | GO:0003730 | mRNA 3'-UTR binding(GO:0003730) |
| 0.0 | 1.7 | GO:0008146 | sulfotransferase activity(GO:0008146) |
| 0.0 | 0.7 | GO:0070566 | adenylyltransferase activity(GO:0070566) |
| 0.0 | 0.7 | GO:0015175 | neutral amino acid transmembrane transporter activity(GO:0015175) |
| 0.0 | 2.5 | GO:0016746 | transferase activity, transferring acyl groups(GO:0016746) |
| 0.0 | 1.3 | GO:0001618 | virus receptor activity(GO:0001618) |
| 0.0 | 44.9 | GO:0003677 | DNA binding(GO:0003677) |
| 0.0 | 0.7 | GO:0030291 | protein serine/threonine kinase inhibitor activity(GO:0030291) |
| 0.0 | 1.3 | GO:0015459 | potassium channel regulator activity(GO:0015459) |
| 0.0 | 0.3 | GO:0004559 | alpha-mannosidase activity(GO:0004559) |
| 0.0 | 1.0 | GO:0030170 | pyridoxal phosphate binding(GO:0030170) |
| 0.0 | 0.5 | GO:0008143 | poly(A) binding(GO:0008143) |
| 0.0 | 0.3 | GO:0005123 | death receptor binding(GO:0005123) |
| 0.0 | 0.4 | GO:0016779 | nucleotidyltransferase activity(GO:0016779) |
| 0.0 | 0.1 | GO:0050811 | GABA receptor binding(GO:0050811) |
| 0.0 | 3.6 | GO:0004252 | serine-type endopeptidase activity(GO:0004252) |
| 0.0 | 0.2 | GO:0004659 | prenyltransferase activity(GO:0004659) |
| 0.0 | 2.7 | GO:0005096 | GTPase activator activity(GO:0005096) |
| 0.0 | 0.1 | GO:0042974 | retinoic acid receptor binding(GO:0042974) |
Gene overrepresentation in C2:CP category:
| Log-likelihood per target | Total log-likelihood | Term | Description |
|---|---|---|---|
| 0.8 | 3.0 | PID ALK1 PATHWAY | ALK1 signaling events |
| 0.6 | 31.9 | NABA BASEMENT MEMBRANES | Genes encoding structural components of basement membranes |
| 0.5 | 18.7 | PID ERBB NETWORK PATHWAY | ErbB receptor signaling network |
| 0.5 | 4.9 | PID S1P S1P3 PATHWAY | S1P3 pathway |
| 0.5 | 9.3 | PID VEGF VEGFR PATHWAY | VEGF and VEGFR signaling network |
| 0.5 | 21.4 | PID RXR VDR PATHWAY | RXR and RAR heterodimerization with other nuclear receptor |
| 0.4 | 26.3 | PID CDC42 REG PATHWAY | Regulation of CDC42 activity |
| 0.4 | 6.2 | PID CDC42 PATHWAY | CDC42 signaling events |
| 0.4 | 23.0 | SIG CD40PATHWAYMAP | Genes related to CD40 signaling |
| 0.4 | 8.8 | ST G ALPHA S PATHWAY | G alpha s Pathway |
| 0.4 | 20.8 | PID ATM PATHWAY | ATM pathway |
| 0.4 | 9.2 | PID CIRCADIAN PATHWAY | Circadian rhythm pathway |
| 0.4 | 9.4 | PID ARF 3PATHWAY | Arf1 pathway |
| 0.3 | 12.4 | ST GA12 PATHWAY | G alpha 12 Pathway |
| 0.3 | 3.9 | ST JAK STAT PATHWAY | Jak-STAT Pathway |
| 0.3 | 21.2 | PID FRA PATHWAY | Validated transcriptional targets of AP1 family members Fra1 and Fra2 |
| 0.3 | 7.2 | PID NETRIN PATHWAY | Netrin-mediated signaling events |
| 0.3 | 13.1 | PID ERBB4 PATHWAY | ErbB4 signaling events |
| 0.3 | 2.2 | ST PAC1 RECEPTOR PATHWAY | PAC1 Receptor Pathway |
| 0.3 | 9.3 | SA MMP CYTOKINE CONNECTION | Cytokines can induce activation of matrix metalloproteinases, which degrade extracellular matrix. |
| 0.3 | 12.8 | PID UPA UPAR PATHWAY | Urokinase-type plasminogen activator (uPA) and uPAR-mediated signaling |
| 0.3 | 4.3 | ST DIFFERENTIATION PATHWAY IN PC12 CELLS | Differentiation Pathway in PC12 Cells; this is a specific case of PAC1 Receptor Pathway. |
| 0.3 | 10.6 | PID ANGIOPOIETIN RECEPTOR PATHWAY | Angiopoietin receptor Tie2-mediated signaling |
| 0.2 | 9.7 | PID SYNDECAN 4 PATHWAY | Syndecan-4-mediated signaling events |
| 0.2 | 13.1 | PID CERAMIDE PATHWAY | Ceramide signaling pathway |
| 0.2 | 21.3 | PID HIF1 TFPATHWAY | HIF-1-alpha transcription factor network |
| 0.2 | 46.0 | NABA ECM GLYCOPROTEINS | Genes encoding structural ECM glycoproteins |
| 0.2 | 10.8 | PID ER NONGENOMIC PATHWAY | Plasma membrane estrogen receptor signaling |
| 0.2 | 14.1 | ST FAS SIGNALING PATHWAY | Fas Signaling Pathway |
| 0.2 | 12.8 | PID DELTA NP63 PATHWAY | Validated transcriptional targets of deltaNp63 isoforms |
| 0.2 | 9.5 | PID RHOA PATHWAY | RhoA signaling pathway |
| 0.2 | 0.9 | ST PHOSPHOINOSITIDE 3 KINASE PATHWAY | PI3K Pathway |
| 0.2 | 3.2 | PID ERBB2 ERBB3 PATHWAY | ErbB2/ErbB3 signaling events |
| 0.2 | 2.8 | PID LPA4 PATHWAY | LPA4-mediated signaling events |
| 0.2 | 17.1 | PID AR PATHWAY | Coregulation of Androgen receptor activity |
| 0.2 | 10.6 | PID TRKR PATHWAY | Neurotrophic factor-mediated Trk receptor signaling |
| 0.2 | 3.4 | PID RET PATHWAY | Signaling events regulated by Ret tyrosine kinase |
| 0.2 | 2.1 | SA PROGRAMMED CELL DEATH | Programmed cell death, or apoptosis, eliminates damaged or unneeded cells. |
| 0.2 | 13.6 | PID E2F PATHWAY | E2F transcription factor network |
| 0.2 | 2.2 | PID VEGFR1 2 PATHWAY | Signaling events mediated by VEGFR1 and VEGFR2 |
| 0.1 | 2.0 | ST GA13 PATHWAY | G alpha 13 Pathway |
| 0.1 | 4.4 | PID TNF PATHWAY | TNF receptor signaling pathway |
| 0.1 | 1.5 | PID PI3KCI AKT PATHWAY | Class I PI3K signaling events mediated by Akt |
| 0.1 | 32.2 | NABA ECM REGULATORS | Genes encoding enzymes and their regulators involved in the remodeling of the extracellular matrix |
| 0.1 | 7.3 | PID AURORA B PATHWAY | Aurora B signaling |
| 0.1 | 1.3 | ST INTEGRIN SIGNALING PATHWAY | Integrin Signaling Pathway |
| 0.1 | 5.7 | NABA PROTEOGLYCANS | Genes encoding proteoglycans |
| 0.1 | 2.8 | PID IL8 CXCR1 PATHWAY | IL8- and CXCR1-mediated signaling events |
| 0.1 | 2.3 | PID HEDGEHOG 2PATHWAY | Signaling events mediated by the Hedgehog family |
| 0.1 | 2.6 | PID IL27 PATHWAY | IL27-mediated signaling events |
| 0.1 | 2.1 | PID ENDOTHELIN PATHWAY | Endothelins |
| 0.1 | 1.1 | PID AJDISS 2PATHWAY | Posttranslational regulation of adherens junction stability and dissassembly |
| 0.1 | 4.0 | PID AR TF PATHWAY | Regulation of Androgen receptor activity |
| 0.1 | 19.1 | NABA ECM AFFILIATED | Genes encoding proteins affiliated structurally or functionally to extracellular matrix proteins |
| 0.1 | 1.2 | PID WNT NONCANONICAL PATHWAY | Noncanonical Wnt signaling pathway |
| 0.1 | 2.1 | PID HIF2PATHWAY | HIF-2-alpha transcription factor network |
| 0.1 | 1.5 | ST ADRENERGIC | Adrenergic Pathway |
| 0.1 | 2.5 | PID RAS PATHWAY | Regulation of Ras family activation |
| 0.1 | 2.4 | PID IL1 PATHWAY | IL1-mediated signaling events |
| 0.1 | 5.7 | PID LKB1 PATHWAY | LKB1 signaling events |
| 0.1 | 1.3 | PID WNT CANONICAL PATHWAY | Canonical Wnt signaling pathway |
| 0.1 | 1.3 | PID EPHB FWD PATHWAY | EPHB forward signaling |
| 0.1 | 0.6 | PID IL23 PATHWAY | IL23-mediated signaling events |
| 0.1 | 0.4 | PID ERB GENOMIC PATHWAY | Validated nuclear estrogen receptor beta network |
| 0.1 | 3.3 | PID HNF3B PATHWAY | FOXA2 and FOXA3 transcription factor networks |
| 0.1 | 1.0 | PID FAK PATHWAY | Signaling events mediated by focal adhesion kinase |
| 0.1 | 1.6 | ST WNT BETA CATENIN PATHWAY | Wnt/beta-catenin Pathway |
| 0.1 | 2.5 | PID CASPASE PATHWAY | Caspase cascade in apoptosis |
| 0.0 | 1.6 | PID FGF PATHWAY | FGF signaling pathway |
| 0.0 | 2.0 | PID MTOR 4PATHWAY | mTOR signaling pathway |
| 0.0 | 0.6 | PID IL2 1PATHWAY | IL2-mediated signaling events |
| 0.0 | 0.7 | PID KIT PATHWAY | Signaling events mediated by Stem cell factor receptor (c-Kit) |
| 0.0 | 1.5 | PID TAP63 PATHWAY | Validated transcriptional targets of TAp63 isoforms |
| 0.0 | 1.6 | PID PLK1 PATHWAY | PLK1 signaling events |
| 0.0 | 1.4 | PID RB 1PATHWAY | Regulation of retinoblastoma protein |
| 0.0 | 0.9 | PID FANCONI PATHWAY | Fanconi anemia pathway |
| 0.0 | 0.8 | PID HES HEY PATHWAY | Notch-mediated HES/HEY network |
| 0.0 | 0.9 | PID P75 NTR PATHWAY | p75(NTR)-mediated signaling |
| 0.0 | 0.5 | PID ATF2 PATHWAY | ATF-2 transcription factor network |
| 0.0 | 0.4 | PID MYC PATHWAY | C-MYC pathway |
Gene overrepresentation in C2:CP:REACTOME category:
| Log-likelihood per target | Total log-likelihood | Term | Description |
|---|---|---|---|
| 1.3 | 3.8 | REACTOME APC C CDH1 MEDIATED DEGRADATION OF CDC20 AND OTHER APC C CDH1 TARGETED PROTEINS IN LATE MITOSIS EARLY G1 | Genes involved in APC/C:Cdh1 mediated degradation of Cdc20 and other APC/C:Cdh1 targeted proteins in late mitosis/early G1 |
| 1.2 | 10.7 | REACTOME BASIGIN INTERACTIONS | Genes involved in Basigin interactions |
| 0.9 | 15.6 | REACTOME PLATELET ADHESION TO EXPOSED COLLAGEN | Genes involved in Platelet Adhesion to exposed collagen |
| 0.6 | 7.1 | REACTOME RECRUITMENT OF NUMA TO MITOTIC CENTROSOMES | Genes involved in Recruitment of NuMA to mitotic centrosomes |
| 0.6 | 11.4 | REACTOME PROCESSING OF INTRONLESS PRE MRNAS | Genes involved in Processing of Intronless Pre-mRNAs |
| 0.6 | 14.5 | REACTOME DOWNREGULATION OF ERBB2 ERBB3 SIGNALING | Genes involved in Downregulation of ERBB2:ERBB3 signaling |
| 0.6 | 39.9 | REACTOME METABOLISM OF VITAMINS AND COFACTORS | Genes involved in Metabolism of vitamins and cofactors |
| 0.5 | 6.4 | REACTOME RNA POL III CHAIN ELONGATION | Genes involved in RNA Polymerase III Chain Elongation |
| 0.5 | 21.3 | REACTOME EGFR DOWNREGULATION | Genes involved in EGFR downregulation |
| 0.5 | 7.7 | REACTOME E2F ENABLED INHIBITION OF PRE REPLICATION COMPLEX FORMATION | Genes involved in E2F-enabled inhibition of pre-replication complex formation |
| 0.5 | 8.6 | REACTOME SIGNAL ATTENUATION | Genes involved in Signal attenuation |
| 0.5 | 8.8 | REACTOME SYNTHESIS SECRETION AND INACTIVATION OF GIP | Genes involved in Synthesis, Secretion, and Inactivation of Glucose-dependent Insulinotropic Polypeptide (GIP) |
| 0.5 | 9.3 | REACTOME VEGF LIGAND RECEPTOR INTERACTIONS | Genes involved in VEGF ligand-receptor interactions |
| 0.5 | 9.1 | REACTOME REGULATION OF RHEB GTPASE ACTIVITY BY AMPK | Genes involved in Regulation of Rheb GTPase activity by AMPK |
| 0.4 | 11.0 | REACTOME PROLACTIN RECEPTOR SIGNALING | Genes involved in Prolactin receptor signaling |
| 0.4 | 7.1 | REACTOME BMAL1 CLOCK NPAS2 ACTIVATES CIRCADIAN EXPRESSION | Genes involved in BMAL1:CLOCK/NPAS2 Activates Circadian Expression |
| 0.4 | 6.6 | REACTOME ZINC TRANSPORTERS | Genes involved in Zinc transporters |
| 0.4 | 2.4 | REACTOME OPIOID SIGNALLING | Genes involved in Opioid Signalling |
| 0.4 | 7.3 | REACTOME INTEGRATION OF PROVIRUS | Genes involved in Integration of provirus |
| 0.4 | 2.0 | REACTOME MRNA CAPPING | Genes involved in mRNA Capping |
| 0.4 | 1.4 | REACTOME NRAGE SIGNALS DEATH THROUGH JNK | Genes involved in NRAGE signals death through JNK |
| 0.3 | 3.7 | REACTOME PACKAGING OF TELOMERE ENDS | Genes involved in Packaging Of Telomere Ends |
| 0.3 | 2.9 | REACTOME REGULATION OF THE FANCONI ANEMIA PATHWAY | Genes involved in Regulation of the Fanconi anemia pathway |
| 0.3 | 19.6 | REACTOME COLLAGEN FORMATION | Genes involved in Collagen formation |
| 0.3 | 26.5 | REACTOME NUCLEAR RECEPTOR TRANSCRIPTION PATHWAY | Genes involved in Nuclear Receptor transcription pathway |
| 0.3 | 10.8 | REACTOME PTM GAMMA CARBOXYLATION HYPUSINE FORMATION AND ARYLSULFATASE ACTIVATION | Genes involved in PTM: gamma carboxylation, hypusine formation and arylsulfatase activation |
| 0.3 | 4.0 | REACTOME NEF MEDIATED DOWNREGULATION OF MHC CLASS I COMPLEX CELL SURFACE EXPRESSION | Genes involved in Nef mediated downregulation of MHC class I complex cell surface expression |
| 0.3 | 3.2 | REACTOME SEMA3A PLEXIN REPULSION SIGNALING BY INHIBITING INTEGRIN ADHESION | Genes involved in SEMA3A-Plexin repulsion signaling by inhibiting Integrin adhesion |
| 0.3 | 4.8 | REACTOME GAP JUNCTION ASSEMBLY | Genes involved in Gap junction assembly |
| 0.3 | 3.9 | REACTOME REVERSIBLE HYDRATION OF CARBON DIOXIDE | Genes involved in Reversible Hydration of Carbon Dioxide |
| 0.2 | 11.5 | REACTOME SMAD2 SMAD3 SMAD4 HETEROTRIMER REGULATES TRANSCRIPTION | Genes involved in SMAD2/SMAD3:SMAD4 heterotrimer regulates transcription |
| 0.2 | 2.8 | REACTOME ADENYLATE CYCLASE ACTIVATING PATHWAY | Genes involved in Adenylate cyclase activating pathway |
| 0.2 | 4.2 | REACTOME ALPHA LINOLENIC ACID ALA METABOLISM | Genes involved in alpha-linolenic acid (ALA) metabolism |
| 0.2 | 4.0 | REACTOME EICOSANOID LIGAND BINDING RECEPTORS | Genes involved in Eicosanoid ligand-binding receptors |
| 0.2 | 4.9 | REACTOME SIGNALING BY HIPPO | Genes involved in Signaling by Hippo |
| 0.2 | 10.8 | REACTOME COMPLEMENT CASCADE | Genes involved in Complement cascade |
| 0.2 | 8.1 | REACTOME A TETRASACCHARIDE LINKER SEQUENCE IS REQUIRED FOR GAG SYNTHESIS | Genes involved in A tetrasaccharide linker sequence is required for GAG synthesis |
| 0.2 | 2.8 | REACTOME ABACAVIR TRANSPORT AND METABOLISM | Genes involved in Abacavir transport and metabolism |
| 0.2 | 2.9 | REACTOME ANDROGEN BIOSYNTHESIS | Genes involved in Androgen biosynthesis |
| 0.2 | 4.0 | REACTOME TRAF3 DEPENDENT IRF ACTIVATION PATHWAY | Genes involved in TRAF3-dependent IRF activation pathway |
| 0.2 | 1.9 | REACTOME INCRETIN SYNTHESIS SECRETION AND INACTIVATION | Genes involved in Incretin Synthesis, Secretion, and Inactivation |
| 0.2 | 5.0 | REACTOME SIGNALING BY BMP | Genes involved in Signaling by BMP |
| 0.2 | 12.5 | REACTOME RNA POL II TRANSCRIPTION PRE INITIATION AND PROMOTER OPENING | Genes involved in RNA Polymerase II Transcription Pre-Initiation And Promoter Opening |
| 0.2 | 4.4 | REACTOME THROMBIN SIGNALLING THROUGH PROTEINASE ACTIVATED RECEPTORS PARS | Genes involved in Thrombin signalling through proteinase activated receptors (PARs) |
| 0.2 | 2.0 | REACTOME FORMATION OF TRANSCRIPTION COUPLED NER TC NER REPAIR COMPLEX | Genes involved in Formation of transcription-coupled NER (TC-NER) repair complex |
| 0.2 | 7.2 | REACTOME EXTRACELLULAR MATRIX ORGANIZATION | Genes involved in Extracellular matrix organization |
| 0.2 | 2.9 | REACTOME G PROTEIN ACTIVATION | Genes involved in G-protein activation |
| 0.2 | 4.8 | REACTOME G BETA GAMMA SIGNALLING THROUGH PI3KGAMMA | Genes involved in G beta:gamma signalling through PI3Kgamma |
| 0.2 | 3.8 | REACTOME STEROID HORMONES | Genes involved in Steroid hormones |
| 0.2 | 3.6 | REACTOME AMINE DERIVED HORMONES | Genes involved in Amine-derived hormones |
| 0.2 | 9.9 | REACTOME CHEMOKINE RECEPTORS BIND CHEMOKINES | Genes involved in Chemokine receptors bind chemokines |
| 0.2 | 1.5 | REACTOME INHIBITION OF REPLICATION INITIATION OF DAMAGED DNA BY RB1 E2F1 | Genes involved in Inhibition of replication initiation of damaged DNA by RB1/E2F1 |
| 0.2 | 1.7 | REACTOME NFKB IS ACTIVATED AND SIGNALS SURVIVAL | Genes involved in NF-kB is activated and signals survival |
| 0.1 | 7.9 | REACTOME ION TRANSPORT BY P TYPE ATPASES | Genes involved in Ion transport by P-type ATPases |
| 0.1 | 4.3 | REACTOME AMINE LIGAND BINDING RECEPTORS | Genes involved in Amine ligand-binding receptors |
| 0.1 | 1.7 | REACTOME RNA POL II PRE TRANSCRIPTION EVENTS | Genes involved in RNA Polymerase II Pre-transcription Events |
| 0.1 | 3.1 | REACTOME NUCLEOTIDE LIKE PURINERGIC RECEPTORS | Genes involved in Nucleotide-like (purinergic) receptors |
| 0.1 | 1.4 | REACTOME ACTIVATION OF CHAPERONE GENES BY ATF6 ALPHA | Genes involved in Activation of Chaperone Genes by ATF6-alpha |
| 0.1 | 2.8 | REACTOME NA CL DEPENDENT NEUROTRANSMITTER TRANSPORTERS | Genes involved in Na+/Cl- dependent neurotransmitter transporters |
| 0.1 | 12.6 | REACTOME CLASS B 2 SECRETIN FAMILY RECEPTORS | Genes involved in Class B/2 (Secretin family receptors) |
| 0.1 | 2.2 | REACTOME CHYLOMICRON MEDIATED LIPID TRANSPORT | Genes involved in Chylomicron-mediated lipid transport |
| 0.1 | 1.8 | REACTOME IL 7 SIGNALING | Genes involved in Interleukin-7 signaling |
| 0.1 | 1.7 | REACTOME ACTIVATED AMPK STIMULATES FATTY ACID OXIDATION IN MUSCLE | Genes involved in Activated AMPK stimulates fatty-acid oxidation in muscle |
| 0.1 | 14.4 | REACTOME PPARA ACTIVATES GENE EXPRESSION | Genes involved in PPARA Activates Gene Expression |
| 0.1 | 4.1 | REACTOME INTERACTION BETWEEN L1 AND ANKYRINS | Genes involved in Interaction between L1 and Ankyrins |
| 0.1 | 2.1 | REACTOME CLASS C 3 METABOTROPIC GLUTAMATE PHEROMONE RECEPTORS | Genes involved in Class C/3 (Metabotropic glutamate/pheromone receptors) |
| 0.1 | 8.3 | REACTOME ACTIVATION OF CHAPERONE GENES BY XBP1S | Genes involved in Activation of Chaperone Genes by XBP1(S) |
| 0.1 | 2.5 | REACTOME GLUCONEOGENESIS | Genes involved in Gluconeogenesis |
| 0.1 | 1.9 | REACTOME XENOBIOTICS | Genes involved in Xenobiotics |
| 0.1 | 2.1 | REACTOME THE NLRP3 INFLAMMASOME | Genes involved in The NLRP3 inflammasome |
| 0.1 | 7.5 | REACTOME G ALPHA S SIGNALLING EVENTS | Genes involved in G alpha (s) signalling events |
| 0.1 | 4.3 | REACTOME NEGATIVE REGULATION OF FGFR SIGNALING | Genes involved in Negative regulation of FGFR signaling |
| 0.1 | 0.3 | REACTOME PI3K AKT ACTIVATION | Genes involved in PI3K/AKT activation |
| 0.1 | 1.7 | REACTOME REGULATION OF GENE EXPRESSION IN BETA CELLS | Genes involved in Regulation of gene expression in beta cells |
| 0.1 | 2.0 | REACTOME HYALURONAN UPTAKE AND DEGRADATION | Genes involved in Hyaluronan uptake and degradation |
| 0.1 | 3.2 | REACTOME PIP3 ACTIVATES AKT SIGNALING | Genes involved in PIP3 activates AKT signaling |
| 0.1 | 1.6 | REACTOME RIG I MDA5 MEDIATED INDUCTION OF IFN ALPHA BETA PATHWAYS | Genes involved in RIG-I/MDA5 mediated induction of IFN-alpha/beta pathways |
| 0.1 | 5.3 | REACTOME MYOGENESIS | Genes involved in Myogenesis |
| 0.1 | 6.2 | REACTOME DEPOSITION OF NEW CENPA CONTAINING NUCLEOSOMES AT THE CENTROMERE | Genes involved in Deposition of New CENPA-containing Nucleosomes at the Centromere |
| 0.1 | 1.4 | REACTOME PASSIVE TRANSPORT BY AQUAPORINS | Genes involved in Passive Transport by Aquaporins |
| 0.1 | 3.5 | REACTOME DEADENYLATION OF MRNA | Genes involved in Deadenylation of mRNA |
| 0.1 | 1.2 | REACTOME RNA POL III TRANSCRIPTION INITIATION FROM TYPE 3 PROMOTER | Genes involved in RNA Polymerase III Transcription Initiation From Type 3 Promoter |
| 0.1 | 1.0 | REACTOME SEMA3A PAK DEPENDENT AXON REPULSION | Genes involved in Sema3A PAK dependent Axon repulsion |
| 0.1 | 7.9 | REACTOME LOSS OF NLP FROM MITOTIC CENTROSOMES | Genes involved in Loss of Nlp from mitotic centrosomes |
| 0.1 | 3.9 | REACTOME OLFACTORY SIGNALING PATHWAY | Genes involved in Olfactory Signaling Pathway |
| 0.1 | 2.1 | REACTOME N GLYCAN ANTENNAE ELONGATION | Genes involved in N-Glycan antennae elongation |
| 0.1 | 1.2 | REACTOME ACYL CHAIN REMODELLING OF PG | Genes involved in Acyl chain remodelling of PG |
| 0.1 | 1.4 | REACTOME FACILITATIVE NA INDEPENDENT GLUCOSE TRANSPORTERS | Genes involved in Facilitative Na+-independent glucose transporters |
| 0.1 | 1.7 | REACTOME PHOSPHORYLATION OF THE APC C | Genes involved in Phosphorylation of the APC/C |
| 0.1 | 1.8 | REACTOME NEPHRIN INTERACTIONS | Genes involved in Nephrin interactions |
| 0.1 | 1.7 | REACTOME GLUCURONIDATION | Genes involved in Glucuronidation |
| 0.1 | 3.0 | REACTOME GLYCOLYSIS | Genes involved in Glycolysis |
| 0.1 | 1.8 | REACTOME KINESINS | Genes involved in Kinesins |
| 0.1 | 2.5 | REACTOME TIGHT JUNCTION INTERACTIONS | Genes involved in Tight junction interactions |
| 0.1 | 0.8 | REACTOME HDL MEDIATED LIPID TRANSPORT | Genes involved in HDL-mediated lipid transport |
| 0.1 | 2.2 | REACTOME SPHINGOLIPID DE NOVO BIOSYNTHESIS | Genes involved in Sphingolipid de novo biosynthesis |
| 0.1 | 1.1 | REACTOME SIGNALING BY ERBB2 | Genes involved in Signaling by ERBB2 |
| 0.1 | 1.4 | REACTOME CGMP EFFECTS | Genes involved in cGMP effects |
| 0.1 | 0.8 | REACTOME FANCONI ANEMIA PATHWAY | Genes involved in Fanconi Anemia pathway |
| 0.0 | 4.9 | REACTOME G ALPHA I SIGNALLING EVENTS | Genes involved in G alpha (i) signalling events |
| 0.0 | 2.1 | REACTOME MEIOTIC RECOMBINATION | Genes involved in Meiotic Recombination |
| 0.0 | 1.1 | REACTOME CHOLESTEROL BIOSYNTHESIS | Genes involved in Cholesterol biosynthesis |
| 0.0 | 0.7 | REACTOME ORGANIC CATION ANION ZWITTERION TRANSPORT | Genes involved in Organic cation/anion/zwitterion transport |
| 0.0 | 1.2 | REACTOME MRNA 3 END PROCESSING | Genes involved in mRNA 3'-end processing |
| 0.0 | 0.6 | REACTOME NOD1 2 SIGNALING PATHWAY | Genes involved in NOD1/2 Signaling Pathway |
| 0.0 | 1.0 | REACTOME SIGNALING BY ROBO RECEPTOR | Genes involved in Signaling by Robo receptor |
| 0.0 | 0.8 | REACTOME PEROXISOMAL LIPID METABOLISM | Genes involved in Peroxisomal lipid metabolism |
| 0.0 | 2.8 | REACTOME FATTY ACID TRIACYLGLYCEROL AND KETONE BODY METABOLISM | Genes involved in Fatty acid, triacylglycerol, and ketone body metabolism |
| 0.0 | 2.3 | REACTOME GOLGI ASSOCIATED VESICLE BIOGENESIS | Genes involved in Golgi Associated Vesicle Biogenesis |
| 0.0 | 0.4 | REACTOME SEMA4D INDUCED CELL MIGRATION AND GROWTH CONE COLLAPSE | Genes involved in Sema4D induced cell migration and growth-cone collapse |
| 0.0 | 0.8 | REACTOME BRANCHED CHAIN AMINO ACID CATABOLISM | Genes involved in Branched-chain amino acid catabolism |
| 0.0 | 2.0 | REACTOME STRIATED MUSCLE CONTRACTION | Genes involved in Striated Muscle Contraction |
| 0.0 | 0.6 | REACTOME GABA SYNTHESIS RELEASE REUPTAKE AND DEGRADATION | Genes involved in GABA synthesis, release, reuptake and degradation |
| 0.0 | 1.0 | REACTOME TRANSPORT OF GLUCOSE AND OTHER SUGARS BILE SALTS AND ORGANIC ACIDS METAL IONS AND AMINE COMPOUNDS | Genes involved in Transport of glucose and other sugars, bile salts and organic acids, metal ions and amine compounds |
| 0.0 | 0.5 | REACTOME TRANSPORT OF ORGANIC ANIONS | Genes involved in Transport of organic anions |
| 0.0 | 0.4 | REACTOME CHONDROITIN SULFATE DERMATAN SULFATE METABOLISM | Genes involved in Chondroitin sulfate/dermatan sulfate metabolism |
| 0.0 | 0.7 | REACTOME NCAM1 INTERACTIONS | Genes involved in NCAM1 interactions |
| 0.0 | 1.1 | REACTOME REGULATION OF INSULIN SECRETION | Genes involved in Regulation of Insulin Secretion |
| 0.0 | 0.9 | REACTOME PEPTIDE LIGAND BINDING RECEPTORS | Genes involved in Peptide ligand-binding receptors |
| 0.0 | 1.0 | REACTOME CELL JUNCTION ORGANIZATION | Genes involved in Cell junction organization |
| 0.0 | 0.2 | REACTOME JNK C JUN KINASES PHOSPHORYLATION AND ACTIVATION MEDIATED BY ACTIVATED HUMAN TAK1 | Genes involved in JNK (c-Jun kinases) phosphorylation and activation mediated by activated human TAK1 |