Project
GNF SymAtlas + NCI-60 cancer cell lines, comparison of cancers vs non-cancers, human (Su, 2004; Ross, 2000)
Navigation
Downloads
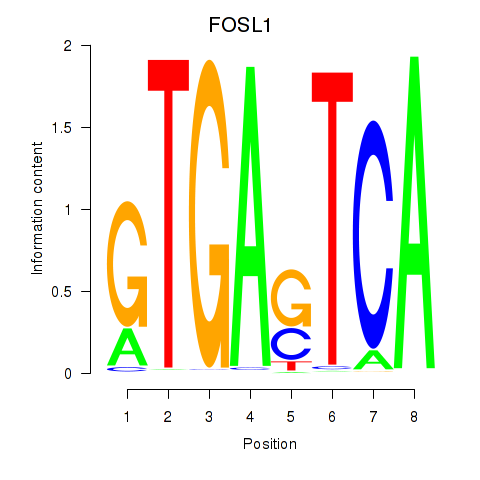
Results for FOSL1
Z-value: 0.26
Motif logo
Transcription factors associated with FOSL1
| Gene Symbol | Gene ID | Gene Info |
|---|---|---|
|
FOSL1
|
ENSG00000175592.4 | FOS like 1, AP-1 transcription factor subunit |
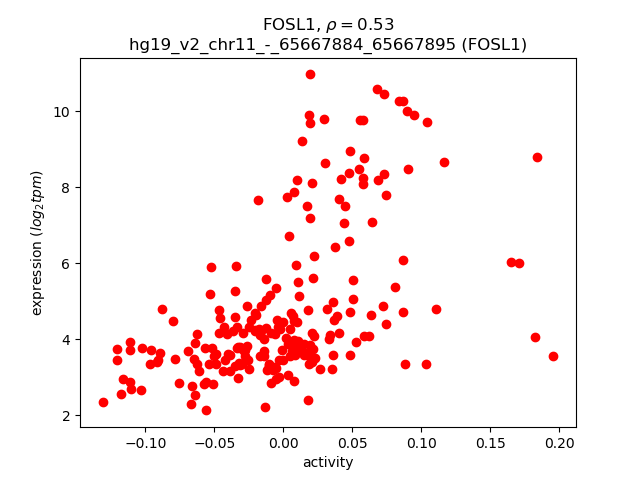
Activity-expression correlation:
| Gene | Promoter | Pearson corr. coef. | P-value | Plot |
|---|---|---|---|---|
| FOSL1 | hg19_v2_chr11_-_65667884_65667895 | 0.53 | 1.7e-17 | Click! |
Activity profile of FOSL1 motif
Sorted Z-values of FOSL1 motif
| Promoter | Log-likelihood | Transcript | Gene | Gene Info |
|---|---|---|---|---|
| chr1_-_113247543 | 47.45 |
ENST00000414971.1
ENST00000534717.1 |
RHOC
|
ras homolog family member C |
| chr1_+_223889285 | 45.30 |
ENST00000433674.2
|
CAPN2
|
calpain 2, (m/II) large subunit |
| chr1_-_151965048 | 35.32 |
ENST00000368809.1
|
S100A10
|
S100 calcium binding protein A10 |
| chr5_+_135394840 | 30.16 |
ENST00000503087.1
|
TGFBI
|
transforming growth factor, beta-induced, 68kDa |
| chr1_+_156084461 | 29.84 |
ENST00000347559.2
ENST00000361308.4 ENST00000368300.4 ENST00000368299.3 |
LMNA
|
lamin A/C |
| chr11_-_2950642 | 26.30 |
ENST00000314222.4
|
PHLDA2
|
pleckstrin homology-like domain, family A, member 2 |
| chr1_+_156096336 | 23.87 |
ENST00000504687.1
ENST00000473598.2 |
LMNA
|
lamin A/C |
| chr16_-_69760409 | 22.99 |
ENST00000561500.1
ENST00000439109.2 ENST00000564043.1 ENST00000379046.2 ENST00000379047.3 |
NQO1
|
NAD(P)H dehydrogenase, quinone 1 |
| chr7_+_55177416 | 22.60 |
ENST00000450046.1
ENST00000454757.2 |
EGFR
|
epidermal growth factor receptor |
| chr15_-_60690163 | 21.18 |
ENST00000558998.1
ENST00000560165.1 ENST00000557986.1 ENST00000559780.1 ENST00000559467.1 ENST00000559956.1 ENST00000332680.4 ENST00000396024.3 ENST00000421017.2 ENST00000560466.1 ENST00000558132.1 ENST00000559113.1 ENST00000557906.1 ENST00000558558.1 ENST00000560468.1 ENST00000559370.1 ENST00000558169.1 ENST00000559725.1 ENST00000558985.1 ENST00000451270.2 |
ANXA2
|
annexin A2 |
| chr1_+_223900034 | 20.79 |
ENST00000295006.5
|
CAPN2
|
calpain 2, (m/II) large subunit |
| chr11_-_65667997 | 19.79 |
ENST00000312562.2
ENST00000534222.1 |
FOSL1
|
FOS-like antigen 1 |
| chr1_-_95007193 | 19.66 |
ENST00000370207.4
ENST00000334047.7 |
F3
|
coagulation factor III (thromboplastin, tissue factor) |
| chr10_+_17270214 | 19.15 |
ENST00000544301.1
|
VIM
|
vimentin |
| chr11_-_65667884 | 18.72 |
ENST00000448083.2
ENST00000531493.1 ENST00000532401.1 |
FOSL1
|
FOS-like antigen 1 |
| chr6_-_138428613 | 18.49 |
ENST00000421351.3
|
PERP
|
PERP, TP53 apoptosis effector |
| chr12_+_13349650 | 18.44 |
ENST00000256951.5
ENST00000431267.2 ENST00000542474.1 ENST00000544053.1 |
EMP1
|
epithelial membrane protein 1 |
| chr7_-_107643674 | 18.30 |
ENST00000222399.6
|
LAMB1
|
laminin, beta 1 |
| chr18_+_21452804 | 18.23 |
ENST00000269217.6
|
LAMA3
|
laminin, alpha 3 |
| chr1_+_156095951 | 17.62 |
ENST00000448611.2
ENST00000368297.1 |
LMNA
|
lamin A/C |
| chr5_+_138089100 | 16.85 |
ENST00000520339.1
ENST00000355078.5 ENST00000302763.7 ENST00000518910.1 |
CTNNA1
|
catenin (cadherin-associated protein), alpha 1, 102kDa |
| chr1_-_154943002 | 16.17 |
ENST00000606391.1
|
SHC1
|
SHC (Src homology 2 domain containing) transforming protein 1 |
| chr1_-_152009460 | 15.54 |
ENST00000271638.2
|
S100A11
|
S100 calcium binding protein A11 |
| chr1_+_27189631 | 15.50 |
ENST00000339276.4
|
SFN
|
stratifin |
| chr11_+_394196 | 15.48 |
ENST00000331563.2
ENST00000531857.1 |
PKP3
|
plakophilin 3 |
| chr11_+_35198243 | 15.30 |
ENST00000528455.1
|
CD44
|
CD44 molecule (Indian blood group) |
| chr1_-_154943212 | 15.13 |
ENST00000368445.5
ENST00000448116.2 ENST00000368449.4 |
SHC1
|
SHC (Src homology 2 domain containing) transforming protein 1 |
| chr6_+_83072923 | 15.11 |
ENST00000535040.1
|
TPBG
|
trophoblast glycoprotein |
| chr3_-_149095652 | 14.53 |
ENST00000305366.3
|
TM4SF1
|
transmembrane 4 L six family member 1 |
| chr15_+_22892663 | 14.23 |
ENST00000313077.7
ENST00000561274.1 ENST00000560848.1 |
CYFIP1
|
cytoplasmic FMR1 interacting protein 1 |
| chr11_+_101983176 | 13.90 |
ENST00000524575.1
|
YAP1
|
Yes-associated protein 1 |
| chr12_-_56122761 | 13.57 |
ENST00000552164.1
ENST00000420846.3 ENST00000257857.4 |
CD63
|
CD63 molecule |
| chr10_+_121410882 | 13.46 |
ENST00000369085.3
|
BAG3
|
BCL2-associated athanogene 3 |
| chr7_+_48128194 | 13.21 |
ENST00000416681.1
ENST00000331803.4 ENST00000432131.1 |
UPP1
|
uridine phosphorylase 1 |
| chr1_-_159894319 | 13.13 |
ENST00000320307.4
|
TAGLN2
|
transgelin 2 |
| chr12_-_56122426 | 13.04 |
ENST00000551173.1
|
CD63
|
CD63 molecule |
| chr18_+_21452964 | 13.00 |
ENST00000587184.1
|
LAMA3
|
laminin, alpha 3 |
| chr11_+_35198118 | 12.90 |
ENST00000525211.1
ENST00000526000.1 ENST00000279452.6 ENST00000527889.1 |
CD44
|
CD44 molecule (Indian blood group) |
| chr7_+_48128316 | 12.88 |
ENST00000341253.4
|
UPP1
|
uridine phosphorylase 1 |
| chr1_+_169077172 | 12.77 |
ENST00000499679.3
|
ATP1B1
|
ATPase, Na+/K+ transporting, beta 1 polypeptide |
| chr4_+_169753156 | 12.74 |
ENST00000393726.3
ENST00000507735.1 |
PALLD
|
palladin, cytoskeletal associated protein |
| chr11_-_6341844 | 12.67 |
ENST00000303927.3
|
PRKCDBP
|
protein kinase C, delta binding protein |
| chr17_+_35851570 | 12.56 |
ENST00000394386.1
|
DUSP14
|
dual specificity phosphatase 14 |
| chr3_-_149293990 | 12.52 |
ENST00000472417.1
|
WWTR1
|
WW domain containing transcription regulator 1 |
| chr6_-_31704282 | 12.40 |
ENST00000375784.3
ENST00000375779.2 |
CLIC1
|
chloride intracellular channel 1 |
| chr1_+_150480551 | 12.34 |
ENST00000369049.4
ENST00000369047.4 |
ECM1
|
extracellular matrix protein 1 |
| chr1_+_150480576 | 11.95 |
ENST00000346569.6
|
ECM1
|
extracellular matrix protein 1 |
| chr11_-_102668879 | 11.87 |
ENST00000315274.6
|
MMP1
|
matrix metallopeptidase 1 (interstitial collagenase) |
| chr12_-_53343602 | 11.87 |
ENST00000546897.1
ENST00000552551.1 |
KRT8
|
keratin 8 |
| chr3_+_183894566 | 11.74 |
ENST00000439647.1
|
AP2M1
|
adaptor-related protein complex 2, mu 1 subunit |
| chr11_-_64013288 | 11.41 |
ENST00000542235.1
|
PPP1R14B
|
protein phosphatase 1, regulatory (inhibitor) subunit 14B |
| chr3_-_151034734 | 11.20 |
ENST00000260843.4
|
GPR87
|
G protein-coupled receptor 87 |
| chrX_-_15511438 | 11.17 |
ENST00000380420.5
|
PIR
|
pirin (iron-binding nuclear protein) |
| chr1_-_209824643 | 11.11 |
ENST00000391911.1
ENST00000415782.1 |
LAMB3
|
laminin, beta 3 |
| chr20_-_62129163 | 10.82 |
ENST00000298049.7
|
EEF1A2
|
eukaryotic translation elongation factor 1 alpha 2 |
| chr21_-_27542972 | 10.54 |
ENST00000346798.3
ENST00000439274.2 ENST00000354192.3 ENST00000348990.5 ENST00000357903.3 ENST00000358918.3 ENST00000359726.3 |
APP
|
amyloid beta (A4) precursor protein |
| chr14_+_103801140 | 10.51 |
ENST00000561325.1
ENST00000392715.2 ENST00000559130.1 ENST00000559532.1 ENST00000558506.1 |
EIF5
|
eukaryotic translation initiation factor 5 |
| chr11_-_66103867 | 10.34 |
ENST00000424433.2
|
RIN1
|
Ras and Rab interactor 1 |
| chr17_-_39743139 | 10.04 |
ENST00000167586.6
|
KRT14
|
keratin 14 |
| chr11_-_64013663 | 9.97 |
ENST00000392210.2
|
PPP1R14B
|
protein phosphatase 1, regulatory (inhibitor) subunit 14B |
| chr7_+_73245193 | 9.70 |
ENST00000340958.2
|
CLDN4
|
claudin 4 |
| chr19_+_35645817 | 9.67 |
ENST00000423817.3
|
FXYD5
|
FXYD domain containing ion transport regulator 5 |
| chr6_-_84140757 | 9.57 |
ENST00000541327.1
ENST00000369705.3 ENST00000543031.1 |
ME1
|
malic enzyme 1, NADP(+)-dependent, cytosolic |
| chr11_+_114310237 | 9.50 |
ENST00000539119.1
|
REXO2
|
RNA exonuclease 2 |
| chr16_+_89988259 | 9.48 |
ENST00000554444.1
ENST00000556565.1 |
TUBB3
|
Tubulin beta-3 chain |
| chr7_+_116312411 | 9.16 |
ENST00000456159.1
ENST00000397752.3 ENST00000318493.6 |
MET
|
met proto-oncogene |
| chrX_-_153285395 | 9.09 |
ENST00000369980.3
|
IRAK1
|
interleukin-1 receptor-associated kinase 1 |
| chrX_-_153285251 | 8.90 |
ENST00000444230.1
ENST00000393682.1 ENST00000393687.2 ENST00000429936.2 ENST00000369974.2 |
IRAK1
|
interleukin-1 receptor-associated kinase 1 |
| chr17_+_49230897 | 8.73 |
ENST00000393196.3
ENST00000336097.3 ENST00000480143.1 ENST00000511355.1 ENST00000013034.3 ENST00000393198.3 ENST00000608447.1 ENST00000393193.2 ENST00000376392.6 ENST00000555572.1 |
NME1
NME1-NME2
NME2
|
NME/NM23 nucleoside diphosphate kinase 1 NME1-NME2 readthrough NME/NM23 nucleoside diphosphate kinase 2 |
| chr20_+_33759854 | 8.71 |
ENST00000216968.4
|
PROCR
|
protein C receptor, endothelial |
| chr4_+_74606223 | 8.66 |
ENST00000307407.3
ENST00000401931.1 |
IL8
|
interleukin 8 |
| chr17_-_65362678 | 8.60 |
ENST00000357146.4
ENST00000356126.3 |
PSMD12
|
proteasome (prosome, macropain) 26S subunit, non-ATPase, 12 |
| chr9_+_140172200 | 8.48 |
ENST00000357503.2
|
TOR4A
|
torsin family 4, member A |
| chrX_-_10851762 | 8.44 |
ENST00000380785.1
ENST00000380787.1 |
MID1
|
midline 1 (Opitz/BBB syndrome) |
| chr11_-_6341724 | 8.42 |
ENST00000530979.1
|
PRKCDBP
|
protein kinase C, delta binding protein |
| chr8_+_26150628 | 8.38 |
ENST00000523925.1
ENST00000315985.7 |
PPP2R2A
|
protein phosphatase 2, regulatory subunit B, alpha |
| chr8_-_141774467 | 8.29 |
ENST00000520151.1
ENST00000519024.1 ENST00000519465.1 |
PTK2
|
protein tyrosine kinase 2 |
| chr1_+_153003671 | 8.25 |
ENST00000307098.4
|
SPRR1B
|
small proline-rich protein 1B |
| chr19_+_35645618 | 8.25 |
ENST00000392218.2
ENST00000543307.1 ENST00000392219.2 ENST00000541435.2 ENST00000590686.1 ENST00000342879.3 ENST00000588699.1 |
FXYD5
|
FXYD domain containing ion transport regulator 5 |
| chr7_-_96339132 | 8.21 |
ENST00000413065.1
|
SHFM1
|
split hand/foot malformation (ectrodactyly) type 1 |
| chr9_-_127177703 | 8.18 |
ENST00000259457.3
ENST00000536392.1 ENST00000441097.1 |
PSMB7
|
proteasome (prosome, macropain) subunit, beta type, 7 |
| chr17_-_79481666 | 8.08 |
ENST00000575659.1
|
ACTG1
|
actin, gamma 1 |
| chr13_+_78109804 | 7.67 |
ENST00000535157.1
|
SCEL
|
sciellin |
| chr13_+_78109884 | 7.48 |
ENST00000377246.3
ENST00000349847.3 |
SCEL
|
sciellin |
| chr3_-_81792780 | 7.46 |
ENST00000489715.1
|
GBE1
|
glucan (1,4-alpha-), branching enzyme 1 |
| chr3_+_69928256 | 6.99 |
ENST00000394355.2
|
MITF
|
microphthalmia-associated transcription factor |
| chr5_+_72143988 | 6.92 |
ENST00000506351.2
|
TNPO1
|
transportin 1 |
| chr1_+_26605618 | 6.91 |
ENST00000270792.5
|
SH3BGRL3
|
SH3 domain binding glutamic acid-rich protein like 3 |
| chr11_+_706113 | 6.78 |
ENST00000318562.8
ENST00000533256.1 ENST00000534755.1 |
EPS8L2
|
EPS8-like 2 |
| chr11_+_46402297 | 6.75 |
ENST00000405308.2
|
MDK
|
midkine (neurite growth-promoting factor 2) |
| chr1_-_153066998 | 6.73 |
ENST00000368750.3
|
SPRR2E
|
small proline-rich protein 2E |
| chr7_+_23286182 | 6.72 |
ENST00000258733.4
ENST00000381990.2 ENST00000409458.3 ENST00000539136.1 ENST00000453162.2 |
GPNMB
|
glycoprotein (transmembrane) nmb |
| chr14_-_71107921 | 6.62 |
ENST00000553982.1
ENST00000500016.1 |
CTD-2540L5.5
CTD-2540L5.6
|
CTD-2540L5.5 CTD-2540L5.6 |
| chr18_+_61554932 | 6.57 |
ENST00000299502.4
ENST00000457692.1 ENST00000413956.1 |
SERPINB2
|
serpin peptidase inhibitor, clade B (ovalbumin), member 2 |
| chr17_-_39780819 | 6.57 |
ENST00000311208.8
|
KRT17
|
keratin 17 |
| chr17_-_39769005 | 6.55 |
ENST00000301653.4
ENST00000593067.1 |
KRT16
|
keratin 16 |
| chr1_+_26606608 | 6.53 |
ENST00000319041.6
|
SH3BGRL3
|
SH3 domain binding glutamic acid-rich protein like 3 |
| chr12_+_110718921 | 6.49 |
ENST00000308664.6
|
ATP2A2
|
ATPase, Ca++ transporting, cardiac muscle, slow twitch 2 |
| chrX_-_153718953 | 6.47 |
ENST00000369649.4
ENST00000393586.1 |
SLC10A3
|
solute carrier family 10, member 3 |
| chr16_+_30077055 | 6.38 |
ENST00000564595.2
ENST00000569798.1 |
ALDOA
|
aldolase A, fructose-bisphosphate |
| chr15_+_64428529 | 6.34 |
ENST00000560861.1
|
SNX1
|
sorting nexin 1 |
| chr22_-_30642782 | 6.33 |
ENST00000249075.3
|
LIF
|
leukemia inhibitory factor |
| chr21_-_27543425 | 6.21 |
ENST00000448388.2
|
APP
|
amyloid beta (A4) precursor protein |
| chr6_+_125540951 | 6.21 |
ENST00000524679.1
|
TPD52L1
|
tumor protein D52-like 1 |
| chr20_+_4666882 | 6.20 |
ENST00000379440.4
ENST00000430350.2 |
PRNP
|
prion protein |
| chr17_-_73781567 | 5.85 |
ENST00000586607.1
|
H3F3B
|
H3 histone, family 3B (H3.3B) |
| chr19_+_36630961 | 5.79 |
ENST00000587718.1
ENST00000592483.1 ENST00000590874.1 ENST00000588815.1 |
CAPNS1
|
calpain, small subunit 1 |
| chr16_+_30751953 | 5.70 |
ENST00000483578.1
|
RP11-2C24.4
|
RP11-2C24.4 |
| chr19_+_36630454 | 5.68 |
ENST00000246533.3
|
CAPNS1
|
calpain, small subunit 1 |
| chr1_+_152956549 | 5.68 |
ENST00000307122.2
|
SPRR1A
|
small proline-rich protein 1A |
| chr1_-_109968973 | 5.66 |
ENST00000271308.4
ENST00000538610.1 |
PSMA5
|
proteasome (prosome, macropain) subunit, alpha type, 5 |
| chr9_+_140135665 | 5.58 |
ENST00000340384.4
|
TUBB4B
|
tubulin, beta 4B class IVb |
| chr3_+_30648066 | 5.47 |
ENST00000359013.4
|
TGFBR2
|
transforming growth factor, beta receptor II (70/80kDa) |
| chr12_+_6644443 | 5.45 |
ENST00000396858.1
|
GAPDH
|
glyceraldehyde-3-phosphate dehydrogenase |
| chr3_+_30647994 | 5.45 |
ENST00000295754.5
|
TGFBR2
|
transforming growth factor, beta receptor II (70/80kDa) |
| chr18_+_61143994 | 5.42 |
ENST00000382771.4
|
SERPINB5
|
serpin peptidase inhibitor, clade B (ovalbumin), member 5 |
| chr11_-_14541872 | 5.34 |
ENST00000419365.2
ENST00000530457.1 ENST00000532256.1 ENST00000533068.1 |
PSMA1
|
proteasome (prosome, macropain) subunit, alpha type, 1 |
| chr3_+_69134080 | 5.30 |
ENST00000273258.3
|
ARL6IP5
|
ADP-ribosylation-like factor 6 interacting protein 5 |
| chr5_+_140729649 | 5.26 |
ENST00000523390.1
|
PCDHGB1
|
protocadherin gamma subfamily B, 1 |
| chr3_+_187930719 | 5.26 |
ENST00000312675.4
|
LPP
|
LIM domain containing preferred translocation partner in lipoma |
| chr11_-_111783919 | 5.22 |
ENST00000531198.1
ENST00000533879.1 |
CRYAB
|
crystallin, alpha B |
| chr17_+_74381343 | 5.09 |
ENST00000392496.3
|
SPHK1
|
sphingosine kinase 1 |
| chr2_+_231921574 | 4.94 |
ENST00000308696.6
ENST00000373635.4 ENST00000440838.1 ENST00000409643.1 |
PSMD1
|
proteasome (prosome, macropain) 26S subunit, non-ATPase, 1 |
| chr15_-_56209306 | 4.92 |
ENST00000506154.1
ENST00000338963.2 ENST00000508342.1 |
NEDD4
|
neural precursor cell expressed, developmentally down-regulated 4, E3 ubiquitin protein ligase |
| chr18_+_55888767 | 4.92 |
ENST00000431212.2
ENST00000586268.1 ENST00000587190.1 |
NEDD4L
|
neural precursor cell expressed, developmentally down-regulated 4-like, E3 ubiquitin protein ligase |
| chr19_+_36630855 | 4.90 |
ENST00000589146.1
|
CAPNS1
|
calpain, small subunit 1 |
| chr11_-_66104237 | 4.82 |
ENST00000530056.1
|
RIN1
|
Ras and Rab interactor 1 |
| chr1_+_36621697 | 4.81 |
ENST00000373150.4
ENST00000373151.2 |
MAP7D1
|
MAP7 domain containing 1 |
| chr12_+_56473628 | 4.78 |
ENST00000549282.1
ENST00000549061.1 ENST00000267101.3 |
ERBB3
|
v-erb-b2 avian erythroblastic leukemia viral oncogene homolog 3 |
| chr7_-_96339167 | 4.76 |
ENST00000444799.1
ENST00000417009.1 ENST00000248566.2 |
SHFM1
|
split hand/foot malformation (ectrodactyly) type 1 |
| chr17_+_57697216 | 4.70 |
ENST00000393043.1
ENST00000269122.3 |
CLTC
|
clathrin, heavy chain (Hc) |
| chr7_+_22766766 | 4.67 |
ENST00000426291.1
ENST00000401651.1 ENST00000258743.5 ENST00000420258.2 ENST00000407492.1 ENST00000401630.3 ENST00000406575.1 |
IL6
|
interleukin 6 (interferon, beta 2) |
| chr11_-_111784005 | 4.66 |
ENST00000527899.1
|
CRYAB
|
crystallin, alpha B |
| chr3_+_69134124 | 4.62 |
ENST00000478935.1
|
ARL6IP5
|
ADP-ribosylation-like factor 6 interacting protein 5 |
| chr14_-_75643296 | 4.58 |
ENST00000303575.4
|
TMED10
|
transmembrane emp24-like trafficking protein 10 (yeast) |
| chr1_+_36621529 | 4.58 |
ENST00000316156.4
|
MAP7D1
|
MAP7 domain containing 1 |
| chr1_+_183155373 | 4.57 |
ENST00000493293.1
ENST00000264144.4 |
LAMC2
|
laminin, gamma 2 |
| chr19_+_39279838 | 4.54 |
ENST00000314980.4
|
LGALS7B
|
lectin, galactoside-binding, soluble, 7B |
| chr17_-_39942940 | 4.54 |
ENST00000310706.5
ENST00000393931.3 ENST00000424457.1 ENST00000591690.1 |
JUP
|
junction plakoglobin |
| chr11_-_62323702 | 4.53 |
ENST00000530285.1
|
AHNAK
|
AHNAK nucleoprotein |
| chr21_-_36421401 | 4.48 |
ENST00000486278.2
|
RUNX1
|
runt-related transcription factor 1 |
| chr2_-_85641162 | 4.46 |
ENST00000447219.2
ENST00000409670.1 ENST00000409724.1 |
CAPG
|
capping protein (actin filament), gelsolin-like |
| chr1_-_150208363 | 4.44 |
ENST00000436748.2
|
ANP32E
|
acidic (leucine-rich) nuclear phosphoprotein 32 family, member E |
| chr12_+_56546363 | 4.37 |
ENST00000551834.1
ENST00000552568.1 |
MYL6B
|
myosin, light chain 6B, alkali, smooth muscle and non-muscle |
| chr16_+_74330673 | 4.33 |
ENST00000219313.4
ENST00000540379.1 ENST00000567958.1 ENST00000568615.2 |
PSMD7
|
proteasome (prosome, macropain) 26S subunit, non-ATPase, 7 |
| chr17_-_73150629 | 4.26 |
ENST00000356033.4
ENST00000405458.3 ENST00000409753.3 |
HN1
|
hematological and neurological expressed 1 |
| chr3_-_48632593 | 4.21 |
ENST00000454817.1
ENST00000328333.8 |
COL7A1
|
collagen, type VII, alpha 1 |
| chr16_+_30077098 | 4.17 |
ENST00000395240.3
ENST00000566846.1 |
ALDOA
|
aldolase A, fructose-bisphosphate |
| chr16_-_66968055 | 4.13 |
ENST00000568572.1
|
FAM96B
|
family with sequence similarity 96, member B |
| chr1_-_150208291 | 4.13 |
ENST00000533654.1
|
ANP32E
|
acidic (leucine-rich) nuclear phosphoprotein 32 family, member E |
| chr16_-_66968265 | 4.06 |
ENST00000567511.1
ENST00000422424.2 |
FAM96B
|
family with sequence similarity 96, member B |
| chr5_+_140868717 | 4.05 |
ENST00000252087.1
|
PCDHGC5
|
protocadherin gamma subfamily C, 5 |
| chr15_+_41136586 | 4.03 |
ENST00000431806.1
|
SPINT1
|
serine peptidase inhibitor, Kunitz type 1 |
| chr5_+_179247759 | 4.00 |
ENST00000389805.4
ENST00000504627.1 ENST00000402874.3 ENST00000510187.1 |
SQSTM1
|
sequestosome 1 |
| chr10_+_88428206 | 3.97 |
ENST00000429277.2
ENST00000458213.2 ENST00000352360.5 |
LDB3
|
LIM domain binding 3 |
| chr1_-_153013588 | 3.95 |
ENST00000360379.3
|
SPRR2D
|
small proline-rich protein 2D |
| chr3_-_98241760 | 3.92 |
ENST00000507874.1
ENST00000502299.1 ENST00000508659.1 ENST00000510545.1 ENST00000511667.1 ENST00000394185.2 ENST00000394181.2 ENST00000508902.1 ENST00000341181.6 ENST00000437922.1 ENST00000394180.2 |
CLDND1
|
claudin domain containing 1 |
| chr1_+_155107820 | 3.82 |
ENST00000484157.1
|
SLC50A1
|
solute carrier family 50 (sugar efflux transporter), member 1 |
| chr2_-_200322723 | 3.78 |
ENST00000417098.1
|
SATB2
|
SATB homeobox 2 |
| chr11_-_111794446 | 3.77 |
ENST00000527950.1
|
CRYAB
|
crystallin, alpha B |
| chr10_+_123872483 | 3.75 |
ENST00000369001.1
|
TACC2
|
transforming, acidic coiled-coil containing protein 2 |
| chr12_-_91573249 | 3.73 |
ENST00000550099.1
ENST00000546391.1 ENST00000551354.1 |
DCN
|
decorin |
| chr8_-_143823816 | 3.68 |
ENST00000246515.1
|
SLURP1
|
secreted LY6/PLAUR domain containing 1 |
| chr12_-_54813229 | 3.60 |
ENST00000293379.4
|
ITGA5
|
integrin, alpha 5 (fibronectin receptor, alpha polypeptide) |
| chr13_-_110438914 | 3.55 |
ENST00000375856.3
|
IRS2
|
insulin receptor substrate 2 |
| chr11_-_66103932 | 3.54 |
ENST00000311320.4
|
RIN1
|
Ras and Rab interactor 1 |
| chr1_-_27816641 | 3.43 |
ENST00000430629.2
|
WASF2
|
WAS protein family, member 2 |
| chr3_-_98241358 | 3.41 |
ENST00000503004.1
ENST00000506575.1 ENST00000513452.1 ENST00000515620.1 |
CLDND1
|
claudin domain containing 1 |
| chr3_-_32022733 | 3.40 |
ENST00000438237.2
ENST00000396556.2 |
OSBPL10
|
oxysterol binding protein-like 10 |
| chr8_+_126442563 | 3.35 |
ENST00000311922.3
|
TRIB1
|
tribbles pseudokinase 1 |
| chr8_-_67974552 | 3.32 |
ENST00000357849.4
|
COPS5
|
COP9 signalosome subunit 5 |
| chr2_+_152214098 | 3.30 |
ENST00000243347.3
|
TNFAIP6
|
tumor necrosis factor, alpha-induced protein 6 |
| chr6_+_44214824 | 3.28 |
ENST00000371646.5
ENST00000353801.3 |
HSP90AB1
|
heat shock protein 90kDa alpha (cytosolic), class B member 1 |
| chr12_+_56546223 | 3.27 |
ENST00000550443.1
ENST00000207437.5 |
MYL6B
|
myosin, light chain 6B, alkali, smooth muscle and non-muscle |
| chr1_-_153029980 | 3.25 |
ENST00000392653.2
|
SPRR2A
|
small proline-rich protein 2A |
| chr10_-_93392811 | 3.20 |
ENST00000238994.5
|
PPP1R3C
|
protein phosphatase 1, regulatory subunit 3C |
| chr21_-_36421535 | 3.20 |
ENST00000416754.1
ENST00000437180.1 ENST00000455571.1 |
RUNX1
|
runt-related transcription factor 1 |
| chr2_+_172544011 | 3.15 |
ENST00000508530.1
|
DYNC1I2
|
dynein, cytoplasmic 1, intermediate chain 2 |
| chr6_+_64281906 | 3.10 |
ENST00000370651.3
|
PTP4A1
|
protein tyrosine phosphatase type IVA, member 1 |
| chr16_+_57662419 | 3.09 |
ENST00000388812.4
ENST00000538815.1 ENST00000456916.1 ENST00000567154.1 ENST00000388813.5 ENST00000562558.1 ENST00000566271.2 |
GPR56
|
G protein-coupled receptor 56 |
| chr15_+_44829255 | 3.07 |
ENST00000261868.5
ENST00000424492.3 |
EIF3J
|
eukaryotic translation initiation factor 3, subunit J |
| chr3_+_69812877 | 3.06 |
ENST00000457080.1
ENST00000328528.6 |
MITF
|
microphthalmia-associated transcription factor |
| chr21_-_36421626 | 3.05 |
ENST00000300305.3
|
RUNX1
|
runt-related transcription factor 1 |
| chr17_+_79650962 | 2.97 |
ENST00000329138.4
|
HGS
|
hepatocyte growth factor-regulated tyrosine kinase substrate |
| chr2_+_28615669 | 2.94 |
ENST00000379619.1
ENST00000264716.4 |
FOSL2
|
FOS-like antigen 2 |
| chr1_-_160990886 | 2.91 |
ENST00000537746.1
|
F11R
|
F11 receptor |
| chr16_+_57662138 | 2.89 |
ENST00000562414.1
ENST00000561969.1 ENST00000562631.1 ENST00000563445.1 ENST00000565338.1 ENST00000567702.1 |
GPR56
|
G protein-coupled receptor 56 |
| chr15_+_89631381 | 2.88 |
ENST00000352732.5
|
ABHD2
|
abhydrolase domain containing 2 |
| chr2_+_47596287 | 2.87 |
ENST00000263735.4
|
EPCAM
|
epithelial cell adhesion molecule |
| chr10_-_98346801 | 2.86 |
ENST00000371142.4
|
TM9SF3
|
transmembrane 9 superfamily member 3 |
| chr18_-_25616519 | 2.84 |
ENST00000399380.3
|
CDH2
|
cadherin 2, type 1, N-cadherin (neuronal) |
| chr3_-_37216055 | 2.83 |
ENST00000336686.4
|
LRRFIP2
|
leucine rich repeat (in FLII) interacting protein 2 |
| chr7_+_99006232 | 2.82 |
ENST00000403633.2
|
BUD31
|
BUD31 homolog (S. cerevisiae) |
| chr11_+_35639735 | 2.73 |
ENST00000317811.4
|
FJX1
|
four jointed box 1 (Drosophila) |
| chr5_+_150020214 | 2.69 |
ENST00000307662.4
|
SYNPO
|
synaptopodin |
| chr17_+_7123125 | 2.58 |
ENST00000356839.5
ENST00000583312.1 ENST00000350303.5 |
ACADVL
|
acyl-CoA dehydrogenase, very long chain |
| chr11_+_82783097 | 2.56 |
ENST00000501011.2
ENST00000527627.1 ENST00000526795.1 ENST00000533528.1 ENST00000533708.1 ENST00000534499.1 |
RAB30-AS1
|
RAB30 antisense RNA 1 (head to head) |
| chr15_+_41136216 | 2.55 |
ENST00000562057.1
ENST00000344051.4 |
SPINT1
|
serine peptidase inhibitor, Kunitz type 1 |
| chr7_+_128095945 | 2.55 |
ENST00000257696.4
|
HILPDA
|
hypoxia inducible lipid droplet-associated |
| chr21_+_33031935 | 2.54 |
ENST00000270142.6
ENST00000389995.4 |
SOD1
|
superoxide dismutase 1, soluble |
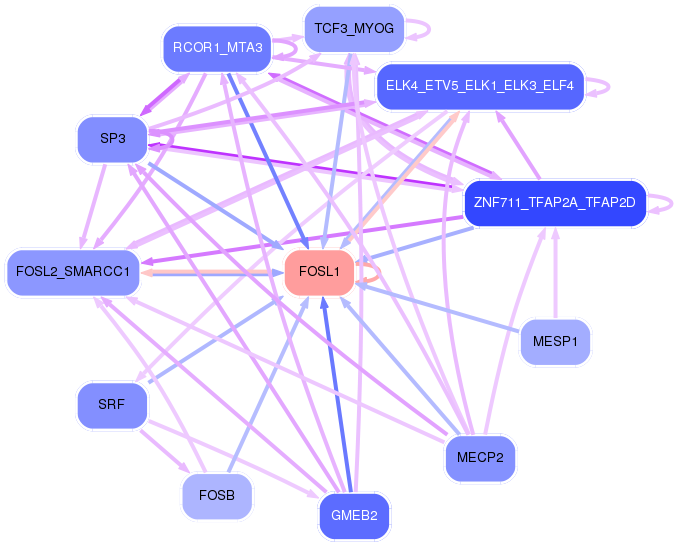
Network of associatons between targets according to the STRING database.

First level regulatory network of FOSL1
Gene Ontology Analysis
Gene overrepresentation in biological_process category:
| Log-likelihood per target | Total log-likelihood | Term | Description |
|---|---|---|---|
| 14.3 | 71.3 | GO:0035105 | sterol regulatory element binding protein import into nucleus(GO:0035105) |
| 7.9 | 47.4 | GO:1902766 | skeletal muscle satellite cell migration(GO:1902766) |
| 7.5 | 22.6 | GO:0043006 | activation of phospholipase A2 activity by calcium-mediated signaling(GO:0043006) |
| 7.1 | 21.2 | GO:0032804 | negative regulation of low-density lipoprotein particle receptor catabolic process(GO:0032804) |
| 6.6 | 19.7 | GO:0002541 | activation of plasma proteins involved in acute inflammatory response(GO:0002541) |
| 6.5 | 26.1 | GO:0006218 | uridine catabolic process(GO:0006218) uridine metabolic process(GO:0046108) |
| 6.4 | 38.5 | GO:0007296 | vitellogenesis(GO:0007296) |
| 6.0 | 17.9 | GO:0046586 | regulation of calcium-dependent cell-cell adhesion(GO:0046586) |
| 5.9 | 17.7 | GO:2001045 | negative regulation of integrin-mediated signaling pathway(GO:2001045) |
| 4.6 | 18.3 | GO:0021812 | neuronal-glial interaction involved in cerebral cortex radial glia guided migration(GO:0021812) |
| 4.0 | 20.0 | GO:0002159 | desmosome assembly(GO:0002159) |
| 3.6 | 10.9 | GO:0002661 | B cell tolerance induction(GO:0002514) regulation of B cell tolerance induction(GO:0002661) positive regulation of B cell tolerance induction(GO:0002663) |
| 3.6 | 14.2 | GO:1903422 | negative regulation of synaptic vesicle recycling(GO:1903422) |
| 3.5 | 28.2 | GO:1900623 | regulation of monocyte aggregation(GO:1900623) positive regulation of monocyte aggregation(GO:1900625) |
| 3.4 | 16.8 | GO:0071874 | cellular response to norepinephrine stimulus(GO:0071874) |
| 3.2 | 12.8 | GO:1903288 | protein transport into plasma membrane raft(GO:0044861) positive regulation of potassium ion import(GO:1903288) |
| 3.2 | 60.2 | GO:0016540 | protein autoprocessing(GO:0016540) |
| 3.1 | 18.7 | GO:0031914 | negative regulation of synaptic plasticity(GO:0031914) |
| 3.1 | 15.5 | GO:0010482 | epidermal cell division(GO:0010481) regulation of epidermal cell division(GO:0010482) |
| 3.1 | 18.5 | GO:0002934 | desmosome organization(GO:0002934) |
| 3.0 | 8.9 | GO:1903233 | regulation of calcium ion-dependent exocytosis of neurotransmitter(GO:1903233) |
| 2.8 | 13.9 | GO:1902459 | positive regulation of stem cell population maintenance(GO:1902459) |
| 2.6 | 7.9 | GO:1902938 | regulation of intracellular calcium activated chloride channel activity(GO:1902938) |
| 2.5 | 4.9 | GO:0044111 | development involved in symbiotic interaction(GO:0044111) |
| 2.0 | 26.6 | GO:0035826 | rubidium ion transport(GO:0035826) regulation of rubidium ion transport(GO:2000680) |
| 2.0 | 59.0 | GO:0031581 | hemidesmosome assembly(GO:0031581) |
| 2.0 | 34.4 | GO:0060712 | spongiotrophoblast layer development(GO:0060712) |
| 2.0 | 35.3 | GO:0001765 | membrane raft assembly(GO:0001765) |
| 1.8 | 9.2 | GO:1905098 | negative regulation of guanyl-nucleotide exchange factor activity(GO:1905098) |
| 1.8 | 5.4 | GO:0035606 | peptidyl-cysteine S-trans-nitrosylation(GO:0035606) |
| 1.7 | 5.1 | GO:0046521 | sphingoid catabolic process(GO:0046521) |
| 1.6 | 9.6 | GO:0006741 | NADP biosynthetic process(GO:0006741) |
| 1.6 | 4.7 | GO:0002384 | hepatic immune response(GO:0002384) response to prolactin(GO:1990637) regulation of STAT protein import into nucleus(GO:2000364) positive regulation of STAT protein import into nucleus(GO:2000366) |
| 1.5 | 16.3 | GO:0060020 | Bergmann glial cell differentiation(GO:0060020) |
| 1.4 | 12.5 | GO:0035414 | negative regulation of catenin import into nucleus(GO:0035414) |
| 1.3 | 3.8 | GO:1901656 | glycoside transport(GO:1901656) |
| 1.2 | 9.9 | GO:0002036 | regulation of L-glutamate transport(GO:0002036) |
| 1.2 | 4.9 | GO:2001288 | positive regulation of caveolin-mediated endocytosis(GO:2001288) |
| 1.1 | 4.6 | GO:0048205 | COPI-coated vesicle budding(GO:0035964) Golgi transport vesicle coating(GO:0048200) COPI coating of Golgi vesicle(GO:0048205) |
| 1.1 | 3.4 | GO:0045659 | regulation of eosinophil differentiation(GO:0045643) positive regulation of eosinophil differentiation(GO:0045645) regulation of neutrophil differentiation(GO:0045658) negative regulation of neutrophil differentiation(GO:0045659) |
| 1.0 | 16.4 | GO:0032802 | low-density lipoprotein particle receptor catabolic process(GO:0032802) |
| 1.0 | 18.4 | GO:0032060 | bleb assembly(GO:0032060) |
| 1.0 | 24.3 | GO:0030502 | negative regulation of bone mineralization(GO:0030502) |
| 1.0 | 3.9 | GO:1903660 | negative regulation of complement-dependent cytotoxicity(GO:1903660) |
| 1.0 | 10.5 | GO:0001731 | formation of translation preinitiation complex(GO:0001731) |
| 1.0 | 2.9 | GO:2000048 | negative regulation of cell-cell adhesion mediated by cadherin(GO:2000048) |
| 0.9 | 2.8 | GO:2000809 | positive regulation of synaptic vesicle clustering(GO:2000809) |
| 0.9 | 8.3 | GO:0038007 | netrin-activated signaling pathway(GO:0038007) |
| 0.9 | 31.3 | GO:0007176 | regulation of epidermal growth factor-activated receptor activity(GO:0007176) |
| 0.9 | 3.7 | GO:0038195 | urokinase plasminogen activator signaling pathway(GO:0038195) |
| 0.9 | 3.6 | GO:0010748 | regulation of plasma membrane long-chain fatty acid transport(GO:0010746) negative regulation of plasma membrane long-chain fatty acid transport(GO:0010748) |
| 0.9 | 8.7 | GO:0018202 | peptidyl-histidine modification(GO:0018202) |
| 0.8 | 11.9 | GO:0051599 | response to hydrostatic pressure(GO:0051599) |
| 0.8 | 18.0 | GO:0034162 | toll-like receptor 9 signaling pathway(GO:0034162) |
| 0.8 | 17.7 | GO:0003334 | keratinocyte development(GO:0003334) |
| 0.8 | 10.7 | GO:0030854 | positive regulation of granulocyte differentiation(GO:0030854) |
| 0.8 | 13.6 | GO:0007021 | tubulin complex assembly(GO:0007021) |
| 0.8 | 6.8 | GO:1900029 | positive regulation of ruffle assembly(GO:1900029) |
| 0.7 | 4.4 | GO:0030421 | defecation(GO:0030421) |
| 0.7 | 8.9 | GO:0061436 | establishment of skin barrier(GO:0061436) |
| 0.6 | 8.4 | GO:0035372 | protein localization to microtubule(GO:0035372) |
| 0.6 | 8.4 | GO:0007084 | mitotic nuclear envelope reassembly(GO:0007084) |
| 0.6 | 13.5 | GO:0097201 | negative regulation of transcription from RNA polymerase II promoter in response to stress(GO:0097201) |
| 0.6 | 7.7 | GO:1900747 | negative regulation of vascular endothelial growth factor signaling pathway(GO:1900747) |
| 0.6 | 2.5 | GO:0090206 | negative regulation of cholesterol biosynthetic process(GO:0045541) negative regulation of cholesterol metabolic process(GO:0090206) |
| 0.6 | 62.1 | GO:0006521 | regulation of cellular amino acid metabolic process(GO:0006521) |
| 0.6 | 2.4 | GO:0090362 | positive regulation of platelet-derived growth factor production(GO:0090362) |
| 0.6 | 1.2 | GO:0007206 | phospholipase C-activating G-protein coupled glutamate receptor signaling pathway(GO:0007206) |
| 0.6 | 27.6 | GO:0018149 | peptide cross-linking(GO:0018149) |
| 0.6 | 2.4 | GO:0018242 | protein O-linked glycosylation via serine(GO:0018242) |
| 0.6 | 10.8 | GO:1904714 | regulation of chaperone-mediated autophagy(GO:1904714) |
| 0.5 | 2.1 | GO:1900245 | positive regulation of MDA-5 signaling pathway(GO:1900245) |
| 0.5 | 9.2 | GO:0030388 | fructose 1,6-bisphosphate metabolic process(GO:0030388) |
| 0.5 | 1.5 | GO:0051097 | negative regulation of helicase activity(GO:0051097) oligodendrocyte apoptotic process(GO:0097252) |
| 0.5 | 6.3 | GO:0034498 | early endosome to Golgi transport(GO:0034498) |
| 0.5 | 1.5 | GO:2000864 | estrogen secretion(GO:0035937) estradiol secretion(GO:0035938) regulation of estrogen secretion(GO:2000861) regulation of estradiol secretion(GO:2000864) |
| 0.5 | 2.8 | GO:2000825 | positive regulation of androgen receptor activity(GO:2000825) |
| 0.5 | 3.8 | GO:0021902 | commitment of neuronal cell to specific neuron type in forebrain(GO:0021902) |
| 0.5 | 6.9 | GO:0006610 | ribosomal protein import into nucleus(GO:0006610) |
| 0.4 | 2.7 | GO:0099563 | modification of synaptic structure(GO:0099563) |
| 0.4 | 1.3 | GO:0051083 | 'de novo' cotranslational protein folding(GO:0051083) |
| 0.4 | 6.6 | GO:0060670 | branching involved in labyrinthine layer morphogenesis(GO:0060670) |
| 0.4 | 6.6 | GO:0051798 | positive regulation of hair follicle development(GO:0051798) |
| 0.4 | 8.2 | GO:0016226 | iron-sulfur cluster assembly(GO:0016226) metallo-sulfur cluster assembly(GO:0031163) |
| 0.4 | 1.1 | GO:1904479 | negative regulation of intestinal absorption(GO:1904479) |
| 0.4 | 2.6 | GO:0046322 | negative regulation of fatty acid oxidation(GO:0046322) |
| 0.4 | 1.1 | GO:0035425 | autocrine signaling(GO:0035425) |
| 0.3 | 5.8 | GO:1903672 | positive regulation of sprouting angiogenesis(GO:1903672) |
| 0.3 | 4.0 | GO:0061635 | regulation of protein complex stability(GO:0061635) |
| 0.3 | 3.0 | GO:0035583 | sequestering of TGFbeta in extracellular matrix(GO:0035583) |
| 0.3 | 1.6 | GO:0022614 | membrane to membrane docking(GO:0022614) negative regulation of interleukin-2 secretion(GO:1900041) terminal web assembly(GO:1902896) |
| 0.3 | 20.5 | GO:0070527 | platelet aggregation(GO:0070527) |
| 0.3 | 0.3 | GO:0070536 | protein K63-linked deubiquitination(GO:0070536) |
| 0.3 | 8.9 | GO:0032461 | positive regulation of protein oligomerization(GO:0032461) |
| 0.3 | 2.7 | GO:2000507 | cap-dependent translational initiation(GO:0002191) positive regulation of energy homeostasis(GO:2000507) |
| 0.3 | 4.5 | GO:0071803 | positive regulation of podosome assembly(GO:0071803) |
| 0.3 | 3.1 | GO:2000576 | positive regulation of microtubule motor activity(GO:2000576) regulation of ATP-dependent microtubule motor activity, plus-end-directed(GO:2000580) positive regulation of ATP-dependent microtubule motor activity, plus-end-directed(GO:2000582) |
| 0.3 | 10.1 | GO:2000144 | positive regulation of DNA-templated transcription, initiation(GO:2000144) |
| 0.3 | 2.2 | GO:0051044 | positive regulation of membrane protein ectodomain proteolysis(GO:0051044) |
| 0.3 | 3.3 | GO:1903894 | regulation of IRE1-mediated unfolded protein response(GO:1903894) |
| 0.3 | 6.6 | GO:0042730 | fibrinolysis(GO:0042730) |
| 0.3 | 1.3 | GO:0000720 | pyrimidine dimer repair by nucleotide-excision repair(GO:0000720) |
| 0.3 | 8.7 | GO:0050819 | negative regulation of coagulation(GO:0050819) |
| 0.3 | 12.8 | GO:0043486 | histone exchange(GO:0043486) |
| 0.3 | 1.0 | GO:0033590 | response to cobalamin(GO:0033590) |
| 0.3 | 1.0 | GO:2000286 | receptor internalization involved in canonical Wnt signaling pathway(GO:2000286) |
| 0.2 | 11.2 | GO:0007194 | negative regulation of adenylate cyclase activity(GO:0007194) |
| 0.2 | 11.2 | GO:0030224 | monocyte differentiation(GO:0030224) |
| 0.2 | 1.9 | GO:0008090 | retrograde axonal transport(GO:0008090) |
| 0.2 | 1.2 | GO:2001180 | negative regulation of interleukin-10 secretion(GO:2001180) negative regulation of interleukin-12 secretion(GO:2001183) |
| 0.2 | 6.7 | GO:0031954 | positive regulation of protein autophosphorylation(GO:0031954) |
| 0.2 | 15.5 | GO:0008156 | negative regulation of DNA replication(GO:0008156) |
| 0.2 | 2.9 | GO:0090557 | establishment of endothelial intestinal barrier(GO:0090557) |
| 0.2 | 1.5 | GO:0035897 | proteolysis in other organism(GO:0035897) |
| 0.2 | 2.0 | GO:0072513 | semicircular canal morphogenesis(GO:0048752) positive regulation of secondary heart field cardioblast proliferation(GO:0072513) |
| 0.2 | 3.0 | GO:1903543 | positive regulation of exosomal secretion(GO:1903543) |
| 0.2 | 15.1 | GO:0051965 | positive regulation of synapse assembly(GO:0051965) |
| 0.2 | 1.4 | GO:0035810 | positive regulation of urine volume(GO:0035810) |
| 0.2 | 1.2 | GO:0042636 | negative regulation of hair cycle(GO:0042636) |
| 0.2 | 23.1 | GO:0002062 | chondrocyte differentiation(GO:0002062) |
| 0.2 | 4.8 | GO:0070886 | positive regulation of calcineurin-NFAT signaling cascade(GO:0070886) |
| 0.2 | 4.1 | GO:0060512 | prostate gland morphogenesis(GO:0060512) |
| 0.2 | 2.3 | GO:0044849 | estrous cycle(GO:0044849) |
| 0.2 | 25.9 | GO:0030216 | keratinocyte differentiation(GO:0030216) |
| 0.2 | 6.4 | GO:0015721 | bile acid and bile salt transport(GO:0015721) |
| 0.2 | 10.7 | GO:0009250 | glycogen biosynthetic process(GO:0005978) glucan biosynthetic process(GO:0009250) |
| 0.2 | 1.1 | GO:0035860 | glial cell-derived neurotrophic factor receptor signaling pathway(GO:0035860) |
| 0.1 | 3.4 | GO:0036150 | phosphatidylserine acyl-chain remodeling(GO:0036150) |
| 0.1 | 7.6 | GO:0043535 | regulation of blood vessel endothelial cell migration(GO:0043535) |
| 0.1 | 0.5 | GO:0090209 | negative regulation of triglyceride metabolic process(GO:0090209) |
| 0.1 | 3.4 | GO:0051497 | negative regulation of stress fiber assembly(GO:0051497) |
| 0.1 | 1.6 | GO:0010603 | regulation of cytoplasmic mRNA processing body assembly(GO:0010603) |
| 0.1 | 2.3 | GO:0015937 | coenzyme A biosynthetic process(GO:0015937) |
| 0.1 | 4.5 | GO:1901385 | regulation of voltage-gated calcium channel activity(GO:1901385) |
| 0.1 | 9.0 | GO:0030049 | muscle filament sliding(GO:0030049) actin-myosin filament sliding(GO:0033275) |
| 0.1 | 0.4 | GO:0060842 | arterial endothelial cell differentiation(GO:0060842) |
| 0.1 | 2.0 | GO:0048745 | smooth muscle tissue development(GO:0048745) |
| 0.1 | 3.9 | GO:0045214 | sarcomere organization(GO:0045214) |
| 0.1 | 2.7 | GO:0010842 | retina layer formation(GO:0010842) |
| 0.1 | 2.4 | GO:0030728 | ovulation(GO:0030728) |
| 0.1 | 0.9 | GO:0010265 | SCF complex assembly(GO:0010265) |
| 0.1 | 1.1 | GO:0034447 | very-low-density lipoprotein particle clearance(GO:0034447) |
| 0.1 | 0.4 | GO:1902037 | negative regulation of hematopoietic stem cell differentiation(GO:1902037) |
| 0.1 | 2.4 | GO:0048240 | sperm capacitation(GO:0048240) |
| 0.1 | 1.1 | GO:0006782 | protoporphyrinogen IX biosynthetic process(GO:0006782) |
| 0.1 | 2.9 | GO:0000188 | inactivation of MAPK activity(GO:0000188) |
| 0.1 | 8.2 | GO:0002576 | platelet degranulation(GO:0002576) |
| 0.1 | 0.1 | GO:1903659 | regulation of complement-dependent cytotoxicity(GO:1903659) |
| 0.1 | 0.2 | GO:1902202 | regulation of hepatocyte growth factor receptor signaling pathway(GO:1902202) |
| 0.1 | 0.5 | GO:0001866 | NK T cell proliferation(GO:0001866) |
| 0.1 | 0.9 | GO:0030277 | maintenance of gastrointestinal epithelium(GO:0030277) |
| 0.1 | 4.2 | GO:0048208 | vesicle coating(GO:0006901) vesicle targeting, rough ER to cis-Golgi(GO:0048207) COPII vesicle coating(GO:0048208) |
| 0.1 | 1.8 | GO:0008608 | attachment of spindle microtubules to kinetochore(GO:0008608) |
| 0.0 | 1.8 | GO:0051436 | negative regulation of ubiquitin-protein ligase activity involved in mitotic cell cycle(GO:0051436) |
| 0.0 | 3.2 | GO:0042267 | natural killer cell mediated cytotoxicity(GO:0042267) |
| 0.0 | 2.1 | GO:0006409 | tRNA export from nucleus(GO:0006409) tRNA-containing ribonucleoprotein complex export from nucleus(GO:0071431) |
| 0.0 | 0.4 | GO:0090136 | epithelial cell-cell adhesion(GO:0090136) |
| 0.0 | 0.4 | GO:0001660 | fever generation(GO:0001660) |
| 0.0 | 0.3 | GO:0015812 | gamma-aminobutyric acid transport(GO:0015812) |
| 0.0 | 2.0 | GO:0006687 | glycosphingolipid metabolic process(GO:0006687) |
| 0.0 | 0.0 | GO:0072278 | positive regulation of metanephric mesenchymal cell migration by platelet-derived growth factor receptor-beta signaling pathway(GO:0035793) VEGF-activated platelet-derived growth factor receptor signaling pathway(GO:0038086) positive regulation of cell proliferation by VEGF-activated platelet derived growth factor receptor signaling pathway(GO:0038091) metanephric comma-shaped body morphogenesis(GO:0072278) regulation of metanephric mesenchymal cell migration by platelet-derived growth factor receptor-beta signaling pathway(GO:1900238) positive regulation of metanephric mesenchymal cell migration(GO:2000591) |
| 0.0 | 2.4 | GO:0043406 | positive regulation of MAP kinase activity(GO:0043406) |
| 0.0 | 0.2 | GO:0045604 | regulation of epidermal cell differentiation(GO:0045604) |
| 0.0 | 0.1 | GO:0046951 | ketone body biosynthetic process(GO:0046951) |
| 0.0 | 1.3 | GO:0021987 | cerebral cortex development(GO:0021987) |
| 0.0 | 0.6 | GO:0006730 | one-carbon metabolic process(GO:0006730) |
| 0.0 | 0.8 | GO:0009117 | nucleotide metabolic process(GO:0009117) |
Gene overrepresentation in cellular_component category:
| Log-likelihood per target | Total log-likelihood | Term | Description |
|---|---|---|---|
| 9.0 | 53.9 | GO:0070435 | Shc-EGFR complex(GO:0070435) |
| 7.9 | 71.3 | GO:0005638 | lamin filament(GO:0005638) |
| 7.6 | 22.9 | GO:0005607 | laminin-2 complex(GO:0005607) |
| 5.3 | 42.3 | GO:0005610 | laminin-5 complex(GO:0005610) |
| 4.2 | 21.2 | GO:0044354 | pinosome(GO:0044352) macropinosome(GO:0044354) |
| 4.0 | 28.2 | GO:0035692 | macrophage migration inhibitory factor receptor complex(GO:0035692) |
| 3.6 | 18.0 | GO:0045323 | interleukin-1 receptor complex(GO:0045323) |
| 3.0 | 26.6 | GO:0097487 | multivesicular body, internal vesicle(GO:0097487) |
| 2.9 | 53.0 | GO:0097038 | perinuclear endoplasmic reticulum(GO:0097038) |
| 2.8 | 13.9 | GO:0071148 | TEAD-1-YAP complex(GO:0071148) |
| 2.1 | 18.5 | GO:0030057 | desmosome(GO:0030057) |
| 2.0 | 24.2 | GO:0016342 | catenin complex(GO:0016342) |
| 1.9 | 16.8 | GO:1990761 | growth cone lamellipodium(GO:1990761) growth cone filopodium(GO:1990812) |
| 1.8 | 14.2 | GO:0044294 | dendritic growth cone(GO:0044294) |
| 1.4 | 8.2 | GO:0071817 | MMXD complex(GO:0071817) |
| 1.3 | 24.3 | GO:0031089 | platelet dense granule lumen(GO:0031089) |
| 1.3 | 47.4 | GO:0032420 | stereocilium(GO:0032420) |
| 1.2 | 10.9 | GO:0070022 | transforming growth factor beta receptor homodimeric complex(GO:0070022) |
| 1.2 | 4.7 | GO:0005896 | interleukin-6 receptor complex(GO:0005896) |
| 1.1 | 58.1 | GO:0001533 | cornified envelope(GO:0001533) |
| 1.1 | 25.1 | GO:0031233 | intrinsic component of external side of plasma membrane(GO:0031233) |
| 1.1 | 10.8 | GO:0005853 | eukaryotic translation elongation factor 1 complex(GO:0005853) |
| 1.1 | 6.3 | GO:0030905 | retromer, tubulation complex(GO:0030905) |
| 1.0 | 3.0 | GO:0033565 | ESCRT-0 complex(GO:0033565) |
| 1.0 | 3.9 | GO:0034751 | aryl hydrocarbon receptor complex(GO:0034751) |
| 0.9 | 11.0 | GO:0019773 | proteasome core complex, alpha-subunit complex(GO:0019773) |
| 0.9 | 16.4 | GO:0036020 | endolysosome membrane(GO:0036020) |
| 0.9 | 3.6 | GO:0071062 | alphav-beta3 integrin-vitronectin complex(GO:0071062) |
| 0.9 | 26.5 | GO:0016327 | apicolateral plasma membrane(GO:0016327) |
| 0.9 | 13.6 | GO:0097512 | cardiac myofibril(GO:0097512) |
| 0.8 | 8.4 | GO:0008541 | proteasome regulatory particle, lid subcomplex(GO:0008541) |
| 0.8 | 5.4 | GO:0097452 | GAIT complex(GO:0097452) |
| 0.7 | 7.6 | GO:0016461 | unconventional myosin complex(GO:0016461) |
| 0.7 | 8.9 | GO:0097470 | ribbon synapse(GO:0097470) |
| 0.6 | 12.8 | GO:0005890 | sodium:potassium-exchanging ATPase complex(GO:0005890) |
| 0.6 | 8.1 | GO:0097433 | dense body(GO:0097433) |
| 0.6 | 12.8 | GO:0000812 | Swr1 complex(GO:0000812) |
| 0.5 | 7.7 | GO:0005589 | collagen type VI trimer(GO:0005589) collagen beaded filament(GO:0098647) |
| 0.5 | 1.6 | GO:0044393 | microspike(GO:0044393) |
| 0.5 | 11.5 | GO:0005838 | proteasome regulatory particle(GO:0005838) |
| 0.5 | 8.2 | GO:0019774 | proteasome core complex, beta-subunit complex(GO:0019774) |
| 0.5 | 1.9 | GO:0031673 | H zone(GO:0031673) |
| 0.4 | 4.6 | GO:0070765 | gamma-secretase complex(GO:0070765) |
| 0.4 | 37.0 | GO:0005882 | intermediate filament(GO:0005882) |
| 0.4 | 2.9 | GO:0036056 | filtration diaphragm(GO:0036056) slit diaphragm(GO:0036057) |
| 0.3 | 1.0 | GO:0071159 | NF-kappaB complex(GO:0071159) |
| 0.3 | 30.4 | GO:0042734 | presynaptic membrane(GO:0042734) |
| 0.3 | 29.6 | GO:0005604 | basement membrane(GO:0005604) |
| 0.3 | 4.5 | GO:0008290 | F-actin capping protein complex(GO:0008290) Flemming body(GO:0090543) |
| 0.3 | 7.2 | GO:0005852 | eukaryotic translation initiation factor 3 complex(GO:0005852) |
| 0.3 | 4.0 | GO:0044754 | autolysosome(GO:0044754) |
| 0.3 | 3.4 | GO:0031209 | SCAR complex(GO:0031209) |
| 0.3 | 2.9 | GO:0097524 | sperm plasma membrane(GO:0097524) |
| 0.3 | 11.0 | GO:0031430 | M band(GO:0031430) |
| 0.3 | 8.4 | GO:0000159 | protein phosphatase type 2A complex(GO:0000159) |
| 0.2 | 1.3 | GO:0070522 | nucleotide-excision repair factor 1 complex(GO:0000110) ERCC4-ERCC1 complex(GO:0070522) |
| 0.2 | 4.7 | GO:0043034 | costamere(GO:0043034) |
| 0.2 | 2.5 | GO:0031045 | dense core granule(GO:0031045) |
| 0.2 | 9.9 | GO:0002102 | podosome(GO:0002102) |
| 0.2 | 7.7 | GO:0016328 | lateral plasma membrane(GO:0016328) |
| 0.2 | 2.0 | GO:0030056 | hemidesmosome(GO:0030056) |
| 0.2 | 3.5 | GO:0031143 | pseudopodium(GO:0031143) |
| 0.2 | 15.5 | GO:0005913 | cell-cell adherens junction(GO:0005913) |
| 0.2 | 1.6 | GO:0030478 | actin cap(GO:0030478) |
| 0.1 | 3.0 | GO:0043205 | microfibril(GO:0001527) fibril(GO:0043205) |
| 0.1 | 2.7 | GO:0016281 | eukaryotic translation initiation factor 4F complex(GO:0016281) |
| 0.1 | 8.4 | GO:0005881 | cytoplasmic microtubule(GO:0005881) |
| 0.1 | 1.0 | GO:0098559 | cytoplasmic side of early endosome membrane(GO:0098559) |
| 0.1 | 0.9 | GO:1990452 | Parkin-FBXW7-Cul1 ubiquitin ligase complex(GO:1990452) |
| 0.1 | 2.4 | GO:0005861 | troponin complex(GO:0005861) |
| 0.1 | 23.5 | GO:0019897 | extrinsic component of plasma membrane(GO:0019897) |
| 0.1 | 1.7 | GO:0005922 | connexon complex(GO:0005922) |
| 0.1 | 9.5 | GO:0005758 | mitochondrial intermembrane space(GO:0005758) |
| 0.1 | 3.1 | GO:0005868 | cytoplasmic dynein complex(GO:0005868) |
| 0.1 | 5.8 | GO:0034707 | chloride channel complex(GO:0034707) |
| 0.1 | 1.8 | GO:0005680 | anaphase-promoting complex(GO:0005680) |
| 0.1 | 2.9 | GO:0042645 | nucleoid(GO:0009295) mitochondrial nucleoid(GO:0042645) |
| 0.1 | 5.6 | GO:0035578 | azurophil granule lumen(GO:0035578) |
| 0.1 | 1.1 | GO:0042627 | chylomicron(GO:0042627) |
| 0.0 | 3.8 | GO:0000118 | histone deacetylase complex(GO:0000118) |
| 0.0 | 1.6 | GO:0005844 | polysome(GO:0005844) |
| 0.0 | 4.8 | GO:0030018 | Z disc(GO:0030018) |
| 0.0 | 4.6 | GO:0048770 | melanosome(GO:0042470) pigment granule(GO:0048770) |
| 0.0 | 1.9 | GO:1904724 | tertiary granule lumen(GO:1904724) |
| 0.0 | 1.5 | GO:0005669 | transcription factor TFIID complex(GO:0005669) |
| 0.0 | 0.6 | GO:0031528 | microvillus membrane(GO:0031528) |
| 0.0 | 1.3 | GO:0005771 | multivesicular body(GO:0005771) |
| 0.0 | 2.4 | GO:0032580 | Golgi cisterna membrane(GO:0032580) |
| 0.0 | 1.0 | GO:0032587 | ruffle membrane(GO:0032587) |
| 0.0 | 2.1 | GO:0005643 | nuclear pore(GO:0005643) |
| 0.0 | 1.8 | GO:0000777 | condensed chromosome kinetochore(GO:0000777) |
| 0.0 | 3.4 | GO:0005788 | endoplasmic reticulum lumen(GO:0005788) |
| 0.0 | 7.8 | GO:0005925 | cell-substrate adherens junction(GO:0005924) focal adhesion(GO:0005925) |
| 0.0 | 1.7 | GO:0005813 | centrosome(GO:0005813) |
| 0.0 | 2.0 | GO:0030027 | lamellipodium(GO:0030027) |
| 0.0 | 0.4 | GO:0016592 | mediator complex(GO:0016592) |
Gene overrepresentation in molecular_function category:
| Log-likelihood per target | Total log-likelihood | Term | Description |
|---|---|---|---|
| 7.7 | 53.9 | GO:0048408 | epidermal growth factor binding(GO:0048408) |
| 6.5 | 26.1 | GO:0004850 | uridine phosphorylase activity(GO:0004850) |
| 5.2 | 15.5 | GO:0008426 | protein kinase C inhibitor activity(GO:0008426) |
| 4.9 | 29.2 | GO:1990254 | keratin filament binding(GO:1990254) |
| 3.7 | 21.9 | GO:0005134 | interleukin-2 receptor binding(GO:0005134) |
| 3.5 | 21.2 | GO:0019834 | phospholipase A2 inhibitor activity(GO:0019834) |
| 2.8 | 25.5 | GO:0004784 | superoxide dismutase activity(GO:0004784) oxidoreductase activity, acting on superoxide radicals as acceptor(GO:0016721) |
| 2.7 | 10.9 | GO:0005026 | transforming growth factor beta receptor activity, type II(GO:0005026) |
| 2.6 | 18.0 | GO:0004704 | NF-kappaB-inducing kinase activity(GO:0004704) |
| 2.1 | 10.5 | GO:0071074 | eukaryotic initiation factor eIF2 binding(GO:0071074) |
| 1.9 | 75.9 | GO:0004198 | calcium-dependent cysteine-type endopeptidase activity(GO:0004198) |
| 1.8 | 14.2 | GO:0000340 | RNA 7-methylguanosine cap binding(GO:0000340) |
| 1.8 | 22.9 | GO:0045294 | alpha-catenin binding(GO:0045294) |
| 1.7 | 16.8 | GO:0051425 | PTB domain binding(GO:0051425) |
| 1.6 | 6.4 | GO:0008508 | bile acid:sodium symporter activity(GO:0008508) |
| 1.6 | 30.6 | GO:0044548 | S100 protein binding(GO:0044548) |
| 1.6 | 9.6 | GO:0004473 | malate dehydrogenase (decarboxylating) (NAD+) activity(GO:0004471) malate dehydrogenase (decarboxylating) (NADP+) activity(GO:0004473) oxaloacetate decarboxylase activity(GO:0008948) |
| 1.4 | 5.4 | GO:0043891 | glyceraldehyde-3-phosphate dehydrogenase (NAD+) (phosphorylating) activity(GO:0004365) aspartic-type endopeptidase inhibitor activity(GO:0019828) glyceraldehyde-3-phosphate dehydrogenase (NAD(P)+) (phosphorylating) activity(GO:0043891) |
| 1.3 | 7.9 | GO:1903135 | cupric ion binding(GO:1903135) |
| 1.3 | 6.6 | GO:0042289 | MHC class II protein binding(GO:0042289) |
| 1.3 | 3.9 | GO:0001884 | pyrimidine nucleoside binding(GO:0001884) UTP binding(GO:0002134) sulfonylurea receptor binding(GO:0017098) pyrimidine ribonucleoside binding(GO:0032551) |
| 1.3 | 6.3 | GO:1990460 | leptin receptor binding(GO:1990460) |
| 1.2 | 8.7 | GO:0004673 | protein histidine kinase activity(GO:0004673) |
| 1.1 | 13.5 | GO:0000774 | adenyl-nucleotide exchange factor activity(GO:0000774) |
| 1.0 | 31.5 | GO:0005540 | hyaluronic acid binding(GO:0005540) |
| 1.0 | 16.9 | GO:0045295 | gamma-catenin binding(GO:0045295) |
| 1.0 | 10.5 | GO:0004332 | fructose-bisphosphate aldolase activity(GO:0004332) |
| 0.9 | 7.5 | GO:0019871 | sodium channel inhibitor activity(GO:0019871) |
| 0.9 | 12.4 | GO:0030280 | structural constituent of epidermis(GO:0030280) |
| 0.9 | 12.1 | GO:0030215 | semaphorin receptor binding(GO:0030215) |
| 0.8 | 5.1 | GO:0008481 | sphinganine kinase activity(GO:0008481) D-erythro-sphingosine kinase activity(GO:0017050) |
| 0.8 | 12.6 | GO:0017017 | MAP kinase tyrosine/serine/threonine phosphatase activity(GO:0017017) |
| 0.8 | 12.8 | GO:0005391 | sodium:potassium-exchanging ATPase activity(GO:0005391) |
| 0.7 | 6.7 | GO:0045545 | syndecan binding(GO:0045545) |
| 0.7 | 16.2 | GO:0051371 | muscle alpha-actinin binding(GO:0051371) |
| 0.7 | 4.7 | GO:0032051 | clathrin light chain binding(GO:0032051) |
| 0.6 | 2.6 | GO:0004466 | long-chain-acyl-CoA dehydrogenase activity(GO:0004466) |
| 0.6 | 19.2 | GO:0004298 | threonine-type endopeptidase activity(GO:0004298) threonine-type peptidase activity(GO:0070003) |
| 0.6 | 34.1 | GO:0019212 | phosphatase inhibitor activity(GO:0019212) |
| 0.6 | 3.7 | GO:0099602 | acetylcholine receptor regulator activity(GO:0030548) neurotransmitter receptor regulator activity(GO:0099602) |
| 0.6 | 3.0 | GO:0050436 | microfibril binding(GO:0050436) |
| 0.6 | 6.3 | GO:0001135 | transcription factor activity, RNA polymerase II transcription factor recruiting(GO:0001135) |
| 0.5 | 11.7 | GO:0098748 | clathrin adaptor activity(GO:0035615) endocytic adaptor activity(GO:0098748) |
| 0.5 | 6.8 | GO:0038132 | neuregulin binding(GO:0038132) |
| 0.5 | 4.7 | GO:0005138 | interleukin-6 receptor binding(GO:0005138) |
| 0.5 | 8.3 | GO:0008432 | JUN kinase binding(GO:0008432) |
| 0.5 | 3.6 | GO:0043184 | vascular endothelial growth factor receptor 2 binding(GO:0043184) |
| 0.5 | 32.1 | GO:0050840 | extracellular matrix binding(GO:0050840) |
| 0.4 | 17.9 | GO:0017080 | sodium channel regulator activity(GO:0017080) |
| 0.4 | 7.6 | GO:0048156 | tau protein binding(GO:0048156) |
| 0.4 | 10.8 | GO:0003746 | translation elongation factor activity(GO:0003746) |
| 0.4 | 9.7 | GO:0070064 | proline-rich region binding(GO:0070064) |
| 0.4 | 1.5 | GO:0034648 | histone demethylase activity (H3-dimethyl-K4 specific)(GO:0034648) |
| 0.4 | 3.6 | GO:0019784 | NEDD8-specific protease activity(GO:0019784) |
| 0.3 | 18.7 | GO:0017112 | Rab guanyl-nucleotide exchange factor activity(GO:0017112) |
| 0.3 | 1.0 | GO:0071532 | ankyrin repeat binding(GO:0071532) |
| 0.2 | 1.5 | GO:0003998 | acylphosphatase activity(GO:0003998) |
| 0.2 | 2.2 | GO:0019855 | calcium channel inhibitor activity(GO:0019855) |
| 0.2 | 6.9 | GO:0008139 | nuclear localization sequence binding(GO:0008139) |
| 0.2 | 18.3 | GO:0005201 | extracellular matrix structural constituent(GO:0005201) |
| 0.2 | 4.4 | GO:0045028 | G-protein coupled nucleotide receptor activity(GO:0001608) G-protein coupled purinergic nucleotide receptor activity(GO:0045028) |
| 0.2 | 2.9 | GO:0047372 | acylglycerol lipase activity(GO:0047372) |
| 0.2 | 30.0 | GO:0044325 | ion channel binding(GO:0044325) |
| 0.2 | 172.5 | GO:0005198 | structural molecule activity(GO:0005198) |
| 0.2 | 1.3 | GO:0061649 | ubiquitinated histone binding(GO:0061649) |
| 0.2 | 0.6 | GO:0051373 | FATZ binding(GO:0051373) |
| 0.2 | 3.4 | GO:0055103 | ligase regulator activity(GO:0055103) ubiquitin-protein transferase regulator activity(GO:0055106) |
| 0.2 | 19.0 | GO:0004867 | serine-type endopeptidase inhibitor activity(GO:0004867) |
| 0.2 | 0.9 | GO:0047374 | methylumbelliferyl-acetate deacetylase activity(GO:0047374) |
| 0.2 | 1.3 | GO:1990599 | 3' overhang single-stranded DNA endodeoxyribonuclease activity(GO:1990599) |
| 0.2 | 0.4 | GO:0005151 | interleukin-1, Type II receptor binding(GO:0005151) |
| 0.2 | 1.5 | GO:0000990 | transcription factor activity, core RNA polymerase binding(GO:0000990) |
| 0.2 | 3.9 | GO:0030676 | Rac guanyl-nucleotide exchange factor activity(GO:0030676) |
| 0.2 | 1.1 | GO:0030229 | very-low-density lipoprotein particle receptor activity(GO:0030229) |
| 0.2 | 3.1 | GO:0045504 | dynein heavy chain binding(GO:0045504) |
| 0.2 | 2.8 | GO:0030275 | LRR domain binding(GO:0030275) |
| 0.2 | 2.4 | GO:0004653 | polypeptide N-acetylgalactosaminyltransferase activity(GO:0004653) |
| 0.2 | 1.1 | GO:0016167 | glial cell-derived neurotrophic factor receptor activity(GO:0016167) |
| 0.2 | 2.1 | GO:0004065 | arylsulfatase activity(GO:0004065) |
| 0.1 | 3.8 | GO:0016702 | oxidoreductase activity, acting on single donors with incorporation of molecular oxygen, incorporation of two atoms of oxygen(GO:0016702) |
| 0.1 | 2.9 | GO:0098641 | cadherin binding involved in cell-cell adhesion(GO:0098641) |
| 0.1 | 5.8 | GO:0004364 | glutathione transferase activity(GO:0004364) |
| 0.1 | 3.6 | GO:0071889 | 14-3-3 protein binding(GO:0071889) |
| 0.1 | 0.9 | GO:0072542 | protein phosphatase activator activity(GO:0072542) |
| 0.1 | 0.2 | GO:0005171 | hepatocyte growth factor receptor binding(GO:0005171) |
| 0.1 | 0.6 | GO:0023024 | MHC class I protein complex binding(GO:0023024) |
| 0.1 | 2.3 | GO:0071837 | HMG box domain binding(GO:0071837) |
| 0.1 | 9.2 | GO:0004714 | transmembrane receptor protein tyrosine kinase activity(GO:0004714) |
| 0.1 | 4.0 | GO:0005080 | protein kinase C binding(GO:0005080) |
| 0.1 | 11.8 | GO:0002020 | protease binding(GO:0002020) |
| 0.1 | 13.2 | GO:0008201 | heparin binding(GO:0008201) |
| 0.1 | 1.9 | GO:0051010 | microtubule plus-end binding(GO:0051010) |
| 0.1 | 38.0 | GO:0005525 | GTP binding(GO:0005525) |
| 0.1 | 3.8 | GO:0051119 | sugar transmembrane transporter activity(GO:0051119) carbohydrate derivative transporter activity(GO:1901505) |
| 0.1 | 4.3 | GO:0003743 | translation initiation factor activity(GO:0003743) |
| 0.1 | 0.5 | GO:0004126 | cytidine deaminase activity(GO:0004126) |
| 0.1 | 1.1 | GO:0017127 | cholesterol transporter activity(GO:0017127) |
| 0.1 | 3.4 | GO:0001786 | phosphatidylserine binding(GO:0001786) |
| 0.1 | 1.6 | GO:0005523 | tropomyosin binding(GO:0005523) |
| 0.1 | 2.1 | GO:0008536 | Ran GTPase binding(GO:0008536) |
| 0.1 | 1.5 | GO:0031593 | polyubiquitin binding(GO:0031593) |
| 0.1 | 0.3 | GO:0015185 | gamma-aminobutyric acid:sodium symporter activity(GO:0005332) gamma-aminobutyric acid transmembrane transporter activity(GO:0015185) |
| 0.1 | 2.4 | GO:0048306 | calcium-dependent protein binding(GO:0048306) |
| 0.1 | 2.8 | GO:0030374 | ligand-dependent nuclear receptor transcription coactivator activity(GO:0030374) |
| 0.1 | 4.2 | GO:0019905 | syntaxin binding(GO:0019905) |
| 0.0 | 2.3 | GO:0016831 | carboxy-lyase activity(GO:0016831) |
| 0.0 | 1.6 | GO:0005154 | epidermal growth factor receptor binding(GO:0005154) |
| 0.0 | 0.2 | GO:0031728 | CCR3 chemokine receptor binding(GO:0031728) |
| 0.0 | 11.9 | GO:0045296 | cadherin binding(GO:0045296) |
| 0.0 | 1.2 | GO:0005035 | tumor necrosis factor-activated receptor activity(GO:0005031) death receptor activity(GO:0005035) |
| 0.0 | 3.8 | GO:0004553 | hydrolase activity, hydrolyzing O-glycosyl compounds(GO:0004553) |
| 0.0 | 0.7 | GO:0000982 | transcription factor activity, RNA polymerase II core promoter proximal region sequence-specific binding(GO:0000982) |
| 0.0 | 0.6 | GO:0004089 | carbonate dehydratase activity(GO:0004089) |
| 0.0 | 1.7 | GO:0070888 | E-box binding(GO:0070888) |
| 0.0 | 1.1 | GO:0016765 | transferase activity, transferring alkyl or aryl (other than methyl) groups(GO:0016765) |
| 0.0 | 1.8 | GO:0005089 | Rho guanyl-nucleotide exchange factor activity(GO:0005089) |
| 0.0 | 1.8 | GO:0051219 | phosphoprotein binding(GO:0051219) |
| 0.0 | 0.2 | GO:0030228 | low-density lipoprotein receptor activity(GO:0005041) lipoprotein particle receptor activity(GO:0030228) |
| 0.0 | 0.1 | GO:0046912 | transferase activity, transferring acyl groups, acyl groups converted into alkyl on transfer(GO:0046912) |
| 0.0 | 2.2 | GO:0051082 | unfolded protein binding(GO:0051082) |
| 0.0 | 1.5 | GO:0004222 | metalloendopeptidase activity(GO:0004222) |
| 0.0 | 3.3 | GO:0001047 | core promoter binding(GO:0001047) |
| 0.0 | 1.2 | GO:0005262 | calcium channel activity(GO:0005262) |
| 0.0 | 0.8 | GO:0019838 | growth factor binding(GO:0019838) |
Gene overrepresentation in C2:CP category:
| Log-likelihood per target | Total log-likelihood | Term | Description |
|---|---|---|---|
| 2.9 | 67.2 | PID INTEGRIN4 PATHWAY | Alpha6 beta4 integrin-ligand interactions |
| 1.4 | 44.0 | PID ECADHERIN KERATINOCYTE PATHWAY | E-cadherin signaling in keratinocytes |
| 1.4 | 39.6 | PID EPHA2 FWD PATHWAY | EPHA2 forward signaling |
| 1.4 | 48.8 | PID PRL SIGNALING EVENTS PATHWAY | Signaling events mediated by PRL |
| 1.1 | 70.8 | PID FRA PATHWAY | Validated transcriptional targets of AP1 family members Fra1 and Fra2 |
| 0.9 | 63.8 | PID FAK PATHWAY | Signaling events mediated by focal adhesion kinase |
| 0.9 | 29.2 | PID AVB3 OPN PATHWAY | Osteopontin-mediated events |
| 0.8 | 35.6 | PID GLYPICAN 1PATHWAY | Glypican 1 network |
| 0.8 | 67.1 | PID DELTA NP63 PATHWAY | Validated transcriptional targets of deltaNp63 isoforms |
| 0.7 | 38.2 | PID INTEGRIN3 PATHWAY | Beta3 integrin cell surface interactions |
| 0.6 | 15.5 | PID TOLL ENDOGENOUS PATHWAY | Endogenous TLR signaling |
| 0.6 | 35.6 | PID AJDISS 2PATHWAY | Posttranslational regulation of adherens junction stability and dissassembly |
| 0.5 | 11.7 | PID ARF 3PATHWAY | Arf1 pathway |
| 0.5 | 26.2 | PID TAP63 PATHWAY | Validated transcriptional targets of TAp63 isoforms |
| 0.4 | 18.7 | PID RAS PATHWAY | Regulation of Ras family activation |
| 0.3 | 18.7 | PID ILK PATHWAY | Integrin-linked kinase signaling |
| 0.3 | 3.6 | PID RET PATHWAY | Signaling events regulated by Ret tyrosine kinase |
| 0.3 | 19.6 | PID AURORA B PATHWAY | Aurora B signaling |
| 0.3 | 20.5 | PID P38 ALPHA BETA DOWNSTREAM PATHWAY | Signaling mediated by p38-alpha and p38-beta |
| 0.2 | 4.8 | PID ERBB NETWORK PATHWAY | ErbB receptor signaling network |
| 0.2 | 13.3 | PID TGFBR PATHWAY | TGF-beta receptor signaling |
| 0.2 | 10.4 | PID VEGFR1 2 PATHWAY | Signaling events mediated by VEGFR1 and VEGFR2 |
| 0.2 | 4.4 | PID SYNDECAN 4 PATHWAY | Syndecan-4-mediated signaling events |
| 0.2 | 14.4 | PID HIF1 TFPATHWAY | HIF-1-alpha transcription factor network |
| 0.2 | 5.3 | PID ECADHERIN STABILIZATION PATHWAY | Stabilization and expansion of the E-cadherin adherens junction |
| 0.2 | 30.3 | NABA ECM GLYCOPROTEINS | Genes encoding structural ECM glycoproteins |
| 0.1 | 3.8 | PID IL1 PATHWAY | IL1-mediated signaling events |
| 0.1 | 3.4 | PID ECADHERIN NASCENT AJ PATHWAY | E-cadherin signaling in the nascent adherens junction |
| 0.1 | 19.2 | NABA ECM AFFILIATED | Genes encoding proteins affiliated structurally or functionally to extracellular matrix proteins |
| 0.1 | 4.2 | NABA COLLAGENS | Genes encoding collagen proteins |
| 0.1 | 1.6 | PID SYNDECAN 2 PATHWAY | Syndecan-2-mediated signaling events |
| 0.1 | 28.4 | NABA SECRETED FACTORS | Genes encoding secreted soluble factors |
| 0.1 | 8.2 | PID MYC ACTIV PATHWAY | Validated targets of C-MYC transcriptional activation |
| 0.1 | 3.1 | PID ARF6 TRAFFICKING PATHWAY | Arf6 trafficking events |
| 0.1 | 4.0 | PID REG GR PATHWAY | Glucocorticoid receptor regulatory network |
| 0.1 | 0.9 | PID BETA CATENIN DEG PATHWAY | Degradation of beta catenin |
| 0.1 | 2.6 | PID HNF3B PATHWAY | FOXA2 and FOXA3 transcription factor networks |
| 0.0 | 1.9 | SIG REGULATION OF THE ACTIN CYTOSKELETON BY RHO GTPASES | Genes related to regulation of the actin cytoskeleton |
| 0.0 | 2.0 | PID FOXO PATHWAY | FoxO family signaling |
| 0.0 | 2.7 | PID CASPASE PATHWAY | Caspase cascade in apoptosis |
| 0.0 | 1.2 | PID CD8 TCR DOWNSTREAM PATHWAY | Downstream signaling in naïve CD8+ T cells |
| 0.0 | 2.2 | PID ERA GENOMIC PATHWAY | Validated nuclear estrogen receptor alpha network |
| 0.0 | 1.4 | PID SMAD2 3NUCLEAR PATHWAY | Regulation of nuclear SMAD2/3 signaling |
Gene overrepresentation in C2:CP:REACTOME category:
| Log-likelihood per target | Total log-likelihood | Term | Description |
|---|---|---|---|
| 2.0 | 53.9 | REACTOME SHC1 EVENTS IN EGFR SIGNALING | Genes involved in SHC1 events in EGFR signaling |
| 1.9 | 26.1 | REACTOME PYRIMIDINE CATABOLISM | Genes involved in Pyrimidine catabolism |
| 1.8 | 3.6 | REACTOME SOS MEDIATED SIGNALLING | Genes involved in SOS-mediated signalling |
| 1.5 | 18.0 | REACTOME IRAK1 RECRUITS IKK COMPLEX | Genes involved in IRAK1 recruits IKK complex |
| 1.5 | 28.2 | REACTOME HYALURONAN UPTAKE AND DEGRADATION | Genes involved in Hyaluronan uptake and degradation |
| 1.1 | 20.6 | REACTOME THE NLRP3 INFLAMMASOME | Genes involved in The NLRP3 inflammasome |
| 1.0 | 51.8 | REACTOME SEMA4D IN SEMAPHORIN SIGNALING | Genes involved in Sema4D in semaphorin signaling |
| 1.0 | 73.9 | REACTOME ACTIVATION OF CHAPERONE GENES BY XBP1S | Genes involved in Activation of Chaperone Genes by XBP1(S) |
| 1.0 | 26.4 | REACTOME SIGNALING BY HIPPO | Genes involved in Signaling by Hippo |
| 0.9 | 16.4 | REACTOME GAP JUNCTION DEGRADATION | Genes involved in Gap junction degradation |
| 0.8 | 62.1 | REACTOME REGULATION OF ORNITHINE DECARBOXYLASE ODC | Genes involved in Regulation of ornithine decarboxylase (ODC) |
| 0.8 | 24.2 | REACTOME ADHERENS JUNCTIONS INTERACTIONS | Genes involved in Adherens junctions interactions |
| 0.7 | 16.0 | REACTOME CASPASE MEDIATED CLEAVAGE OF CYTOSKELETAL PROTEINS | Genes involved in Caspase-mediated cleavage of cytoskeletal proteins |
| 0.7 | 61.1 | REACTOME CELL JUNCTION ORGANIZATION | Genes involved in Cell junction organization |
| 0.6 | 23.5 | REACTOME BASIGIN INTERACTIONS | Genes involved in Basigin interactions |
| 0.6 | 10.9 | REACTOME TGF BETA RECEPTOR SIGNALING IN EMT EPITHELIAL TO MESENCHYMAL TRANSITION | Genes involved in TGF-beta receptor signaling in EMT (epithelial to mesenchymal transition) |
| 0.6 | 15.1 | REACTOME POST CHAPERONIN TUBULIN FOLDING PATHWAY | Genes involved in Post-chaperonin tubulin folding pathway |
| 0.5 | 1.5 | REACTOME AUTODEGRADATION OF THE E3 UBIQUITIN LIGASE COP1 | Genes involved in Autodegradation of the E3 ubiquitin ligase COP1 |
| 0.5 | 19.7 | REACTOME FORMATION OF FIBRIN CLOT CLOTTING CASCADE | Genes involved in Formation of Fibrin Clot (Clotting Cascade) |
| 0.5 | 38.5 | REACTOME AMYLOIDS | Genes involved in Amyloids |
| 0.5 | 8.3 | REACTOME GRB2 SOS PROVIDES LINKAGE TO MAPK SIGNALING FOR INTERGRINS | Genes involved in GRB2:SOS provides linkage to MAPK signaling for Intergrins |
| 0.4 | 6.9 | REACTOME DESTABILIZATION OF MRNA BY TRISTETRAPROLIN TTP | Genes involved in Destabilization of mRNA by Tristetraprolin (TTP) |
| 0.4 | 8.9 | REACTOME PRE NOTCH PROCESSING IN GOLGI | Genes involved in Pre-NOTCH Processing in Golgi |
| 0.4 | 1.1 | REACTOME GASTRIN CREB SIGNALLING PATHWAY VIA PKC AND MAPK | Genes involved in Gastrin-CREB signalling pathway via PKC and MAPK |
| 0.3 | 7.7 | REACTOME CS DS DEGRADATION | Genes involved in CS/DS degradation |
| 0.3 | 8.5 | REACTOME SYNTHESIS AND INTERCONVERSION OF NUCLEOTIDE DI AND TRIPHOSPHATES | Genes involved in Synthesis and interconversion of nucleotide di- and triphosphates |
| 0.2 | 2.1 | REACTOME THE ACTIVATION OF ARYLSULFATASES | Genes involved in The activation of arylsulfatases |
| 0.2 | 23.3 | REACTOME RESPONSE TO ELEVATED PLATELET CYTOSOLIC CA2 | Genes involved in Response to elevated platelet cytosolic Ca2+ |
| 0.2 | 9.2 | REACTOME SMOOTH MUSCLE CONTRACTION | Genes involved in Smooth Muscle Contraction |
| 0.2 | 2.3 | REACTOME VITAMIN B5 PANTOTHENATE METABOLISM | Genes involved in Vitamin B5 (pantothenate) metabolism |
| 0.2 | 3.4 | REACTOME DOWNREGULATION OF ERBB2 ERBB3 SIGNALING | Genes involved in Downregulation of ERBB2:ERBB3 signaling |
| 0.2 | 5.1 | REACTOME ASSOCIATION OF TRIC CCT WITH TARGET PROTEINS DURING BIOSYNTHESIS | Genes involved in Association of TriC/CCT with target proteins during biosynthesis |
| 0.1 | 9.2 | REACTOME G1 PHASE | Genes involved in G1 Phase |
| 0.1 | 3.0 | REACTOME ENDOSOMAL SORTING COMPLEX REQUIRED FOR TRANSPORT ESCRT | Genes involved in Endosomal Sorting Complex Required For Transport (ESCRT) |
| 0.1 | 9.0 | REACTOME NCAM1 INTERACTIONS | Genes involved in NCAM1 interactions |
| 0.1 | 15.5 | REACTOME L1CAM INTERACTIONS | Genes involved in L1CAM interactions |
| 0.1 | 2.7 | REACTOME MTORC1 MEDIATED SIGNALLING | Genes involved in mTORC1-mediated signalling |
| 0.1 | 2.7 | REACTOME ACTIVATION OF GENES BY ATF4 | Genes involved in Activation of Genes by ATF4 |
| 0.1 | 1.7 | REACTOME GAP JUNCTION ASSEMBLY | Genes involved in Gap junction assembly |
| 0.1 | 4.2 | REACTOME COLLAGEN FORMATION | Genes involved in Collagen formation |
| 0.1 | 1.8 | REACTOME AUTODEGRADATION OF CDH1 BY CDH1 APC C | Genes involved in Autodegradation of Cdh1 by Cdh1:APC/C |
| 0.1 | 6.2 | REACTOME GOLGI ASSOCIATED VESICLE BIOGENESIS | Genes involved in Golgi Associated Vesicle Biogenesis |
| 0.1 | 10.1 | REACTOME PPARA ACTIVATES GENE EXPRESSION | Genes involved in PPARA Activates Gene Expression |
| 0.1 | 1.5 | REACTOME ACTIVATED TAK1 MEDIATES P38 MAPK ACTIVATION | Genes involved in activated TAK1 mediates p38 MAPK activation |
| 0.1 | 1.0 | REACTOME REGULATED PROTEOLYSIS OF P75NTR | Genes involved in Regulated proteolysis of p75NTR |
| 0.1 | 4.9 | REACTOME ANTIVIRAL MECHANISM BY IFN STIMULATED GENES | Genes involved in Antiviral mechanism by IFN-stimulated genes |
| 0.1 | 1.3 | REACTOME FORMATION OF INCISION COMPLEX IN GG NER | Genes involved in Formation of incision complex in GG-NER |
| 0.1 | 12.2 | REACTOME TRANSLATION | Genes involved in Translation |
| 0.0 | 1.9 | REACTOME O LINKED GLYCOSYLATION OF MUCINS | Genes involved in O-linked glycosylation of mucins |
| 0.0 | 1.1 | REACTOME METABOLISM OF PORPHYRINS | Genes involved in Metabolism of porphyrins |
| 0.0 | 3.1 | REACTOME LOSS OF NLP FROM MITOTIC CENTROSOMES | Genes involved in Loss of Nlp from mitotic centrosomes |
| 0.0 | 0.6 | REACTOME REVERSIBLE HYDRATION OF CARBON DIOXIDE | Genes involved in Reversible Hydration of Carbon Dioxide |
| 0.0 | 2.8 | REACTOME GLUCOSE METABOLISM | Genes involved in Glucose metabolism |
| 0.0 | 1.4 | REACTOME MUSCLE CONTRACTION | Genes involved in Muscle contraction |
| 0.0 | 0.3 | REACTOME AMINO ACID TRANSPORT ACROSS THE PLASMA MEMBRANE | Genes involved in Amino acid transport across the plasma membrane |
| 0.0 | 0.4 | REACTOME IL1 SIGNALING | Genes involved in Interleukin-1 signaling |