Project
GNF SymAtlas + NCI-60 cancer cell lines, comparison of cancers vs non-cancers, human (Su, 2004; Ross, 2000)
Navigation
Downloads
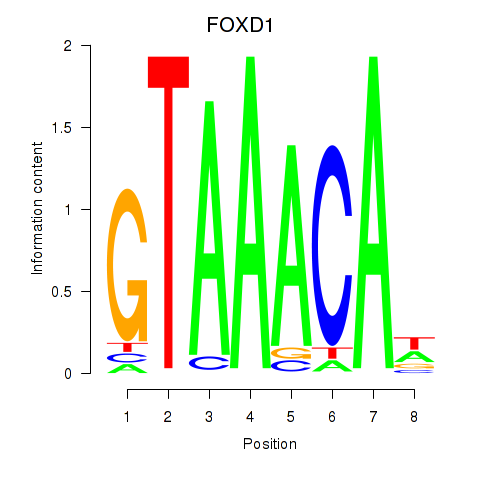
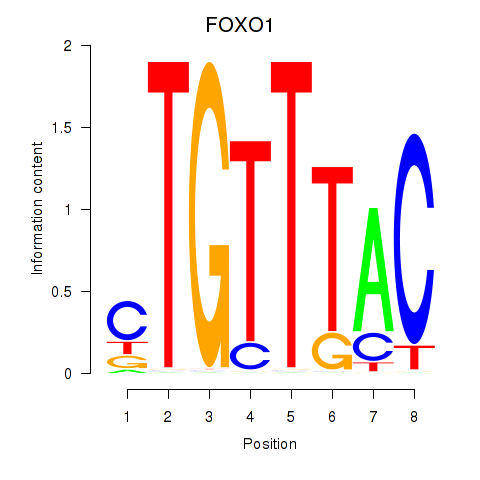
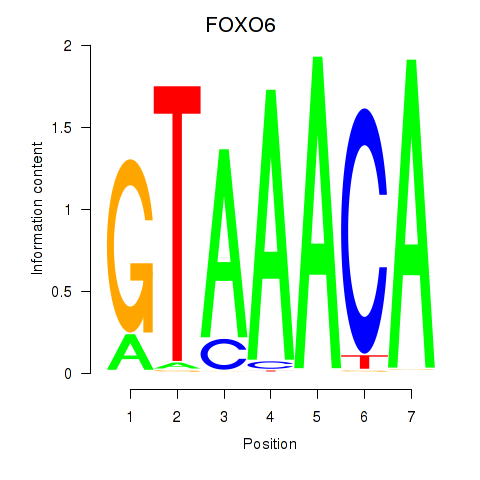
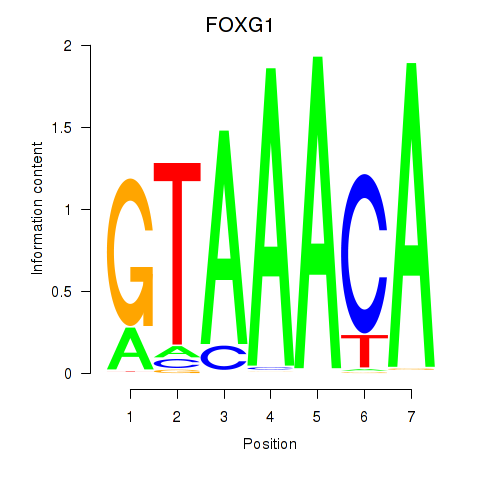
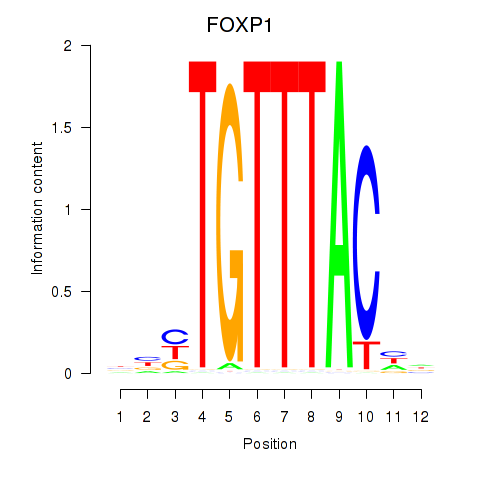
Results for FOXD1_FOXO1_FOXO6_FOXG1_FOXP1
Z-value: 0.94
Motif logo
Transcription factors associated with FOXD1_FOXO1_FOXO6_FOXG1_FOXP1
| Gene Symbol | Gene ID | Gene Info |
|---|---|---|
|
FOXD1
|
ENSG00000251493.2 | forkhead box D1 |
|
FOXO1
|
ENSG00000150907.6 | forkhead box O1 |
|
FOXO6
|
ENSG00000204060.4 | forkhead box O6 |
|
FOXG1
|
ENSG00000176165.7 | forkhead box G1 |
|
FOXP1
|
ENSG00000114861.14 | forkhead box P1 |
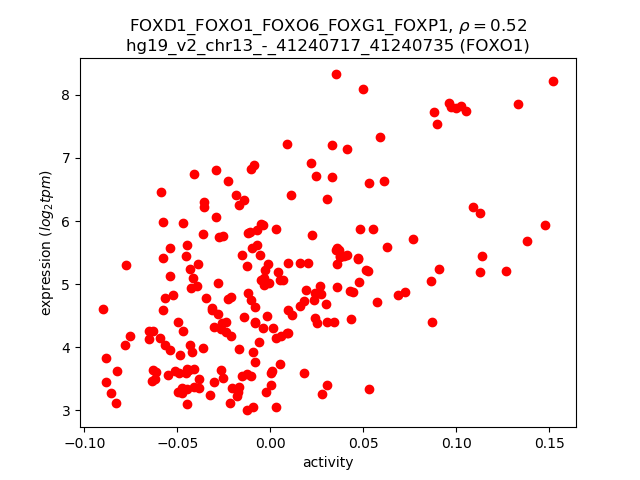
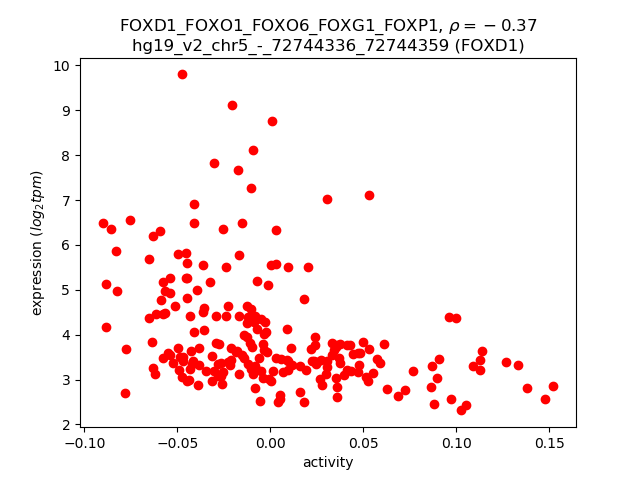
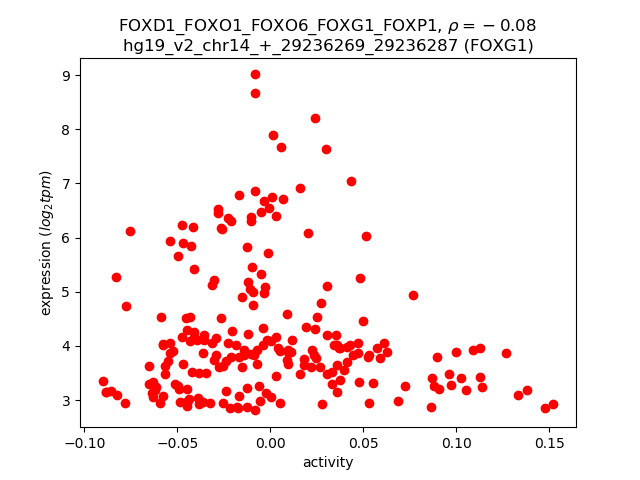
Activity-expression correlation:
| Gene | Promoter | Pearson corr. coef. | P-value | Plot |
|---|---|---|---|---|
| FOXO1 | hg19_v2_chr13_-_41240717_41240735 | 0.52 | 1.6e-16 | Click! |
| FOXD1 | hg19_v2_chr5_-_72744336_72744359 | -0.37 | 2.0e-08 | Click! |
| FOXG1 | hg19_v2_chr14_+_29236269_29236287, hg19_v2_chr14_+_29234870_29235050 | -0.08 | 2.4e-01 | Click! |
Activity profile of FOXD1_FOXO1_FOXO6_FOXG1_FOXP1 motif
Sorted Z-values of FOXD1_FOXO1_FOXO6_FOXG1_FOXP1 motif
Network of associatons between targets according to the STRING database.

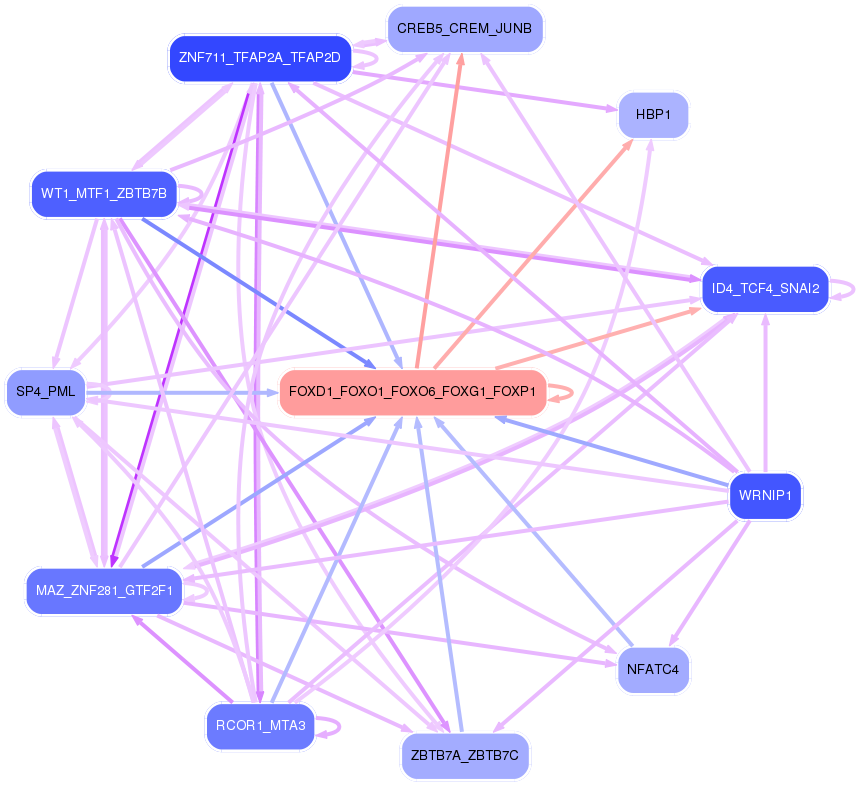
First level regulatory network of FOXD1_FOXO1_FOXO6_FOXG1_FOXP1
Gene Ontology Analysis
Gene overrepresentation in biological_process category:
| Log-likelihood per target | Total log-likelihood | Term | Description |
|---|---|---|---|
| 12.0 | 35.9 | GO:0090219 | negative regulation of lipid kinase activity(GO:0090219) |
| 11.9 | 131.2 | GO:0033227 | dsRNA transport(GO:0033227) |
| 5.6 | 33.8 | GO:0060136 | embryonic process involved in female pregnancy(GO:0060136) |
| 5.6 | 16.7 | GO:0071409 | cellular response to cycloheximide(GO:0071409) |
| 5.4 | 42.9 | GO:0070235 | regulation of activation-induced cell death of T cells(GO:0070235) negative regulation of activation-induced cell death of T cells(GO:0070236) |
| 5.3 | 26.5 | GO:0097338 | response to clozapine(GO:0097338) |
| 5.1 | 30.3 | GO:0070417 | cellular response to cold(GO:0070417) |
| 4.8 | 24.1 | GO:0042091 | interleukin-10 biosynthetic process(GO:0042091) regulation of interleukin-10 biosynthetic process(GO:0045074) |
| 4.5 | 18.1 | GO:0030037 | actin filament reorganization involved in cell cycle(GO:0030037) |
| 4.4 | 26.5 | GO:0051025 | negative regulation of mRNA cleavage(GO:0031438) negative regulation of immunoglobulin secretion(GO:0051025) negative regulation of ribonuclease activity(GO:0060701) negative regulation of endoribonuclease activity(GO:0060702) negative regulation of mRNA endonucleolytic cleavage involved in unfolded protein response(GO:1904721) |
| 4.3 | 56.3 | GO:2000271 | positive regulation of fibroblast apoptotic process(GO:2000271) |
| 4.3 | 34.6 | GO:0031087 | deadenylation-independent decapping of nuclear-transcribed mRNA(GO:0031087) |
| 3.7 | 21.9 | GO:0000821 | regulation of arginine metabolic process(GO:0000821) |
| 3.5 | 28.1 | GO:0045084 | positive regulation of interleukin-12 biosynthetic process(GO:0045084) |
| 3.5 | 13.8 | GO:0006210 | pyrimidine nucleobase catabolic process(GO:0006208) thymine catabolic process(GO:0006210) thymine metabolic process(GO:0019859) |
| 3.4 | 13.6 | GO:0090403 | oxidative stress-induced premature senescence(GO:0090403) |
| 3.4 | 10.1 | GO:1990108 | protein linear deubiquitination(GO:1990108) |
| 3.2 | 51.2 | GO:0051639 | actin filament network formation(GO:0051639) |
| 3.0 | 20.9 | GO:0034316 | negative regulation of Arp2/3 complex-mediated actin nucleation(GO:0034316) |
| 2.9 | 8.7 | GO:0001544 | initiation of primordial ovarian follicle growth(GO:0001544) |
| 2.8 | 8.4 | GO:0052250 | modulation of signal transduction in other organism(GO:0044501) modulation by symbiont of host signal transduction pathway(GO:0052027) modulation of signal transduction in other organism involved in symbiotic interaction(GO:0052250) modulation by symbiont of host I-kappaB kinase/NF-kappaB cascade(GO:0085032) |
| 2.7 | 16.2 | GO:0090131 | mesenchyme migration(GO:0090131) |
| 2.7 | 10.7 | GO:0002904 | positive regulation of B cell apoptotic process(GO:0002904) |
| 2.4 | 48.7 | GO:0002347 | response to tumor cell(GO:0002347) |
| 2.3 | 7.0 | GO:0002514 | B cell tolerance induction(GO:0002514) regulation of B cell tolerance induction(GO:0002661) positive regulation of B cell tolerance induction(GO:0002663) |
| 2.2 | 21.9 | GO:0035845 | photoreceptor cell outer segment organization(GO:0035845) |
| 2.0 | 6.1 | GO:0071557 | histone H3-K27 demethylation(GO:0071557) |
| 2.0 | 30.3 | GO:0034497 | protein localization to pre-autophagosomal structure(GO:0034497) |
| 2.0 | 6.0 | GO:0021538 | epithalamus development(GO:0021538) habenula development(GO:0021986) |
| 1.9 | 1.9 | GO:1903903 | regulation of establishment of T cell polarity(GO:1903903) |
| 1.9 | 5.7 | GO:0045658 | regulation of eosinophil differentiation(GO:0045643) positive regulation of eosinophil differentiation(GO:0045645) regulation of neutrophil differentiation(GO:0045658) negative regulation of neutrophil differentiation(GO:0045659) |
| 1.8 | 9.1 | GO:0051029 | rRNA transport(GO:0051029) |
| 1.8 | 14.5 | GO:1904262 | negative regulation of TORC1 signaling(GO:1904262) |
| 1.7 | 13.4 | GO:0043402 | glucocorticoid mediated signaling pathway(GO:0043402) |
| 1.6 | 12.9 | GO:0031666 | positive regulation of lipopolysaccharide-mediated signaling pathway(GO:0031666) |
| 1.6 | 25.7 | GO:0090360 | platelet-derived growth factor production(GO:0090360) regulation of platelet-derived growth factor production(GO:0090361) |
| 1.6 | 4.8 | GO:0090283 | regulation of protein glycosylation in Golgi(GO:0090283) |
| 1.6 | 6.3 | GO:0048698 | negative regulation of collateral sprouting in absence of injury(GO:0048698) |
| 1.6 | 11.0 | GO:0038110 | interleukin-2-mediated signaling pathway(GO:0038110) |
| 1.5 | 9.2 | GO:0006196 | AMP catabolic process(GO:0006196) |
| 1.5 | 6.1 | GO:1904845 | response to L-glutamine(GO:1904844) cellular response to L-glutamine(GO:1904845) |
| 1.5 | 20.9 | GO:0043374 | CD8-positive, alpha-beta T cell differentiation(GO:0043374) |
| 1.5 | 5.9 | GO:0045872 | positive regulation of rhodopsin gene expression(GO:0045872) |
| 1.5 | 7.3 | GO:0043988 | histone H3-S28 phosphorylation(GO:0043988) histone H2A phosphorylation(GO:1990164) |
| 1.4 | 4.3 | GO:0002276 | basophil activation involved in immune response(GO:0002276) |
| 1.4 | 7.0 | GO:0033031 | positive regulation of neutrophil apoptotic process(GO:0033031) |
| 1.3 | 5.3 | GO:0008063 | Toll signaling pathway(GO:0008063) |
| 1.3 | 6.5 | GO:0071477 | hypotonic salinity response(GO:0042539) cellular hypotonic salinity response(GO:0071477) |
| 1.3 | 3.9 | GO:0048250 | mitochondrial iron ion transport(GO:0048250) |
| 1.2 | 8.5 | GO:0009597 | detection of virus(GO:0009597) |
| 1.2 | 7.0 | GO:0051661 | maintenance of centrosome location(GO:0051661) |
| 1.2 | 3.5 | GO:0030718 | germ-line stem cell population maintenance(GO:0030718) |
| 1.1 | 7.9 | GO:0046604 | positive regulation of mitotic centrosome separation(GO:0046604) |
| 1.1 | 11.2 | GO:0001766 | membrane raft polarization(GO:0001766) membrane raft distribution(GO:0031580) |
| 1.1 | 2.2 | GO:0060355 | positive regulation of cell adhesion molecule production(GO:0060355) |
| 1.1 | 5.4 | GO:0018231 | peptidyl-L-cysteine S-palmitoylation(GO:0018230) peptidyl-S-diacylglycerol-L-cysteine biosynthetic process from peptidyl-cysteine(GO:0018231) |
| 1.0 | 4.2 | GO:0060613 | fat pad development(GO:0060613) |
| 1.0 | 11.9 | GO:0090073 | positive regulation of protein homodimerization activity(GO:0090073) |
| 1.0 | 21.7 | GO:0050930 | induction of positive chemotaxis(GO:0050930) |
| 1.0 | 14.7 | GO:0021702 | cerebellar Purkinje cell layer formation(GO:0021694) cerebellar Purkinje cell differentiation(GO:0021702) |
| 1.0 | 4.8 | GO:0030538 | embryonic genitalia morphogenesis(GO:0030538) |
| 0.9 | 17.5 | GO:0033148 | positive regulation of intracellular estrogen receptor signaling pathway(GO:0033148) |
| 0.9 | 24.7 | GO:1904886 | beta-catenin destruction complex disassembly(GO:1904886) |
| 0.9 | 3.5 | GO:1905073 | ossification involved in bone remodeling(GO:0043932) frontal suture morphogenesis(GO:0060364) occluding junction disassembly(GO:1905071) regulation of occluding junction disassembly(GO:1905073) positive regulation of occluding junction disassembly(GO:1905075) |
| 0.9 | 7.7 | GO:0021527 | spinal cord association neuron differentiation(GO:0021527) |
| 0.9 | 15.3 | GO:2000258 | negative regulation of complement activation(GO:0045916) negative regulation of protein activation cascade(GO:2000258) |
| 0.9 | 7.7 | GO:1904715 | negative regulation of chaperone-mediated autophagy(GO:1904715) |
| 0.8 | 5.9 | GO:2000332 | lipoprotein particle mediated signaling(GO:0055095) low-density lipoprotein particle mediated signaling(GO:0055096) blood microparticle formation(GO:0072564) regulation of blood microparticle formation(GO:2000332) positive regulation of blood microparticle formation(GO:2000334) |
| 0.8 | 15.0 | GO:0007021 | tubulin complex assembly(GO:0007021) |
| 0.8 | 0.8 | GO:0007521 | muscle cell fate determination(GO:0007521) |
| 0.8 | 8.2 | GO:0071763 | nuclear membrane organization(GO:0071763) |
| 0.8 | 8.2 | GO:0090292 | nuclear matrix anchoring at nuclear membrane(GO:0090292) |
| 0.8 | 4.0 | GO:0002032 | desensitization of G-protein coupled receptor protein signaling pathway by arrestin(GO:0002032) |
| 0.8 | 8.6 | GO:0090232 | peripheral nervous system myelin maintenance(GO:0032287) positive regulation of spindle checkpoint(GO:0090232) |
| 0.8 | 2.3 | GO:0000738 | DNA catabolic process, exonucleolytic(GO:0000738) |
| 0.7 | 18.4 | GO:0070734 | histone H3-K27 methylation(GO:0070734) |
| 0.7 | 2.9 | GO:1990535 | neuron projection maintenance(GO:1990535) |
| 0.7 | 8.1 | GO:1900747 | negative regulation of vascular endothelial growth factor signaling pathway(GO:1900747) |
| 0.7 | 1.4 | GO:0003417 | growth plate cartilage development(GO:0003417) cartilage development involved in endochondral bone morphogenesis(GO:0060351) |
| 0.7 | 3.6 | GO:2000301 | negative regulation of synaptic vesicle exocytosis(GO:2000301) |
| 0.7 | 5.0 | GO:0070294 | renal sodium ion absorption(GO:0070294) |
| 0.7 | 2.8 | GO:1990785 | response to water-immersion restraint stress(GO:1990785) |
| 0.7 | 4.2 | GO:0061737 | leukotriene signaling pathway(GO:0061737) |
| 0.7 | 2.8 | GO:0021590 | cerebellum maturation(GO:0021590) cerebellar Purkinje cell layer maturation(GO:0021691) cerebellar cortex maturation(GO:0021699) |
| 0.7 | 4.1 | GO:0044211 | CTP salvage(GO:0044211) |
| 0.7 | 26.5 | GO:0016601 | Rac protein signal transduction(GO:0016601) |
| 0.7 | 7.2 | GO:0048387 | negative regulation of retinoic acid receptor signaling pathway(GO:0048387) |
| 0.6 | 10.3 | GO:0033689 | negative regulation of osteoblast proliferation(GO:0033689) |
| 0.6 | 5.8 | GO:0061302 | smooth muscle cell-matrix adhesion(GO:0061302) |
| 0.6 | 1.9 | GO:1990519 | pyrimidine nucleotide transport(GO:0006864) mitochondrial pyrimidine nucleotide import(GO:1990519) |
| 0.6 | 7.0 | GO:0019800 | peptide cross-linking via chondroitin 4-sulfate glycosaminoglycan(GO:0019800) |
| 0.6 | 6.9 | GO:0048298 | positive regulation of isotype switching to IgA isotypes(GO:0048298) |
| 0.6 | 4.3 | GO:1901529 | positive regulation of anion channel activity(GO:1901529) |
| 0.6 | 1.7 | GO:0099552 | trans-synaptic signaling by lipid, modulating synaptic transmission(GO:0099552) trans-synaptic signaling by endocannabinoid, modulating synaptic transmission(GO:0099553) |
| 0.6 | 5.6 | GO:0014831 | gastro-intestinal system smooth muscle contraction(GO:0014831) |
| 0.5 | 3.3 | GO:0006499 | N-terminal protein myristoylation(GO:0006499) |
| 0.5 | 6.5 | GO:0036500 | ATF6-mediated unfolded protein response(GO:0036500) |
| 0.5 | 2.7 | GO:0033078 | extrathymic T cell differentiation(GO:0033078) |
| 0.5 | 5.3 | GO:0032906 | transforming growth factor beta2 production(GO:0032906) regulation of transforming growth factor beta2 production(GO:0032909) |
| 0.5 | 19.4 | GO:0032728 | positive regulation of interferon-beta production(GO:0032728) |
| 0.5 | 14.8 | GO:0042994 | cytoplasmic sequestering of transcription factor(GO:0042994) |
| 0.5 | 0.5 | GO:1903973 | negative regulation of macrophage colony-stimulating factor signaling pathway(GO:1902227) negative regulation of response to macrophage colony-stimulating factor(GO:1903970) negative regulation of cellular response to macrophage colony-stimulating factor stimulus(GO:1903973) |
| 0.5 | 1.5 | GO:0071442 | positive regulation of histone H3-K14 acetylation(GO:0071442) |
| 0.5 | 1.9 | GO:0097324 | melanocyte migration(GO:0097324) positive regulation of lens fiber cell differentiation(GO:1902748) |
| 0.5 | 4.8 | GO:2001224 | positive regulation of neuron migration(GO:2001224) |
| 0.5 | 5.1 | GO:0071476 | cellular hypotonic response(GO:0071476) |
| 0.5 | 0.9 | GO:0038086 | VEGF-activated platelet-derived growth factor receptor signaling pathway(GO:0038086) positive regulation of cell proliferation by VEGF-activated platelet derived growth factor receptor signaling pathway(GO:0038091) |
| 0.5 | 17.3 | GO:0006376 | mRNA splice site selection(GO:0006376) |
| 0.4 | 1.3 | GO:0060920 | cardiac pacemaker cell differentiation(GO:0060920) cardiac pacemaker cell development(GO:0060926) |
| 0.4 | 3.6 | GO:0033211 | adiponectin-activated signaling pathway(GO:0033211) |
| 0.4 | 2.2 | GO:0021759 | globus pallidus development(GO:0021759) |
| 0.4 | 2.2 | GO:0003219 | cardiac right ventricle formation(GO:0003219) |
| 0.4 | 1.3 | GO:0034723 | DNA replication-dependent nucleosome assembly(GO:0006335) DNA replication-dependent nucleosome organization(GO:0034723) |
| 0.4 | 18.0 | GO:0045737 | positive regulation of cyclin-dependent protein serine/threonine kinase activity(GO:0045737) |
| 0.4 | 4.0 | GO:0051764 | actin crosslink formation(GO:0051764) |
| 0.4 | 2.0 | GO:1904016 | response to Thyroglobulin triiodothyronine(GO:1904016) |
| 0.4 | 32.2 | GO:0031338 | regulation of vesicle fusion(GO:0031338) |
| 0.4 | 9.0 | GO:0045947 | negative regulation of translational initiation(GO:0045947) |
| 0.4 | 1.5 | GO:0046725 | negative regulation by virus of viral protein levels in host cell(GO:0046725) negative regulation of nephron tubule epithelial cell differentiation(GO:0072183) negative regulation of metanephric nephron tubule epithelial cell differentiation(GO:0072308) negative regulation of epithelial cell differentiation involved in kidney development(GO:2000697) |
| 0.4 | 1.9 | GO:2000639 | regulation of SREBP signaling pathway(GO:2000638) negative regulation of SREBP signaling pathway(GO:2000639) |
| 0.4 | 1.1 | GO:1903413 | cellular response to bile acid(GO:1903413) |
| 0.4 | 1.5 | GO:0006556 | S-adenosylmethionine biosynthetic process(GO:0006556) |
| 0.4 | 3.5 | GO:0036066 | protein O-linked fucosylation(GO:0036066) |
| 0.3 | 2.8 | GO:0060665 | regulation of branching involved in salivary gland morphogenesis by mesenchymal-epithelial signaling(GO:0060665) |
| 0.3 | 0.7 | GO:1903598 | positive regulation of gap junction assembly(GO:1903598) |
| 0.3 | 21.8 | GO:1901016 | regulation of potassium ion transmembrane transporter activity(GO:1901016) |
| 0.3 | 1.0 | GO:0021569 | rhombomere 3 development(GO:0021569) |
| 0.3 | 3.0 | GO:0032329 | L-serine transport(GO:0015825) serine transport(GO:0032329) |
| 0.3 | 5.9 | GO:0006479 | protein methylation(GO:0006479) protein alkylation(GO:0008213) |
| 0.3 | 1.3 | GO:0001957 | intramembranous ossification(GO:0001957) direct ossification(GO:0036072) |
| 0.3 | 1.9 | GO:0045162 | clustering of voltage-gated sodium channels(GO:0045162) |
| 0.3 | 2.2 | GO:0072592 | oxygen metabolic process(GO:0072592) |
| 0.3 | 2.8 | GO:0038063 | collagen-activated tyrosine kinase receptor signaling pathway(GO:0038063) |
| 0.3 | 3.5 | GO:0006657 | CDP-choline pathway(GO:0006657) |
| 0.3 | 4.9 | GO:0019371 | cyclooxygenase pathway(GO:0019371) |
| 0.3 | 1.7 | GO:0070966 | nuclear-transcribed mRNA catabolic process, no-go decay(GO:0070966) |
| 0.3 | 1.4 | GO:1904693 | midbrain morphogenesis(GO:1904693) |
| 0.3 | 4.4 | GO:0034656 | nucleobase-containing small molecule catabolic process(GO:0034656) |
| 0.3 | 8.3 | GO:0007202 | activation of phospholipase C activity(GO:0007202) |
| 0.3 | 2.5 | GO:0006552 | leucine catabolic process(GO:0006552) |
| 0.3 | 1.3 | GO:0032455 | nerve growth factor processing(GO:0032455) |
| 0.3 | 3.5 | GO:0070327 | thyroid hormone transport(GO:0070327) |
| 0.3 | 4.1 | GO:0010457 | centriole-centriole cohesion(GO:0010457) |
| 0.3 | 5.4 | GO:0045717 | negative regulation of fatty acid biosynthetic process(GO:0045717) |
| 0.3 | 4.3 | GO:0006044 | N-acetylglucosamine metabolic process(GO:0006044) |
| 0.2 | 1.7 | GO:0044245 | polysaccharide digestion(GO:0044245) |
| 0.2 | 0.7 | GO:1900368 | regulation of RNA interference(GO:1900368) negative regulation of RNA interference(GO:1900369) |
| 0.2 | 0.5 | GO:0002517 | T cell tolerance induction(GO:0002517) |
| 0.2 | 5.6 | GO:0032354 | response to follicle-stimulating hormone(GO:0032354) |
| 0.2 | 0.9 | GO:0010958 | regulation of amino acid import(GO:0010958) |
| 0.2 | 1.3 | GO:0001866 | NK T cell proliferation(GO:0001866) |
| 0.2 | 17.4 | GO:0045576 | mast cell activation(GO:0045576) |
| 0.2 | 1.7 | GO:0010867 | positive regulation of triglyceride biosynthetic process(GO:0010867) |
| 0.2 | 0.6 | GO:0061055 | myotome development(GO:0061055) |
| 0.2 | 0.6 | GO:0008355 | olfactory learning(GO:0008355) |
| 0.2 | 5.3 | GO:0002076 | osteoblast development(GO:0002076) |
| 0.2 | 3.2 | GO:0038083 | peptidyl-tyrosine autophosphorylation(GO:0038083) |
| 0.2 | 2.5 | GO:0008228 | opsonization(GO:0008228) |
| 0.2 | 9.9 | GO:0045600 | positive regulation of fat cell differentiation(GO:0045600) |
| 0.2 | 0.4 | GO:0071883 | negative regulation of epinephrine secretion(GO:0032811) epidermal growth factor-activated receptor transactivation by G-protein coupled receptor signaling pathway(GO:0035625) activation of MAPK activity by adrenergic receptor signaling pathway(GO:0071883) |
| 0.2 | 6.9 | GO:0010107 | potassium ion import(GO:0010107) |
| 0.2 | 5.6 | GO:0007158 | neuron cell-cell adhesion(GO:0007158) |
| 0.2 | 2.3 | GO:1900017 | positive regulation of cytokine production involved in inflammatory response(GO:1900017) |
| 0.2 | 1.5 | GO:0010968 | regulation of microtubule nucleation(GO:0010968) |
| 0.2 | 0.9 | GO:1902525 | regulation of protein monoubiquitination(GO:1902525) |
| 0.2 | 0.9 | GO:1902268 | negative regulation of polyamine transmembrane transport(GO:1902268) |
| 0.2 | 4.7 | GO:0072663 | protein targeting to peroxisome(GO:0006625) protein localization to peroxisome(GO:0072662) establishment of protein localization to peroxisome(GO:0072663) |
| 0.2 | 1.1 | GO:0060612 | adipose tissue development(GO:0060612) |
| 0.2 | 1.4 | GO:0035934 | corticosterone secretion(GO:0035934) regulation of corticosterone secretion(GO:2000852) |
| 0.2 | 2.8 | GO:0003215 | cardiac right ventricle morphogenesis(GO:0003215) |
| 0.2 | 0.7 | GO:1904181 | positive regulation of mitochondrial depolarization(GO:0051901) positive regulation of membrane depolarization(GO:1904181) |
| 0.2 | 1.4 | GO:0002260 | lymphocyte homeostasis(GO:0002260) |
| 0.2 | 7.4 | GO:0032784 | regulation of DNA-templated transcription, elongation(GO:0032784) |
| 0.2 | 1.9 | GO:0048251 | elastic fiber assembly(GO:0048251) |
| 0.2 | 44.1 | GO:0006367 | transcription initiation from RNA polymerase II promoter(GO:0006367) |
| 0.2 | 3.0 | GO:1904355 | positive regulation of telomere capping(GO:1904355) |
| 0.2 | 2.0 | GO:0060211 | regulation of nuclear-transcribed mRNA poly(A) tail shortening(GO:0060211) positive regulation of nuclear-transcribed mRNA poly(A) tail shortening(GO:0060213) |
| 0.2 | 3.1 | GO:0006704 | glucocorticoid biosynthetic process(GO:0006704) |
| 0.2 | 0.2 | GO:0043923 | positive regulation by host of viral transcription(GO:0043923) |
| 0.2 | 0.2 | GO:0060620 | regulation of cholesterol import(GO:0060620) negative regulation of cholesterol import(GO:0060621) regulation of cholesterol transporter activity(GO:0060694) regulation of sterol import(GO:2000909) negative regulation of sterol import(GO:2000910) |
| 0.2 | 9.9 | GO:0015914 | phospholipid transport(GO:0015914) |
| 0.2 | 0.9 | GO:0048386 | positive regulation of retinoic acid receptor signaling pathway(GO:0048386) |
| 0.1 | 0.9 | GO:1903715 | regulation of aerobic respiration(GO:1903715) |
| 0.1 | 22.8 | GO:0008277 | regulation of G-protein coupled receptor protein signaling pathway(GO:0008277) |
| 0.1 | 0.7 | GO:0035063 | nuclear speck organization(GO:0035063) |
| 0.1 | 0.1 | GO:0045349 | interferon-alpha biosynthetic process(GO:0045349) interferon-beta biosynthetic process(GO:0045350) type I interferon biosynthetic process(GO:0045351) regulation of interferon-alpha biosynthetic process(GO:0045354) regulation of interferon-beta biosynthetic process(GO:0045357) |
| 0.1 | 0.3 | GO:0021764 | amygdala development(GO:0021764) |
| 0.1 | 9.2 | GO:0048678 | response to axon injury(GO:0048678) |
| 0.1 | 6.2 | GO:0006336 | DNA replication-independent nucleosome assembly(GO:0006336) DNA replication-independent nucleosome organization(GO:0034724) |
| 0.1 | 2.4 | GO:0001502 | cartilage condensation(GO:0001502) |
| 0.1 | 6.5 | GO:0043124 | negative regulation of I-kappaB kinase/NF-kappaB signaling(GO:0043124) |
| 0.1 | 2.5 | GO:0030155 | regulation of cell adhesion(GO:0030155) |
| 0.1 | 2.2 | GO:0046069 | cGMP catabolic process(GO:0046069) |
| 0.1 | 0.3 | GO:0048867 | stem cell fate determination(GO:0048867) |
| 0.1 | 0.9 | GO:0033353 | S-adenosylmethionine cycle(GO:0033353) |
| 0.1 | 6.0 | GO:0051646 | mitochondrion localization(GO:0051646) |
| 0.1 | 0.4 | GO:0038193 | thromboxane A2 signaling pathway(GO:0038193) |
| 0.1 | 0.5 | GO:0018032 | peptide amidation(GO:0001519) protein amidation(GO:0018032) peptide modification(GO:0031179) |
| 0.1 | 1.6 | GO:2000480 | negative regulation of cAMP-dependent protein kinase activity(GO:2000480) |
| 0.1 | 0.5 | GO:0021997 | response to chlorate(GO:0010157) neural plate axis specification(GO:0021997) |
| 0.1 | 1.1 | GO:0071847 | TNFSF11-mediated signaling pathway(GO:0071847) |
| 0.1 | 2.2 | GO:0006450 | regulation of translational fidelity(GO:0006450) |
| 0.1 | 0.4 | GO:0042048 | olfactory behavior(GO:0042048) |
| 0.1 | 0.6 | GO:0090050 | positive regulation of cell migration involved in sprouting angiogenesis(GO:0090050) |
| 0.1 | 3.5 | GO:0090383 | phagosome acidification(GO:0090383) |
| 0.1 | 1.6 | GO:0060348 | bone development(GO:0060348) |
| 0.1 | 1.7 | GO:0006995 | cellular response to nitrogen starvation(GO:0006995) cellular response to nitrogen levels(GO:0043562) |
| 0.1 | 0.5 | GO:1904073 | trophectodermal cell proliferation(GO:0001834) regulation of trophectodermal cell proliferation(GO:1904073) positive regulation of trophectodermal cell proliferation(GO:1904075) |
| 0.1 | 1.3 | GO:0051573 | negative regulation of histone H3-K9 methylation(GO:0051573) |
| 0.1 | 2.6 | GO:0016577 | histone demethylation(GO:0016577) |
| 0.1 | 0.4 | GO:1904327 | protein localization to cytosolic proteasome complex(GO:1904327) protein localization to cytosolic proteasome complex involved in ERAD pathway(GO:1904379) |
| 0.1 | 0.3 | GO:0045792 | negative regulation of cell size(GO:0045792) |
| 0.1 | 2.1 | GO:0035635 | entry of bacterium into host cell(GO:0035635) |
| 0.1 | 0.4 | GO:0005986 | sucrose biosynthetic process(GO:0005986) |
| 0.1 | 6.4 | GO:0097031 | NADH dehydrogenase complex assembly(GO:0010257) mitochondrial respiratory chain complex I assembly(GO:0032981) mitochondrial respiratory chain complex I biogenesis(GO:0097031) |
| 0.1 | 0.5 | GO:2000400 | positive regulation of T cell differentiation in thymus(GO:0033089) positive regulation of thymocyte aggregation(GO:2000400) |
| 0.1 | 2.1 | GO:0035456 | response to interferon-beta(GO:0035456) |
| 0.1 | 0.7 | GO:0006848 | pyruvate transport(GO:0006848) pyruvate transmembrane transport(GO:1901475) |
| 0.1 | 0.5 | GO:0048703 | embryonic viscerocranium morphogenesis(GO:0048703) |
| 0.1 | 0.6 | GO:0045915 | positive regulation of catecholamine metabolic process(GO:0045915) positive regulation of dopamine metabolic process(GO:0045964) |
| 0.1 | 0.8 | GO:0048227 | plasma membrane to endosome transport(GO:0048227) |
| 0.1 | 0.6 | GO:0010624 | regulation of Schwann cell proliferation(GO:0010624) negative regulation of Schwann cell proliferation(GO:0010626) |
| 0.1 | 0.2 | GO:2000048 | negative regulation of cell-cell adhesion mediated by cadherin(GO:2000048) |
| 0.1 | 1.5 | GO:0050812 | regulation of acyl-CoA biosynthetic process(GO:0050812) |
| 0.1 | 0.8 | GO:0002091 | negative regulation of receptor internalization(GO:0002091) |
| 0.1 | 8.1 | GO:0007286 | spermatid development(GO:0007286) |
| 0.1 | 0.5 | GO:0051195 | negative regulation of glycolytic process(GO:0045820) negative regulation of cofactor metabolic process(GO:0051195) negative regulation of coenzyme metabolic process(GO:0051198) |
| 0.1 | 6.0 | GO:0016575 | histone deacetylation(GO:0016575) |
| 0.1 | 0.9 | GO:0030502 | negative regulation of bone mineralization(GO:0030502) |
| 0.1 | 0.4 | GO:0010193 | response to ozone(GO:0010193) |
| 0.1 | 0.4 | GO:0002315 | marginal zone B cell differentiation(GO:0002315) |
| 0.1 | 1.8 | GO:0045063 | T-helper 1 cell differentiation(GO:0045063) |
| 0.1 | 0.1 | GO:0090335 | regulation of brown fat cell differentiation(GO:0090335) |
| 0.1 | 0.3 | GO:0033299 | secretion of lysosomal enzymes(GO:0033299) |
| 0.1 | 0.6 | GO:0006883 | cellular sodium ion homeostasis(GO:0006883) |
| 0.1 | 0.9 | GO:0097341 | inhibition of cysteine-type endopeptidase activity(GO:0097340) zymogen inhibition(GO:0097341) |
| 0.1 | 0.4 | GO:0090166 | vesicle fusion with Golgi apparatus(GO:0048280) Golgi disassembly(GO:0090166) |
| 0.1 | 0.3 | GO:0008065 | establishment of blood-nerve barrier(GO:0008065) |
| 0.1 | 0.5 | GO:0006941 | striated muscle contraction(GO:0006941) |
| 0.1 | 1.4 | GO:2000114 | regulation of establishment of cell polarity(GO:2000114) |
| 0.1 | 0.2 | GO:2000622 | regulation of nuclear-transcribed mRNA catabolic process, nonsense-mediated decay(GO:2000622) negative regulation of nuclear-transcribed mRNA catabolic process, nonsense-mediated decay(GO:2000623) |
| 0.1 | 0.3 | GO:0002005 | angiotensin catabolic process in blood(GO:0002005) |
| 0.1 | 0.3 | GO:0006768 | biotin metabolic process(GO:0006768) |
| 0.1 | 1.4 | GO:0036152 | phosphatidylethanolamine acyl-chain remodeling(GO:0036152) |
| 0.0 | 0.4 | GO:0043152 | induction of bacterial agglutination(GO:0043152) |
| 0.0 | 0.5 | GO:0007213 | G-protein coupled acetylcholine receptor signaling pathway(GO:0007213) |
| 0.0 | 0.1 | GO:0061624 | fructose catabolic process(GO:0006001) fructose catabolic process to hydroxyacetone phosphate and glyceraldehyde-3-phosphate(GO:0061624) |
| 0.0 | 0.3 | GO:0032876 | negative regulation of DNA endoreduplication(GO:0032876) |
| 0.0 | 0.5 | GO:0035878 | nail development(GO:0035878) |
| 0.0 | 0.3 | GO:0048041 | cell-substrate adherens junction assembly(GO:0007045) focal adhesion assembly(GO:0048041) |
| 0.0 | 0.3 | GO:0043316 | cytotoxic T cell degranulation(GO:0043316) positive regulation of constitutive secretory pathway(GO:1903435) |
| 0.0 | 0.5 | GO:0003301 | physiological muscle hypertrophy(GO:0003298) physiological cardiac muscle hypertrophy(GO:0003301) cell growth involved in cardiac muscle cell development(GO:0061049) |
| 0.0 | 1.2 | GO:0051291 | protein heterooligomerization(GO:0051291) |
| 0.0 | 0.8 | GO:0045746 | negative regulation of Notch signaling pathway(GO:0045746) |
| 0.0 | 2.1 | GO:0050852 | T cell receptor signaling pathway(GO:0050852) |
| 0.0 | 0.9 | GO:0072332 | intrinsic apoptotic signaling pathway by p53 class mediator(GO:0072332) |
| 0.0 | 0.8 | GO:0046856 | phosphatidylinositol dephosphorylation(GO:0046856) |
| 0.0 | 0.9 | GO:0014002 | astrocyte development(GO:0014002) |
| 0.0 | 0.2 | GO:0098915 | membrane repolarization during ventricular cardiac muscle cell action potential(GO:0098915) |
| 0.0 | 0.1 | GO:0008211 | glucocorticoid metabolic process(GO:0008211) |
| 0.0 | 1.1 | GO:0000245 | spliceosomal complex assembly(GO:0000245) |
| 0.0 | 1.6 | GO:0018196 | peptidyl-asparagine modification(GO:0018196) protein N-linked glycosylation via asparagine(GO:0018279) |
| 0.0 | 0.6 | GO:0071218 | cellular response to misfolded protein(GO:0071218) |
| 0.0 | 1.2 | GO:0051438 | regulation of ubiquitin-protein transferase activity(GO:0051438) |
| 0.0 | 0.4 | GO:0071044 | histone mRNA catabolic process(GO:0071044) |
| 0.0 | 0.2 | GO:0050908 | detection of light stimulus involved in visual perception(GO:0050908) detection of light stimulus involved in sensory perception(GO:0050962) |
| 0.0 | 0.1 | GO:0002541 | activation of plasma proteins involved in acute inflammatory response(GO:0002541) |
| 0.0 | 0.2 | GO:0071028 | nuclear RNA surveillance(GO:0071027) nuclear mRNA surveillance(GO:0071028) |
| 0.0 | 1.0 | GO:0031640 | killing of cells of other organism(GO:0031640) disruption of cells of other organism(GO:0044364) |
| 0.0 | 0.9 | GO:0006730 | one-carbon metabolic process(GO:0006730) |
| 0.0 | 0.1 | GO:1902902 | negative regulation of autophagosome assembly(GO:1902902) |
| 0.0 | 0.1 | GO:1901374 | acetate ester transport(GO:1901374) |
| 0.0 | 1.3 | GO:0006968 | cellular defense response(GO:0006968) |
| 0.0 | 1.5 | GO:0006903 | vesicle targeting(GO:0006903) |
| 0.0 | 0.1 | GO:0000160 | phosphorelay signal transduction system(GO:0000160) |
| 0.0 | 0.1 | GO:0086097 | positive regulation of phospholipase A2 activity(GO:0032430) phospholipase C-activating angiotensin-activated signaling pathway(GO:0086097) |
| 0.0 | 3.2 | GO:0000209 | protein polyubiquitination(GO:0000209) |
| 0.0 | 0.7 | GO:0000413 | protein peptidyl-prolyl isomerization(GO:0000413) |
| 0.0 | 0.7 | GO:0000186 | activation of MAPKK activity(GO:0000186) |
| 0.0 | 0.1 | GO:0070102 | interleukin-6-mediated signaling pathway(GO:0070102) |
| 0.0 | 1.6 | GO:0009267 | cellular response to starvation(GO:0009267) |
| 0.0 | 1.0 | GO:0042439 | ethanolamine-containing compound metabolic process(GO:0042439) |
| 0.0 | 0.1 | GO:0015991 | energy coupled proton transmembrane transport, against electrochemical gradient(GO:0015988) ATP hydrolysis coupled proton transport(GO:0015991) ATP hydrolysis coupled transmembrane transport(GO:0090662) |
| 0.0 | 5.6 | GO:0043687 | post-translational protein modification(GO:0043687) |
| 0.0 | 0.1 | GO:0060712 | spongiotrophoblast layer development(GO:0060712) |
| 0.0 | 0.0 | GO:0006533 | aspartate catabolic process(GO:0006533) |
| 0.0 | 0.4 | GO:0035235 | ionotropic glutamate receptor signaling pathway(GO:0035235) |
| 0.0 | 1.5 | GO:0007156 | homophilic cell adhesion via plasma membrane adhesion molecules(GO:0007156) |
Gene overrepresentation in cellular_component category:
| Log-likelihood per target | Total log-likelihood | Term | Description |
|---|---|---|---|
| 7.3 | 21.9 | GO:1902636 | kinociliary basal body(GO:1902636) |
| 6.1 | 30.5 | GO:0036398 | TCR signalosome(GO:0036398) |
| 5.6 | 45.0 | GO:0035976 | AP1 complex(GO:0035976) |
| 2.6 | 18.1 | GO:0046581 | intercellular canaliculus(GO:0046581) |
| 2.6 | 51.2 | GO:0001891 | phagocytic cup(GO:0001891) |
| 2.4 | 7.2 | GO:0044609 | DBIRD complex(GO:0044609) |
| 2.3 | 9.1 | GO:0033596 | TSC1-TSC2 complex(GO:0033596) |
| 2.0 | 8.0 | GO:0030485 | smooth muscle contractile fiber(GO:0030485) |
| 2.0 | 23.8 | GO:0032045 | guanyl-nucleotide exchange factor complex(GO:0032045) |
| 1.6 | 17.1 | GO:0033391 | chromatoid body(GO:0033391) |
| 1.4 | 5.8 | GO:0071062 | alphav-beta3 integrin-vitronectin complex(GO:0071062) |
| 1.4 | 30.3 | GO:0034045 | pre-autophagosomal structure membrane(GO:0034045) |
| 1.4 | 27.9 | GO:0005952 | cAMP-dependent protein kinase complex(GO:0005952) |
| 1.2 | 4.8 | GO:0005797 | Golgi medial cisterna(GO:0005797) |
| 1.2 | 38.6 | GO:0080008 | Cul4-RING E3 ubiquitin ligase complex(GO:0080008) |
| 1.1 | 4.3 | GO:0035838 | growing cell tip(GO:0035838) |
| 1.0 | 7.0 | GO:0098575 | lumenal side of lysosomal membrane(GO:0098575) |
| 0.9 | 1.9 | GO:0097454 | Schwann cell microvillus(GO:0097454) |
| 0.9 | 2.7 | GO:0019034 | viral replication complex(GO:0019034) |
| 0.8 | 12.9 | GO:0097512 | cardiac myofibril(GO:0097512) |
| 0.7 | 18.4 | GO:0035098 | ESC/E(Z) complex(GO:0035098) |
| 0.6 | 8.2 | GO:0034992 | microtubule organizing center attachment site(GO:0034992) LINC complex(GO:0034993) |
| 0.6 | 4.2 | GO:0002178 | palmitoyltransferase complex(GO:0002178) |
| 0.6 | 2.9 | GO:0005899 | insulin receptor complex(GO:0005899) |
| 0.6 | 5.8 | GO:0097427 | microtubule bundle(GO:0097427) |
| 0.6 | 3.5 | GO:0033180 | proton-transporting V-type ATPase, V1 domain(GO:0033180) |
| 0.6 | 8.1 | GO:0005589 | collagen type VI trimer(GO:0005589) collagen beaded filament(GO:0098647) |
| 0.6 | 1.7 | GO:0071595 | Nem1-Spo7 phosphatase complex(GO:0071595) |
| 0.5 | 19.4 | GO:0005720 | nuclear heterochromatin(GO:0005720) |
| 0.5 | 1.5 | GO:0048269 | methionine adenosyltransferase complex(GO:0048269) |
| 0.5 | 4.2 | GO:0070022 | transforming growth factor beta receptor homodimeric complex(GO:0070022) |
| 0.5 | 7.2 | GO:0042622 | photoreceptor outer segment membrane(GO:0042622) |
| 0.4 | 7.1 | GO:0043073 | germ cell nucleus(GO:0043073) |
| 0.4 | 9.8 | GO:0071564 | npBAF complex(GO:0071564) |
| 0.4 | 30.6 | GO:0005776 | autophagosome(GO:0005776) |
| 0.4 | 148.4 | GO:0005765 | lysosomal membrane(GO:0005765) lytic vacuole membrane(GO:0098852) |
| 0.3 | 1.0 | GO:0000308 | cytoplasmic cyclin-dependent protein kinase holoenzyme complex(GO:0000308) |
| 0.3 | 5.7 | GO:0043020 | NADPH oxidase complex(GO:0043020) |
| 0.3 | 8.2 | GO:0032982 | myosin filament(GO:0032982) |
| 0.3 | 1.9 | GO:1990452 | Parkin-FBXW7-Cul1 ubiquitin ligase complex(GO:1990452) |
| 0.3 | 3.5 | GO:0005577 | fibrinogen complex(GO:0005577) |
| 0.3 | 9.4 | GO:0000118 | histone deacetylase complex(GO:0000118) |
| 0.3 | 23.3 | GO:0005758 | mitochondrial intermembrane space(GO:0005758) |
| 0.3 | 3.0 | GO:0033256 | I-kappaB/NF-kappaB complex(GO:0033256) |
| 0.2 | 0.7 | GO:0044530 | supraspliceosomal complex(GO:0044530) |
| 0.2 | 9.1 | GO:0044665 | MLL1/2 complex(GO:0044665) MLL1 complex(GO:0071339) |
| 0.2 | 3.1 | GO:0097136 | Bcl-2 family protein complex(GO:0097136) |
| 0.2 | 13.7 | GO:0000307 | cyclin-dependent protein kinase holoenzyme complex(GO:0000307) |
| 0.2 | 5.3 | GO:0035861 | site of double-strand break(GO:0035861) |
| 0.2 | 6.5 | GO:0031092 | platelet alpha granule membrane(GO:0031092) |
| 0.2 | 2.6 | GO:0071141 | SMAD protein complex(GO:0071141) |
| 0.2 | 1.9 | GO:0016600 | flotillin complex(GO:0016600) |
| 0.2 | 1.9 | GO:0071953 | elastic fiber(GO:0071953) |
| 0.2 | 1.6 | GO:0044666 | MLL3/4 complex(GO:0044666) |
| 0.2 | 25.6 | GO:0000932 | cytoplasmic mRNA processing body(GO:0000932) |
| 0.2 | 5.5 | GO:0030018 | Z disc(GO:0030018) |
| 0.2 | 34.2 | GO:0030426 | growth cone(GO:0030426) |
| 0.2 | 7.9 | GO:0097542 | ciliary tip(GO:0097542) |
| 0.2 | 1.2 | GO:1990635 | proximal dendrite(GO:1990635) |
| 0.2 | 1.7 | GO:0070937 | CRD-mediated mRNA stability complex(GO:0070937) |
| 0.2 | 1.5 | GO:0072686 | mitotic spindle(GO:0072686) |
| 0.2 | 0.8 | GO:0046696 | lipopolysaccharide receptor complex(GO:0046696) |
| 0.2 | 7.7 | GO:0005637 | nuclear inner membrane(GO:0005637) |
| 0.2 | 52.6 | GO:0000790 | nuclear chromatin(GO:0000790) |
| 0.1 | 1.2 | GO:0031462 | Cul2-RING ubiquitin ligase complex(GO:0031462) |
| 0.1 | 8.0 | GO:0005801 | cis-Golgi network(GO:0005801) |
| 0.1 | 58.8 | GO:0016607 | nuclear speck(GO:0016607) |
| 0.1 | 4.2 | GO:0044322 | endoplasmic reticulum quality control compartment(GO:0044322) |
| 0.1 | 8.6 | GO:0055038 | recycling endosome membrane(GO:0055038) |
| 0.1 | 13.8 | GO:0031093 | platelet alpha granule lumen(GO:0031093) |
| 0.1 | 5.2 | GO:0045171 | intercellular bridge(GO:0045171) |
| 0.1 | 9.9 | GO:0016605 | PML body(GO:0016605) |
| 0.1 | 19.2 | GO:0005741 | mitochondrial outer membrane(GO:0005741) |
| 0.1 | 11.2 | GO:0005796 | Golgi lumen(GO:0005796) |
| 0.1 | 0.9 | GO:0097470 | ribbon synapse(GO:0097470) |
| 0.1 | 4.0 | GO:0005905 | clathrin-coated pit(GO:0005905) |
| 0.1 | 2.2 | GO:0046658 | anchored component of plasma membrane(GO:0046658) |
| 0.1 | 0.9 | GO:0031616 | spindle pole centrosome(GO:0031616) |
| 0.1 | 0.2 | GO:0070939 | Dsl1p complex(GO:0070939) |
| 0.1 | 5.0 | GO:0097517 | stress fiber(GO:0001725) contractile actin filament bundle(GO:0097517) |
| 0.1 | 0.7 | GO:0043203 | axon hillock(GO:0043203) |
| 0.1 | 1.9 | GO:0042629 | mast cell granule(GO:0042629) |
| 0.1 | 1.1 | GO:0097228 | sperm principal piece(GO:0097228) |
| 0.1 | 8.7 | GO:0031234 | extrinsic component of cytoplasmic side of plasma membrane(GO:0031234) |
| 0.1 | 5.8 | GO:0008076 | voltage-gated potassium channel complex(GO:0008076) potassium channel complex(GO:0034705) |
| 0.1 | 27.3 | GO:0031966 | mitochondrial membrane(GO:0031966) |
| 0.1 | 1.9 | GO:0005903 | brush border(GO:0005903) |
| 0.1 | 0.4 | GO:0005791 | rough endoplasmic reticulum(GO:0005791) |
| 0.0 | 2.3 | GO:0005882 | intermediate filament(GO:0005882) |
| 0.0 | 4.4 | GO:0035578 | azurophil granule lumen(GO:0035578) |
| 0.0 | 1.2 | GO:0032391 | photoreceptor connecting cilium(GO:0032391) |
| 0.0 | 11.6 | GO:0005769 | early endosome(GO:0005769) |
| 0.0 | 2.8 | GO:0035580 | specific granule lumen(GO:0035580) |
| 0.0 | 0.4 | GO:0097440 | apical dendrite(GO:0097440) |
| 0.0 | 10.5 | GO:0005886 | plasma membrane(GO:0005886) |
| 0.0 | 1.2 | GO:0008023 | transcription elongation factor complex(GO:0008023) |
| 0.0 | 0.5 | GO:0035327 | transcriptionally active chromatin(GO:0035327) |
| 0.0 | 1.0 | GO:0005669 | transcription factor TFIID complex(GO:0005669) |
| 0.0 | 0.6 | GO:0008074 | guanylate cyclase complex, soluble(GO:0008074) |
| 0.0 | 0.2 | GO:0005795 | Golgi stack(GO:0005795) |
| 0.0 | 6.1 | GO:0031965 | nuclear membrane(GO:0031965) |
| 0.0 | 0.4 | GO:0005922 | connexon complex(GO:0005922) |
| 0.0 | 0.1 | GO:0071817 | holo TFIIH complex(GO:0005675) MMXD complex(GO:0071817) |
| 0.0 | 3.4 | GO:0034774 | secretory granule lumen(GO:0034774) |
| 0.0 | 0.9 | GO:0005770 | late endosome(GO:0005770) |
| 0.0 | 2.9 | GO:0072562 | blood microparticle(GO:0072562) |
| 0.0 | 0.4 | GO:0030666 | endocytic vesicle membrane(GO:0030666) |
| 0.0 | 0.4 | GO:0032281 | AMPA glutamate receptor complex(GO:0032281) |
| 0.0 | 1.7 | GO:0005681 | spliceosomal complex(GO:0005681) |
| 0.0 | 0.6 | GO:0005874 | microtubule(GO:0005874) |
| 0.0 | 0.4 | GO:0030173 | integral component of Golgi membrane(GO:0030173) |
| 0.0 | 0.4 | GO:0031201 | SNARE complex(GO:0031201) |
| 0.0 | 0.1 | GO:0097225 | sperm midpiece(GO:0097225) |
| 0.0 | 0.9 | GO:0045121 | membrane raft(GO:0045121) membrane microdomain(GO:0098857) |
| 0.0 | 0.8 | GO:0035579 | specific granule membrane(GO:0035579) |
Gene overrepresentation in molecular_function category:
| Log-likelihood per target | Total log-likelihood | Term | Description |
|---|---|---|---|
| 21.9 | 131.2 | GO:0051032 | nucleic acid transmembrane transporter activity(GO:0051032) RNA transmembrane transporter activity(GO:0051033) |
| 9.9 | 29.7 | GO:0047696 | beta-adrenergic receptor kinase activity(GO:0047696) |
| 4.5 | 57.9 | GO:0001087 | transcription factor activity, sequence-specific DNA binding, RNA polymerase recruiting(GO:0001011) transcription factor activity, TFIIB-class binding(GO:0001087) |
| 4.4 | 26.5 | GO:0060698 | endoribonuclease inhibitor activity(GO:0060698) |
| 4.4 | 21.9 | GO:0002046 | opsin binding(GO:0002046) |
| 4.4 | 39.4 | GO:0043426 | MRF binding(GO:0043426) |
| 2.9 | 8.8 | GO:0050528 | acyloxyacyl hydrolase activity(GO:0050528) |
| 2.8 | 8.5 | GO:0019959 | interleukin-8 binding(GO:0019959) |
| 2.7 | 10.7 | GO:0042030 | ATPase inhibitor activity(GO:0042030) |
| 2.6 | 20.9 | GO:0071933 | Arp2/3 complex binding(GO:0071933) |
| 2.6 | 12.8 | GO:0038051 | glucocorticoid receptor activity(GO:0004883) glucocorticoid-activated RNA polymerase II transcription factor binding transcription factor activity(GO:0038051) |
| 2.1 | 14.6 | GO:0008142 | oxysterol binding(GO:0008142) |
| 2.0 | 6.1 | GO:0071558 | histone demethylase activity (H3-K27 specific)(GO:0071558) |
| 2.0 | 5.9 | GO:0004719 | protein-L-isoaspartate (D-aspartate) O-methyltransferase activity(GO:0004719) |
| 1.9 | 20.8 | GO:0015174 | basic amino acid transmembrane transporter activity(GO:0015174) |
| 1.9 | 5.6 | GO:0004796 | thromboxane-A synthase activity(GO:0004796) 12-hydroxyheptadecatrienoic acid synthase activity(GO:0036134) |
| 1.8 | 30.9 | GO:0055106 | ubiquitin-protein transferase regulator activity(GO:0055106) |
| 1.7 | 26.5 | GO:0004691 | cAMP-dependent protein kinase activity(GO:0004691) |
| 1.6 | 4.7 | GO:0004694 | eukaryotic translation initiation factor 2alpha kinase activity(GO:0004694) |
| 1.5 | 6.1 | GO:0004307 | diacylglycerol cholinephosphotransferase activity(GO:0004142) ethanolaminephosphotransferase activity(GO:0004307) |
| 1.4 | 5.5 | GO:0008449 | N-acetylglucosamine-6-sulfatase activity(GO:0008449) |
| 1.4 | 11.0 | GO:0005131 | growth hormone receptor binding(GO:0005131) |
| 1.3 | 4.0 | GO:0031859 | platelet activating factor receptor binding(GO:0031859) |
| 1.3 | 13.1 | GO:0008525 | phosphatidylcholine transporter activity(GO:0008525) |
| 1.2 | 5.0 | GO:0004886 | 9-cis retinoic acid receptor activity(GO:0004886) |
| 1.2 | 18.1 | GO:0031702 | type 1 angiotensin receptor binding(GO:0031702) |
| 1.2 | 3.5 | GO:0034584 | piRNA binding(GO:0034584) |
| 1.2 | 32.3 | GO:0032266 | phosphatidylinositol-3-phosphate binding(GO:0032266) |
| 1.2 | 3.5 | GO:0034714 | type III transforming growth factor beta receptor binding(GO:0034714) |
| 1.1 | 3.4 | GO:0003845 | 11-beta-hydroxysteroid dehydrogenase [NAD(P)] activity(GO:0003845) |
| 1.1 | 8.0 | GO:0042608 | T cell receptor binding(GO:0042608) |
| 1.1 | 4.3 | GO:0035651 | AP-3 adaptor complex binding(GO:0035651) |
| 1.1 | 4.2 | GO:0005026 | transforming growth factor beta receptor activity, type II(GO:0005026) |
| 1.0 | 11.5 | GO:0022889 | L-serine transmembrane transporter activity(GO:0015194) serine transmembrane transporter activity(GO:0022889) |
| 1.0 | 10.4 | GO:1990380 | Lys63-specific deubiquitinase activity(GO:0061578) Lys48-specific deubiquitinase activity(GO:1990380) |
| 1.0 | 7.2 | GO:0052650 | NADP-retinol dehydrogenase activity(GO:0052650) |
| 1.0 | 13.4 | GO:1990247 | N6-methyladenosine-containing RNA binding(GO:1990247) |
| 1.0 | 9.2 | GO:0003876 | AMP deaminase activity(GO:0003876) adenosine-phosphate deaminase activity(GO:0047623) |
| 1.0 | 5.1 | GO:0004687 | myosin light chain kinase activity(GO:0004687) |
| 1.0 | 26.2 | GO:0043548 | phosphatidylinositol 3-kinase binding(GO:0043548) |
| 1.0 | 5.9 | GO:0070892 | lipoteichoic acid receptor activity(GO:0070892) |
| 1.0 | 21.7 | GO:0042609 | CD4 receptor binding(GO:0042609) |
| 0.9 | 2.8 | GO:0008267 | poly-glutamine tract binding(GO:0008267) |
| 0.9 | 7.0 | GO:0004308 | exo-alpha-sialidase activity(GO:0004308) alpha-sialidase activity(GO:0016997) |
| 0.8 | 22.6 | GO:0001223 | transcription coactivator binding(GO:0001223) |
| 0.8 | 11.3 | GO:0017162 | aryl hydrocarbon receptor binding(GO:0017162) |
| 0.8 | 2.3 | GO:0008859 | exoribonuclease II activity(GO:0008859) |
| 0.8 | 36.4 | GO:0005164 | tumor necrosis factor receptor binding(GO:0005164) |
| 0.7 | 17.8 | GO:0030275 | LRR domain binding(GO:0030275) |
| 0.7 | 2.6 | GO:0035005 | 1-phosphatidylinositol-4-phosphate 3-kinase activity(GO:0035005) |
| 0.6 | 1.9 | GO:0015218 | pyrimidine nucleotide transmembrane transporter activity(GO:0015218) |
| 0.6 | 3.8 | GO:0035500 | MH2 domain binding(GO:0035500) |
| 0.6 | 2.5 | GO:0070053 | thrombospondin receptor activity(GO:0070053) |
| 0.6 | 4.1 | GO:0004849 | uridine kinase activity(GO:0004849) |
| 0.6 | 6.5 | GO:0015379 | potassium:chloride symporter activity(GO:0015379) potassium ion symporter activity(GO:0022820) |
| 0.6 | 16.4 | GO:0005521 | lamin binding(GO:0005521) |
| 0.6 | 1.7 | GO:0004949 | cannabinoid receptor activity(GO:0004949) |
| 0.6 | 2.8 | GO:0004905 | type I interferon receptor activity(GO:0004905) |
| 0.6 | 13.8 | GO:0000062 | fatty-acyl-CoA binding(GO:0000062) |
| 0.6 | 2.8 | GO:0038062 | protein tyrosine kinase collagen receptor activity(GO:0038062) |
| 0.5 | 2.7 | GO:0034046 | poly(G) binding(GO:0034046) |
| 0.5 | 1.6 | GO:0004992 | platelet activating factor receptor activity(GO:0004992) |
| 0.5 | 4.3 | GO:0004563 | beta-N-acetylhexosaminidase activity(GO:0004563) |
| 0.5 | 9.0 | GO:0017160 | Ral GTPase binding(GO:0017160) |
| 0.5 | 1.5 | GO:0004877 | complement component C4b receptor activity(GO:0001861) complement component C3b receptor activity(GO:0004877) |
| 0.5 | 1.9 | GO:0086080 | protein binding involved in heterotypic cell-cell adhesion(GO:0086080) |
| 0.5 | 0.9 | GO:0005017 | platelet-derived growth factor-activated receptor activity(GO:0005017) |
| 0.4 | 8.0 | GO:0015467 | G-protein activated inward rectifier potassium channel activity(GO:0015467) |
| 0.4 | 9.1 | GO:0032794 | GTPase activating protein binding(GO:0032794) |
| 0.4 | 1.7 | GO:0016160 | amylase activity(GO:0016160) |
| 0.4 | 5.4 | GO:0052629 | phosphatidylinositol-3,5-bisphosphate 3-phosphatase activity(GO:0052629) |
| 0.4 | 12.9 | GO:0005212 | structural constituent of eye lens(GO:0005212) |
| 0.4 | 5.3 | GO:0008140 | cAMP response element binding protein binding(GO:0008140) |
| 0.4 | 8.7 | GO:0001221 | transcription cofactor binding(GO:0001221) |
| 0.4 | 1.1 | GO:0036487 | nitric-oxide synthase inhibitor activity(GO:0036487) |
| 0.4 | 2.2 | GO:0001161 | intronic transcription regulatory region sequence-specific DNA binding(GO:0001161) intronic transcription regulatory region DNA binding(GO:0044213) |
| 0.4 | 1.5 | GO:0004740 | pyruvate dehydrogenase (acetyl-transferring) kinase activity(GO:0004740) |
| 0.4 | 5.8 | GO:0001871 | pattern binding(GO:0001871) polysaccharide binding(GO:0030247) |
| 0.4 | 5.4 | GO:0019706 | protein-cysteine S-palmitoyltransferase activity(GO:0019706) protein-cysteine S-acyltransferase activity(GO:0019707) |
| 0.4 | 1.4 | GO:0070996 | type 1 melanocortin receptor binding(GO:0070996) |
| 0.4 | 6.8 | GO:0034237 | protein kinase A regulatory subunit binding(GO:0034237) |
| 0.4 | 5.3 | GO:0034450 | ubiquitin-ubiquitin ligase activity(GO:0034450) |
| 0.4 | 1.4 | GO:0004727 | prenylated protein tyrosine phosphatase activity(GO:0004727) |
| 0.3 | 20.2 | GO:0004693 | cyclin-dependent protein serine/threonine kinase activity(GO:0004693) |
| 0.3 | 13.1 | GO:0031593 | polyubiquitin binding(GO:0031593) |
| 0.3 | 4.4 | GO:0017110 | nucleoside-diphosphatase activity(GO:0017110) |
| 0.3 | 6.6 | GO:0070577 | lysine-acetylated histone binding(GO:0070577) |
| 0.3 | 2.2 | GO:0048101 | calcium- and calmodulin-regulated 3',5'-cyclic-GMP phosphodiesterase activity(GO:0048101) |
| 0.3 | 10.2 | GO:0000983 | transcription factor activity, RNA polymerase II core promoter sequence-specific(GO:0000983) |
| 0.3 | 5.8 | GO:0050321 | tau-protein kinase activity(GO:0050321) |
| 0.3 | 8.6 | GO:0043015 | gamma-tubulin binding(GO:0043015) |
| 0.3 | 2.3 | GO:0004873 | asialoglycoprotein receptor activity(GO:0004873) |
| 0.3 | 6.9 | GO:0000993 | RNA polymerase II core binding(GO:0000993) |
| 0.3 | 5.7 | GO:0016175 | superoxide-generating NADPH oxidase activity(GO:0016175) |
| 0.3 | 7.0 | GO:0008191 | metalloendopeptidase inhibitor activity(GO:0008191) |
| 0.3 | 2.2 | GO:0005534 | galactose binding(GO:0005534) |
| 0.3 | 1.4 | GO:1990430 | extracellular matrix protein binding(GO:1990430) |
| 0.3 | 6.0 | GO:0035259 | glucocorticoid receptor binding(GO:0035259) |
| 0.3 | 18.6 | GO:0004004 | ATP-dependent RNA helicase activity(GO:0004004) |
| 0.3 | 2.6 | GO:0070324 | thyroid hormone binding(GO:0070324) |
| 0.2 | 2.5 | GO:0004300 | enoyl-CoA hydratase activity(GO:0004300) |
| 0.2 | 3.9 | GO:0005381 | iron ion transmembrane transporter activity(GO:0005381) |
| 0.2 | 2.2 | GO:0004499 | N,N-dimethylaniline monooxygenase activity(GO:0004499) |
| 0.2 | 9.0 | GO:0070412 | R-SMAD binding(GO:0070412) |
| 0.2 | 6.0 | GO:0016922 | ligand-dependent nuclear receptor binding(GO:0016922) |
| 0.2 | 3.6 | GO:0000900 | translation repressor activity, nucleic acid binding(GO:0000900) |
| 0.2 | 1.9 | GO:0042975 | peroxisome proliferator activated receptor binding(GO:0042975) |
| 0.2 | 3.6 | GO:0016500 | protein-hormone receptor activity(GO:0016500) |
| 0.2 | 31.9 | GO:0017124 | SH3 domain binding(GO:0017124) |
| 0.2 | 54.2 | GO:0001227 | transcriptional repressor activity, RNA polymerase II transcription regulatory region sequence-specific binding(GO:0001227) |
| 0.2 | 49.1 | GO:0003714 | transcription corepressor activity(GO:0003714) |
| 0.2 | 5.9 | GO:0001965 | G-protein alpha-subunit binding(GO:0001965) |
| 0.2 | 2.2 | GO:0002161 | aminoacyl-tRNA editing activity(GO:0002161) |
| 0.2 | 5.4 | GO:0004715 | non-membrane spanning protein tyrosine kinase activity(GO:0004715) |
| 0.2 | 40.9 | GO:0051015 | actin filament binding(GO:0051015) |
| 0.2 | 0.7 | GO:0003726 | double-stranded RNA adenosine deaminase activity(GO:0003726) |
| 0.2 | 0.9 | GO:0008073 | ornithine decarboxylase inhibitor activity(GO:0008073) |
| 0.2 | 0.7 | GO:0005477 | pyruvate secondary active transmembrane transporter activity(GO:0005477) |
| 0.2 | 2.5 | GO:1990841 | promoter-specific chromatin binding(GO:1990841) |
| 0.2 | 4.4 | GO:0004435 | phosphatidylinositol phospholipase C activity(GO:0004435) |
| 0.2 | 0.5 | GO:0010698 | acetyltransferase activator activity(GO:0010698) |
| 0.2 | 10.3 | GO:0050840 | extracellular matrix binding(GO:0050840) |
| 0.2 | 0.9 | GO:0010859 | calcium-dependent cysteine-type endopeptidase inhibitor activity(GO:0010859) |
| 0.2 | 9.8 | GO:0008307 | structural constituent of muscle(GO:0008307) |
| 0.2 | 3.7 | GO:0070840 | dynein complex binding(GO:0070840) |
| 0.1 | 0.9 | GO:0004013 | adenosylhomocysteinase activity(GO:0004013) trialkylsulfonium hydrolase activity(GO:0016802) |
| 0.1 | 6.6 | GO:0018024 | histone-lysine N-methyltransferase activity(GO:0018024) |
| 0.1 | 48.2 | GO:0031625 | ubiquitin protein ligase binding(GO:0031625) |
| 0.1 | 23.0 | GO:0017137 | Rab GTPase binding(GO:0017137) |
| 0.1 | 0.8 | GO:0001875 | lipopolysaccharide receptor activity(GO:0001875) |
| 0.1 | 0.4 | GO:0004938 | alpha2-adrenergic receptor activity(GO:0004938) |
| 0.1 | 0.5 | GO:0034481 | chondroitin sulfotransferase activity(GO:0034481) |
| 0.1 | 0.4 | GO:0004961 | thromboxane receptor activity(GO:0004960) thromboxane A2 receptor activity(GO:0004961) |
| 0.1 | 0.5 | GO:0004504 | peptidylglycine monooxygenase activity(GO:0004504) peptidylamidoglycolate lyase activity(GO:0004598) |
| 0.1 | 0.7 | GO:0008241 | peptidyl-dipeptidase activity(GO:0008241) |
| 0.1 | 3.2 | GO:0003950 | NAD+ ADP-ribosyltransferase activity(GO:0003950) |
| 0.1 | 2.4 | GO:0016805 | dipeptidase activity(GO:0016805) |
| 0.1 | 7.3 | GO:0019003 | GDP binding(GO:0019003) |
| 0.1 | 13.8 | GO:0044325 | ion channel binding(GO:0044325) |
| 0.1 | 17.3 | GO:0061659 | ubiquitin protein ligase activity(GO:0061630) ubiquitin-like protein ligase activity(GO:0061659) |
| 0.1 | 3.9 | GO:0036002 | pre-mRNA binding(GO:0036002) |
| 0.1 | 0.4 | GO:0033829 | O-fucosylpeptide 3-beta-N-acetylglucosaminyltransferase activity(GO:0033829) |
| 0.1 | 0.5 | GO:0017159 | pantetheine hydrolase activity(GO:0017159) |
| 0.1 | 2.5 | GO:0051087 | chaperone binding(GO:0051087) |
| 0.1 | 13.5 | GO:0042393 | histone binding(GO:0042393) |
| 0.1 | 6.0 | GO:0004712 | protein serine/threonine/tyrosine kinase activity(GO:0004712) |
| 0.1 | 0.4 | GO:0042132 | fructose 1,6-bisphosphate 1-phosphatase activity(GO:0042132) |
| 0.1 | 0.5 | GO:0097108 | hedgehog family protein binding(GO:0097108) |
| 0.1 | 0.3 | GO:0047708 | biotinidase activity(GO:0047708) |
| 0.1 | 0.4 | GO:0019834 | phospholipase A2 inhibitor activity(GO:0019834) |
| 0.1 | 3.9 | GO:0030145 | manganese ion binding(GO:0030145) |
| 0.1 | 2.1 | GO:0031492 | nucleosomal DNA binding(GO:0031492) |
| 0.1 | 0.2 | GO:0034353 | RNA pyrophosphohydrolase activity(GO:0034353) |
| 0.1 | 0.5 | GO:0005157 | macrophage colony-stimulating factor receptor binding(GO:0005157) |
| 0.1 | 1.6 | GO:0005092 | GDP-dissociation inhibitor activity(GO:0005092) |
| 0.1 | 0.9 | GO:0031434 | mitogen-activated protein kinase kinase binding(GO:0031434) |
| 0.1 | 1.4 | GO:0008327 | methyl-CpG binding(GO:0008327) |
| 0.1 | 1.4 | GO:0051019 | mitogen-activated protein kinase binding(GO:0051019) |
| 0.1 | 1.4 | GO:0043395 | heparan sulfate proteoglycan binding(GO:0043395) |
| 0.1 | 6.0 | GO:0004197 | cysteine-type endopeptidase activity(GO:0004197) |
| 0.1 | 1.2 | GO:0071889 | 14-3-3 protein binding(GO:0071889) |
| 0.1 | 0.7 | GO:0019992 | diacylglycerol binding(GO:0019992) |
| 0.1 | 3.1 | GO:0008233 | peptidase activity(GO:0008233) |
| 0.1 | 2.3 | GO:0017112 | Rab guanyl-nucleotide exchange factor activity(GO:0017112) |
| 0.1 | 3.0 | GO:0001158 | enhancer sequence-specific DNA binding(GO:0001158) |
| 0.1 | 0.9 | GO:0004089 | carbonate dehydratase activity(GO:0004089) |
| 0.1 | 0.7 | GO:0016018 | cyclosporin A binding(GO:0016018) |
| 0.0 | 4.9 | GO:0004222 | metalloendopeptidase activity(GO:0004222) |
| 0.0 | 7.3 | GO:0000287 | magnesium ion binding(GO:0000287) |
| 0.0 | 1.1 | GO:0015269 | calcium-activated potassium channel activity(GO:0015269) |
| 0.0 | 0.2 | GO:0070653 | high-density lipoprotein particle receptor binding(GO:0070653) |
| 0.0 | 0.3 | GO:0005223 | intracellular cGMP activated cation channel activity(GO:0005223) |
| 0.0 | 0.1 | GO:1901375 | acetylcholine transmembrane transporter activity(GO:0005277) secondary active organic cation transmembrane transporter activity(GO:0008513) acetate ester transmembrane transporter activity(GO:1901375) |
| 0.0 | 3.6 | GO:0015078 | hydrogen ion transmembrane transporter activity(GO:0015078) |
| 0.0 | 0.7 | GO:0004622 | lysophospholipase activity(GO:0004622) |
| 0.0 | 0.4 | GO:0004971 | AMPA glutamate receptor activity(GO:0004971) |
| 0.0 | 0.8 | GO:0031490 | chromatin DNA binding(GO:0031490) |
| 0.0 | 1.1 | GO:0035255 | ionotropic glutamate receptor binding(GO:0035255) |
| 0.0 | 0.1 | GO:0004995 | tachykinin receptor activity(GO:0004995) |
| 0.0 | 0.2 | GO:0034236 | protein kinase A catalytic subunit binding(GO:0034236) |
| 0.0 | 4.5 | GO:0019900 | kinase binding(GO:0019900) |
| 0.0 | 0.7 | GO:0005184 | neuropeptide hormone activity(GO:0005184) |
| 0.0 | 0.2 | GO:1990405 | protein antigen binding(GO:1990405) |
| 0.0 | 0.6 | GO:0017080 | sodium channel regulator activity(GO:0017080) |
| 0.0 | 0.2 | GO:0005229 | intracellular calcium activated chloride channel activity(GO:0005229) |
| 0.0 | 0.1 | GO:0031711 | angiotensin type I receptor activity(GO:0001596) bradykinin receptor binding(GO:0031711) |
| 0.0 | 0.9 | GO:0101005 | thiol-dependent ubiquitinyl hydrolase activity(GO:0036459) ubiquitinyl hydrolase activity(GO:0101005) |
| 0.0 | 0.3 | GO:0070006 | metalloaminopeptidase activity(GO:0070006) |
| 0.0 | 0.8 | GO:0051539 | 4 iron, 4 sulfur cluster binding(GO:0051539) |
| 0.0 | 0.3 | GO:0005540 | hyaluronic acid binding(GO:0005540) |
| 0.0 | 1.9 | GO:0022832 | voltage-gated ion channel activity(GO:0005244) voltage-gated channel activity(GO:0022832) |
| 0.0 | 0.1 | GO:0004332 | fructose-bisphosphate aldolase activity(GO:0004332) |
| 0.0 | 0.6 | GO:0000049 | tRNA binding(GO:0000049) |
| 0.0 | 0.4 | GO:0032934 | sterol binding(GO:0032934) |
| 0.0 | 0.3 | GO:0015149 | hexose transmembrane transporter activity(GO:0015149) |
Gene overrepresentation in C2:CP category:
| Log-likelihood per target | Total log-likelihood | Term | Description |
|---|---|---|---|
| 1.1 | 11.0 | ST IL 13 PATHWAY | Interleukin 13 (IL-13) Pathway |
| 0.9 | 47.1 | PID IL8 CXCR2 PATHWAY | IL8- and CXCR2-mediated signaling events |
| 0.9 | 21.5 | PID TCR JNK PATHWAY | JNK signaling in the CD4+ TCR pathway |
| 0.8 | 27.3 | PID HDAC CLASSIII PATHWAY | Signaling events mediated by HDAC Class III |
| 0.8 | 53.3 | PID FRA PATHWAY | Validated transcriptional targets of AP1 family members Fra1 and Fra2 |
| 0.6 | 67.1 | PID AR PATHWAY | Coregulation of Androgen receptor activity |
| 0.5 | 22.0 | PID MYC PATHWAY | C-MYC pathway |
| 0.5 | 11.9 | PID CIRCADIAN PATHWAY | Circadian rhythm pathway |
| 0.5 | 12.2 | SA B CELL RECEPTOR COMPLEXES | Antigen binding to B cell receptors activates protein tyrosine kinases, such as the Src family, which ultimate activate MAP kinases. |
| 0.5 | 12.2 | PID WNT CANONICAL PATHWAY | Canonical Wnt signaling pathway |
| 0.4 | 19.4 | PID PS1 PATHWAY | Presenilin action in Notch and Wnt signaling |
| 0.4 | 19.3 | PID IL3 PATHWAY | IL3-mediated signaling events |
| 0.4 | 13.5 | PID HDAC CLASSII PATHWAY | Signaling events mediated by HDAC Class II |
| 0.4 | 2.5 | PID INTEGRIN3 PATHWAY | Beta3 integrin cell surface interactions |
| 0.3 | 7.6 | PID LPA4 PATHWAY | LPA4-mediated signaling events |
| 0.3 | 12.1 | ST TUMOR NECROSIS FACTOR PATHWAY | Tumor Necrosis Factor Pathway. |
| 0.3 | 36.0 | PID MYC REPRESS PATHWAY | Validated targets of C-MYC transcriptional repression |
| 0.3 | 9.6 | PID NFKAPPAB CANONICAL PATHWAY | Canonical NF-kappaB pathway |
| 0.3 | 18.1 | PID LKB1 PATHWAY | LKB1 signaling events |
| 0.3 | 22.7 | PID ERA GENOMIC PATHWAY | Validated nuclear estrogen receptor alpha network |
| 0.2 | 16.9 | PID CASPASE PATHWAY | Caspase cascade in apoptosis |
| 0.2 | 13.3 | SIG REGULATION OF THE ACTIN CYTOSKELETON BY RHO GTPASES | Genes related to regulation of the actin cytoskeleton |
| 0.2 | 5.8 | PID INTEGRIN5 PATHWAY | Beta5 beta6 beta7 and beta8 integrin cell surface interactions |
| 0.2 | 3.1 | SA PROGRAMMED CELL DEATH | Programmed cell death, or apoptosis, eliminates damaged or unneeded cells. |
| 0.2 | 5.2 | PID CD40 PATHWAY | CD40/CD40L signaling |
| 0.2 | 25.6 | PID PDGFRB PATHWAY | PDGFR-beta signaling pathway |
| 0.2 | 5.0 | PID RETINOIC ACID PATHWAY | Retinoic acid receptors-mediated signaling |
| 0.2 | 25.9 | PID CXCR4 PATHWAY | CXCR4-mediated signaling events |
| 0.2 | 3.6 | ST G ALPHA S PATHWAY | G alpha s Pathway |
| 0.2 | 16.5 | PID HIF1 TFPATHWAY | HIF-1-alpha transcription factor network |
| 0.2 | 5.7 | PID TCPTP PATHWAY | Signaling events mediated by TCPTP |
| 0.2 | 18.1 | PID CMYB PATHWAY | C-MYB transcription factor network |
| 0.2 | 0.9 | PID PDGFRA PATHWAY | PDGFR-alpha signaling pathway |
| 0.2 | 8.8 | PID REG GR PATHWAY | Glucocorticoid receptor regulatory network |
| 0.2 | 2.1 | PID AJDISS 2PATHWAY | Posttranslational regulation of adherens junction stability and dissassembly |
| 0.2 | 7.3 | NABA PROTEOGLYCANS | Genes encoding proteoglycans |
| 0.2 | 3.9 | PID CD8 TCR PATHWAY | TCR signaling in naïve CD8+ T cells |
| 0.2 | 3.9 | PID RAC1 PATHWAY | RAC1 signaling pathway |
| 0.1 | 4.0 | PID ALK1 PATHWAY | ALK1 signaling events |
| 0.1 | 2.8 | PID CD8 TCR DOWNSTREAM PATHWAY | Downstream signaling in naïve CD8+ T cells |
| 0.1 | 2.2 | SA G1 AND S PHASES | Cdk2, 4, and 6 bind cyclin D in G1, while cdk2/cyclin E promotes the G1/S transition. |
| 0.1 | 2.5 | PID IL6 7 PATHWAY | IL6-mediated signaling events |
| 0.1 | 1.4 | PID SYNDECAN 3 PATHWAY | Syndecan-3-mediated signaling events |
| 0.1 | 5.4 | PID RAC1 REG PATHWAY | Regulation of RAC1 activity |
| 0.1 | 0.8 | PID EPHA2 FWD PATHWAY | EPHA2 forward signaling |
| 0.1 | 39.9 | NABA SECRETED FACTORS | Genes encoding secreted soluble factors |
| 0.1 | 4.5 | PID P53 REGULATION PATHWAY | p53 pathway |
| 0.1 | 4.0 | PID BETA CATENIN NUC PATHWAY | Regulation of nuclear beta catenin signaling and target gene transcription |
| 0.1 | 1.6 | PID INTEGRIN A9B1 PATHWAY | Alpha9 beta1 integrin signaling events |
| 0.1 | 1.9 | SIG PIP3 SIGNALING IN B LYMPHOCYTES | Genes related to PIP3 signaling in B lymphocytes |
| 0.1 | 0.6 | ST WNT BETA CATENIN PATHWAY | Wnt/beta-catenin Pathway |
| 0.1 | 1.4 | PID INTEGRIN A4B1 PATHWAY | Alpha4 beta1 integrin signaling events |
| 0.1 | 2.5 | PID HDAC CLASSI PATHWAY | Signaling events mediated by HDAC Class I |
| 0.1 | 1.3 | PID FCER1 PATHWAY | Fc-epsilon receptor I signaling in mast cells |
| 0.1 | 1.4 | PID A6B1 A6B4 INTEGRIN PATHWAY | a6b1 and a6b4 Integrin signaling |
| 0.0 | 0.5 | PID PRL SIGNALING EVENTS PATHWAY | Signaling events mediated by PRL |
| 0.0 | 1.2 | PID NFAT TFPATHWAY | Calcineurin-regulated NFAT-dependent transcription in lymphocytes |
| 0.0 | 0.9 | PID ERBB4 PATHWAY | ErbB4 signaling events |
| 0.0 | 10.1 | NABA ECM REGULATORS | Genes encoding enzymes and their regulators involved in the remodeling of the extracellular matrix |
| 0.0 | 1.0 | PID ATF2 PATHWAY | ATF-2 transcription factor network |
| 0.0 | 0.8 | PID ALPHA SYNUCLEIN PATHWAY | Alpha-synuclein signaling |
| 0.0 | 0.4 | PID UPA UPAR PATHWAY | Urokinase-type plasminogen activator (uPA) and uPAR-mediated signaling |
| 0.0 | 0.4 | ST GA13 PATHWAY | G alpha 13 Pathway |
| 0.0 | 0.2 | PID HES HEY PATHWAY | Notch-mediated HES/HEY network |
| 0.0 | 0.9 | PID FANCONI PATHWAY | Fanconi anemia pathway |
| 0.0 | 0.3 | PID MET PATHWAY | Signaling events mediated by Hepatocyte Growth Factor Receptor (c-Met) |
| 0.0 | 0.2 | SIG PIP3 SIGNALING IN CARDIAC MYOCTES | Genes related to PIP3 signaling in cardiac myocytes |
| 0.0 | 0.4 | PID HNF3A PATHWAY | FOXA1 transcription factor network |
| 0.0 | 1.0 | PID MYC ACTIV PATHWAY | Validated targets of C-MYC transcriptional activation |
Gene overrepresentation in C2:CP:REACTOME category:
| Log-likelihood per target | Total log-likelihood | Term | Description |
|---|---|---|---|
| 2.9 | 55.0 | REACTOME THE NLRP3 INFLAMMASOME | Genes involved in The NLRP3 inflammasome |
| 1.4 | 38.1 | REACTOME CIRCADIAN REPRESSION OF EXPRESSION BY REV ERBA | Genes involved in Circadian Repression of Expression by REV-ERBA |
| 1.2 | 13.0 | REACTOME REGULATION OF INSULIN SECRETION BY ACETYLCHOLINE | Genes involved in Regulation of Insulin Secretion by Acetylcholine |
| 1.0 | 24.7 | REACTOME CTNNB1 PHOSPHORYLATION CASCADE | Genes involved in Beta-catenin phosphorylation cascade |
| 1.0 | 53.1 | REACTOME MYOGENESIS | Genes involved in Myogenesis |
| 0.9 | 28.5 | REACTOME PKA MEDIATED PHOSPHORYLATION OF CREB | Genes involved in PKA-mediated phosphorylation of CREB |
| 0.8 | 11.3 | REACTOME ANDROGEN BIOSYNTHESIS | Genes involved in Androgen biosynthesis |
| 0.7 | 29.5 | REACTOME PIP3 ACTIVATES AKT SIGNALING | Genes involved in PIP3 activates AKT signaling |
| 0.7 | 34.9 | REACTOME THE ROLE OF NEF IN HIV1 REPLICATION AND DISEASE PATHOGENESIS | Genes involved in The role of Nef in HIV-1 replication and disease pathogenesis |
| 0.7 | 19.4 | REACTOME ENERGY DEPENDENT REGULATION OF MTOR BY LKB1 AMPK | Genes involved in Energy dependent regulation of mTOR by LKB1-AMPK |
| 0.7 | 12.5 | REACTOME IL 6 SIGNALING | Genes involved in Interleukin-6 signaling |
| 0.6 | 16.3 | REACTOME BRANCHED CHAIN AMINO ACID CATABOLISM | Genes involved in Branched-chain amino acid catabolism |
| 0.5 | 21.0 | REACTOME AMINO ACID TRANSPORT ACROSS THE PLASMA MEMBRANE | Genes involved in Amino acid transport across the plasma membrane |
| 0.5 | 5.3 | REACTOME IRAK1 RECRUITS IKK COMPLEX | Genes involved in IRAK1 recruits IKK complex |
| 0.5 | 11.5 | REACTOME BMAL1 CLOCK NPAS2 ACTIVATES CIRCADIAN EXPRESSION | Genes involved in BMAL1:CLOCK/NPAS2 Activates Circadian Expression |
| 0.4 | 19.9 | REACTOME GENERATION OF SECOND MESSENGER MOLECULES | Genes involved in Generation of second messenger molecules |
| 0.4 | 8.0 | REACTOME INTRINSIC PATHWAY | Genes involved in Intrinsic Pathway |
| 0.4 | 7.4 | REACTOME CREB PHOSPHORYLATION THROUGH THE ACTIVATION OF CAMKII | Genes involved in CREB phosphorylation through the activation of CaMKII |
| 0.4 | 10.1 | REACTOME NOD1 2 SIGNALING PATHWAY | Genes involved in NOD1/2 Signaling Pathway |
| 0.4 | 6.5 | REACTOME ACTIVATION OF CHAPERONES BY ATF6 ALPHA | Genes involved in Activation of Chaperones by ATF6-alpha |
| 0.4 | 9.2 | REACTOME PURINE SALVAGE | Genes involved in Purine salvage |
| 0.4 | 6.1 | REACTOME LATENT INFECTION OF HOMO SAPIENS WITH MYCOBACTERIUM TUBERCULOSIS | Genes involved in Latent infection of Homo sapiens with Mycobacterium tuberculosis |
| 0.4 | 5.3 | REACTOME ACTIVATION OF THE AP1 FAMILY OF TRANSCRIPTION FACTORS | Genes involved in Activation of the AP-1 family of transcription factors |
| 0.3 | 6.1 | REACTOME SYNTHESIS OF PE | Genes involved in Synthesis of PE |
| 0.3 | 8.1 | REACTOME CS DS DEGRADATION | Genes involved in CS/DS degradation |
| 0.3 | 3.0 | REACTOME NFKB IS ACTIVATED AND SIGNALS SURVIVAL | Genes involved in NF-kB is activated and signals survival |
| 0.2 | 6.4 | REACTOME INSULIN RECEPTOR RECYCLING | Genes involved in Insulin receptor recycling |
| 0.2 | 8.0 | REACTOME INHIBITION OF VOLTAGE GATED CA2 CHANNELS VIA GBETA GAMMA SUBUNITS | Genes involved in Inhibition of voltage gated Ca2+ channels via Gbeta/gamma subunits |
| 0.2 | 4.3 | REACTOME SYNTHESIS OF PIPS AT THE GOLGI MEMBRANE | Genes involved in Synthesis of PIPs at the Golgi membrane |
| 0.2 | 3.8 | REACTOME THROMBIN SIGNALLING THROUGH PROTEINASE ACTIVATED RECEPTORS PARS | Genes involved in Thrombin signalling through proteinase activated receptors (PARs) |
| 0.2 | 2.2 | REACTOME PRE NOTCH TRANSCRIPTION AND TRANSLATION | Genes involved in Pre-NOTCH Transcription and Translation |
| 0.2 | 1.1 | REACTOME DOWNREGULATION OF SMAD2 3 SMAD4 TRANSCRIPTIONAL ACTIVITY | Genes involved in Downregulation of SMAD2/3:SMAD4 transcriptional activity |
| 0.2 | 2.8 | REACTOME ABACAVIR TRANSPORT AND METABOLISM | Genes involved in Abacavir transport and metabolism |
| 0.2 | 2.5 | REACTOME SIGNAL REGULATORY PROTEIN SIRP FAMILY INTERACTIONS | Genes involved in Signal regulatory protein (SIRP) family interactions |
| 0.2 | 4.2 | REACTOME TGF BETA RECEPTOR SIGNALING IN EMT EPITHELIAL TO MESENCHYMAL TRANSITION | Genes involved in TGF-beta receptor signaling in EMT (epithelial to mesenchymal transition) |
| 0.2 | 7.3 | REACTOME RECYCLING PATHWAY OF L1 | Genes involved in Recycling pathway of L1 |
| 0.2 | 10.8 | REACTOME NOTCH1 INTRACELLULAR DOMAIN REGULATES TRANSCRIPTION | Genes involved in NOTCH1 Intracellular Domain Regulates Transcription |
| 0.2 | 15.1 | REACTOME TRANSCRIPTIONAL REGULATION OF WHITE ADIPOCYTE DIFFERENTIATION | Genes involved in Transcriptional Regulation of White Adipocyte Differentiation |
| 0.2 | 5.2 | REACTOME PERK REGULATED GENE EXPRESSION | Genes involved in PERK regulated gene expression |
| 0.2 | 4.9 | REACTOME REGULATION OF COMPLEMENT CASCADE | Genes involved in Regulation of Complement cascade |
| 0.2 | 4.2 | REACTOME OTHER SEMAPHORIN INTERACTIONS | Genes involved in Other semaphorin interactions |
| 0.2 | 2.2 | REACTOME CA DEPENDENT EVENTS | Genes involved in Ca-dependent events |
| 0.2 | 7.0 | REACTOME GLYCOSPHINGOLIPID METABOLISM | Genes involved in Glycosphingolipid metabolism |
| 0.2 | 7.3 | REACTOME SMAD2 SMAD3 SMAD4 HETEROTRIMER REGULATES TRANSCRIPTION | Genes involved in SMAD2/SMAD3:SMAD4 heterotrimer regulates transcription |
| 0.2 | 1.7 | REACTOME DIGESTION OF DIETARY CARBOHYDRATE | Genes involved in Digestion of dietary carbohydrate |
| 0.1 | 3.4 | REACTOME STEROID HORMONES | Genes involved in Steroid hormones |
| 0.1 | 0.9 | REACTOME POST NMDA RECEPTOR ACTIVATION EVENTS | Genes involved in Post NMDA receptor activation events |
| 0.1 | 2.8 | REACTOME IL 7 SIGNALING | Genes involved in Interleukin-7 signaling |
| 0.1 | 0.4 | REACTOME THROMBOXANE SIGNALLING THROUGH TP RECEPTOR | Genes involved in Thromboxane signalling through TP receptor |
| 0.1 | 0.8 | REACTOME TRAF6 MEDIATED INDUCTION OF TAK1 COMPLEX | Genes involved in TRAF6 mediated induction of TAK1 complex |
| 0.1 | 0.9 | REACTOME DOWNSTREAM SIGNAL TRANSDUCTION | Genes involved in Downstream signal transduction |
| 0.1 | 2.8 | REACTOME REGULATION OF IFNA SIGNALING | Genes involved in Regulation of IFNA signaling |
| 0.1 | 4.9 | REACTOME CYTOCHROME P450 ARRANGED BY SUBSTRATE TYPE | Genes involved in Cytochrome P450 - arranged by substrate type |
| 0.1 | 5.4 | REACTOME REGULATION OF MRNA STABILITY BY PROTEINS THAT BIND AU RICH ELEMENTS | Genes involved in Regulation of mRNA Stability by Proteins that Bind AU-rich Elements |
| 0.1 | 19.3 | REACTOME G ALPHA I SIGNALLING EVENTS | Genes involved in G alpha (i) signalling events |
| 0.1 | 1.4 | REACTOME REGULATION OF KIT SIGNALING | Genes involved in Regulation of KIT signaling |
| 0.1 | 1.5 | REACTOME REGULATION OF PYRUVATE DEHYDROGENASE PDH COMPLEX | Genes involved in Regulation of pyruvate dehydrogenase (PDH) complex |
| 0.1 | 0.9 | REACTOME REGULATION OF ORNITHINE DECARBOXYLASE ODC | Genes involved in Regulation of ornithine decarboxylase (ODC) |
| 0.1 | 2.0 | REACTOME PHASE1 FUNCTIONALIZATION OF COMPOUNDS | Genes involved in Phase 1 - Functionalization of compounds |
| 0.1 | 6.2 | REACTOME NUCLEAR RECEPTOR TRANSCRIPTION PATHWAY | Genes involved in Nuclear Receptor transcription pathway |
| 0.1 | 3.5 | REACTOME EFFECTS OF PIP2 HYDROLYSIS | Genes involved in Effects of PIP2 hydrolysis |
| 0.1 | 5.3 | REACTOME TRANSPORT OF INORGANIC CATIONS ANIONS AND AMINO ACIDS OLIGOPEPTIDES | Genes involved in Transport of inorganic cations/anions and amino acids/oligopeptides |
| 0.1 | 1.8 | REACTOME APOPTOTIC CLEAVAGE OF CELLULAR PROTEINS | Genes involved in Apoptotic cleavage of cellular proteins |
| 0.1 | 0.9 | REACTOME REVERSIBLE HYDRATION OF CARBON DIOXIDE | Genes involved in Reversible Hydration of Carbon Dioxide |
| 0.1 | 1.3 | REACTOME IL1 SIGNALING | Genes involved in Interleukin-1 signaling |
| 0.1 | 5.4 | REACTOME CYCLIN E ASSOCIATED EVENTS DURING G1 S TRANSITION | Genes involved in Cyclin E associated events during G1/S transition |
| 0.1 | 3.0 | REACTOME INTERFERON ALPHA BETA SIGNALING | Genes involved in Interferon alpha/beta signaling |
| 0.1 | 10.2 | REACTOME ANTIGEN PROCESSING UBIQUITINATION PROTEASOME DEGRADATION | Genes involved in Antigen processing: Ubiquitination & Proteasome degradation |
| 0.0 | 3.2 | REACTOME ANTIVIRAL MECHANISM BY IFN STIMULATED GENES | Genes involved in Antiviral mechanism by IFN-stimulated genes |
| 0.0 | 0.6 | REACTOME GLYCOPROTEIN HORMONES | Genes involved in Glycoprotein hormones |
| 0.0 | 0.7 | REACTOME BILE SALT AND ORGANIC ANION SLC TRANSPORTERS | Genes involved in Bile salt and organic anion SLC transporters |
| 0.0 | 1.0 | REACTOME REGULATION OF INSULIN LIKE GROWTH FACTOR IGF ACTIVITY BY INSULIN LIKE GROWTH FACTOR BINDING PROTEINS IGFBPS | Genes involved in Regulation of Insulin-like Growth Factor (IGF) Activity by Insulin-like Growth Factor Binding Proteins (IGFBPs) |
| 0.0 | 0.5 | REACTOME CREATION OF C4 AND C2 ACTIVATORS | Genes involved in Creation of C4 and C2 activators |
| 0.0 | 0.5 | REACTOME CHONDROITIN SULFATE BIOSYNTHESIS | Genes involved in Chondroitin sulfate biosynthesis |
| 0.0 | 1.6 | REACTOME INTERFERON SIGNALING | Genes involved in Interferon Signaling |
| 0.0 | 1.4 | REACTOME SULFUR AMINO ACID METABOLISM | Genes involved in Sulfur amino acid metabolism |
| 0.0 | 2.0 | REACTOME MEIOTIC SYNAPSIS | Genes involved in Meiotic Synapsis |
| 0.0 | 0.4 | REACTOME COMMON PATHWAY | Genes involved in Common Pathway |
| 0.0 | 2.5 | REACTOME FORMATION OF THE TERNARY COMPLEX AND SUBSEQUENTLY THE 43S COMPLEX | Genes involved in Formation of the ternary complex, and subsequently, the 43S complex |
| 0.0 | 1.1 | REACTOME CGMP EFFECTS | Genes involved in cGMP effects |
| 0.0 | 0.4 | REACTOME ACTIVATION OF NMDA RECEPTOR UPON GLUTAMATE BINDING AND POSTSYNAPTIC EVENTS | Genes involved in Activation of NMDA receptor upon glutamate binding and postsynaptic events |
| 0.0 | 0.5 | REACTOME COSTIMULATION BY THE CD28 FAMILY | Genes involved in Costimulation by the CD28 family |
| 0.0 | 1.4 | REACTOME VOLTAGE GATED POTASSIUM CHANNELS | Genes involved in Voltage gated Potassium channels |
| 0.0 | 2.3 | REACTOME AMYLOIDS | Genes involved in Amyloids |
| 0.0 | 0.4 | REACTOME GAP JUNCTION ASSEMBLY | Genes involved in Gap junction assembly |
| 0.0 | 0.4 | REACTOME PRE NOTCH PROCESSING IN GOLGI | Genes involved in Pre-NOTCH Processing in Golgi |
| 0.0 | 0.4 | REACTOME ANTIGEN ACTIVATES B CELL RECEPTOR LEADING TO GENERATION OF SECOND MESSENGERS | Genes involved in Antigen Activates B Cell Receptor Leading to Generation of Second Messengers |
| 0.0 | 0.9 | REACTOME SMOOTH MUSCLE CONTRACTION | Genes involved in Smooth Muscle Contraction |
| 0.0 | 0.4 | REACTOME PROTEOLYTIC CLEAVAGE OF SNARE COMPLEX PROTEINS | Genes involved in Proteolytic cleavage of SNARE complex proteins |