Project
GNF SymAtlas + NCI-60 cancer cell lines, comparison of cancers vs non-cancers, human (Su, 2004; Ross, 2000)
Navigation
Downloads
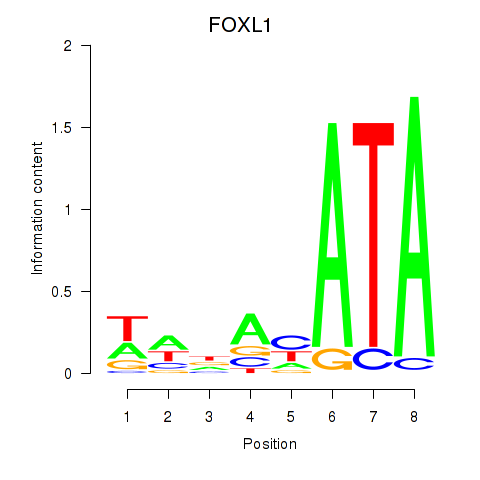
Results for FOXL1
Z-value: 0.60
Motif logo
Transcription factors associated with FOXL1
| Gene Symbol | Gene ID | Gene Info |
|---|---|---|
|
FOXL1
|
ENSG00000176678.4 | forkhead box L1 |
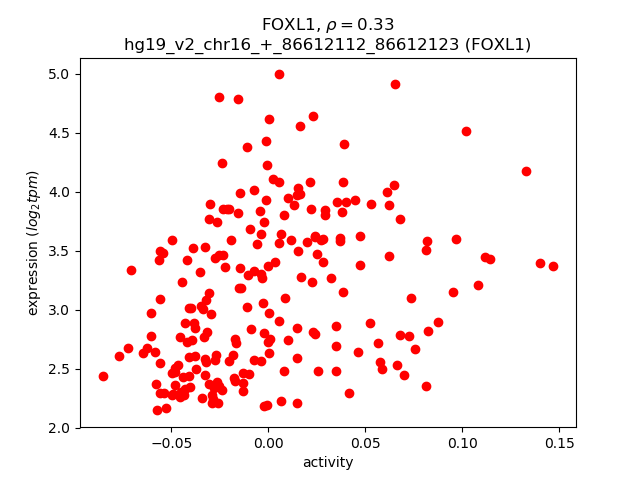
Activity-expression correlation:
| Gene | Promoter | Pearson corr. coef. | P-value | Plot |
|---|---|---|---|---|
| FOXL1 | hg19_v2_chr16_+_86612112_86612123 | 0.33 | 5.4e-07 | Click! |
Activity profile of FOXL1 motif
Sorted Z-values of FOXL1 motif
| Promoter | Log-likelihood | Transcript | Gene | Gene Info |
|---|---|---|---|---|
| chr2_-_89310012 | 41.62 |
ENST00000493819.1
|
IGKV1-9
|
immunoglobulin kappa variable 1-9 |
| chr2_+_90108504 | 35.21 |
ENST00000390271.2
|
IGKV6D-41
|
immunoglobulin kappa variable 6D-41 (non-functional) |
| chr2_-_89399845 | 34.74 |
ENST00000479981.1
|
IGKV1-16
|
immunoglobulin kappa variable 1-16 |
| chr12_+_69742121 | 34.53 |
ENST00000261267.2
ENST00000549690.1 ENST00000548839.1 |
LYZ
|
lysozyme |
| chr4_-_71532339 | 33.54 |
ENST00000254801.4
|
IGJ
|
immunoglobulin J polypeptide, linker protein for immunoglobulin alpha and mu polypeptides |
| chr2_+_90060377 | 31.18 |
ENST00000436451.2
|
IGKV6D-21
|
immunoglobulin kappa variable 6D-21 (non-functional) |
| chr2_-_89266286 | 28.07 |
ENST00000464162.1
|
IGKV1-6
|
immunoglobulin kappa variable 1-6 |
| chr2_-_89417335 | 27.86 |
ENST00000490686.1
|
IGKV1-17
|
immunoglobulin kappa variable 1-17 |
| chr12_-_91574142 | 27.35 |
ENST00000547937.1
|
DCN
|
decorin |
| chr2_-_89459813 | 26.35 |
ENST00000390256.2
|
IGKV6-21
|
immunoglobulin kappa variable 6-21 (non-functional) |
| chr12_-_91573249 | 25.84 |
ENST00000550099.1
ENST00000546391.1 ENST00000551354.1 |
DCN
|
decorin |
| chr22_+_23243156 | 24.78 |
ENST00000390323.2
|
IGLC2
|
immunoglobulin lambda constant 2 (Kern-Oz- marker) |
| chr2_-_89292422 | 23.51 |
ENST00000495489.1
|
IGKV1-8
|
immunoglobulin kappa variable 1-8 |
| chr2_+_90198535 | 21.62 |
ENST00000390276.2
|
IGKV1D-12
|
immunoglobulin kappa variable 1D-12 |
| chr3_+_8543533 | 21.38 |
ENST00000454244.1
|
LMCD1
|
LIM and cysteine-rich domains 1 |
| chr12_-_91572278 | 21.28 |
ENST00000425043.1
ENST00000420120.2 ENST00000441303.2 ENST00000456569.2 |
DCN
|
decorin |
| chr16_+_33605231 | 20.84 |
ENST00000570121.2
|
IGHV3OR16-12
|
immunoglobulin heavy variable 3/OR16-12 (non-functional) |
| chr4_-_100242549 | 19.60 |
ENST00000305046.8
ENST00000394887.3 |
ADH1B
|
alcohol dehydrogenase 1B (class I), beta polypeptide |
| chr12_-_91573316 | 16.98 |
ENST00000393155.1
|
DCN
|
decorin |
| chr5_-_41261540 | 16.42 |
ENST00000263413.3
|
C6
|
complement component 6 |
| chr18_+_74240610 | 16.21 |
ENST00000578092.1
ENST00000578613.1 ENST00000583578.1 |
LINC00908
|
long intergenic non-protein coding RNA 908 |
| chr6_+_32709119 | 15.77 |
ENST00000374940.3
|
HLA-DQA2
|
major histocompatibility complex, class II, DQ alpha 2 |
| chr9_-_95244781 | 15.48 |
ENST00000375544.3
ENST00000375543.1 ENST00000395538.3 ENST00000450139.2 |
ASPN
|
asporin |
| chr14_-_106642049 | 15.46 |
ENST00000390605.2
|
IGHV1-18
|
immunoglobulin heavy variable 1-18 |
| chr11_-_5248294 | 15.31 |
ENST00000335295.4
|
HBB
|
hemoglobin, beta |
| chr14_-_107049312 | 15.05 |
ENST00000390627.2
|
IGHV3-53
|
immunoglobulin heavy variable 3-53 |
| chr2_+_189839046 | 14.85 |
ENST00000304636.3
ENST00000317840.5 |
COL3A1
|
collagen, type III, alpha 1 |
| chr11_-_59633951 | 14.76 |
ENST00000257264.3
|
TCN1
|
transcobalamin I (vitamin B12 binding protein, R binder family) |
| chr2_+_89998789 | 14.51 |
ENST00000453166.2
|
IGKV2D-28
|
immunoglobulin kappa variable 2D-28 |
| chr2_-_89442621 | 14.49 |
ENST00000492167.1
|
IGKV3-20
|
immunoglobulin kappa variable 3-20 |
| chr12_-_91546926 | 14.27 |
ENST00000550758.1
|
DCN
|
decorin |
| chr2_+_89952792 | 14.08 |
ENST00000390265.2
|
IGKV1D-33
|
immunoglobulin kappa variable 1D-33 |
| chr3_+_8543561 | 13.46 |
ENST00000397386.3
|
LMCD1
|
LIM and cysteine-rich domains 1 |
| chr14_-_106926724 | 13.10 |
ENST00000434710.1
|
IGHV3-43
|
immunoglobulin heavy variable 3-43 |
| chr2_+_90077680 | 12.87 |
ENST00000390270.2
|
IGKV3D-20
|
immunoglobulin kappa variable 3D-20 |
| chr2_+_89975669 | 12.77 |
ENST00000474213.1
|
IGKV2D-30
|
immunoglobulin kappa variable 2D-30 |
| chr2_+_90121477 | 12.73 |
ENST00000483379.1
|
IGKV1D-17
|
immunoglobulin kappa variable 1D-17 |
| chr2_-_89340242 | 12.68 |
ENST00000480492.1
|
IGKV1-12
|
immunoglobulin kappa variable 1-12 |
| chr2_-_89521942 | 12.60 |
ENST00000482769.1
|
IGKV2-28
|
immunoglobulin kappa variable 2-28 |
| chr2_-_89630186 | 12.23 |
ENST00000390264.2
|
IGKV2-40
|
immunoglobulin kappa variable 2-40 |
| chr2_-_89513402 | 12.15 |
ENST00000498435.1
|
IGKV1-27
|
immunoglobulin kappa variable 1-27 |
| chr12_-_15114603 | 12.11 |
ENST00000228945.4
|
ARHGDIB
|
Rho GDP dissociation inhibitor (GDI) beta |
| chr2_+_90248739 | 11.97 |
ENST00000468879.1
|
IGKV1D-43
|
immunoglobulin kappa variable 1D-43 |
| chr7_+_80275953 | 11.84 |
ENST00000538969.1
ENST00000544133.1 ENST00000433696.2 |
CD36
|
CD36 molecule (thrombospondin receptor) |
| chr14_-_106406090 | 11.81 |
ENST00000390593.2
|
IGHV6-1
|
immunoglobulin heavy variable 6-1 |
| chr2_-_89619904 | 11.57 |
ENST00000498574.1
|
IGKV1-39
|
immunoglobulin kappa variable 1-39 (gene/pseudogene) |
| chr12_-_91573132 | 11.49 |
ENST00000550563.1
ENST00000546370.1 |
DCN
|
decorin |
| chr12_-_15114492 | 11.47 |
ENST00000541546.1
|
ARHGDIB
|
Rho GDP dissociation inhibitor (GDI) beta |
| chr3_+_151531810 | 11.29 |
ENST00000232892.7
|
AADAC
|
arylacetamide deacetylase |
| chr14_-_90798418 | 11.08 |
ENST00000354366.3
|
NRDE2
|
NRDE-2, necessary for RNA interference, domain containing |
| chr14_-_106725723 | 11.02 |
ENST00000390609.2
|
IGHV3-23
|
immunoglobulin heavy variable 3-23 |
| chr14_-_106692191 | 10.91 |
ENST00000390607.2
|
IGHV3-21
|
immunoglobulin heavy variable 3-21 |
| chr10_-_69597810 | 10.80 |
ENST00000483798.2
|
DNAJC12
|
DnaJ (Hsp40) homolog, subfamily C, member 12 |
| chr8_-_82395461 | 10.68 |
ENST00000256104.4
|
FABP4
|
fatty acid binding protein 4, adipocyte |
| chr12_-_11002063 | 10.62 |
ENST00000544994.1
ENST00000228811.4 ENST00000540107.1 |
PRR4
|
proline rich 4 (lacrimal) |
| chr17_-_2996290 | 10.28 |
ENST00000331459.1
|
OR1D2
|
olfactory receptor, family 1, subfamily D, member 2 |
| chr13_-_38172863 | 10.19 |
ENST00000541481.1
ENST00000379743.4 ENST00000379742.4 ENST00000379749.4 ENST00000541179.1 ENST00000379747.4 |
POSTN
|
periostin, osteoblast specific factor |
| chr7_+_80275752 | 10.08 |
ENST00000419819.2
|
CD36
|
CD36 molecule (thrombospondin receptor) |
| chr15_-_45670924 | 10.04 |
ENST00000396659.3
|
GATM
|
glycine amidinotransferase (L-arginine:glycine amidinotransferase) |
| chr2_+_89184868 | 10.03 |
ENST00000390243.2
|
IGKV4-1
|
immunoglobulin kappa variable 4-1 |
| chr6_-_32498046 | 9.93 |
ENST00000374975.3
|
HLA-DRB5
|
major histocompatibility complex, class II, DR beta 5 |
| chr2_+_90259593 | 9.87 |
ENST00000471857.1
|
IGKV1D-8
|
immunoglobulin kappa variable 1D-8 |
| chr12_-_120763739 | 9.47 |
ENST00000549767.1
|
PLA2G1B
|
phospholipase A2, group IB (pancreas) |
| chr10_-_98031265 | 9.39 |
ENST00000224337.5
ENST00000371176.2 |
BLNK
|
B-cell linker |
| chr1_-_182921119 | 9.27 |
ENST00000423786.1
|
SHCBP1L
|
SHC SH2-domain binding protein 1-like |
| chr22_+_23046750 | 9.26 |
ENST00000390307.2
|
IGLV3-22
|
immunoglobulin lambda variable 3-22 (gene/pseudogene) |
| chr15_-_20193370 | 9.25 |
ENST00000558565.2
|
IGHV3OR15-7
|
immunoglobulin heavy variable 3/OR15-7 (pseudogene) |
| chr4_-_186877806 | 9.15 |
ENST00000355634.5
|
SORBS2
|
sorbin and SH3 domain containing 2 |
| chr12_-_15038779 | 9.02 |
ENST00000228938.5
ENST00000539261.1 |
MGP
|
matrix Gla protein |
| chr14_-_107078851 | 9.01 |
ENST00000390628.2
|
IGHV1-58
|
immunoglobulin heavy variable 1-58 |
| chr1_-_36235559 | 8.98 |
ENST00000251195.5
|
CLSPN
|
claspin |
| chr3_+_189507460 | 8.96 |
ENST00000434928.1
|
TP63
|
tumor protein p63 |
| chr2_+_89999259 | 8.83 |
ENST00000558026.1
|
IGKV2D-28
|
immunoglobulin kappa variable 2D-28 |
| chr14_-_106963409 | 8.82 |
ENST00000390621.2
|
IGHV1-45
|
immunoglobulin heavy variable 1-45 |
| chr12_-_11548496 | 8.80 |
ENST00000389362.4
ENST00000565533.1 ENST00000546254.1 |
PRB2
PRB1
|
proline-rich protein BstNI subfamily 2 proline-rich protein BstNI subfamily 1 |
| chr12_-_11508520 | 8.77 |
ENST00000545626.1
ENST00000500254.2 |
PRB1
|
proline-rich protein BstNI subfamily 1 |
| chr4_-_70826725 | 8.76 |
ENST00000353151.3
|
CSN2
|
casein beta |
| chr4_+_88754069 | 8.48 |
ENST00000395102.4
ENST00000497649.2 |
MEPE
|
matrix extracellular phosphoglycoprotein |
| chr1_+_196621002 | 8.47 |
ENST00000367429.4
ENST00000439155.2 |
CFH
|
complement factor H |
| chr9_-_35619539 | 8.45 |
ENST00000396757.1
|
CD72
|
CD72 molecule |
| chr2_-_89247338 | 8.44 |
ENST00000496168.1
|
IGKV1-5
|
immunoglobulin kappa variable 1-5 |
| chr21_-_43735628 | 8.37 |
ENST00000291525.10
ENST00000518498.1 |
TFF3
|
trefoil factor 3 (intestinal) |
| chr4_+_106631966 | 8.32 |
ENST00000360505.5
ENST00000510865.1 ENST00000509336.1 |
GSTCD
|
glutathione S-transferase, C-terminal domain containing |
| chr2_-_89545079 | 8.25 |
ENST00000468494.1
|
IGKV2-30
|
immunoglobulin kappa variable 2-30 |
| chr1_+_104293028 | 8.20 |
ENST00000370079.3
|
AMY1C
|
amylase, alpha 1C (salivary) |
| chr22_+_22681656 | 8.14 |
ENST00000390291.2
|
IGLV1-50
|
immunoglobulin lambda variable 1-50 (non-functional) |
| chr5_-_147211226 | 8.01 |
ENST00000296695.5
|
SPINK1
|
serine peptidase inhibitor, Kazal type 1 |
| chr7_-_8302207 | 7.89 |
ENST00000407906.1
|
ICA1
|
islet cell autoantigen 1, 69kDa |
| chr2_+_90153696 | 7.88 |
ENST00000417279.2
|
IGKV3D-15
|
immunoglobulin kappa variable 3D-15 (gene/pseudogene) |
| chr2_-_89597542 | 7.86 |
ENST00000465170.1
|
IGKV1-37
|
immunoglobulin kappa variable 1-37 (non-functional) |
| chr2_-_163008903 | 7.78 |
ENST00000418842.2
ENST00000375497.3 |
GCG
|
glucagon |
| chr14_-_107283278 | 7.77 |
ENST00000390639.2
|
IGHV7-81
|
immunoglobulin heavy variable 7-81 (non-functional) |
| chr3_-_195310802 | 7.73 |
ENST00000421243.1
ENST00000453131.1 |
APOD
|
apolipoprotein D |
| chr4_+_71296204 | 7.68 |
ENST00000413702.1
|
MUC7
|
mucin 7, secreted |
| chr6_-_32908792 | 7.65 |
ENST00000418107.2
|
HLA-DMB
|
major histocompatibility complex, class II, DM beta |
| chr4_+_74269956 | 7.38 |
ENST00000295897.4
ENST00000415165.2 ENST00000503124.1 ENST00000509063.1 ENST00000401494.3 |
ALB
|
albumin |
| chr1_+_196621156 | 7.29 |
ENST00000359637.2
|
CFH
|
complement factor H |
| chr11_+_114168085 | 7.27 |
ENST00000541754.1
|
NNMT
|
nicotinamide N-methyltransferase |
| chr2_-_89568263 | 7.12 |
ENST00000473726.1
|
IGKV1-33
|
immunoglobulin kappa variable 1-33 |
| chr4_-_84035868 | 7.03 |
ENST00000426923.2
ENST00000509973.1 |
PLAC8
|
placenta-specific 8 |
| chr4_-_84035905 | 6.97 |
ENST00000311507.4
|
PLAC8
|
placenta-specific 8 |
| chr14_-_107219365 | 6.91 |
ENST00000424969.2
|
IGHV3-74
|
immunoglobulin heavy variable 3-74 |
| chr11_-_85376121 | 6.88 |
ENST00000527447.1
|
CREBZF
|
CREB/ATF bZIP transcription factor |
| chr10_-_98031310 | 6.86 |
ENST00000427367.2
ENST00000413476.2 |
BLNK
|
B-cell linker |
| chr11_-_5255861 | 6.79 |
ENST00000380299.3
|
HBD
|
hemoglobin, delta |
| chr16_+_32077386 | 6.74 |
ENST00000354689.6
|
IGHV3OR16-9
|
immunoglobulin heavy variable 3/OR16-9 (non-functional) |
| chr12_-_7656357 | 6.72 |
ENST00000396620.3
ENST00000432237.2 ENST00000359156.4 |
CD163
|
CD163 molecule |
| chr16_+_72090053 | 6.71 |
ENST00000576168.2
ENST00000567185.3 ENST00000567612.2 |
HP
|
haptoglobin |
| chr8_+_24151553 | 6.70 |
ENST00000265769.4
ENST00000540823.1 ENST00000397649.3 |
ADAM28
|
ADAM metallopeptidase domain 28 |
| chr5_-_41213607 | 6.70 |
ENST00000337836.5
ENST00000433294.1 |
C6
|
complement component 6 |
| chr17_-_42327236 | 6.58 |
ENST00000399246.2
|
AC003102.1
|
AC003102.1 |
| chr14_-_106471723 | 6.55 |
ENST00000390595.2
|
IGHV1-3
|
immunoglobulin heavy variable 1-3 |
| chr6_-_27880174 | 6.53 |
ENST00000303324.2
|
OR2B2
|
olfactory receptor, family 2, subfamily B, member 2 |
| chr14_-_106478603 | 6.51 |
ENST00000390596.2
|
IGHV4-4
|
immunoglobulin heavy variable 4-4 |
| chr18_+_29027696 | 6.46 |
ENST00000257189.4
|
DSG3
|
desmoglein 3 |
| chr4_+_74275057 | 6.46 |
ENST00000511370.1
|
ALB
|
albumin |
| chr22_+_23154239 | 6.37 |
ENST00000390315.2
|
IGLV3-10
|
immunoglobulin lambda variable 3-10 |
| chr11_+_49050504 | 6.33 |
ENST00000332682.7
|
TRIM49B
|
tripartite motif containing 49B |
| chr12_-_15104040 | 6.29 |
ENST00000541644.1
ENST00000545895.1 |
ARHGDIB
|
Rho GDP dissociation inhibitor (GDI) beta |
| chr2_+_114163945 | 6.17 |
ENST00000453673.3
|
IGKV1OR2-108
|
immunoglobulin kappa variable 1/OR2-108 (non-functional) |
| chr6_-_32908765 | 6.14 |
ENST00000416244.2
|
HLA-DMB
|
major histocompatibility complex, class II, DM beta |
| chr14_-_106573756 | 6.13 |
ENST00000390601.2
|
IGHV3-11
|
immunoglobulin heavy variable 3-11 (gene/pseudogene) |
| chr8_-_86253888 | 6.11 |
ENST00000522389.1
ENST00000432364.2 ENST00000517618.1 |
CA1
|
carbonic anhydrase I |
| chr17_-_64216748 | 6.10 |
ENST00000585162.1
|
APOH
|
apolipoprotein H (beta-2-glycoprotein I) |
| chr2_-_99224915 | 6.09 |
ENST00000328709.3
ENST00000409997.1 |
COA5
|
cytochrome c oxidase assembly factor 5 |
| chr8_-_86290333 | 5.98 |
ENST00000521846.1
ENST00000523022.1 ENST00000524324.1 ENST00000519991.1 ENST00000520663.1 ENST00000517590.1 ENST00000522579.1 ENST00000522814.1 ENST00000522662.1 ENST00000523858.1 ENST00000519129.1 |
CA1
|
carbonic anhydrase I |
| chr14_+_50291993 | 5.94 |
ENST00000595378.1
|
AL627171.2
|
HCG1786899; PRO2610; Uncharacterized protein |
| chr6_-_39902185 | 5.92 |
ENST00000373195.3
ENST00000308559.7 ENST00000373188.2 |
MOCS1
|
molybdenum cofactor synthesis 1 |
| chr10_-_71169031 | 5.89 |
ENST00000373307.1
|
TACR2
|
tachykinin receptor 2 |
| chr1_+_160709055 | 5.85 |
ENST00000368043.3
ENST00000368042.3 ENST00000458602.2 ENST00000458104.2 |
SLAMF7
|
SLAM family member 7 |
| chr7_-_80551671 | 5.81 |
ENST00000419255.2
ENST00000544525.1 |
SEMA3C
|
sema domain, immunoglobulin domain (Ig), short basic domain, secreted, (semaphorin) 3C |
| chr1_+_117297007 | 5.75 |
ENST00000369478.3
ENST00000369477.1 |
CD2
|
CD2 molecule |
| chr12_-_11463353 | 5.71 |
ENST00000279575.1
ENST00000535904.1 ENST00000445719.2 |
PRB4
|
proline-rich protein BstNI subfamily 4 |
| chr10_+_124320195 | 5.66 |
ENST00000359586.6
|
DMBT1
|
deleted in malignant brain tumors 1 |
| chr4_+_155484155 | 5.64 |
ENST00000509493.1
|
FGB
|
fibrinogen beta chain |
| chr1_+_21880560 | 5.64 |
ENST00000425315.2
|
ALPL
|
alkaline phosphatase, liver/bone/kidney |
| chr1_+_207627575 | 5.63 |
ENST00000367058.3
ENST00000367057.3 ENST00000367059.3 |
CR2
|
complement component (3d/Epstein Barr virus) receptor 2 |
| chr1_+_152974218 | 5.62 |
ENST00000331860.3
ENST00000443178.1 ENST00000295367.4 |
SPRR3
|
small proline-rich protein 3 |
| chr13_-_47012325 | 5.62 |
ENST00000409879.2
|
KIAA0226L
|
KIAA0226-like |
| chr18_-_52989217 | 5.61 |
ENST00000570287.2
|
TCF4
|
transcription factor 4 |
| chr1_-_161277210 | 5.60 |
ENST00000491222.2
|
MPZ
|
myelin protein zero |
| chr2_+_201450591 | 5.57 |
ENST00000374700.2
|
AOX1
|
aldehyde oxidase 1 |
| chr22_+_22936998 | 5.57 |
ENST00000390303.2
|
IGLV3-32
|
immunoglobulin lambda variable 3-32 (non-functional) |
| chr4_-_100212132 | 5.56 |
ENST00000209668.2
|
ADH1A
|
alcohol dehydrogenase 1A (class I), alpha polypeptide |
| chr22_+_23089870 | 5.56 |
ENST00000390311.2
|
IGLV3-16
|
immunoglobulin lambda variable 3-16 |
| chr4_+_68424434 | 5.55 |
ENST00000265404.2
ENST00000396225.1 |
STAP1
|
signal transducing adaptor family member 1 |
| chr11_+_55029628 | 5.55 |
ENST00000417545.2
|
TRIM48
|
tripartite motif containing 48 |
| chrX_+_57618269 | 5.55 |
ENST00000374888.1
|
ZXDB
|
zinc finger, X-linked, duplicated B |
| chr14_-_106967788 | 5.53 |
ENST00000390622.2
|
IGHV1-46
|
immunoglobulin heavy variable 1-46 |
| chr13_+_73629107 | 5.48 |
ENST00000539231.1
|
KLF5
|
Kruppel-like factor 5 (intestinal) |
| chr16_+_32063311 | 5.47 |
ENST00000426099.1
|
AC142381.1
|
AC142381.1 |
| chr19_-_19302931 | 5.45 |
ENST00000444486.3
ENST00000514819.3 ENST00000585679.1 ENST00000162023.5 |
MEF2BNB-MEF2B
MEF2BNB
MEF2B
|
MEF2BNB-MEF2B readthrough MEF2B neighbor myocyte enhancer factor 2B |
| chr2_-_206950781 | 5.44 |
ENST00000403263.1
|
INO80D
|
INO80 complex subunit D |
| chr16_+_33006369 | 5.42 |
ENST00000425181.3
|
IGHV3OR16-10
|
immunoglobulin heavy variable 3/OR16-10 (non-functional) |
| chr3_+_189349162 | 5.38 |
ENST00000264731.3
ENST00000382063.4 ENST00000418709.2 ENST00000320472.5 ENST00000392460.3 ENST00000440651.2 |
TP63
|
tumor protein p63 |
| chr19_-_48389651 | 5.27 |
ENST00000222002.3
|
SULT2A1
|
sulfotransferase family, cytosolic, 2A, dehydroepiandrosterone (DHEA)-preferring, member 1 |
| chr13_+_111855414 | 5.26 |
ENST00000375737.5
|
ARHGEF7
|
Rho guanine nucleotide exchange factor (GEF) 7 |
| chr1_+_152975488 | 5.26 |
ENST00000542696.1
|
SPRR3
|
small proline-rich protein 3 |
| chr5_-_140013275 | 5.26 |
ENST00000512545.1
ENST00000302014.6 ENST00000401743.2 |
CD14
|
CD14 molecule |
| chr14_-_106816253 | 5.25 |
ENST00000390615.2
|
IGHV3-33
|
immunoglobulin heavy variable 3-33 |
| chr17_-_37844267 | 5.23 |
ENST00000579146.1
ENST00000378011.4 ENST00000429199.2 ENST00000300658.4 |
PGAP3
|
post-GPI attachment to proteins 3 |
| chr10_+_118305435 | 5.23 |
ENST00000369221.2
|
PNLIP
|
pancreatic lipase |
| chr18_+_61445007 | 5.22 |
ENST00000447428.1
ENST00000546027.1 |
SERPINB7
|
serpin peptidase inhibitor, clade B (ovalbumin), member 7 |
| chr1_+_89829610 | 5.19 |
ENST00000370456.4
ENST00000535065.1 |
GBP6
|
guanylate binding protein family, member 6 |
| chr9_-_21351377 | 5.17 |
ENST00000380210.1
|
IFNA6
|
interferon, alpha 6 |
| chr4_+_71248795 | 5.16 |
ENST00000304915.3
|
SMR3B
|
submaxillary gland androgen regulated protein 3B |
| chr20_-_34042558 | 5.16 |
ENST00000374372.1
|
GDF5
|
growth differentiation factor 5 |
| chr4_+_96012614 | 5.14 |
ENST00000264568.4
|
BMPR1B
|
bone morphogenetic protein receptor, type IB |
| chr4_+_90823130 | 5.09 |
ENST00000508372.1
|
MMRN1
|
multimerin 1 |
| chr7_+_134528635 | 5.05 |
ENST00000445569.2
|
CALD1
|
caldesmon 1 |
| chr19_+_36486078 | 4.99 |
ENST00000378887.2
|
SDHAF1
|
succinate dehydrogenase complex assembly factor 1 |
| chr1_-_163172625 | 4.93 |
ENST00000527988.1
ENST00000531476.1 ENST00000530507.1 |
RGS5
|
regulator of G-protein signaling 5 |
| chr11_+_33902189 | 4.92 |
ENST00000330381.2
|
AC132216.1
|
HCG1785179; PRO1787; Uncharacterized protein |
| chr10_-_75415825 | 4.92 |
ENST00000394810.2
|
SYNPO2L
|
synaptopodin 2-like |
| chr4_+_71226468 | 4.92 |
ENST00000226460.4
|
SMR3A
|
submaxillary gland androgen regulated protein 3A |
| chr14_-_106845789 | 4.91 |
ENST00000390617.2
|
IGHV3-35
|
immunoglobulin heavy variable 3-35 (non-functional) |
| chr11_-_13517565 | 4.89 |
ENST00000282091.1
ENST00000529816.1 |
PTH
|
parathyroid hormone |
| chr19_+_9296279 | 4.89 |
ENST00000344248.2
|
OR7D2
|
olfactory receptor, family 7, subfamily D, member 2 |
| chr13_+_96085847 | 4.88 |
ENST00000376873.3
|
CLDN10
|
claudin 10 |
| chr6_-_132272504 | 4.84 |
ENST00000367976.3
|
CTGF
|
connective tissue growth factor |
| chr3_+_148545586 | 4.80 |
ENST00000282957.4
ENST00000468341.1 |
CPB1
|
carboxypeptidase B1 (tissue) |
| chr4_+_70861647 | 4.78 |
ENST00000246895.4
ENST00000381060.2 |
STATH
|
statherin |
| chr5_-_43412418 | 4.76 |
ENST00000537013.1
ENST00000361115.4 |
CCL28
|
chemokine (C-C motif) ligand 28 |
| chr3_-_194072019 | 4.76 |
ENST00000429275.1
ENST00000323830.3 |
CPN2
|
carboxypeptidase N, polypeptide 2 |
| chr17_-_59668550 | 4.76 |
ENST00000521764.1
|
NACA2
|
nascent polypeptide-associated complex alpha subunit 2 |
| chr1_+_207226574 | 4.75 |
ENST00000367080.3
ENST00000367079.2 |
PFKFB2
|
6-phosphofructo-2-kinase/fructose-2,6-biphosphatase 2 |
| chr14_-_106781017 | 4.71 |
ENST00000390612.2
|
IGHV4-28
|
immunoglobulin heavy variable 4-28 |
| chr3_+_138066539 | 4.69 |
ENST00000289104.4
|
MRAS
|
muscle RAS oncogene homolog |
| chr5_-_86534822 | 4.68 |
ENST00000445770.2
|
AC008394.1
|
Uncharacterized protein |
| chr4_+_88754113 | 4.67 |
ENST00000560249.1
ENST00000540395.1 ENST00000511670.1 ENST00000361056.3 |
MEPE
|
matrix extracellular phosphoglycoprotein |
| chr14_-_106668095 | 4.65 |
ENST00000390606.2
|
IGHV3-20
|
immunoglobulin heavy variable 3-20 |
| chr7_-_8302164 | 4.65 |
ENST00000447326.1
ENST00000406470.2 |
ICA1
|
islet cell autoantigen 1, 69kDa |
| chr14_-_106622419 | 4.63 |
ENST00000390604.2
|
IGHV3-16
|
immunoglobulin heavy variable 3-16 (non-functional) |
| chr9_-_97402413 | 4.61 |
ENST00000414122.1
|
FBP1
|
fructose-1,6-bisphosphatase 1 |
| chr1_+_156698708 | 4.59 |
ENST00000519086.1
|
RRNAD1
|
ribosomal RNA adenine dimethylase domain containing 1 |
| chr2_+_90458201 | 4.58 |
ENST00000603238.1
|
CH17-132F21.1
|
Uncharacterized protein |
| chr9_-_21335240 | 4.52 |
ENST00000537938.1
|
KLHL9
|
kelch-like family member 9 |
| chr17_-_74449252 | 4.50 |
ENST00000319380.7
|
UBE2O
|
ubiquitin-conjugating enzyme E2O |
| chr8_-_17752912 | 4.49 |
ENST00000398054.1
ENST00000381840.2 |
FGL1
|
fibrinogen-like 1 |
| chr10_-_5046042 | 4.46 |
ENST00000421196.3
ENST00000455190.1 |
AKR1C2
|
aldo-keto reductase family 1, member C2 |
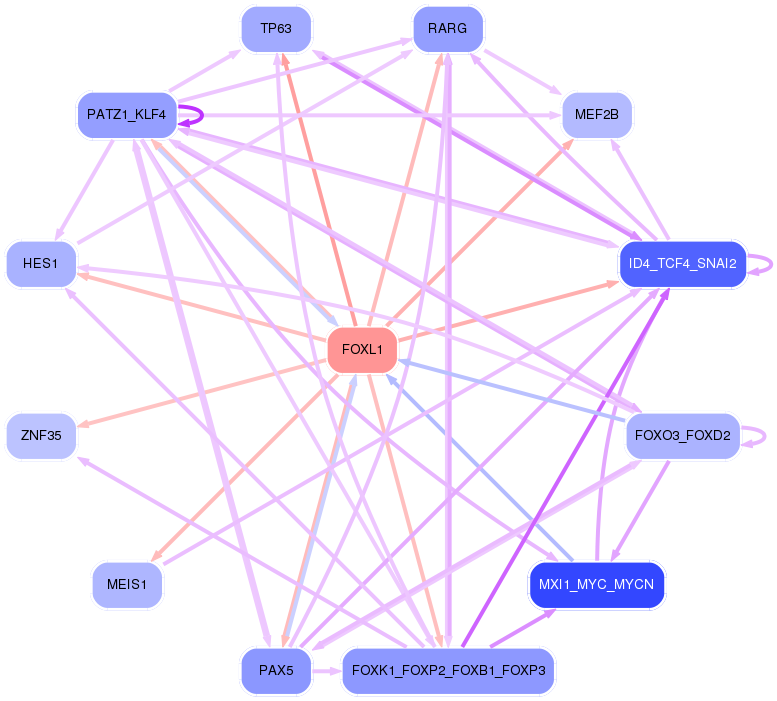
Network of associatons between targets according to the STRING database.

First level regulatory network of FOXL1
Gene Ontology Analysis
Gene overrepresentation in biological_process category:
| Log-likelihood per target | Total log-likelihood | Term | Description |
|---|---|---|---|
| 9.9 | 119.2 | GO:1900747 | negative regulation of vascular endothelial growth factor signaling pathway(GO:1900747) |
| 7.5 | 29.9 | GO:0071461 | cellular response to redox state(GO:0071461) |
| 6.9 | 34.5 | GO:0016998 | cell wall macromolecule catabolic process(GO:0016998) |
| 5.8 | 23.1 | GO:0001970 | positive regulation of activation of membrane attack complex(GO:0001970) |
| 5.2 | 15.5 | GO:0070171 | negative regulation of tooth mineralization(GO:0070171) |
| 4.6 | 13.8 | GO:0019836 | hemolysis by symbiont of host erythrocytes(GO:0019836) hemolysis in other organism(GO:0044179) hemolysis in other organism involved in symbiotic interaction(GO:0052331) |
| 4.6 | 13.8 | GO:2001190 | positive regulation of T cell activation via T cell receptor contact with antigen bound to MHC molecule on antigen presenting cell(GO:2001190) |
| 4.4 | 17.7 | GO:0007499 | ectoderm and mesoderm interaction(GO:0007499) |
| 4.0 | 27.7 | GO:2000332 | lipoprotein particle mediated signaling(GO:0055095) low-density lipoprotein particle mediated signaling(GO:0055096) blood microparticle formation(GO:0072564) regulation of blood microparticle formation(GO:2000332) positive regulation of blood microparticle formation(GO:2000334) |
| 3.8 | 15.3 | GO:0030185 | nitric oxide transport(GO:0030185) |
| 3.4 | 10.2 | GO:1990523 | bone regeneration(GO:1990523) |
| 3.4 | 10.1 | GO:2000296 | negative regulation of hydrogen peroxide catabolic process(GO:2000296) |
| 3.3 | 16.4 | GO:1900004 | negative regulation of serine-type endopeptidase activity(GO:1900004) negative regulation of serine-type peptidase activity(GO:1902572) |
| 3.1 | 3.1 | GO:0086092 | regulation of the force of heart contraction by cardiac conduction(GO:0086092) |
| 3.1 | 443.5 | GO:0006958 | complement activation, classical pathway(GO:0006958) |
| 3.0 | 12.0 | GO:0044240 | multicellular organism lipid catabolic process(GO:0044240) |
| 2.9 | 8.8 | GO:1903487 | regulation of lactation(GO:1903487) |
| 2.8 | 8.4 | GO:0014057 | positive regulation of acetylcholine secretion, neurotransmission(GO:0014057) |
| 2.8 | 5.6 | GO:0006145 | purine nucleobase catabolic process(GO:0006145) |
| 2.8 | 5.6 | GO:0010760 | negative regulation of macrophage chemotaxis(GO:0010760) |
| 2.7 | 26.6 | GO:0006069 | ethanol oxidation(GO:0006069) |
| 2.6 | 7.8 | GO:0035948 | positive regulation of gluconeogenesis by positive regulation of transcription from RNA polymerase II promoter(GO:0035948) |
| 2.6 | 7.7 | GO:2000097 | regulation of smooth muscle cell-matrix adhesion(GO:2000097) |
| 2.3 | 6.9 | GO:0044278 | cell wall disruption in other organism(GO:0044278) |
| 2.2 | 13.0 | GO:0034196 | acylglycerol transport(GO:0034196) triglyceride transport(GO:0034197) |
| 1.9 | 5.8 | GO:0030885 | regulation of myeloid dendritic cell activation(GO:0030885) |
| 1.9 | 5.7 | GO:0071934 | thiamine transport(GO:0015888) thiamine transmembrane transport(GO:0071934) |
| 1.9 | 5.6 | GO:0038124 | toll-like receptor TLR6:TLR2 signaling pathway(GO:0038124) response to diacyl bacterial lipopeptide(GO:0071724) cellular response to diacyl bacterial lipopeptide(GO:0071726) |
| 1.9 | 5.6 | GO:0071529 | cementum mineralization(GO:0071529) |
| 1.9 | 14.8 | GO:0060414 | aorta smooth muscle tissue morphogenesis(GO:0060414) |
| 1.8 | 9.0 | GO:0033314 | mitotic DNA replication checkpoint(GO:0033314) |
| 1.8 | 17.8 | GO:0043152 | induction of bacterial agglutination(GO:0043152) |
| 1.7 | 5.2 | GO:0036378 | calcitriol biosynthetic process from calciol(GO:0036378) |
| 1.7 | 5.2 | GO:0043932 | ossification involved in bone remodeling(GO:0043932) |
| 1.7 | 10.3 | GO:0045903 | positive regulation of translational fidelity(GO:0045903) |
| 1.6 | 19.6 | GO:0006957 | complement activation, alternative pathway(GO:0006957) |
| 1.6 | 4.9 | GO:1900158 | positive regulation of osteoclast proliferation(GO:0090290) negative regulation of bone mineralization involved in bone maturation(GO:1900158) |
| 1.6 | 4.8 | GO:0070318 | positive regulation of G0 to G1 transition(GO:0070318) |
| 1.6 | 6.3 | GO:0090362 | positive regulation of platelet-derived growth factor production(GO:0090362) |
| 1.6 | 3.1 | GO:0002361 | CD4-positive, CD25-positive, alpha-beta regulatory T cell differentiation(GO:0002361) |
| 1.5 | 262.7 | GO:0002377 | immunoglobulin production(GO:0002377) |
| 1.5 | 40.2 | GO:0070886 | positive regulation of calcineurin-NFAT signaling cascade(GO:0070886) |
| 1.5 | 14.8 | GO:0015889 | cobalamin transport(GO:0015889) |
| 1.5 | 4.4 | GO:0045897 | positive regulation of transcription during mitosis(GO:0045897) |
| 1.4 | 4.2 | GO:0061534 | gamma-aminobutyric acid secretion, neurotransmission(GO:0061534) |
| 1.4 | 7.0 | GO:0070384 | growth plate cartilage chondrocyte growth(GO:0003430) growth plate cartilage chondrocyte development(GO:0003431) Harderian gland development(GO:0070384) |
| 1.4 | 4.2 | GO:1990168 | protein K33-linked deubiquitination(GO:1990168) |
| 1.4 | 4.1 | GO:0051292 | nuclear pore organization(GO:0006999) nuclear pore complex assembly(GO:0051292) |
| 1.4 | 4.1 | GO:0002581 | negative regulation of antigen processing and presentation of peptide or polysaccharide antigen via MHC class II(GO:0002581) |
| 1.3 | 4.0 | GO:0016095 | polyprenol catabolic process(GO:0016095) |
| 1.3 | 3.8 | GO:0060054 | positive regulation of epithelial cell proliferation involved in wound healing(GO:0060054) |
| 1.3 | 7.6 | GO:0016554 | cytidine to uridine editing(GO:0016554) |
| 1.3 | 11.3 | GO:0010898 | positive regulation of triglyceride catabolic process(GO:0010898) |
| 1.2 | 2.5 | GO:0032755 | positive regulation of interleukin-6 production(GO:0032755) |
| 1.2 | 1.2 | GO:0035378 | carbon dioxide transmembrane transport(GO:0035378) |
| 1.2 | 6.1 | GO:0016098 | monoterpenoid metabolic process(GO:0016098) |
| 1.2 | 2.4 | GO:0035166 | post-embryonic hemopoiesis(GO:0035166) |
| 1.2 | 2.4 | GO:0005988 | lactose metabolic process(GO:0005988) lactose biosynthetic process(GO:0005989) |
| 1.2 | 4.6 | GO:0046351 | sucrose biosynthetic process(GO:0005986) disaccharide biosynthetic process(GO:0046351) |
| 1.1 | 6.9 | GO:0033133 | fructose 2,6-bisphosphate metabolic process(GO:0006003) positive regulation of glucokinase activity(GO:0033133) positive regulation of hexokinase activity(GO:1903301) |
| 1.1 | 4.5 | GO:0061009 | common bile duct development(GO:0061009) |
| 1.1 | 4.3 | GO:0003330 | regulation of extracellular matrix constituent secretion(GO:0003330) positive regulation of extracellular matrix constituent secretion(GO:0003331) |
| 1.1 | 4.2 | GO:0046671 | negative regulation of cellular pH reduction(GO:0032848) CD8-positive, alpha-beta T cell lineage commitment(GO:0043375) negative regulation of retinal cell programmed cell death(GO:0046671) |
| 1.0 | 5.1 | GO:1902731 | ovarian cumulus expansion(GO:0001550) fused antrum stage(GO:0048165) negative regulation of chondrocyte proliferation(GO:1902731) |
| 1.0 | 3.1 | GO:0008298 | intracellular mRNA localization(GO:0008298) |
| 1.0 | 5.8 | GO:0003350 | pulmonary myocardium development(GO:0003350) |
| 1.0 | 2.9 | GO:0072275 | metanephric glomerulus morphogenesis(GO:0072275) metanephric glomerulus vasculature morphogenesis(GO:0072276) metanephric glomerular capillary formation(GO:0072277) |
| 1.0 | 4.8 | GO:1903237 | negative regulation of leukocyte tethering or rolling(GO:1903237) |
| 0.9 | 17.9 | GO:0030502 | negative regulation of bone mineralization(GO:0030502) |
| 0.9 | 2.8 | GO:0030718 | germ-line stem cell population maintenance(GO:0030718) |
| 0.9 | 19.4 | GO:0098743 | cell aggregation(GO:0098743) |
| 0.9 | 8.3 | GO:0086024 | adrenergic receptor signaling pathway involved in positive regulation of heart rate(GO:0086024) |
| 0.9 | 10.0 | GO:0006600 | creatine metabolic process(GO:0006600) |
| 0.9 | 3.6 | GO:0002933 | lipid hydroxylation(GO:0002933) |
| 0.9 | 10.7 | GO:0071285 | cellular response to lithium ion(GO:0071285) |
| 0.9 | 2.7 | GO:0030264 | nuclear fragmentation involved in apoptotic nuclear change(GO:0030264) positive regulation of cardiac vascular smooth muscle cell differentiation(GO:2000724) |
| 0.9 | 9.6 | GO:0042905 | 9-cis-retinoic acid biosynthetic process(GO:0042904) 9-cis-retinoic acid metabolic process(GO:0042905) |
| 0.9 | 3.5 | GO:0002678 | positive regulation of chronic inflammatory response(GO:0002678) swimming behavior(GO:0036269) |
| 0.8 | 14.0 | GO:0040015 | negative regulation of multicellular organism growth(GO:0040015) |
| 0.8 | 8.1 | GO:0043950 | positive regulation of cAMP-mediated signaling(GO:0043950) |
| 0.8 | 7.2 | GO:0030299 | intestinal cholesterol absorption(GO:0030299) intestinal lipid absorption(GO:0098856) |
| 0.8 | 2.4 | GO:0046440 | L-lysine catabolic process to acetyl-CoA(GO:0019474) L-lysine catabolic process(GO:0019477) L-lysine metabolic process(GO:0046440) |
| 0.8 | 3.2 | GO:1902159 | regulation of cyclic nucleotide-gated ion channel activity(GO:1902159) |
| 0.8 | 3.1 | GO:1904048 | regulation of spontaneous neurotransmitter secretion(GO:1904048) |
| 0.8 | 2.3 | GO:0050917 | sensory perception of sweet taste(GO:0050916) sensory perception of umami taste(GO:0050917) |
| 0.8 | 38.1 | GO:0050911 | detection of chemical stimulus involved in sensory perception of smell(GO:0050911) |
| 0.8 | 4.6 | GO:0009753 | response to jasmonic acid(GO:0009753) cellular response to jasmonic acid stimulus(GO:0071395) |
| 0.7 | 5.9 | GO:0019720 | Mo-molybdopterin cofactor biosynthetic process(GO:0006777) Mo-molybdopterin cofactor metabolic process(GO:0019720) |
| 0.7 | 2.2 | GO:0043606 | histidine catabolic process to glutamate and formamide(GO:0019556) histidine catabolic process to glutamate and formate(GO:0019557) formamide metabolic process(GO:0043606) |
| 0.7 | 1.4 | GO:0015722 | canalicular bile acid transport(GO:0015722) |
| 0.7 | 2.8 | GO:1990418 | response to insulin-like growth factor stimulus(GO:1990418) |
| 0.7 | 2.8 | GO:0055099 | response to high density lipoprotein particle(GO:0055099) |
| 0.7 | 3.5 | GO:1904844 | response to L-glutamine(GO:1904844) cellular response to L-glutamine(GO:1904845) |
| 0.7 | 4.1 | GO:0048280 | vesicle fusion with Golgi apparatus(GO:0048280) |
| 0.7 | 2.0 | GO:0019605 | benzoate metabolic process(GO:0018874) butyrate metabolic process(GO:0019605) |
| 0.7 | 7.3 | GO:0034356 | NAD biosynthesis via nicotinamide riboside salvage pathway(GO:0034356) |
| 0.7 | 2.6 | GO:0038018 | Wnt receptor catabolic process(GO:0038018) |
| 0.7 | 2.6 | GO:0044026 | DNA hypermethylation(GO:0044026) |
| 0.6 | 1.9 | GO:0038162 | erythropoietin-mediated signaling pathway(GO:0038162) |
| 0.6 | 2.5 | GO:0051534 | negative regulation of NFAT protein import into nucleus(GO:0051534) |
| 0.6 | 5.5 | GO:0032534 | regulation of microvillus assembly(GO:0032534) |
| 0.6 | 4.2 | GO:2000124 | regulation of endocannabinoid signaling pathway(GO:2000124) |
| 0.6 | 2.4 | GO:0045785 | positive regulation of cell adhesion(GO:0045785) |
| 0.6 | 3.5 | GO:0015842 | aminergic neurotransmitter loading into synaptic vesicle(GO:0015842) |
| 0.6 | 1.7 | GO:0060915 | fibroblast growth factor receptor signaling pathway involved in negative regulation of apoptotic process in bone marrow(GO:0035602) fibroblast growth factor receptor signaling pathway involved in hemopoiesis(GO:0035603) fibroblast growth factor receptor signaling pathway involved in positive regulation of cell proliferation in bone marrow(GO:0035604) fibroblast growth factor receptor signaling pathway involved in mammary gland specification(GO:0060595) mammary gland bud formation(GO:0060615) branch elongation involved in salivary gland morphogenesis(GO:0060667) mesenchymal cell differentiation involved in lung development(GO:0060915) |
| 0.6 | 4.0 | GO:0039663 | fusion of virus membrane with host plasma membrane(GO:0019064) membrane fusion involved in viral entry into host cell(GO:0039663) multi-organism membrane fusion(GO:0044800) |
| 0.6 | 2.3 | GO:0003366 | cell-matrix adhesion involved in ameboidal cell migration(GO:0003366) |
| 0.6 | 3.4 | GO:0061737 | leukotriene signaling pathway(GO:0061737) |
| 0.6 | 2.8 | GO:0071918 | urea transmembrane transport(GO:0071918) |
| 0.5 | 2.2 | GO:0032049 | cardiolipin biosynthetic process(GO:0032049) |
| 0.5 | 2.7 | GO:0036072 | intramembranous ossification(GO:0001957) direct ossification(GO:0036072) |
| 0.5 | 7.6 | GO:0019373 | epoxygenase P450 pathway(GO:0019373) |
| 0.5 | 1.6 | GO:0061470 | T follicular helper cell differentiation(GO:0061470) |
| 0.5 | 2.7 | GO:0042539 | hypotonic salinity response(GO:0042539) cellular hypotonic salinity response(GO:0071477) |
| 0.5 | 1.6 | GO:0006522 | alanine metabolic process(GO:0006522) alanine catabolic process(GO:0006524) pyruvate family amino acid metabolic process(GO:0009078) pyruvate family amino acid catabolic process(GO:0009080) |
| 0.5 | 1.6 | GO:0050729 | positive regulation of inflammatory response(GO:0050729) |
| 0.5 | 13.4 | GO:0003301 | physiological muscle hypertrophy(GO:0003298) physiological cardiac muscle hypertrophy(GO:0003301) cell growth involved in cardiac muscle cell development(GO:0061049) |
| 0.5 | 1.6 | GO:0071301 | cellular response to vitamin B1(GO:0071301) response to formaldehyde(GO:1904404) |
| 0.5 | 1.6 | GO:0086047 | membrane depolarization during Purkinje myocyte cell action potential(GO:0086047) membrane depolarization during bundle of His cell action potential(GO:0086048) |
| 0.5 | 3.1 | GO:0052405 | negative regulation by host of symbiont molecular function(GO:0052405) |
| 0.5 | 4.6 | GO:0042908 | xenobiotic transport(GO:0042908) |
| 0.5 | 0.5 | GO:0003104 | positive regulation of glomerular filtration(GO:0003104) |
| 0.5 | 2.0 | GO:2000042 | negative regulation of double-strand break repair via homologous recombination(GO:2000042) |
| 0.5 | 1.5 | GO:0001694 | histamine biosynthetic process(GO:0001694) |
| 0.5 | 6.8 | GO:0015671 | oxygen transport(GO:0015671) |
| 0.5 | 2.9 | GO:1904381 | Golgi apparatus mannose trimming(GO:1904381) |
| 0.5 | 3.8 | GO:0006848 | pyruvate transport(GO:0006848) pyruvate transmembrane transport(GO:1901475) |
| 0.5 | 2.8 | GO:0033574 | response to testosterone(GO:0033574) |
| 0.5 | 4.7 | GO:1904424 | regulation of GTP binding(GO:1904424) |
| 0.5 | 3.7 | GO:0033084 | regulation of immature T cell proliferation in thymus(GO:0033084) negative regulation of immature T cell proliferation in thymus(GO:0033088) |
| 0.5 | 1.8 | GO:0002314 | germinal center B cell differentiation(GO:0002314) |
| 0.5 | 1.8 | GO:1905229 | cellular response to glycoprotein(GO:1904588) cellular response to thyrotropin-releasing hormone(GO:1905229) |
| 0.5 | 1.8 | GO:0060133 | somatotropin secreting cell development(GO:0060133) |
| 0.5 | 1.8 | GO:0007525 | somatic muscle development(GO:0007525) |
| 0.4 | 2.2 | GO:0060154 | cellular process regulating host cell cycle in response to virus(GO:0060154) |
| 0.4 | 2.7 | GO:0036101 | leukotriene catabolic process(GO:0036100) leukotriene B4 catabolic process(GO:0036101) leukotriene B4 metabolic process(GO:0036102) icosanoid catabolic process(GO:1901523) fatty acid derivative catabolic process(GO:1901569) |
| 0.4 | 5.7 | GO:0033617 | mitochondrial respiratory chain complex IV assembly(GO:0033617) mitochondrial respiratory chain complex IV biogenesis(GO:0097034) |
| 0.4 | 2.6 | GO:2000546 | positive regulation of cell chemotaxis to fibroblast growth factor(GO:1904849) positive regulation of endothelial cell chemotaxis to fibroblast growth factor(GO:2000546) |
| 0.4 | 2.6 | GO:1903244 | positive regulation of cardiac muscle adaptation(GO:0010615) positive regulation of cardiac muscle hypertrophy in response to stress(GO:1903244) |
| 0.4 | 5.1 | GO:0071267 | amino acid salvage(GO:0043102) L-methionine salvage(GO:0071267) |
| 0.4 | 1.7 | GO:0050908 | detection of light stimulus involved in visual perception(GO:0050908) detection of light stimulus involved in sensory perception(GO:0050962) |
| 0.4 | 1.7 | GO:0019470 | 4-hydroxyproline catabolic process(GO:0019470) |
| 0.4 | 2.9 | GO:1901374 | epinephrine transport(GO:0048241) acetate ester transport(GO:1901374) |
| 0.4 | 4.1 | GO:0002430 | complement receptor mediated signaling pathway(GO:0002430) |
| 0.4 | 19.9 | GO:0031640 | killing of cells of other organism(GO:0031640) disruption of cells of other organism(GO:0044364) |
| 0.4 | 0.4 | GO:0033087 | negative regulation of immature T cell proliferation(GO:0033087) |
| 0.4 | 0.8 | GO:0045356 | positive regulation of interferon-alpha biosynthetic process(GO:0045356) |
| 0.4 | 2.0 | GO:0046968 | peptide antigen transport(GO:0046968) |
| 0.4 | 1.6 | GO:0046006 | regulation of activated T cell proliferation(GO:0046006) activated T cell proliferation(GO:0050798) |
| 0.4 | 2.0 | GO:0007162 | negative regulation of cell adhesion(GO:0007162) |
| 0.4 | 1.9 | GO:0045910 | negative regulation of DNA recombination(GO:0045910) |
| 0.4 | 1.6 | GO:0002725 | negative regulation of T cell cytokine production(GO:0002725) |
| 0.4 | 1.5 | GO:0002018 | renin-angiotensin regulation of aldosterone production(GO:0002018) |
| 0.4 | 1.1 | GO:0032661 | regulation of interleukin-18 production(GO:0032661) |
| 0.4 | 1.5 | GO:0035425 | autocrine signaling(GO:0035425) |
| 0.4 | 1.1 | GO:0039534 | negative regulation of MDA-5 signaling pathway(GO:0039534) |
| 0.4 | 3.6 | GO:0071351 | interleukin-18-mediated signaling pathway(GO:0035655) cellular response to interleukin-18(GO:0071351) |
| 0.3 | 6.7 | GO:0007250 | activation of NF-kappaB-inducing kinase activity(GO:0007250) |
| 0.3 | 3.0 | GO:0035865 | cellular response to potassium ion(GO:0035865) |
| 0.3 | 1.3 | GO:0061370 | testosterone biosynthetic process(GO:0061370) |
| 0.3 | 2.9 | GO:0019375 | galactosylceramide biosynthetic process(GO:0006682) galactolipid biosynthetic process(GO:0019375) |
| 0.3 | 2.5 | GO:0070170 | regulation of tooth mineralization(GO:0070170) |
| 0.3 | 7.3 | GO:0030449 | regulation of complement activation(GO:0030449) |
| 0.3 | 2.5 | GO:0007598 | blood coagulation, extrinsic pathway(GO:0007598) |
| 0.3 | 16.3 | GO:0006959 | humoral immune response(GO:0006959) |
| 0.3 | 3.1 | GO:0033299 | secretion of lysosomal enzymes(GO:0033299) |
| 0.3 | 2.5 | GO:0015705 | iodide transport(GO:0015705) |
| 0.3 | 1.5 | GO:0050968 | thermoception(GO:0050955) detection of chemical stimulus involved in sensory perception of pain(GO:0050968) |
| 0.3 | 1.8 | GO:2000158 | positive regulation of ubiquitin-specific protease activity(GO:2000158) |
| 0.3 | 1.4 | GO:0034201 | response to oleic acid(GO:0034201) |
| 0.3 | 1.7 | GO:0060523 | prostate epithelial cord elongation(GO:0060523) prostate gland morphogenetic growth(GO:0060737) |
| 0.3 | 0.8 | GO:0034444 | regulation of plasma lipoprotein particle oxidation(GO:0034444) negative regulation of plasma lipoprotein particle oxidation(GO:0034445) |
| 0.3 | 3.9 | GO:0021670 | lateral ventricle development(GO:0021670) |
| 0.3 | 5.1 | GO:0042730 | fibrinolysis(GO:0042730) |
| 0.3 | 0.8 | GO:1903546 | protein localization to photoreceptor outer segment(GO:1903546) |
| 0.3 | 3.2 | GO:2001214 | positive regulation of vasculogenesis(GO:2001214) |
| 0.3 | 0.8 | GO:1900738 | positive regulation of phospholipase C-activating G-protein coupled receptor signaling pathway(GO:1900738) |
| 0.3 | 2.7 | GO:0071847 | TNFSF11-mediated signaling pathway(GO:0071847) |
| 0.3 | 1.8 | GO:0001867 | complement activation, lectin pathway(GO:0001867) |
| 0.3 | 4.5 | GO:0042573 | retinoic acid metabolic process(GO:0042573) |
| 0.3 | 2.6 | GO:0007144 | female meiosis I(GO:0007144) |
| 0.3 | 1.8 | GO:0008218 | bioluminescence(GO:0008218) |
| 0.2 | 1.5 | GO:0002175 | protein localization to paranode region of axon(GO:0002175) |
| 0.2 | 1.5 | GO:0007207 | phospholipase C-activating G-protein coupled acetylcholine receptor signaling pathway(GO:0007207) |
| 0.2 | 1.5 | GO:0032354 | response to follicle-stimulating hormone(GO:0032354) |
| 0.2 | 2.2 | GO:0051026 | chiasma assembly(GO:0051026) |
| 0.2 | 2.4 | GO:0046078 | dUMP metabolic process(GO:0046078) |
| 0.2 | 3.3 | GO:0060044 | negative regulation of cardiac muscle tissue growth(GO:0055022) negative regulation of cardiac muscle cell proliferation(GO:0060044) negative regulation of heart growth(GO:0061117) |
| 0.2 | 2.8 | GO:0036158 | outer dynein arm assembly(GO:0036158) |
| 0.2 | 5.4 | GO:0016246 | RNA interference(GO:0016246) |
| 0.2 | 1.4 | GO:0045084 | positive regulation of interleukin-12 biosynthetic process(GO:0045084) |
| 0.2 | 2.3 | GO:0008627 | intrinsic apoptotic signaling pathway in response to osmotic stress(GO:0008627) |
| 0.2 | 0.9 | GO:0051056 | regulation of small GTPase mediated signal transduction(GO:0051056) |
| 0.2 | 1.6 | GO:0048014 | Tie signaling pathway(GO:0048014) |
| 0.2 | 11.0 | GO:0015701 | bicarbonate transport(GO:0015701) |
| 0.2 | 1.6 | GO:2000660 | negative regulation of interleukin-1-mediated signaling pathway(GO:2000660) |
| 0.2 | 1.8 | GO:0045905 | translational frameshifting(GO:0006452) positive regulation of translational termination(GO:0045905) |
| 0.2 | 1.1 | GO:0070862 | negative regulation of protein exit from endoplasmic reticulum(GO:0070862) negative regulation of retrograde protein transport, ER to cytosol(GO:1904153) |
| 0.2 | 1.8 | GO:0070995 | NADPH oxidation(GO:0070995) |
| 0.2 | 0.7 | GO:0000965 | mitochondrial RNA 3'-end processing(GO:0000965) rRNA import into mitochondrion(GO:0035928) |
| 0.2 | 2.2 | GO:2000394 | positive regulation of lamellipodium morphogenesis(GO:2000394) |
| 0.2 | 2.4 | GO:1903071 | positive regulation of ER-associated ubiquitin-dependent protein catabolic process(GO:1903071) |
| 0.2 | 4.1 | GO:0042340 | keratan sulfate catabolic process(GO:0042340) |
| 0.2 | 25.1 | GO:0070268 | cornification(GO:0070268) |
| 0.2 | 2.8 | GO:0030889 | negative regulation of B cell proliferation(GO:0030889) |
| 0.2 | 2.1 | GO:0032000 | positive regulation of fatty acid beta-oxidation(GO:0032000) |
| 0.2 | 3.2 | GO:1902260 | negative regulation of delayed rectifier potassium channel activity(GO:1902260) |
| 0.2 | 0.4 | GO:1901162 | primary amino compound biosynthetic process(GO:1901162) |
| 0.2 | 1.0 | GO:0006127 | glycerophosphate shuttle(GO:0006127) |
| 0.2 | 3.6 | GO:0097151 | positive regulation of inhibitory postsynaptic potential(GO:0097151) modulation of inhibitory postsynaptic potential(GO:0098828) |
| 0.2 | 1.2 | GO:0038161 | prolactin signaling pathway(GO:0038161) |
| 0.2 | 1.8 | GO:0060088 | auditory receptor cell stereocilium organization(GO:0060088) |
| 0.2 | 1.0 | GO:1903385 | regulation of homophilic cell adhesion(GO:1903385) |
| 0.2 | 1.0 | GO:0019441 | tryptophan catabolic process to kynurenine(GO:0019441) kynurenine metabolic process(GO:0070189) |
| 0.2 | 1.0 | GO:0051044 | positive regulation of membrane protein ectodomain proteolysis(GO:0051044) |
| 0.2 | 4.4 | GO:0035338 | long-chain fatty-acyl-CoA biosynthetic process(GO:0035338) |
| 0.2 | 0.8 | GO:0035754 | B cell chemotaxis(GO:0035754) |
| 0.2 | 1.3 | GO:0018344 | protein geranylgeranylation(GO:0018344) |
| 0.2 | 1.9 | GO:0032264 | IMP salvage(GO:0032264) |
| 0.2 | 2.2 | GO:0048007 | antigen processing and presentation of lipid antigen via MHC class Ib(GO:0048003) antigen processing and presentation, exogenous lipid antigen via MHC class Ib(GO:0048007) |
| 0.2 | 4.9 | GO:0016338 | calcium-independent cell-cell adhesion via plasma membrane cell-adhesion molecules(GO:0016338) |
| 0.2 | 5.0 | GO:0051923 | sulfation(GO:0051923) |
| 0.2 | 2.0 | GO:0042448 | progesterone metabolic process(GO:0042448) |
| 0.2 | 19.1 | GO:0031295 | lymphocyte costimulation(GO:0031294) T cell costimulation(GO:0031295) |
| 0.2 | 6.1 | GO:0022400 | regulation of rhodopsin mediated signaling pathway(GO:0022400) |
| 0.2 | 9.9 | GO:0001895 | retina homeostasis(GO:0001895) |
| 0.2 | 13.4 | GO:0030049 | muscle filament sliding(GO:0030049) actin-myosin filament sliding(GO:0033275) |
| 0.2 | 1.3 | GO:1903026 | negative regulation of RNA polymerase II regulatory region sequence-specific DNA binding(GO:1903026) |
| 0.2 | 1.5 | GO:0030038 | contractile actin filament bundle assembly(GO:0030038) stress fiber assembly(GO:0043149) |
| 0.2 | 1.3 | GO:0015693 | magnesium ion transport(GO:0015693) |
| 0.2 | 1.3 | GO:2000304 | positive regulation of sphingolipid biosynthetic process(GO:0090154) positive regulation of ceramide biosynthetic process(GO:2000304) |
| 0.2 | 1.5 | GO:1902412 | regulation of mitotic cytokinesis(GO:1902412) |
| 0.2 | 1.4 | GO:0032620 | interleukin-17 production(GO:0032620) |
| 0.2 | 0.3 | GO:0032571 | response to vitamin K(GO:0032571) |
| 0.2 | 0.8 | GO:0097646 | calcitonin family receptor signaling pathway(GO:0097646) amylin receptor signaling pathway(GO:0097647) |
| 0.2 | 3.1 | GO:0031167 | rRNA methylation(GO:0031167) |
| 0.2 | 5.2 | GO:0006505 | GPI anchor metabolic process(GO:0006505) GPI anchor biosynthetic process(GO:0006506) |
| 0.2 | 0.9 | GO:1903899 | lung goblet cell differentiation(GO:0060480) positive regulation of PERK-mediated unfolded protein response(GO:1903899) |
| 0.2 | 1.7 | GO:0010572 | positive regulation of platelet activation(GO:0010572) |
| 0.1 | 0.7 | GO:0006015 | 5-phosphoribose 1-diphosphate biosynthetic process(GO:0006015) 5-phosphoribose 1-diphosphate metabolic process(GO:0046391) |
| 0.1 | 2.1 | GO:0045793 | positive regulation of cell size(GO:0045793) |
| 0.1 | 0.6 | GO:0019918 | peptidyl-arginine methylation, to symmetrical-dimethyl arginine(GO:0019918) |
| 0.1 | 1.0 | GO:0030207 | chondroitin sulfate catabolic process(GO:0030207) |
| 0.1 | 0.8 | GO:0042462 | eye photoreceptor cell development(GO:0042462) |
| 0.1 | 2.0 | GO:0030277 | maintenance of gastrointestinal epithelium(GO:0030277) |
| 0.1 | 0.4 | GO:0038043 | interleukin-5-mediated signaling pathway(GO:0038043) |
| 0.1 | 0.9 | GO:0043154 | negative regulation of cysteine-type endopeptidase activity involved in apoptotic process(GO:0043154) |
| 0.1 | 2.8 | GO:0046339 | diacylglycerol metabolic process(GO:0046339) |
| 0.1 | 0.8 | GO:0045725 | positive regulation of glycogen biosynthetic process(GO:0045725) |
| 0.1 | 2.1 | GO:0050850 | positive regulation of calcium-mediated signaling(GO:0050850) |
| 0.1 | 0.9 | GO:0070777 | D-aspartate transport(GO:0070777) D-aspartate import(GO:0070779) |
| 0.1 | 0.9 | GO:0006449 | regulation of translational termination(GO:0006449) |
| 0.1 | 0.8 | GO:0055059 | asymmetric neuroblast division(GO:0055059) |
| 0.1 | 1.4 | GO:0006703 | estrogen biosynthetic process(GO:0006703) |
| 0.1 | 1.9 | GO:0097067 | cellular response to thyroid hormone stimulus(GO:0097067) |
| 0.1 | 0.2 | GO:0038109 | response to stem cell factor(GO:0036215) cellular response to stem cell factor stimulus(GO:0036216) Kit signaling pathway(GO:0038109) |
| 0.1 | 0.9 | GO:0018401 | peptidyl-proline hydroxylation to 4-hydroxy-L-proline(GO:0018401) |
| 0.1 | 1.2 | GO:0071985 | multivesicular body sorting pathway(GO:0071985) |
| 0.1 | 0.2 | GO:0098758 | response to interleukin-8(GO:0098758) cellular response to interleukin-8(GO:0098759) |
| 0.1 | 4.9 | GO:0030513 | positive regulation of BMP signaling pathway(GO:0030513) |
| 0.1 | 0.4 | GO:0036518 | chemorepulsion of dopaminergic neuron axon(GO:0036518) chemorepulsion of axon(GO:0061643) |
| 0.1 | 1.3 | GO:0042501 | serine phosphorylation of STAT protein(GO:0042501) |
| 0.1 | 0.1 | GO:0035992 | tendon cell differentiation(GO:0035990) tendon formation(GO:0035992) |
| 0.1 | 2.4 | GO:0007202 | activation of phospholipase C activity(GO:0007202) |
| 0.1 | 14.0 | GO:0050796 | regulation of insulin secretion(GO:0050796) |
| 0.1 | 1.0 | GO:0033327 | Leydig cell differentiation(GO:0033327) |
| 0.1 | 3.5 | GO:0046676 | negative regulation of insulin secretion(GO:0046676) |
| 0.1 | 0.4 | GO:0032667 | interleukin-23 production(GO:0032627) regulation of interleukin-23 production(GO:0032667) positive regulation of interleukin-23 production(GO:0032747) |
| 0.1 | 2.3 | GO:0035162 | embryonic hemopoiesis(GO:0035162) |
| 0.1 | 2.4 | GO:0046710 | GDP metabolic process(GO:0046710) |
| 0.1 | 1.6 | GO:0050651 | dermatan sulfate proteoglycan biosynthetic process(GO:0050651) |
| 0.1 | 1.4 | GO:0046602 | regulation of mitotic centrosome separation(GO:0046602) |
| 0.1 | 3.4 | GO:0048247 | lymphocyte chemotaxis(GO:0048247) |
| 0.1 | 10.8 | GO:0007586 | digestion(GO:0007586) |
| 0.1 | 2.3 | GO:0042102 | positive regulation of T cell proliferation(GO:0042102) |
| 0.1 | 1.6 | GO:0070935 | 3'-UTR-mediated mRNA stabilization(GO:0070935) |
| 0.1 | 1.1 | GO:0070327 | thyroid hormone transport(GO:0070327) |
| 0.1 | 0.8 | GO:0090331 | negative regulation of platelet aggregation(GO:0090331) |
| 0.1 | 2.0 | GO:0001569 | patterning of blood vessels(GO:0001569) |
| 0.1 | 1.1 | GO:0060391 | positive regulation of SMAD protein import into nucleus(GO:0060391) |
| 0.1 | 0.5 | GO:0006554 | lysine catabolic process(GO:0006554) |
| 0.1 | 0.3 | GO:0007341 | penetration of zona pellucida(GO:0007341) |
| 0.1 | 0.3 | GO:0003010 | voluntary skeletal muscle contraction(GO:0003010) twitch skeletal muscle contraction(GO:0014721) fast-twitch skeletal muscle fiber contraction(GO:0031443) |
| 0.1 | 1.4 | GO:0010842 | retina layer formation(GO:0010842) |
| 0.1 | 0.8 | GO:0008217 | regulation of blood pressure(GO:0008217) |
| 0.1 | 1.0 | GO:0035520 | monoubiquitinated protein deubiquitination(GO:0035520) |
| 0.1 | 0.4 | GO:0019323 | pentose catabolic process(GO:0019323) |
| 0.1 | 2.5 | GO:0001702 | gastrulation with mouth forming second(GO:0001702) |
| 0.1 | 3.1 | GO:0036075 | endochondral ossification(GO:0001958) replacement ossification(GO:0036075) |
| 0.1 | 0.8 | GO:0015939 | pantothenate metabolic process(GO:0015939) |
| 0.1 | 0.6 | GO:2000111 | positive regulation of macrophage apoptotic process(GO:2000111) |
| 0.1 | 3.3 | GO:0070206 | protein trimerization(GO:0070206) |
| 0.1 | 1.1 | GO:0090023 | positive regulation of neutrophil chemotaxis(GO:0090023) |
| 0.1 | 22.2 | GO:0002250 | adaptive immune response(GO:0002250) |
| 0.1 | 0.7 | GO:0034374 | low-density lipoprotein particle remodeling(GO:0034374) |
| 0.1 | 1.7 | GO:0045814 | negative regulation of gene expression, epigenetic(GO:0045814) |
| 0.1 | 1.5 | GO:0071168 | protein localization to chromatin(GO:0071168) |
| 0.1 | 0.5 | GO:0050974 | detection of mechanical stimulus involved in sensory perception(GO:0050974) |
| 0.1 | 3.0 | GO:0019229 | regulation of vasoconstriction(GO:0019229) |
| 0.1 | 2.3 | GO:0009083 | branched-chain amino acid metabolic process(GO:0009081) branched-chain amino acid catabolic process(GO:0009083) |
| 0.1 | 0.6 | GO:0043374 | CD8-positive, alpha-beta T cell differentiation(GO:0043374) |
| 0.1 | 0.3 | GO:0030035 | microspike assembly(GO:0030035) glomerulus morphogenesis(GO:0072102) |
| 0.1 | 0.6 | GO:0032754 | positive regulation of interleukin-5 production(GO:0032754) |
| 0.1 | 0.3 | GO:1904354 | negative regulation of telomere capping(GO:1904354) |
| 0.1 | 1.5 | GO:0022604 | regulation of cell morphogenesis(GO:0022604) |
| 0.1 | 0.3 | GO:0010761 | fibroblast migration(GO:0010761) |
| 0.1 | 0.9 | GO:0030220 | platelet formation(GO:0030220) |
| 0.1 | 1.1 | GO:0070493 | thrombin receptor signaling pathway(GO:0070493) |
| 0.1 | 0.1 | GO:0046668 | regulation of retinal cell programmed cell death(GO:0046668) |
| 0.1 | 2.2 | GO:1901385 | regulation of voltage-gated calcium channel activity(GO:1901385) |
| 0.1 | 1.0 | GO:0016576 | histone dephosphorylation(GO:0016576) |
| 0.1 | 0.6 | GO:0051895 | negative regulation of focal adhesion assembly(GO:0051895) negative regulation of adherens junction organization(GO:1903392) |
| 0.1 | 3.3 | GO:0001701 | in utero embryonic development(GO:0001701) |
| 0.1 | 0.5 | GO:0006013 | mannose metabolic process(GO:0006013) |
| 0.1 | 2.3 | GO:0046718 | viral entry into host cell(GO:0046718) |
| 0.1 | 1.2 | GO:0030488 | tRNA methylation(GO:0030488) |
| 0.1 | 0.9 | GO:0030334 | regulation of cell migration(GO:0030334) |
| 0.1 | 1.3 | GO:0045744 | negative regulation of G-protein coupled receptor protein signaling pathway(GO:0045744) |
| 0.1 | 0.5 | GO:1905097 | regulation of guanyl-nucleotide exchange factor activity(GO:1905097) |
| 0.1 | 1.4 | GO:0040019 | positive regulation of embryonic development(GO:0040019) |
| 0.1 | 2.0 | GO:0010107 | potassium ion import(GO:0010107) |
| 0.1 | 0.7 | GO:0050965 | detection of temperature stimulus involved in sensory perception(GO:0050961) detection of temperature stimulus involved in sensory perception of pain(GO:0050965) |
| 0.1 | 1.2 | GO:0030308 | negative regulation of cell growth(GO:0030308) |
| 0.1 | 1.6 | GO:0010738 | regulation of protein kinase A signaling(GO:0010738) |
| 0.1 | 1.4 | GO:0043268 | positive regulation of potassium ion transport(GO:0043268) |
| 0.1 | 0.6 | GO:0032464 | positive regulation of protein homooligomerization(GO:0032464) |
| 0.1 | 0.2 | GO:0060708 | spongiotrophoblast differentiation(GO:0060708) |
| 0.1 | 1.5 | GO:0036297 | interstrand cross-link repair(GO:0036297) |
| 0.0 | 3.4 | GO:0042742 | defense response to bacterium(GO:0042742) |
| 0.0 | 0.0 | GO:1905209 | positive regulation of cardiocyte differentiation(GO:1905209) |
| 0.0 | 0.2 | GO:0017121 | phospholipid scrambling(GO:0017121) |
| 0.0 | 7.1 | GO:0006614 | SRP-dependent cotranslational protein targeting to membrane(GO:0006614) |
| 0.0 | 0.8 | GO:0036150 | phosphatidylserine acyl-chain remodeling(GO:0036150) |
| 0.0 | 1.4 | GO:0048268 | clathrin coat assembly(GO:0048268) |
| 0.0 | 1.1 | GO:0007183 | SMAD protein complex assembly(GO:0007183) |
| 0.0 | 1.2 | GO:0007257 | activation of JUN kinase activity(GO:0007257) |
| 0.0 | 4.6 | GO:1990830 | response to leukemia inhibitory factor(GO:1990823) cellular response to leukemia inhibitory factor(GO:1990830) |
| 0.0 | 0.8 | GO:0010165 | response to X-ray(GO:0010165) |
| 0.0 | 3.5 | GO:0090630 | activation of GTPase activity(GO:0090630) |
| 0.0 | 0.2 | GO:0007016 | cytoskeletal anchoring at plasma membrane(GO:0007016) |
| 0.0 | 2.0 | GO:0002576 | platelet degranulation(GO:0002576) |
| 0.0 | 0.2 | GO:0014832 | urinary bladder smooth muscle contraction(GO:0014832) urinary tract smooth muscle contraction(GO:0014848) |
| 0.0 | 1.4 | GO:0032233 | positive regulation of actin filament bundle assembly(GO:0032233) |
| 0.0 | 1.3 | GO:0016266 | O-glycan processing(GO:0016266) |
| 0.0 | 0.3 | GO:0015747 | urate transport(GO:0015747) |
| 0.0 | 0.2 | GO:0051388 | positive regulation of neurotrophin TRK receptor signaling pathway(GO:0051388) |
| 0.0 | 2.9 | GO:0006805 | xenobiotic metabolic process(GO:0006805) |
| 0.0 | 1.0 | GO:0001938 | positive regulation of endothelial cell proliferation(GO:0001938) |
| 0.0 | 0.1 | GO:2000255 | regulation of male germ cell proliferation(GO:2000254) negative regulation of male germ cell proliferation(GO:2000255) |
| 0.0 | 0.2 | GO:0003344 | pericardium morphogenesis(GO:0003344) |
| 0.0 | 0.2 | GO:0090312 | positive regulation of protein deacetylation(GO:0090312) |
| 0.0 | 1.4 | GO:0042127 | regulation of cell proliferation(GO:0042127) |
| 0.0 | 2.4 | GO:1902476 | chloride transmembrane transport(GO:1902476) |
| 0.0 | 1.4 | GO:0003333 | amino acid transmembrane transport(GO:0003333) |
| 0.0 | 1.7 | GO:0021510 | spinal cord development(GO:0021510) |
| 0.0 | 0.7 | GO:0072488 | ammonium transmembrane transport(GO:0072488) |
| 0.0 | 0.2 | GO:0043249 | erythrocyte maturation(GO:0043249) |
| 0.0 | 1.2 | GO:0006378 | mRNA polyadenylation(GO:0006378) |
| 0.0 | 0.2 | GO:0043508 | negative regulation of JUN kinase activity(GO:0043508) |
| 0.0 | 0.4 | GO:0006646 | phosphatidylethanolamine biosynthetic process(GO:0006646) |
| 0.0 | 0.3 | GO:0031018 | endocrine pancreas development(GO:0031018) |
| 0.0 | 0.1 | GO:1902358 | sulfate transmembrane transport(GO:1902358) |
| 0.0 | 0.5 | GO:0006953 | acute-phase response(GO:0006953) |
| 0.0 | 0.9 | GO:0007631 | feeding behavior(GO:0007631) |
| 0.0 | 0.6 | GO:0006835 | dicarboxylic acid transport(GO:0006835) |
| 0.0 | 0.3 | GO:0090162 | establishment of epithelial cell polarity(GO:0090162) |
| 0.0 | 0.2 | GO:0051382 | kinetochore assembly(GO:0051382) |
| 0.0 | 0.2 | GO:0006284 | base-excision repair(GO:0006284) |
| 0.0 | 0.1 | GO:0048194 | Golgi vesicle budding(GO:0048194) |
| 0.0 | 0.6 | GO:0006641 | triglyceride metabolic process(GO:0006641) |
Gene overrepresentation in cellular_component category:
| Log-likelihood per target | Total log-likelihood | Term | Description |
|---|---|---|---|
| 8.4 | 117.2 | GO:0098647 | collagen type VI trimer(GO:0005589) collagen beaded filament(GO:0098647) |
| 6.4 | 25.4 | GO:0031838 | haptoglobin-hemoglobin complex(GO:0031838) |
| 4.8 | 14.5 | GO:0071748 | IgA immunoglobulin complex(GO:0071745) IgA immunoglobulin complex, circulating(GO:0071746) monomeric IgA immunoglobulin complex(GO:0071748) polymeric IgA immunoglobulin complex(GO:0071749) secretory IgA immunoglobulin complex(GO:0071751) |
| 3.8 | 176.4 | GO:0042571 | immunoglobulin complex, circulating(GO:0042571) |
| 3.3 | 29.6 | GO:0005579 | membrane attack complex(GO:0005579) |
| 2.6 | 7.7 | GO:0097679 | other organism cytoplasm(GO:0097679) |
| 2.5 | 7.6 | GO:0030895 | apolipoprotein B mRNA editing enzyme complex(GO:0030895) |
| 2.1 | 43.6 | GO:0042613 | MHC class II protein complex(GO:0042613) |
| 2.0 | 5.9 | GO:0019008 | molybdopterin synthase complex(GO:0019008) |
| 1.4 | 18.5 | GO:0005577 | fibrinogen complex(GO:0005577) |
| 1.3 | 4.0 | GO:0033150 | perinuclear theca(GO:0033011) cytoskeletal calyx(GO:0033150) |
| 1.2 | 14.8 | GO:0005583 | fibrillar collagen trimer(GO:0005583) banded collagen fibril(GO:0098643) |
| 1.2 | 9.3 | GO:0072687 | meiotic spindle(GO:0072687) |
| 1.2 | 194.9 | GO:0072562 | blood microparticle(GO:0072562) |
| 1.1 | 5.6 | GO:0065010 | extracellular membrane-bounded organelle(GO:0065010) |
| 1.1 | 2.2 | GO:0005927 | muscle tendon junction(GO:0005927) |
| 1.1 | 5.3 | GO:0046696 | lipopolysaccharide receptor complex(GO:0046696) |
| 1.0 | 29.2 | GO:0031092 | platelet alpha granule membrane(GO:0031092) |
| 0.9 | 2.8 | GO:0005826 | actomyosin contractile ring(GO:0005826) |
| 0.9 | 3.5 | GO:0030485 | smooth muscle contractile fiber(GO:0030485) |
| 0.8 | 5.9 | GO:0036021 | endolysosome lumen(GO:0036021) |
| 0.8 | 2.3 | GO:0032437 | cuticular plate(GO:0032437) |
| 0.8 | 6.2 | GO:0016012 | sarcoglycan complex(GO:0016012) |
| 0.7 | 10.6 | GO:0031089 | platelet dense granule lumen(GO:0031089) |
| 0.7 | 4.8 | GO:0005854 | nascent polypeptide-associated complex(GO:0005854) |
| 0.6 | 2.6 | GO:0005712 | chiasma(GO:0005712) |
| 0.6 | 4.4 | GO:0097209 | epidermal lamellar body(GO:0097209) |
| 0.6 | 1.2 | GO:0033655 | host cell cytoplasm(GO:0030430) host cell cytoplasm part(GO:0033655) |
| 0.6 | 2.3 | GO:0034669 | integrin alpha4-beta7 complex(GO:0034669) |
| 0.6 | 5.1 | GO:1990712 | HFE-transferrin receptor complex(GO:1990712) |
| 0.6 | 1.7 | GO:0008282 | ATP-sensitive potassium channel complex(GO:0008282) |
| 0.6 | 2.8 | GO:0071546 | perinucleolar chromocenter(GO:0010370) pi-body(GO:0071546) |
| 0.5 | 47.7 | GO:0035580 | specific granule lumen(GO:0035580) |
| 0.5 | 3.2 | GO:1990769 | proximal neuron projection(GO:1990769) |
| 0.5 | 3.8 | GO:0000322 | storage vacuole(GO:0000322) |
| 0.5 | 1.4 | GO:0031233 | intrinsic component of external side of plasma membrane(GO:0031233) |
| 0.4 | 3.1 | GO:0044326 | dendritic spine neck(GO:0044326) |
| 0.4 | 19.8 | GO:0001533 | cornified envelope(GO:0001533) |
| 0.4 | 3.4 | GO:0030990 | intraciliary transport particle(GO:0030990) |
| 0.4 | 2.0 | GO:0005947 | mitochondrial alpha-ketoglutarate dehydrogenase complex(GO:0005947) |
| 0.4 | 2.4 | GO:1990037 | Lewy body core(GO:1990037) |
| 0.4 | 2.3 | GO:0005958 | DNA-dependent protein kinase-DNA ligase 4 complex(GO:0005958) DNA ligase IV complex(GO:0032807) |
| 0.4 | 2.9 | GO:0036157 | outer dynein arm(GO:0036157) |
| 0.3 | 2.1 | GO:0097524 | sperm plasma membrane(GO:0097524) |
| 0.3 | 0.7 | GO:0005965 | protein farnesyltransferase complex(GO:0005965) |
| 0.3 | 498.7 | GO:0005615 | extracellular space(GO:0005615) |
| 0.3 | 1.3 | GO:0005968 | Rab-protein geranylgeranyltransferase complex(GO:0005968) |
| 0.3 | 3.2 | GO:0031464 | Cul4A-RING E3 ubiquitin ligase complex(GO:0031464) |
| 0.3 | 1.6 | GO:0089701 | U2AF(GO:0089701) |
| 0.3 | 1.2 | GO:1990604 | IRE1-TRAF2-ASK1 complex(GO:1990604) |
| 0.3 | 2.1 | GO:0071011 | precatalytic spliceosome(GO:0071011) |
| 0.3 | 2.1 | GO:0045179 | apical cortex(GO:0045179) |
| 0.3 | 7.0 | GO:0016010 | dystrophin-associated glycoprotein complex(GO:0016010) glycoprotein complex(GO:0090665) |
| 0.3 | 23.6 | GO:0005791 | rough endoplasmic reticulum(GO:0005791) |
| 0.3 | 4.2 | GO:0046930 | pore complex(GO:0046930) |
| 0.3 | 1.9 | GO:0032584 | growth cone membrane(GO:0032584) |
| 0.3 | 1.9 | GO:1990635 | proximal dendrite(GO:1990635) |
| 0.3 | 2.7 | GO:0044327 | dendritic spine head(GO:0044327) |
| 0.3 | 3.8 | GO:0033270 | paranode region of axon(GO:0033270) |
| 0.2 | 5.8 | GO:0046658 | anchored component of plasma membrane(GO:0046658) |
| 0.2 | 4.0 | GO:0005671 | Ada2/Gcn5/Ada3 transcription activator complex(GO:0005671) |
| 0.2 | 2.1 | GO:0005883 | neurofilament(GO:0005883) |
| 0.2 | 1.1 | GO:0000836 | Hrd1p ubiquitin ligase complex(GO:0000836) |
| 0.2 | 2.2 | GO:0097136 | Bcl-2 family protein complex(GO:0097136) |
| 0.2 | 11.7 | GO:0005891 | voltage-gated calcium channel complex(GO:0005891) |
| 0.2 | 1.4 | GO:0046581 | intercellular canaliculus(GO:0046581) |
| 0.2 | 14.6 | GO:0022627 | cytosolic small ribosomal subunit(GO:0022627) |
| 0.2 | 3.5 | GO:0005736 | DNA-directed RNA polymerase I complex(GO:0005736) |
| 0.2 | 1.0 | GO:0043196 | varicosity(GO:0043196) |
| 0.2 | 1.4 | GO:0042611 | MHC protein complex(GO:0042611) |
| 0.2 | 2.1 | GO:0032045 | guanyl-nucleotide exchange factor complex(GO:0032045) |
| 0.2 | 7.1 | GO:0001917 | photoreceptor inner segment(GO:0001917) |
| 0.2 | 3.2 | GO:0005862 | muscle thin filament tropomyosin(GO:0005862) |
| 0.2 | 1.0 | GO:0009331 | glycerol-3-phosphate dehydrogenase complex(GO:0009331) |
| 0.2 | 0.8 | GO:0005899 | insulin receptor complex(GO:0005899) |
| 0.2 | 1.6 | GO:0030478 | actin cap(GO:0030478) |
| 0.2 | 1.7 | GO:0042788 | polysomal ribosome(GO:0042788) |
| 0.2 | 3.6 | GO:0005861 | troponin complex(GO:0005861) |
| 0.1 | 1.3 | GO:0008250 | oligosaccharyltransferase complex(GO:0008250) |
| 0.1 | 4.9 | GO:0005581 | collagen trimer(GO:0005581) |
| 0.1 | 23.0 | GO:0005578 | proteinaceous extracellular matrix(GO:0005578) |
| 0.1 | 1.6 | GO:0043190 | ATP-binding cassette (ABC) transporter complex(GO:0043190) |
| 0.1 | 0.9 | GO:0097225 | sperm midpiece(GO:0097225) |
| 0.1 | 1.7 | GO:0031618 | nuclear pericentric heterochromatin(GO:0031618) |
| 0.1 | 0.7 | GO:0097442 | CA3 pyramidal cell dendrite(GO:0097442) |
| 0.1 | 1.0 | GO:0000235 | astral microtubule(GO:0000235) aster(GO:0005818) |
| 0.1 | 0.3 | GO:0060053 | neurofilament cytoskeleton(GO:0060053) |
| 0.1 | 9.4 | GO:0005811 | lipid particle(GO:0005811) |
| 0.1 | 1.1 | GO:0036038 | MKS complex(GO:0036038) |
| 0.1 | 7.4 | GO:0099501 | synaptic vesicle membrane(GO:0030672) exocytic vesicle membrane(GO:0099501) |
| 0.1 | 3.6 | GO:0031093 | platelet alpha granule lumen(GO:0031093) |
| 0.1 | 11.6 | GO:0008076 | voltage-gated potassium channel complex(GO:0008076) potassium channel complex(GO:0034705) |
| 0.1 | 7.4 | GO:0034707 | chloride channel complex(GO:0034707) |
| 0.1 | 2.8 | GO:0009925 | basal plasma membrane(GO:0009925) |
| 0.1 | 0.5 | GO:0031314 | extrinsic component of mitochondrial inner membrane(GO:0031314) |
| 0.1 | 0.5 | GO:0005916 | fascia adherens(GO:0005916) |
| 0.1 | 2.2 | GO:0042101 | T cell receptor complex(GO:0042101) |
| 0.1 | 0.6 | GO:0070081 | clathrin-sculpted monoamine transport vesicle(GO:0070081) clathrin-sculpted monoamine transport vesicle membrane(GO:0070083) |
| 0.1 | 1.4 | GO:0031932 | TORC2 complex(GO:0031932) |
| 0.1 | 1.1 | GO:0001518 | voltage-gated sodium channel complex(GO:0001518) |
| 0.1 | 6.0 | GO:0005758 | mitochondrial intermembrane space(GO:0005758) |
| 0.1 | 0.9 | GO:0030673 | axolemma(GO:0030673) |
| 0.1 | 0.3 | GO:0000333 | telomerase catalytic core complex(GO:0000333) |
| 0.1 | 0.8 | GO:0032300 | mismatch repair complex(GO:0032300) |
| 0.1 | 2.5 | GO:0005859 | muscle myosin complex(GO:0005859) |
| 0.1 | 2.7 | GO:0048786 | presynaptic active zone(GO:0048786) |
| 0.1 | 0.5 | GO:0098862 | cluster of actin-based cell projections(GO:0098862) |
| 0.1 | 7.7 | GO:0030018 | Z disc(GO:0030018) |
| 0.1 | 2.8 | GO:0005902 | microvillus(GO:0005902) |
| 0.1 | 0.5 | GO:0035068 | micro-ribonucleoprotein complex(GO:0035068) |
| 0.1 | 3.5 | GO:0001750 | photoreceptor outer segment(GO:0001750) |
| 0.1 | 0.8 | GO:0036019 | endolysosome(GO:0036019) |
| 0.1 | 4.2 | GO:0031410 | cytoplasmic vesicle(GO:0031410) intracellular vesicle(GO:0097708) |
| 0.1 | 1.1 | GO:0033202 | Ino80 complex(GO:0031011) DNA helicase complex(GO:0033202) |
| 0.1 | 6.4 | GO:0070160 | bicellular tight junction(GO:0005923) occluding junction(GO:0070160) |
| 0.0 | 1.4 | GO:0030136 | clathrin-coated vesicle(GO:0030136) |
| 0.0 | 1.2 | GO:0072686 | mitotic spindle(GO:0072686) |
| 0.0 | 1.5 | GO:0005796 | Golgi lumen(GO:0005796) |
| 0.0 | 16.4 | GO:0000790 | nuclear chromatin(GO:0000790) |
| 0.0 | 1.2 | GO:0031904 | endosome lumen(GO:0031904) |
| 0.0 | 2.8 | GO:0101003 | ficolin-1-rich granule membrane(GO:0101003) |
| 0.0 | 0.8 | GO:0005640 | nuclear outer membrane(GO:0005640) |
| 0.0 | 1.1 | GO:0005685 | U1 snRNP(GO:0005685) |
| 0.0 | 1.7 | GO:0005801 | cis-Golgi network(GO:0005801) |
| 0.0 | 0.6 | GO:1904949 | cation-transporting ATPase complex(GO:0090533) ATPase dependent transmembrane transport complex(GO:0098533) ATPase complex(GO:1904949) |
| 0.0 | 1.4 | GO:0005834 | heterotrimeric G-protein complex(GO:0005834) |
| 0.0 | 0.1 | GO:0097224 | sperm connecting piece(GO:0097224) |
| 0.0 | 3.0 | GO:0022625 | cytosolic large ribosomal subunit(GO:0022625) |
| 0.0 | 1.4 | GO:0033116 | endoplasmic reticulum-Golgi intermediate compartment membrane(GO:0033116) |
| 0.0 | 0.8 | GO:0045095 | keratin filament(GO:0045095) |
| 0.0 | 1.1 | GO:0016459 | myosin complex(GO:0016459) |
| 0.0 | 0.4 | GO:0030864 | cortical actin cytoskeleton(GO:0030864) |
| 0.0 | 0.2 | GO:0033180 | proton-transporting V-type ATPase, V1 domain(GO:0033180) |
| 0.0 | 0.3 | GO:0030139 | endocytic vesicle(GO:0030139) |
| 0.0 | 2.0 | GO:0030666 | endocytic vesicle membrane(GO:0030666) |
| 0.0 | 0.4 | GO:0032421 | stereocilium bundle(GO:0032421) |
| 0.0 | 0.6 | GO:0000315 | organellar large ribosomal subunit(GO:0000315) mitochondrial large ribosomal subunit(GO:0005762) |
| 0.0 | 1.2 | GO:0005913 | cell-cell adherens junction(GO:0005913) |
| 0.0 | 0.2 | GO:0031235 | intrinsic component of the cytoplasmic side of the plasma membrane(GO:0031235) |
| 0.0 | 1.1 | GO:0005769 | early endosome(GO:0005769) |
| 0.0 | 0.3 | GO:0005921 | gap junction(GO:0005921) |
| 0.0 | 0.3 | GO:0005680 | anaphase-promoting complex(GO:0005680) |
| 0.0 | 0.5 | GO:0032588 | trans-Golgi network membrane(GO:0032588) |
| 0.0 | 0.8 | GO:0031225 | anchored component of membrane(GO:0031225) |
Gene overrepresentation in molecular_function category:
| Log-likelihood per target | Total log-likelihood | Term | Description |
|---|---|---|---|
| 5.8 | 34.5 | GO:0003796 | lysozyme activity(GO:0003796) |
| 5.6 | 5.6 | GO:0004031 | aldehyde oxidase activity(GO:0004031) |
| 4.6 | 27.7 | GO:0070892 | lipoteichoic acid receptor activity(GO:0070892) |
| 4.4 | 26.6 | GO:0004024 | alcohol dehydrogenase activity, zinc-dependent(GO:0004024) |
| 4.2 | 25.4 | GO:0030492 | hemoglobin binding(GO:0030492) |
| 3.9 | 15.8 | GO:0032395 | MHC class II receptor activity(GO:0032395) |
| 3.8 | 3.8 | GO:0070052 | collagen V binding(GO:0070052) |
| 3.2 | 176.4 | GO:0034987 | immunoglobulin receptor binding(GO:0034987) |
| 3.0 | 29.9 | GO:0005094 | Rho GDP-dissociation inhibitor activity(GO:0005094) |
| 2.9 | 548.4 | GO:0003823 | antigen binding(GO:0003823) |
| 2.6 | 13.2 | GO:1990430 | extracellular matrix protein binding(GO:1990430) |
| 2.3 | 2.3 | GO:0042289 | MHC class II protein binding(GO:0042289) |
| 2.2 | 6.6 | GO:0046848 | hydroxyapatite binding(GO:0046848) |
| 2.1 | 10.6 | GO:0060230 | lipoprotein lipase activator activity(GO:0060230) |
| 1.9 | 5.7 | GO:0015403 | thiamine transmembrane transporter activity(GO:0015234) thiamine uptake transmembrane transporter activity(GO:0015403) |
| 1.8 | 7.3 | GO:0030760 | nicotinamide N-methyltransferase activity(GO:0008112) pyridine N-methyltransferase activity(GO:0030760) |
| 1.8 | 5.3 | GO:0016019 | peptidoglycan receptor activity(GO:0016019) |
| 1.7 | 5.2 | GO:0030343 | vitamin D3 25-hydroxylase activity(GO:0030343) vitamin D 25-hydroxylase activity(GO:0070643) |
| 1.7 | 5.1 | GO:0047150 | betaine-homocysteine S-methyltransferase activity(GO:0047150) |
| 1.7 | 8.4 | GO:0004995 | tachykinin receptor activity(GO:0004995) |
| 1.6 | 8.1 | GO:0048248 | CXCR3 chemokine receptor binding(GO:0048248) |
| 1.6 | 12.9 | GO:0004064 | arylesterase activity(GO:0004064) |
| 1.6 | 113.2 | GO:0050840 | extracellular matrix binding(GO:0050840) |
| 1.5 | 9.0 | GO:0010997 | anaphase-promoting complex binding(GO:0010997) |
| 1.4 | 4.2 | GO:1904455 | ubiquitin-specific protease activity involved in negative regulation of ERAD pathway(GO:1904455) |
| 1.4 | 17.7 | GO:0097371 | MDM2/MDM4 family protein binding(GO:0097371) |
| 1.3 | 14.8 | GO:0031419 | cobalamin binding(GO:0031419) |
| 1.3 | 10.3 | GO:1990932 | 5.8S rRNA binding(GO:1990932) |
| 1.3 | 17.7 | GO:0048407 | platelet-derived growth factor binding(GO:0048407) |
| 1.2 | 3.7 | GO:0004833 | tryptophan 2,3-dioxygenase activity(GO:0004833) |
| 1.2 | 3.5 | GO:0015222 | serotonin transmembrane transporter activity(GO:0015222) |
| 1.2 | 4.6 | GO:0042132 | fructose 1,6-bisphosphate 1-phosphatase activity(GO:0042132) |
| 1.1 | 6.9 | GO:0003873 | 6-phosphofructo-2-kinase activity(GO:0003873) fructose-2,6-bisphosphate 2-phosphatase activity(GO:0004331) |
| 1.1 | 3.2 | GO:0003865 | 3-oxo-5-alpha-steroid 4-dehydrogenase activity(GO:0003865) steroid dehydrogenase activity, acting on the CH-CH group of donors(GO:0033765) cholestenone 5-alpha-reductase activity(GO:0047751) |
| 1.0 | 3.1 | GO:0003976 | UDP-N-acetylglucosamine-lysosomal-enzyme N-acetylglucosaminephosphotransferase activity(GO:0003976) |
| 1.0 | 12.8 | GO:0001087 | transcription factor activity, sequence-specific DNA binding, RNA polymerase recruiting(GO:0001011) transcription factor activity, TFIIB-class binding(GO:0001087) |
| 1.0 | 2.9 | GO:0047275 | glucosaminylgalactosylglucosylceramide beta-galactosyltransferase activity(GO:0047275) |
| 1.0 | 3.8 | GO:0005477 | pyruvate secondary active transmembrane transporter activity(GO:0005477) |
| 1.0 | 20.9 | GO:0043395 | heparan sulfate proteoglycan binding(GO:0043395) |
| 0.9 | 9.5 | GO:0047498 | calcium-dependent phospholipase A2 activity(GO:0047498) |
| 0.9 | 2.8 | GO:0034584 | piRNA binding(GO:0034584) |
| 0.9 | 17.6 | GO:0005068 | transmembrane receptor protein tyrosine kinase adaptor activity(GO:0005068) |
| 0.9 | 3.6 | GO:0030899 | calcium-dependent ATPase activity(GO:0030899) |
| 0.9 | 2.7 | GO:0017082 | mineralocorticoid receptor activity(GO:0017082) |
| 0.9 | 2.7 | GO:0097258 | tocopherol omega-hydroxylase activity(GO:0052870) alpha-tocopherol omega-hydroxylase activity(GO:0052871) 20-hydroxy-leukotriene B4 omega oxidase activity(GO:0097258) 20-aldehyde-leukotriene B4 20-monooxygenase activity(GO:0097259) |
| 0.9 | 5.3 | GO:0047086 | phenanthrene 9,10-monooxygenase activity(GO:0018636) ketosteroid monooxygenase activity(GO:0047086) trans-1,2-dihydrobenzene-1,2-diol dehydrogenase activity(GO:0047115) |
| 0.9 | 9.7 | GO:0001758 | retinal dehydrogenase activity(GO:0001758) |
| 0.9 | 8.6 | GO:0070492 | oligosaccharide binding(GO:0070492) |
| 0.8 | 2.5 | GO:0034875 | oxidoreductase activity, acting on CH or CH2 groups, quinone or similar compound as acceptor(GO:0033695) caffeine oxidase activity(GO:0034875) |
| 0.8 | 12.4 | GO:0015643 | toxic substance binding(GO:0015643) |
| 0.8 | 2.5 | GO:0017129 | triglyceride binding(GO:0017129) |
| 0.8 | 4.1 | GO:0004982 | N-formyl peptide receptor activity(GO:0004982) |
| 0.8 | 5.6 | GO:0004035 | alkaline phosphatase activity(GO:0004035) |
| 0.8 | 19.8 | GO:0004806 | triglyceride lipase activity(GO:0004806) |
| 0.8 | 2.4 | GO:0033300 | dehydroascorbic acid transporter activity(GO:0033300) |
| 0.8 | 38.1 | GO:0004984 | olfactory receptor activity(GO:0004984) |
| 0.8 | 9.8 | GO:0070330 | aromatase activity(GO:0070330) |
| 0.7 | 2.9 | GO:0005277 | acetylcholine transmembrane transporter activity(GO:0005277) secondary active organic cation transmembrane transporter activity(GO:0008513) acetate ester transmembrane transporter activity(GO:1901375) |
| 0.7 | 8.3 | GO:0001968 | fibronectin binding(GO:0001968) |
| 0.7 | 2.0 | GO:0003863 | alpha-ketoacid dehydrogenase activity(GO:0003826) 3-methyl-2-oxobutanoate dehydrogenase (2-methylpropanoyl-transferring) activity(GO:0003863) |
| 0.7 | 3.3 | GO:0004468 | lysine N-acetyltransferase activity, acting on acetyl phosphate as donor(GO:0004468) |
| 0.6 | 5.6 | GO:0004875 | complement receptor activity(GO:0004875) |
| 0.6 | 6.8 | GO:0005344 | oxygen transporter activity(GO:0005344) |
| 0.6 | 3.1 | GO:0000179 | rRNA (adenine-N6,N6-)-dimethyltransferase activity(GO:0000179) |
| 0.6 | 1.8 | GO:0035673 | oligopeptide transmembrane transporter activity(GO:0035673) |
| 0.6 | 7.8 | GO:0030215 | semaphorin receptor binding(GO:0030215) |
| 0.6 | 6.5 | GO:0051434 | BH3 domain binding(GO:0051434) |
| 0.6 | 4.6 | GO:0042910 | xenobiotic-transporting ATPase activity(GO:0008559) xenobiotic transporter activity(GO:0042910) |
| 0.6 | 5.1 | GO:0005025 | transforming growth factor beta receptor activity, type I(GO:0005025) |
| 0.6 | 2.8 | GO:0004647 | phosphoserine phosphatase activity(GO:0004647) |
| 0.6 | 5.0 | GO:0004321 | fatty-acyl-CoA synthase activity(GO:0004321) |
| 0.6 | 2.8 | GO:0015204 | urea transmembrane transporter activity(GO:0015204) |
| 0.6 | 2.2 | GO:0016841 | ammonia-lyase activity(GO:0016841) |
| 0.6 | 3.9 | GO:0004185 | serine-type carboxypeptidase activity(GO:0004185) |
| 0.5 | 2.2 | GO:0047391 | alkylglycerophosphoethanolamine phosphodiesterase activity(GO:0047391) |
| 0.5 | 1.6 | GO:0005150 | interleukin-1, Type I receptor binding(GO:0005150) |
| 0.5 | 1.6 | GO:0015018 | galactosylgalactosylxylosylprotein 3-beta-glucuronosyltransferase activity(GO:0015018) |
| 0.5 | 1.6 | GO:0061663 | NEDD8 ligase activity(GO:0061663) |
| 0.5 | 3.2 | GO:0003998 | acylphosphatase activity(GO:0003998) |
| 0.5 | 1.6 | GO:0086062 | voltage-gated sodium channel activity involved in Purkinje myocyte action potential(GO:0086062) |
| 0.5 | 2.0 | GO:0070290 | N-acylphosphatidylethanolamine-specific phospholipase D activity(GO:0070290) |
| 0.5 | 1.5 | GO:0015361 | low-affinity sodium:dicarboxylate symporter activity(GO:0015361) |
| 0.5 | 2.0 | GO:0070653 | high-density lipoprotein particle receptor binding(GO:0070653) |
| 0.5 | 14.9 | GO:0004181 | metallocarboxypeptidase activity(GO:0004181) |
| 0.5 | 2.5 | GO:0015111 | iodide transmembrane transporter activity(GO:0015111) |
| 0.5 | 2.4 | GO:0001010 | transcription factor activity, sequence-specific DNA binding transcription factor recruiting(GO:0001010) |
| 0.5 | 1.5 | GO:0001596 | angiotensin type I receptor activity(GO:0001596) |
| 0.5 | 12.0 | GO:0016769 | transferase activity, transferring nitrogenous groups(GO:0016769) |
| 0.5 | 2.8 | GO:0036312 | phosphatidylinositol 3-kinase regulatory subunit binding(GO:0036312) |
| 0.5 | 1.4 | GO:0004087 | carbamoyl-phosphate synthase (ammonia) activity(GO:0004087) carbamoyl-phosphate synthase (glutamine-hydrolyzing) activity(GO:0004088) |
| 0.5 | 2.3 | GO:0003910 | DNA ligase (ATP) activity(GO:0003910) |
| 0.5 | 0.9 | GO:0005137 | interleukin-5 receptor binding(GO:0005137) |
| 0.5 | 12.2 | GO:0008093 | cytoskeletal adaptor activity(GO:0008093) |
| 0.4 | 2.2 | GO:0047184 | 1-acylglycerophosphocholine O-acyltransferase activity(GO:0047184) |
| 0.4 | 3.5 | GO:0001871 | pattern binding(GO:0001871) polysaccharide binding(GO:0030247) |
| 0.4 | 8.3 | GO:0031698 | beta-2 adrenergic receptor binding(GO:0031698) |
| 0.4 | 3.0 | GO:0050294 | steroid sulfotransferase activity(GO:0050294) |
| 0.4 | 3.0 | GO:0016713 | oxidoreductase activity, acting on paired donors, with incorporation or reduction of molecular oxygen, reduced iron-sulfur protein as one donor, and incorporation of one atom of oxygen(GO:0016713) |
| 0.4 | 18.4 | GO:0008009 | chemokine activity(GO:0008009) |
| 0.4 | 1.7 | GO:0008508 | bile acid:sodium symporter activity(GO:0008508) |
| 0.4 | 1.7 | GO:0004657 | proline dehydrogenase activity(GO:0004657) |
| 0.4 | 4.2 | GO:0008391 | arachidonic acid monooxygenase activity(GO:0008391) arachidonic acid epoxygenase activity(GO:0008392) |
| 0.4 | 1.2 | GO:0035379 | carbon dioxide transmembrane transporter activity(GO:0035379) |
| 0.4 | 7.7 | GO:0003708 | retinoic acid receptor activity(GO:0003708) |
| 0.4 | 5.2 | GO:0036122 | BMP binding(GO:0036122) |
| 0.4 | 2.3 | GO:0004447 | iodide peroxidase activity(GO:0004447) |
| 0.4 | 1.5 | GO:0097603 | temperature-gated ion channel activity(GO:0097603) |
| 0.4 | 3.4 | GO:0004499 | N,N-dimethylaniline monooxygenase activity(GO:0004499) |
| 0.4 | 1.9 | GO:0047045 | testosterone 17-beta-dehydrogenase (NADP+) activity(GO:0047045) |
| 0.4 | 1.1 | GO:0005260 | channel-conductance-controlling ATPase activity(GO:0005260) |
| 0.4 | 2.9 | GO:0004652 | polynucleotide adenylyltransferase activity(GO:0004652) |
| 0.4 | 2.9 | GO:0016413 | O-acetyltransferase activity(GO:0016413) |
| 0.4 | 4.2 | GO:0008429 | phosphatidylethanolamine binding(GO:0008429) |
| 0.3 | 4.9 | GO:0048018 | receptor agonist activity(GO:0048018) |
| 0.3 | 4.2 | GO:0047372 | acylglycerol lipase activity(GO:0047372) |
| 0.3 | 1.3 | GO:0004346 | glucose-6-phosphatase activity(GO:0004346) sugar-terminal-phosphatase activity(GO:0050309) |
| 0.3 | 6.0 | GO:0038187 | signaling pattern recognition receptor activity(GO:0008329) pattern recognition receptor activity(GO:0038187) |
| 0.3 | 3.4 | GO:0001042 | RNA polymerase I core binding(GO:0001042) |
| 0.3 | 1.6 | GO:0030628 | pre-mRNA 3'-splice site binding(GO:0030628) |
| 0.3 | 1.2 | GO:0016635 | oxidoreductase activity, acting on the CH-CH group of donors, quinone or related compound as acceptor(GO:0016635) |
| 0.3 | 2.1 | GO:0005324 | long-chain fatty acid transporter activity(GO:0005324) |
| 0.3 | 1.8 | GO:0035800 | deubiquitinase activator activity(GO:0035800) |
| 0.3 | 3.8 | GO:0019957 | C-C chemokine binding(GO:0019957) |
| 0.3 | 1.2 | GO:0000822 | inositol hexakisphosphate binding(GO:0000822) |
| 0.3 | 6.7 | GO:0005523 | tropomyosin binding(GO:0005523) |
| 0.3 | 3.7 | GO:0015377 | cation:chloride symporter activity(GO:0015377) |
| 0.3 | 2.7 | GO:0004568 | chitinase activity(GO:0004568) chitin binding(GO:0008061) |
| 0.3 | 1.8 | GO:0004996 | thyroid-stimulating hormone receptor activity(GO:0004996) |
| 0.3 | 2.6 | GO:0003696 | satellite DNA binding(GO:0003696) |
| 0.3 | 1.5 | GO:0008310 | single-stranded DNA 3'-5' exodeoxyribonuclease activity(GO:0008310) |
| 0.2 | 1.0 | GO:0052590 | sn-glycerol-3-phosphate:ubiquinone oxidoreductase activity(GO:0052590) sn-glycerol-3-phosphate:ubiquinone-8 oxidoreductase activity(GO:0052591) |
| 0.2 | 4.4 | GO:0102391 | decanoate--CoA ligase activity(GO:0102391) |
| 0.2 | 1.7 | GO:0043225 | anion transmembrane-transporting ATPase activity(GO:0043225) |
| 0.2 | 1.4 | GO:0052650 | NADP-retinol dehydrogenase activity(GO:0052650) |
| 0.2 | 1.7 | GO:0001093 | TFIIB-class transcription factor binding(GO:0001093) |
| 0.2 | 1.2 | GO:0004925 | prolactin receptor activity(GO:0004925) |
| 0.2 | 1.2 | GO:0004974 | leukotriene receptor activity(GO:0004974) |
| 0.2 | 3.3 | GO:1902282 | voltage-gated potassium channel activity involved in ventricular cardiac muscle cell action potential repolarization(GO:1902282) |
| 0.2 | 1.2 | GO:0016427 | tRNA (cytosine) methyltransferase activity(GO:0016427) |
| 0.2 | 1.6 | GO:0008142 | oxysterol binding(GO:0008142) |
| 0.2 | 2.4 | GO:0008253 | 5'-nucleotidase activity(GO:0008253) |
| 0.2 | 2.5 | GO:0032393 | MHC class I receptor activity(GO:0032393) |
| 0.2 | 1.9 | GO:0047623 | AMP deaminase activity(GO:0003876) adenosine-phosphate deaminase activity(GO:0047623) |
| 0.2 | 11.7 | GO:0005518 | collagen binding(GO:0005518) |
| 0.2 | 2.6 | GO:0015279 | store-operated calcium channel activity(GO:0015279) |
| 0.2 | 5.8 | GO:0050664 | oxidoreductase activity, acting on NAD(P)H, oxygen as acceptor(GO:0050664) |
| 0.2 | 3.5 | GO:0001054 | RNA polymerase I activity(GO:0001054) |
| 0.2 | 1.2 | GO:0043141 | ATP-dependent 5'-3' DNA helicase activity(GO:0043141) |
| 0.2 | 3.9 | GO:0008331 | high voltage-gated calcium channel activity(GO:0008331) |
| 0.2 | 2.1 | GO:0035381 | extracellular ATP-gated cation channel activity(GO:0004931) ATP-gated ion channel activity(GO:0035381) |
| 0.2 | 3.5 | GO:0003857 | 3-hydroxyacyl-CoA dehydrogenase activity(GO:0003857) |
| 0.2 | 2.9 | GO:0015467 | G-protein activated inward rectifier potassium channel activity(GO:0015467) |
| 0.2 | 1.1 | GO:0015057 | thrombin receptor activity(GO:0015057) |
| 0.2 | 19.3 | GO:0004867 | serine-type endopeptidase inhibitor activity(GO:0004867) |
| 0.2 | 3.1 | GO:0005537 | mannose binding(GO:0005537) |
| 0.2 | 9.0 | GO:0051539 | 4 iron, 4 sulfur cluster binding(GO:0051539) |
| 0.2 | 19.8 | GO:0004222 | metalloendopeptidase activity(GO:0004222) |
| 0.2 | 1.7 | GO:0005007 | fibroblast growth factor-activated receptor activity(GO:0005007) |
| 0.2 | 3.1 | GO:0019992 | diacylglycerol binding(GO:0019992) |
| 0.2 | 2.4 | GO:0016646 | oxidoreductase activity, acting on the CH-NH group of donors, NAD or NADP as acceptor(GO:0016646) |
| 0.2 | 1.0 | GO:0004522 | ribonuclease A activity(GO:0004522) |
| 0.2 | 0.8 | GO:0017159 | pantetheine hydrolase activity(GO:0017159) |
| 0.2 | 5.6 | GO:0005044 | scavenger receptor activity(GO:0005044) |
| 0.2 | 1.1 | GO:0035614 | snRNA stem-loop binding(GO:0035614) |
| 0.2 | 0.8 | GO:0004692 | cGMP-dependent protein kinase activity(GO:0004692) |
| 0.2 | 4.3 | GO:0005104 | fibroblast growth factor receptor binding(GO:0005104) |
| 0.2 | 2.0 | GO:0001530 | lipopolysaccharide binding(GO:0001530) |
| 0.2 | 2.5 | GO:0004143 | diacylglycerol kinase activity(GO:0004143) |
| 0.1 | 7.1 | GO:0015485 | cholesterol binding(GO:0015485) sterol binding(GO:0032934) |
| 0.1 | 12.9 | GO:0008307 | structural constituent of muscle(GO:0008307) |
| 0.1 | 0.6 | GO:0035243 | protein-arginine omega-N symmetric methyltransferase activity(GO:0035243) |
| 0.1 | 3.8 | GO:0070742 | C2H2 zinc finger domain binding(GO:0070742) |
| 0.1 | 1.5 | GO:0043855 | intracellular cyclic nucleotide activated cation channel activity(GO:0005221) cyclic nucleotide-gated ion channel activity(GO:0043855) |
| 0.1 | 3.7 | GO:0031683 | G-protein beta/gamma-subunit complex binding(GO:0031683) |
| 0.1 | 1.1 | GO:0015349 | thyroid hormone transmembrane transporter activity(GO:0015349) |
| 0.1 | 0.4 | GO:0004914 | interleukin-5 receptor activity(GO:0004914) |
| 0.1 | 1.3 | GO:0004579 | dolichyl-diphosphooligosaccharide-protein glycotransferase activity(GO:0004579) |
| 0.1 | 2.0 | GO:0008190 | eukaryotic initiation factor 4E binding(GO:0008190) |
| 0.1 | 0.7 | GO:0034046 | poly(G) binding(GO:0034046) |
| 0.1 | 14.7 | GO:0008201 | heparin binding(GO:0008201) |
| 0.1 | 0.9 | GO:0015501 | glutamate:sodium symporter activity(GO:0015501) |
| 0.1 | 3.3 | GO:0005001 | transmembrane receptor protein tyrosine phosphatase activity(GO:0005001) transmembrane receptor protein phosphatase activity(GO:0019198) |
| 0.1 | 2.8 | GO:0004707 | MAP kinase activity(GO:0004707) |
| 0.1 | 0.4 | GO:0098770 | FBXO family protein binding(GO:0098770) |
| 0.1 | 0.8 | GO:0052739 | phosphatidylserine 1-acylhydrolase activity(GO:0052739) |
| 0.1 | 8.2 | GO:0005201 | extracellular matrix structural constituent(GO:0005201) |
| 0.1 | 0.7 | GO:0004749 | ribose phosphate diphosphokinase activity(GO:0004749) |
| 0.1 | 3.6 | GO:0008188 | neuropeptide receptor activity(GO:0008188) |
| 0.1 | 2.0 | GO:0004062 | aryl sulfotransferase activity(GO:0004062) |
| 0.1 | 0.2 | GO:0019959 | interleukin-8 binding(GO:0019959) |
| 0.1 | 5.6 | GO:0004364 | glutathione transferase activity(GO:0004364) |
| 0.1 | 1.6 | GO:0002162 | dystroglycan binding(GO:0002162) |
| 0.1 | 1.6 | GO:0003785 | actin monomer binding(GO:0003785) |
| 0.1 | 0.3 | GO:0001665 | alpha-N-acetylgalactosaminide alpha-2,6-sialyltransferase activity(GO:0001665) |
| 0.1 | 1.3 | GO:0005092 | GDP-dissociation inhibitor activity(GO:0005092) |
| 0.1 | 1.9 | GO:0004033 | aldo-keto reductase (NADP) activity(GO:0004033) |
| 0.1 | 0.8 | GO:0004000 | adenosine deaminase activity(GO:0004000) |
| 0.1 | 11.8 | GO:0005179 | hormone activity(GO:0005179) |
| 0.1 | 2.3 | GO:0001965 | G-protein alpha-subunit binding(GO:0001965) |
| 0.1 | 5.0 | GO:0005246 | calcium channel regulator activity(GO:0005246) |
| 0.1 | 1.8 | GO:0005248 | voltage-gated sodium channel activity(GO:0005248) voltage-gated ion channel activity involved in regulation of postsynaptic membrane potential(GO:1905030) |
| 0.1 | 0.8 | GO:0086083 | cell adhesive protein binding involved in bundle of His cell-Purkinje myocyte communication(GO:0086083) |
| 0.1 | 2.4 | GO:0001223 | transcription coactivator binding(GO:0001223) |
| 0.1 | 0.5 | GO:0008381 | mechanically-gated ion channel activity(GO:0008381) mechanically gated channel activity(GO:0022833) |
| 0.1 | 1.0 | GO:0004415 | hyalurononglucosaminidase activity(GO:0004415) |
| 0.1 | 3.2 | GO:0004890 | GABA-A receptor activity(GO:0004890) |
| 0.1 | 0.4 | GO:1904929 | coreceptor activity involved in Wnt signaling pathway, planar cell polarity pathway(GO:1904929) |
| 0.1 | 5.0 | GO:0019843 | rRNA binding(GO:0019843) |
| 0.1 | 4.0 | GO:0051879 | Hsp90 protein binding(GO:0051879) |
| 0.1 | 0.5 | GO:0086075 | gap junction channel activity involved in cardiac conduction electrical coupling(GO:0086075) |
| 0.1 | 0.8 | GO:0001075 | transcription factor activity, RNA polymerase II core promoter sequence-specific binding involved in preinitiation complex assembly(GO:0001075) |
| 0.1 | 1.8 | GO:0034237 | protein kinase A regulatory subunit binding(GO:0034237) |
| 0.1 | 0.6 | GO:0030280 | structural constituent of epidermis(GO:0030280) |
| 0.1 | 0.9 | GO:0031545 | peptidyl-proline 4-dioxygenase activity(GO:0031545) |
| 0.1 | 0.7 | GO:0004969 | histamine receptor activity(GO:0004969) |
| 0.1 | 0.7 | GO:0008395 | steroid hydroxylase activity(GO:0008395) |
| 0.1 | 1.3 | GO:0042813 | Wnt-activated receptor activity(GO:0042813) |
| 0.1 | 0.6 | GO:0030976 | thiamine pyrophosphate binding(GO:0030976) |
| 0.1 | 1.2 | GO:0098641 | cadherin binding involved in cell-cell adhesion(GO:0098641) |
| 0.1 | 1.0 | GO:0004559 | alpha-mannosidase activity(GO:0004559) mannosidase activity(GO:0015923) |
| 0.1 | 0.2 | GO:0000405 | bubble DNA binding(GO:0000405) |
| 0.0 | 0.2 | GO:0002046 | opsin binding(GO:0002046) |
| 0.0 | 1.7 | GO:0000146 | microfilament motor activity(GO:0000146) |
| 0.0 | 2.8 | GO:0005254 | chloride channel activity(GO:0005254) |
| 0.0 | 0.4 | GO:0015926 | glucosidase activity(GO:0015926) |
| 0.0 | 0.3 | GO:0015245 | fatty acid transporter activity(GO:0015245) |
| 0.0 | 1.0 | GO:0000217 | DNA secondary structure binding(GO:0000217) |
| 0.0 | 0.7 | GO:0019840 | isoprenoid binding(GO:0019840) |
| 0.0 | 1.8 | GO:0001102 | RNA polymerase II activating transcription factor binding(GO:0001102) |
| 0.0 | 0.6 | GO:0016813 | hydrolase activity, acting on carbon-nitrogen (but not peptide) bonds, in linear amidines(GO:0016813) |
| 0.0 | 0.4 | GO:0016857 | racemase and epimerase activity, acting on carbohydrates and derivatives(GO:0016857) |
| 0.0 | 0.2 | GO:0060072 | large conductance calcium-activated potassium channel activity(GO:0060072) |
| 0.0 | 0.4 | GO:0035251 | UDP-glucosyltransferase activity(GO:0035251) |
| 0.0 | 0.6 | GO:0004861 | cyclin-dependent protein serine/threonine kinase inhibitor activity(GO:0004861) |
| 0.0 | 1.0 | GO:0005031 | tumor necrosis factor-activated receptor activity(GO:0005031) death receptor activity(GO:0005035) |
| 0.0 | 0.5 | GO:0005310 | dicarboxylic acid transmembrane transporter activity(GO:0005310) |
| 0.0 | 0.1 | GO:0032027 | myosin light chain binding(GO:0032027) |
| 0.0 | 0.1 | GO:0008271 | secondary active sulfate transmembrane transporter activity(GO:0008271) |
| 0.0 | 3.0 | GO:0005089 | Rho guanyl-nucleotide exchange factor activity(GO:0005089) |
| 0.0 | 1.3 | GO:0061631 | ubiquitin conjugating enzyme activity(GO:0061631) |
| 0.0 | 0.2 | GO:0072349 | modified amino acid transmembrane transporter activity(GO:0072349) |
| 0.0 | 1.6 | GO:0030276 | clathrin binding(GO:0030276) |
| 0.0 | 0.2 | GO:0030274 | LIM domain binding(GO:0030274) |
| 0.0 | 0.5 | GO:0005109 | frizzled binding(GO:0005109) |
| 0.0 | 0.5 | GO:0035198 | miRNA binding(GO:0035198) |
| 0.0 | 0.9 | GO:0043027 | cysteine-type endopeptidase inhibitor activity involved in apoptotic process(GO:0043027) |
| 0.0 | 0.0 | GO:0034714 | type III transforming growth factor beta receptor binding(GO:0034714) |
| 0.0 | 0.3 | GO:0001206 | transcriptional repressor activity, RNA polymerase II distal enhancer sequence-specific binding(GO:0001206) |
| 0.0 | 0.4 | GO:0005544 | calcium-dependent phospholipid binding(GO:0005544) |
| 0.0 | 0.2 | GO:0048156 | tau protein binding(GO:0048156) |
| 0.0 | 3.4 | GO:0008236 | serine-type peptidase activity(GO:0008236) |
| 0.0 | 0.4 | GO:0003746 | translation elongation factor activity(GO:0003746) |
| 0.0 | 0.2 | GO:0005078 | MAP-kinase scaffold activity(GO:0005078) |
| 0.0 | 1.1 | GO:0004714 | transmembrane receptor protein tyrosine kinase activity(GO:0004714) |
| 0.0 | 2.1 | GO:0008083 | growth factor activity(GO:0008083) |
| 0.0 | 0.3 | GO:0003995 | acyl-CoA dehydrogenase activity(GO:0003995) |
| 0.0 | 0.1 | GO:0001591 | dopamine neurotransmitter receptor activity, coupled via Gi/Go(GO:0001591) |
| 0.0 | 0.2 | GO:0048020 | CCR chemokine receptor binding(GO:0048020) |
| 0.0 | 4.6 | GO:0003714 | transcription corepressor activity(GO:0003714) |
| 0.0 | 0.0 | GO:0031433 | telethonin binding(GO:0031433) |
| 0.0 | 1.1 | GO:0005178 | integrin binding(GO:0005178) |
| 0.0 | 0.4 | GO:0001077 | transcriptional activator activity, RNA polymerase II core promoter proximal region sequence-specific binding(GO:0001077) |
| 0.0 | 0.1 | GO:0004800 | thyroxine 5'-deiodinase activity(GO:0004800) |
| 0.0 | 1.7 | GO:0017137 | Rab GTPase binding(GO:0017137) |
Gene overrepresentation in C2:CP category:
| Log-likelihood per target | Total log-likelihood | Term | Description |
|---|---|---|---|
| 2.4 | 135.0 | NABA PROTEOGLYCANS | Genes encoding proteoglycans |
| 0.7 | 18.1 | SA REG CASCADE OF CYCLIN EXPR | Expression of cyclins regulates progression through the cell cycle by activating cyclin-dependent kinases. |
| 0.4 | 54.8 | PID CMYB PATHWAY | C-MYB transcription factor network |
| 0.4 | 2.9 | PID PDGFRA PATHWAY | PDGFR-alpha signaling pathway |
| 0.4 | 16.0 | SA B CELL RECEPTOR COMPLEXES | Antigen binding to B cell receptors activates protein tyrosine kinases, such as the Src family, which ultimate activate MAP kinases. |
| 0.4 | 17.9 | NABA COLLAGENS | Genes encoding collagen proteins |
| 0.4 | 3.7 | ST JAK STAT PATHWAY | Jak-STAT Pathway |
| 0.4 | 26.6 | PID RHOA REG PATHWAY | Regulation of RhoA activity |
| 0.3 | 4.7 | ST INTEGRIN SIGNALING PATHWAY | Integrin Signaling Pathway |
| 0.3 | 18.9 | PID HNF3B PATHWAY | FOXA2 and FOXA3 transcription factor networks |
| 0.3 | 63.4 | NABA CORE MATRISOME | Ensemble of genes encoding core extracellular matrix including ECM glycoproteins, collagens and proteoglycans |
| 0.2 | 14.4 | PID HNF3A PATHWAY | FOXA1 transcription factor network |
| 0.2 | 2.8 | ST ADRENERGIC | Adrenergic Pathway |
| 0.2 | 36.0 | NABA ECM AFFILIATED | Genes encoding proteins affiliated structurally or functionally to extracellular matrix proteins |
| 0.2 | 52.1 | NABA ECM REGULATORS | Genes encoding enzymes and their regulators involved in the remodeling of the extracellular matrix |
| 0.2 | 14.7 | PID TAP63 PATHWAY | Validated transcriptional targets of TAp63 isoforms |
| 0.2 | 4.1 | PID ARF 3PATHWAY | Arf1 pathway |
| 0.2 | 5.6 | SIG BCR SIGNALING PATHWAY | Members of the BCR signaling pathway |
| 0.2 | 1.3 | PID IL5 PATHWAY | IL5-mediated signaling events |
| 0.2 | 2.1 | SA TRKA RECEPTOR | The TrkA receptor binds nerve growth factor to activate MAP kinase pathways and promote cell growth. |
| 0.2 | 8.2 | PID CXCR3 PATHWAY | CXCR3-mediated signaling events |
| 0.2 | 2.6 | PID THROMBIN PAR4 PATHWAY | PAR4-mediated thrombin signaling events |
| 0.2 | 4.2 | PID TOLL ENDOGENOUS PATHWAY | Endogenous TLR signaling |
| 0.2 | 6.2 | ST MYOCYTE AD PATHWAY | Myocyte Adrenergic Pathway is a specific case of the generalized Adrenergic Pathway. |
| 0.2 | 2.8 | PID EPHRINB REV PATHWAY | Ephrin B reverse signaling |
| 0.2 | 2.2 | PID CXCR4 PATHWAY | CXCR4-mediated signaling events |
| 0.2 | 1.1 | PID HIF1A PATHWAY | Hypoxic and oxygen homeostasis regulation of HIF-1-alpha |
| 0.2 | 1.5 | PID TCR JNK PATHWAY | JNK signaling in the CD4+ TCR pathway |
| 0.1 | 2.6 | PID P73PATHWAY | p73 transcription factor network |
| 0.1 | 6.9 | PID PLK1 PATHWAY | PLK1 signaling events |
| 0.1 | 1.5 | ST TYPE I INTERFERON PATHWAY | Type I Interferon (alpha/beta IFN) Pathway |
| 0.1 | 2.3 | PID INTEGRIN5 PATHWAY | Beta5 beta6 beta7 and beta8 integrin cell surface interactions |
| 0.1 | 3.7 | PID ERBB2 ERBB3 PATHWAY | ErbB2/ErbB3 signaling events |
| 0.1 | 3.1 | PID RAS PATHWAY | Regulation of Ras family activation |
| 0.1 | 2.2 | SA PROGRAMMED CELL DEATH | Programmed cell death, or apoptosis, eliminates damaged or unneeded cells. |
| 0.1 | 11.4 | PID AR PATHWAY | Coregulation of Androgen receptor activity |
| 0.1 | 1.7 | PID EPO PATHWAY | EPO signaling pathway |
| 0.1 | 2.3 | PID DNA PK PATHWAY | DNA-PK pathway in nonhomologous end joining |
| 0.1 | 0.4 | PID AR NONGENOMIC PATHWAY | Nongenotropic Androgen signaling |
| 0.1 | 4.6 | PID RAC1 REG PATHWAY | Regulation of RAC1 activity |
| 0.1 | 5.9 | PID PTP1B PATHWAY | Signaling events mediated by PTP1B |
| 0.1 | 2.5 | PID MAPK TRK PATHWAY | Trk receptor signaling mediated by the MAPK pathway |
| 0.1 | 2.1 | PID UPA UPAR PATHWAY | Urokinase-type plasminogen activator (uPA) and uPAR-mediated signaling |
| 0.1 | 1.5 | PID ER NONGENOMIC PATHWAY | Plasma membrane estrogen receptor signaling |
| 0.1 | 2.3 | PID KIT PATHWAY | Signaling events mediated by Stem cell factor receptor (c-Kit) |
| 0.1 | 3.2 | PID FGF PATHWAY | FGF signaling pathway |
| 0.1 | 3.3 | PID ARF6 PATHWAY | Arf6 signaling events |
| 0.1 | 2.7 | PID RHODOPSIN PATHWAY | Visual signal transduction: Rods |
| 0.1 | 3.6 | PID IL12 STAT4 PATHWAY | IL12 signaling mediated by STAT4 |
| 0.1 | 3.8 | PID AMB2 NEUTROPHILS PATHWAY | amb2 Integrin signaling |
| 0.1 | 1.0 | PID ERB GENOMIC PATHWAY | Validated nuclear estrogen receptor beta network |
| 0.1 | 2.4 | PID HIF2PATHWAY | HIF-2-alpha transcription factor network |
| 0.1 | 0.8 | PID TRAIL PATHWAY | TRAIL signaling pathway |
| 0.1 | 1.6 | PID SHP2 PATHWAY | SHP2 signaling |
| 0.1 | 0.2 | PID IL8 CXCR1 PATHWAY | IL8- and CXCR1-mediated signaling events |
| 0.1 | 0.9 | PID INTEGRIN A9B1 PATHWAY | Alpha9 beta1 integrin signaling events |
| 0.1 | 0.8 | ST GAQ PATHWAY | G alpha q Pathway |
| 0.1 | 1.0 | PID TXA2PATHWAY | Thromboxane A2 receptor signaling |
| 0.1 | 0.8 | SIG INSULIN RECEPTOR PATHWAY IN CARDIAC MYOCYTES | Genes related to the insulin receptor pathway |
| 0.0 | 1.2 | PID BCR 5PATHWAY | BCR signaling pathway |
| 0.0 | 1.2 | PID ENDOTHELIN PATHWAY | Endothelins |
| 0.0 | 1.0 | PID CIRCADIAN PATHWAY | Circadian rhythm pathway |
| 0.0 | 1.0 | ST TUMOR NECROSIS FACTOR PATHWAY | Tumor Necrosis Factor Pathway. |
| 0.0 | 1.6 | PID E2F PATHWAY | E2F transcription factor network |
| 0.0 | 1.6 | PID HIF1 TFPATHWAY | HIF-1-alpha transcription factor network |
| 0.0 | 0.8 | PID RXR VDR PATHWAY | RXR and RAR heterodimerization with other nuclear receptor |
| 0.0 | 0.5 | PID FRA PATHWAY | Validated transcriptional targets of AP1 family members Fra1 and Fra2 |
| 0.0 | 0.2 | PID P38 GAMMA DELTA PATHWAY | Signaling mediated by p38-gamma and p38-delta |
| 0.0 | 0.4 | PID WNT SIGNALING PATHWAY | Wnt signaling network |
| 0.0 | 4.7 | NABA MATRISOME ASSOCIATED | Ensemble of genes encoding ECM-associated proteins including ECM-affilaited proteins, ECM regulators and secreted factors |
Gene overrepresentation in C2:CP:REACTOME category:
| Log-likelihood per target | Total log-likelihood | Term | Description |
|---|---|---|---|
| 4.3 | 117.2 | REACTOME CS DS DEGRADATION | Genes involved in CS/DS degradation |
| 3.3 | 26.6 | REACTOME ETHANOL OXIDATION | Genes involved in Ethanol oxidation |
| 1.2 | 28.0 | REACTOME TRANSLOCATION OF ZAP 70 TO IMMUNOLOGICAL SYNAPSE | Genes involved in Translocation of ZAP-70 to Immunological synapse |
| 1.1 | 19.5 | REACTOME XENOBIOTICS | Genes involved in Xenobiotics |
| 0.8 | 12.6 | REACTOME ACYL CHAIN REMODELLING OF PG | Genes involved in Acyl chain remodelling of PG |
| 0.8 | 12.1 | REACTOME REVERSIBLE HYDRATION OF CARBON DIOXIDE | Genes involved in Reversible Hydration of Carbon Dioxide |
| 0.8 | 38.9 | REACTOME COMPLEMENT CASCADE | Genes involved in Complement cascade |
| 0.8 | 11.6 | REACTOME COMMON PATHWAY | Genes involved in Common Pathway |
| 0.7 | 37.9 | REACTOME OLFACTORY SIGNALING PATHWAY | Genes involved in Olfactory Signaling Pathway |
| 0.7 | 7.8 | REACTOME DIGESTION OF DIETARY CARBOHYDRATE | Genes involved in Digestion of dietary carbohydrate |
| 0.7 | 16.3 | REACTOME HDL MEDIATED LIPID TRANSPORT | Genes involved in HDL-mediated lipid transport |
| 0.5 | 10.4 | REACTOME TERMINATION OF O GLYCAN BIOSYNTHESIS | Genes involved in Termination of O-glycan biosynthesis |
| 0.5 | 42.6 | REACTOME AMYLOIDS | Genes involved in Amyloids |
| 0.4 | 7.2 | REACTOME TRAF6 MEDIATED INDUCTION OF TAK1 COMPLEX | Genes involved in TRAF6 mediated induction of TAK1 complex |
| 0.4 | 1.7 | REACTOME BINDING AND ENTRY OF HIV VIRION | Genes involved in Binding and entry of HIV virion |
| 0.4 | 1.7 | REACTOME BILE ACID AND BILE SALT METABOLISM | Genes involved in Bile acid and bile salt metabolism |
| 0.4 | 41.7 | REACTOME TRANSCRIPTIONAL REGULATION OF WHITE ADIPOCYTE DIFFERENTIATION | Genes involved in Transcriptional Regulation of White Adipocyte Differentiation |
| 0.4 | 8.6 | REACTOME SYNTHESIS SECRETION AND INACTIVATION OF GLP1 | Genes involved in Synthesis, Secretion, and Inactivation of Glucagon-like Peptide-1 (GLP-1) |
| 0.4 | 6.5 | REACTOME APOPTOTIC CLEAVAGE OF CELL ADHESION PROTEINS | Genes involved in Apoptotic cleavage of cell adhesion proteins |
| 0.4 | 3.2 | REACTOME FORMATION OF TRANSCRIPTION COUPLED NER TC NER REPAIR COMPLEX | Genes involved in Formation of transcription-coupled NER (TC-NER) repair complex |
| 0.4 | 5.4 | REACTOME BILE SALT AND ORGANIC ANION SLC TRANSPORTERS | Genes involved in Bile salt and organic anion SLC transporters |
| 0.4 | 3.2 | REACTOME ENDOSOMAL VACUOLAR PATHWAY | Genes involved in Endosomal/Vacuolar pathway |
| 0.3 | 4.9 | REACTOME ANDROGEN BIOSYNTHESIS | Genes involved in Androgen biosynthesis |
| 0.3 | 3.1 | REACTOME DOWNSTREAM SIGNALING EVENTS OF B CELL RECEPTOR BCR | Genes involved in Downstream Signaling Events Of B Cell Receptor (BCR) |
| 0.3 | 2.0 | REACTOME SIGNALING BY PDGF | Genes involved in Signaling by PDGF |
| 0.3 | 4.4 | REACTOME TRYPTOPHAN CATABOLISM | Genes involved in Tryptophan catabolism |
| 0.3 | 1.8 | REACTOME TRAF6 MEDIATED IRF7 ACTIVATION | Genes involved in TRAF6 mediated IRF7 activation |
| 0.3 | 5.3 | REACTOME REGULATION OF INSULIN SECRETION | Genes involved in Regulation of Insulin Secretion |
| 0.3 | 4.1 | REACTOME KERATAN SULFATE DEGRADATION | Genes involved in Keratan sulfate degradation |
| 0.3 | 10.4 | REACTOME REGULATION OF SIGNALING BY CBL | Genes involved in Regulation of signaling by CBL |
| 0.3 | 3.1 | REACTOME ABACAVIR TRANSPORT AND METABOLISM | Genes involved in Abacavir transport and metabolism |
| 0.3 | 17.0 | REACTOME NCAM1 INTERACTIONS | Genes involved in NCAM1 interactions |
| 0.3 | 2.4 | REACTOME GAMMA CARBOXYLATION TRANSPORT AND AMINO TERMINAL CLEAVAGE OF PROTEINS | Genes involved in Gamma-carboxylation, transport, and amino-terminal cleavage of proteins |
| 0.3 | 7.5 | REACTOME AMINE COMPOUND SLC TRANSPORTERS | Genes involved in Amine compound SLC transporters |
| 0.2 | 3.8 | REACTOME FGFR2C LIGAND BINDING AND ACTIVATION | Genes involved in FGFR2c ligand binding and activation |
| 0.2 | 12.2 | REACTOME SEMA4D IN SEMAPHORIN SIGNALING | Genes involved in Sema4D in semaphorin signaling |
| 0.2 | 14.1 | REACTOME CHEMOKINE RECEPTORS BIND CHEMOKINES | Genes involved in Chemokine receptors bind chemokines |
| 0.2 | 2.1 | REACTOME NEGATIVE REGULATION OF THE PI3K AKT NETWORK | Genes involved in Negative regulation of the PI3K/AKT network |
| 0.2 | 11.3 | REACTOME MYOGENESIS | Genes involved in Myogenesis |
| 0.2 | 2.6 | REACTOME ELEVATION OF CYTOSOLIC CA2 LEVELS | Genes involved in Elevation of cytosolic Ca2+ levels |
| 0.2 | 7.2 | REACTOME ABC FAMILY PROTEINS MEDIATED TRANSPORT | Genes involved in ABC-family proteins mediated transport |
| 0.2 | 4.4 | REACTOME SYNTHESIS OF VERY LONG CHAIN FATTY ACYL COAS | Genes involved in Synthesis of very long-chain fatty acyl-CoAs |
| 0.2 | 6.9 | REACTOME GLYCOLYSIS | Genes involved in Glycolysis |
| 0.2 | 7.5 | REACTOME TIGHT JUNCTION INTERACTIONS | Genes involved in Tight junction interactions |
| 0.2 | 6.6 | REACTOME EFFECTS OF PIP2 HYDROLYSIS | Genes involved in Effects of PIP2 hydrolysis |
| 0.2 | 2.7 | REACTOME LIPOPROTEIN METABOLISM | Genes involved in Lipoprotein metabolism |
| 0.2 | 3.5 | REACTOME MITOCHONDRIAL FATTY ACID BETA OXIDATION | Genes involved in Mitochondrial Fatty Acid Beta-Oxidation |
| 0.2 | 29.7 | REACTOME SIGNALING BY RHO GTPASES | Genes involved in Signaling by Rho GTPases |
| 0.2 | 6.2 | REACTOME INTERACTION BETWEEN L1 AND ANKYRINS | Genes involved in Interaction between L1 and Ankyrins |
| 0.2 | 5.0 | REACTOME CYTOSOLIC SULFONATION OF SMALL MOLECULES | Genes involved in Cytosolic sulfonation of small molecules |
| 0.2 | 2.4 | REACTOME PYRIMIDINE CATABOLISM | Genes involved in Pyrimidine catabolism |
| 0.2 | 4.6 | REACTOME METABOLISM OF STEROID HORMONES AND VITAMINS A AND D | Genes involved in Metabolism of steroid hormones and vitamins A and D |
| 0.2 | 2.9 | REACTOME TRAF3 DEPENDENT IRF ACTIVATION PATHWAY | Genes involved in TRAF3-dependent IRF activation pathway |
| 0.2 | 9.6 | REACTOME SMOOTH MUSCLE CONTRACTION | Genes involved in Smooth Muscle Contraction |
| 0.2 | 2.6 | REACTOME A TETRASACCHARIDE LINKER SEQUENCE IS REQUIRED FOR GAG SYNTHESIS | Genes involved in A tetrasaccharide linker sequence is required for GAG synthesis |
| 0.2 | 2.5 | REACTOME ERKS ARE INACTIVATED | Genes involved in ERKs are inactivated |
| 0.1 | 11.2 | REACTOME FORMATION OF THE TERNARY COMPLEX AND SUBSEQUENTLY THE 43S COMPLEX | Genes involved in Formation of the ternary complex, and subsequently, the 43S complex |
| 0.1 | 1.0 | REACTOME CIRCADIAN REPRESSION OF EXPRESSION BY REV ERBA | Genes involved in Circadian Repression of Expression by REV-ERBA |
| 0.1 | 2.2 | REACTOME NOREPINEPHRINE NEUROTRANSMITTER RELEASE CYCLE | Genes involved in Norepinephrine Neurotransmitter Release Cycle |
| 0.1 | 9.6 | REACTOME METABOLISM OF VITAMINS AND COFACTORS | Genes involved in Metabolism of vitamins and cofactors |
| 0.1 | 1.5 | REACTOME REGULATION OF INSULIN SECRETION BY ACETYLCHOLINE | Genes involved in Regulation of Insulin Secretion by Acetylcholine |
| 0.1 | 1.7 | REACTOME HORMONE LIGAND BINDING RECEPTORS | Genes involved in Hormone ligand-binding receptors |
| 0.1 | 2.3 | REACTOME DOUBLE STRAND BREAK REPAIR | Genes involved in Double-Strand Break Repair |
| 0.1 | 2.9 | REACTOME REGULATION OF INSULIN LIKE GROWTH FACTOR IGF ACTIVITY BY INSULIN LIKE GROWTH FACTOR BINDING PROTEINS IGFBPS | Genes involved in Regulation of Insulin-like Growth Factor (IGF) Activity by Insulin-like Growth Factor Binding Proteins (IGFBPs) |
| 0.1 | 0.2 | REACTOME G0 AND EARLY G1 | Genes involved in G0 and Early G1 |
| 0.1 | 5.6 | REACTOME STRIATED MUSCLE CONTRACTION | Genes involved in Striated Muscle Contraction |
| 0.1 | 2.5 | REACTOME REGULATION OF BETA CELL DEVELOPMENT | Genes involved in Regulation of beta-cell development |
| 0.1 | 0.9 | REACTOME PD1 SIGNALING | Genes involved in PD-1 signaling |
| 0.1 | 8.3 | REACTOME NUCLEAR RECEPTOR TRANSCRIPTION PATHWAY | Genes involved in Nuclear Receptor transcription pathway |
| 0.1 | 2.2 | REACTOME AMINE DERIVED HORMONES | Genes involved in Amine-derived hormones |
| 0.1 | 12.1 | REACTOME PEPTIDE LIGAND BINDING RECEPTORS | Genes involved in Peptide ligand-binding receptors |
| 0.1 | 2.9 | REACTOME INHIBITION OF VOLTAGE GATED CA2 CHANNELS VIA GBETA GAMMA SUBUNITS | Genes involved in Inhibition of voltage gated Ca2+ channels via Gbeta/gamma subunits |
| 0.1 | 2.0 | REACTOME OTHER SEMAPHORIN INTERACTIONS | Genes involved in Other semaphorin interactions |
| 0.1 | 2.2 | REACTOME SYNTHESIS OF BILE ACIDS AND BILE SALTS | Genes involved in Synthesis of bile acids and bile salts |
| 0.1 | 6.4 | REACTOME POTASSIUM CHANNELS | Genes involved in Potassium Channels |
| 0.1 | 10.5 | REACTOME G ALPHA S SIGNALLING EVENTS | Genes involved in G alpha (s) signalling events |
| 0.1 | 2.3 | REACTOME BRANCHED CHAIN AMINO ACID CATABOLISM | Genes involved in Branched-chain amino acid catabolism |
| 0.1 | 1.2 | REACTOME EICOSANOID LIGAND BINDING RECEPTORS | Genes involved in Eicosanoid ligand-binding receptors |
| 0.1 | 3.5 | REACTOME LATENT INFECTION OF HOMO SAPIENS WITH MYCOBACTERIUM TUBERCULOSIS | Genes involved in Latent infection of Homo sapiens with Mycobacterium tuberculosis |
| 0.1 | 1.8 | REACTOME PTM GAMMA CARBOXYLATION HYPUSINE FORMATION AND ARYLSULFATASE ACTIVATION | Genes involved in PTM: gamma carboxylation, hypusine formation and arylsulfatase activation |
| 0.1 | 0.8 | REACTOME TRAF6 MEDIATED IRF7 ACTIVATION IN TLR7 8 OR 9 SIGNALING | Genes involved in TRAF6 mediated IRF7 activation in TLR7/8 or 9 signaling |
| 0.1 | 1.8 | REACTOME ACTIVATION OF BH3 ONLY PROTEINS | Genes involved in Activation of BH3-only proteins |
| 0.1 | 4.5 | REACTOME NUCLEAR SIGNALING BY ERBB4 | Genes involved in Nuclear signaling by ERBB4 |
| 0.1 | 2.4 | REACTOME GLUTATHIONE CONJUGATION | Genes involved in Glutathione conjugation |
| 0.1 | 2.2 | REACTOME MEIOTIC RECOMBINATION | Genes involved in Meiotic Recombination |
| 0.1 | 1.6 | REACTOME AMINO ACID SYNTHESIS AND INTERCONVERSION TRANSAMINATION | Genes involved in Amino acid synthesis and interconversion (transamination) |
| 0.1 | 4.2 | REACTOME GLYCEROPHOSPHOLIPID BIOSYNTHESIS | Genes involved in Glycerophospholipid biosynthesis |
| 0.1 | 1.3 | REACTOME IL RECEPTOR SHC SIGNALING | Genes involved in Interleukin receptor SHC signaling |
| 0.1 | 0.8 | REACTOME CGMP EFFECTS | Genes involved in cGMP effects |
| 0.0 | 1.2 | REACTOME ADHERENS JUNCTIONS INTERACTIONS | Genes involved in Adherens junctions interactions |
| 0.0 | 0.9 | REACTOME OXYGEN DEPENDENT PROLINE HYDROXYLATION OF HYPOXIA INDUCIBLE FACTOR ALPHA | Genes involved in Oxygen-dependent Proline Hydroxylation of Hypoxia-inducible Factor Alpha |
| 0.0 | 1.3 | REACTOME INTRINSIC PATHWAY FOR APOPTOSIS | Genes involved in Intrinsic Pathway for Apoptosis |
| 0.0 | 11.2 | REACTOME GENERIC TRANSCRIPTION PATHWAY | Genes involved in Generic Transcription Pathway |
| 0.0 | 1.1 | REACTOME DOWNREGULATION OF TGF BETA RECEPTOR SIGNALING | Genes involved in Downregulation of TGF-beta receptor signaling |
| 0.0 | 1.5 | REACTOME PHASE1 FUNCTIONALIZATION OF COMPOUNDS | Genes involved in Phase 1 - Functionalization of compounds |
| 0.0 | 0.9 | REACTOME G1 PHASE | Genes involved in G1 Phase |
| 0.0 | 1.2 | REACTOME AMINO ACID TRANSPORT ACROSS THE PLASMA MEMBRANE | Genes involved in Amino acid transport across the plasma membrane |
| 0.0 | 2.6 | REACTOME TRANSPORT OF INORGANIC CATIONS ANIONS AND AMINO ACIDS OLIGOPEPTIDES | Genes involved in Transport of inorganic cations/anions and amino acids/oligopeptides |
| 0.0 | 0.8 | REACTOME EXTRINSIC PATHWAY FOR APOPTOSIS | Genes involved in Extrinsic Pathway for Apoptosis |
| 0.0 | 0.6 | REACTOME METABOLISM OF POLYAMINES | Genes involved in Metabolism of polyamines |
| 0.0 | 0.5 | REACTOME GAP JUNCTION ASSEMBLY | Genes involved in Gap junction assembly |
| 0.0 | 0.2 | REACTOME DSCAM INTERACTIONS | Genes involved in DSCAM interactions |
| 0.0 | 2.8 | REACTOME PEPTIDE CHAIN ELONGATION | Genes involved in Peptide chain elongation |
| 0.0 | 0.9 | REACTOME COLLAGEN FORMATION | Genes involved in Collagen formation |
| 0.0 | 0.2 | REACTOME SIGNALING BY SCF KIT | Genes involved in Signaling by SCF-KIT |
| 0.0 | 0.0 | REACTOME INHIBITION OF INSULIN SECRETION BY ADRENALINE NORADRENALINE | Genes involved in Inhibition of Insulin Secretion by Adrenaline/Noradrenaline |
| 0.0 | 1.4 | REACTOME RESPONSE TO ELEVATED PLATELET CYTOSOLIC CA2 | Genes involved in Response to elevated platelet cytosolic Ca2+ |
| 0.0 | 0.3 | REACTOME CONVERSION FROM APC C CDC20 TO APC C CDH1 IN LATE ANAPHASE | Genes involved in Conversion from APC/C:Cdc20 to APC/C:Cdh1 in late anaphase |
| 0.0 | 0.3 | REACTOME DEGRADATION OF THE EXTRACELLULAR MATRIX | Genes involved in Degradation of the extracellular matrix |