Project
GNF SymAtlas + NCI-60 cancer cell lines, comparison of cancers vs non-cancers, human (Su, 2004; Ross, 2000)
Navigation
Downloads
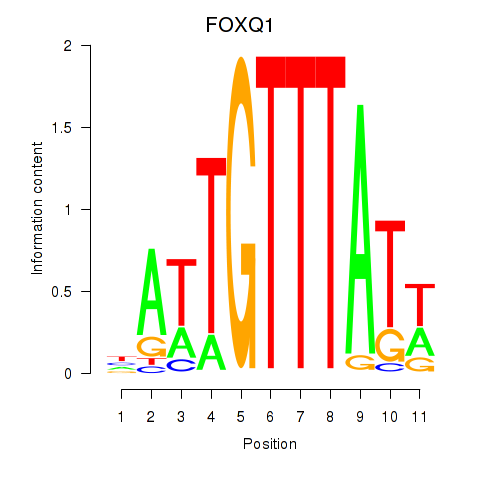
Results for FOXQ1
Z-value: 1.11
Motif logo
Transcription factors associated with FOXQ1
| Gene Symbol | Gene ID | Gene Info |
|---|---|---|
|
FOXQ1
|
ENSG00000164379.4 | forkhead box Q1 |
Activity profile of FOXQ1 motif
Sorted Z-values of FOXQ1 motif
| Promoter | Log-likelihood | Transcript | Gene | Gene Info |
|---|---|---|---|---|
| chr14_+_52456327 | 27.47 |
ENST00000556760.1
|
C14orf166
|
chromosome 14 open reading frame 166 |
| chr3_-_49066811 | 26.90 |
ENST00000442157.1
ENST00000326739.4 |
IMPDH2
|
IMP (inosine 5'-monophosphate) dehydrogenase 2 |
| chr2_-_225434538 | 25.92 |
ENST00000409096.1
|
CUL3
|
cullin 3 |
| chr14_+_52456193 | 24.34 |
ENST00000261700.3
|
C14orf166
|
chromosome 14 open reading frame 166 |
| chr3_-_107777208 | 23.94 |
ENST00000398258.3
|
CD47
|
CD47 molecule |
| chr2_-_150444116 | 23.90 |
ENST00000428879.1
ENST00000422782.2 |
MMADHC
|
methylmalonic aciduria (cobalamin deficiency) cblD type, with homocystinuria |
| chr20_+_30327063 | 22.04 |
ENST00000300403.6
ENST00000340513.4 |
TPX2
|
TPX2, microtubule-associated |
| chr10_-_36813162 | 21.99 |
ENST00000440465.1
|
NAMPTL
|
nicotinamide phosphoribosyltransferase-like |
| chr2_-_151344172 | 21.83 |
ENST00000375734.2
ENST00000263895.4 ENST00000454202.1 |
RND3
|
Rho family GTPase 3 |
| chr4_-_111119804 | 21.76 |
ENST00000394607.3
ENST00000302274.3 |
ELOVL6
|
ELOVL fatty acid elongase 6 |
| chr11_+_101983176 | 21.54 |
ENST00000524575.1
|
YAP1
|
Yes-associated protein 1 |
| chr2_-_150444300 | 20.95 |
ENST00000303319.5
|
MMADHC
|
methylmalonic aciduria (cobalamin deficiency) cblD type, with homocystinuria |
| chr1_-_145826450 | 20.49 |
ENST00000462900.2
|
GPR89A
|
G protein-coupled receptor 89A |
| chr1_-_54405773 | 19.98 |
ENST00000371376.1
|
HSPB11
|
heat shock protein family B (small), member 11 |
| chr14_+_56078695 | 19.94 |
ENST00000416613.1
|
KTN1
|
kinectin 1 (kinesin receptor) |
| chr7_-_87856280 | 18.82 |
ENST00000490437.1
ENST00000431660.1 |
SRI
|
sorcin |
| chr12_-_47473557 | 18.32 |
ENST00000321382.3
|
AMIGO2
|
adhesion molecule with Ig-like domain 2 |
| chr7_-_87856303 | 18.22 |
ENST00000394641.3
|
SRI
|
sorcin |
| chr12_-_47473425 | 18.18 |
ENST00000550413.1
|
AMIGO2
|
adhesion molecule with Ig-like domain 2 |
| chr9_+_42671887 | 18.07 |
ENST00000456520.1
ENST00000377391.3 |
CBWD7
|
COBW domain containing 7 |
| chrX_+_119737806 | 18.00 |
ENST00000371317.5
|
MCTS1
|
malignant T cell amplified sequence 1 |
| chr18_-_33702078 | 17.98 |
ENST00000586829.1
|
SLC39A6
|
solute carrier family 39 (zinc transporter), member 6 |
| chr1_+_165797024 | 17.59 |
ENST00000372212.4
|
UCK2
|
uridine-cytidine kinase 2 |
| chr7_+_102988082 | 17.36 |
ENST00000292644.3
ENST00000544811.1 |
PSMC2
|
proteasome (prosome, macropain) 26S subunit, ATPase, 2 |
| chr14_+_56127989 | 17.07 |
ENST00000555573.1
|
KTN1
|
kinectin 1 (kinesin receptor) |
| chr3_+_136649311 | 16.07 |
ENST00000469404.1
ENST00000467911.1 |
NCK1
|
NCK adaptor protein 1 |
| chr5_+_72143988 | 15.89 |
ENST00000506351.2
|
TNPO1
|
transportin 1 |
| chr12_+_50144381 | 15.85 |
ENST00000552370.1
|
TMBIM6
|
transmembrane BAX inhibitor motif containing 6 |
| chr17_+_66521936 | 15.85 |
ENST00000592800.1
|
PRKAR1A
|
protein kinase, cAMP-dependent, regulatory, type I, alpha |
| chr4_-_140223614 | 15.63 |
ENST00000394223.1
|
NDUFC1
|
NADH dehydrogenase (ubiquinone) 1, subcomplex unknown, 1, 6kDa |
| chr17_-_38574169 | 15.52 |
ENST00000423485.1
|
TOP2A
|
topoisomerase (DNA) II alpha 170kDa |
| chr12_+_19358228 | 15.44 |
ENST00000424268.1
ENST00000543806.1 |
PLEKHA5
|
pleckstrin homology domain containing, family A member 5 |
| chr12_-_76462713 | 15.15 |
ENST00000552056.1
|
NAP1L1
|
nucleosome assembly protein 1-like 1 |
| chr1_+_145883868 | 15.07 |
ENST00000447947.2
|
GPR89C
|
G protein-coupled receptor 89C |
| chr6_-_24666819 | 14.93 |
ENST00000341060.3
|
TDP2
|
tyrosyl-DNA phosphodiesterase 2 |
| chr3_+_171757346 | 14.83 |
ENST00000421757.1
ENST00000415807.2 ENST00000392699.1 |
FNDC3B
|
fibronectin type III domain containing 3B |
| chr12_-_71551652 | 14.77 |
ENST00000546561.1
|
TSPAN8
|
tetraspanin 8 |
| chr20_+_36373032 | 14.74 |
ENST00000373473.1
|
CTNNBL1
|
catenin, beta like 1 |
| chr19_-_40331345 | 14.73 |
ENST00000597224.1
|
FBL
|
fibrillarin |
| chr1_+_26605618 | 14.66 |
ENST00000270792.5
|
SH3BGRL3
|
SH3 domain binding glutamic acid-rich protein like 3 |
| chr11_-_14521379 | 14.52 |
ENST00000249923.3
ENST00000529866.1 ENST00000439561.2 ENST00000534771.1 |
COPB1
|
coatomer protein complex, subunit beta 1 |
| chr1_+_155179012 | 13.89 |
ENST00000609421.1
|
MTX1
|
metaxin 1 |
| chr12_-_76478417 | 13.80 |
ENST00000552342.1
|
NAP1L1
|
nucleosome assembly protein 1-like 1 |
| chr4_-_140223670 | 13.73 |
ENST00000394228.1
ENST00000539387.1 |
NDUFC1
|
NADH dehydrogenase (ubiquinone) 1, subcomplex unknown, 1, 6kDa |
| chr12_-_76478386 | 13.61 |
ENST00000535020.2
|
NAP1L1
|
nucleosome assembly protein 1-like 1 |
| chr3_-_32544900 | 13.60 |
ENST00000205636.3
|
CMTM6
|
CKLF-like MARVEL transmembrane domain containing 6 |
| chr11_+_844406 | 13.55 |
ENST00000397404.1
|
TSPAN4
|
tetraspanin 4 |
| chr13_+_48611665 | 13.37 |
ENST00000258662.2
|
NUDT15
|
nudix (nucleoside diphosphate linked moiety X)-type motif 15 |
| chr5_+_65440032 | 13.25 |
ENST00000334121.6
|
SREK1
|
splicing regulatory glutamine/lysine-rich protein 1 |
| chr11_-_82997371 | 13.17 |
ENST00000525503.1
|
CCDC90B
|
coiled-coil domain containing 90B |
| chr11_-_47447970 | 13.14 |
ENST00000298852.3
ENST00000530912.1 |
PSMC3
|
proteasome (prosome, macropain) 26S subunit, ATPase, 3 |
| chr11_+_108535752 | 12.96 |
ENST00000322536.3
|
DDX10
|
DEAD (Asp-Glu-Ala-Asp) box polypeptide 10 |
| chr3_+_130569429 | 12.66 |
ENST00000505330.1
ENST00000504381.1 ENST00000507488.2 ENST00000393221.4 |
ATP2C1
|
ATPase, Ca++ transporting, type 2C, member 1 |
| chr18_+_3252265 | 12.55 |
ENST00000580887.1
ENST00000536605.1 |
MYL12A
|
myosin, light chain 12A, regulatory, non-sarcomeric |
| chr3_+_139063372 | 12.51 |
ENST00000478464.1
|
MRPS22
|
mitochondrial ribosomal protein S22 |
| chr20_+_56964253 | 12.37 |
ENST00000395802.3
|
VAPB
|
VAMP (vesicle-associated membrane protein)-associated protein B and C |
| chr1_-_153599732 | 12.04 |
ENST00000392623.1
|
S100A13
|
S100 calcium binding protein A13 |
| chr5_+_140529630 | 11.99 |
ENST00000543635.1
|
PCDHB6
|
protocadherin beta 6 |
| chr21_-_33975547 | 11.97 |
ENST00000431599.1
|
C21orf59
|
chromosome 21 open reading frame 59 |
| chr6_-_131277510 | 11.85 |
ENST00000525193.1
ENST00000527659.1 |
EPB41L2
|
erythrocyte membrane protein band 4.1-like 2 |
| chr20_-_3185279 | 11.67 |
ENST00000354488.3
ENST00000380201.2 |
DDRGK1
|
DDRGK domain containing 1 |
| chr1_-_95391315 | 11.64 |
ENST00000545882.1
ENST00000415017.1 |
CNN3
|
calponin 3, acidic |
| chr5_+_118812294 | 11.64 |
ENST00000509514.1
|
HSD17B4
|
hydroxysteroid (17-beta) dehydrogenase 4 |
| chr3_+_138340049 | 11.64 |
ENST00000464668.1
|
FAIM
|
Fas apoptotic inhibitory molecule |
| chr2_-_106054952 | 11.60 |
ENST00000336660.5
ENST00000393352.3 ENST00000607522.1 |
FHL2
|
four and a half LIM domains 2 |
| chr13_+_29233218 | 11.51 |
ENST00000380842.4
|
POMP
|
proteasome maturation protein |
| chr14_+_73563735 | 11.34 |
ENST00000532192.1
|
RBM25
|
RNA binding motif protein 25 |
| chr11_-_82997420 | 11.32 |
ENST00000455220.2
ENST00000529689.1 |
CCDC90B
|
coiled-coil domain containing 90B |
| chr5_-_130500922 | 11.24 |
ENST00000513012.1
ENST00000508488.1 ENST00000506908.1 ENST00000304043.5 |
HINT1
|
histidine triad nucleotide binding protein 1 |
| chr7_-_41742697 | 11.24 |
ENST00000242208.4
|
INHBA
|
inhibin, beta A |
| chr14_+_39583427 | 11.14 |
ENST00000308317.6
ENST00000396249.2 ENST00000250379.8 ENST00000534684.2 ENST00000527381.1 |
GEMIN2
|
gem (nuclear organelle) associated protein 2 |
| chr15_+_80351977 | 11.03 |
ENST00000559157.1
ENST00000561012.1 ENST00000564367.1 ENST00000558494.1 |
ZFAND6
|
zinc finger, AN1-type domain 6 |
| chr15_+_80351910 | 10.82 |
ENST00000261749.6
ENST00000561060.1 |
ZFAND6
|
zinc finger, AN1-type domain 6 |
| chr14_+_35591928 | 10.59 |
ENST00000605870.1
ENST00000557404.3 |
KIAA0391
|
KIAA0391 |
| chr17_-_36358166 | 10.47 |
ENST00000537432.1
|
TBC1D3
|
TBC1 domain family, member 3 |
| chr1_-_115259337 | 10.42 |
ENST00000369535.4
|
NRAS
|
neuroblastoma RAS viral (v-ras) oncogene homolog |
| chr7_-_64023441 | 10.39 |
ENST00000309683.6
|
ZNF680
|
zinc finger protein 680 |
| chr11_-_72070206 | 10.34 |
ENST00000544382.1
|
CLPB
|
ClpB caseinolytic peptidase B homolog (E. coli) |
| chr15_-_63449663 | 10.34 |
ENST00000439025.1
|
RPS27L
|
ribosomal protein S27-like |
| chr12_-_49582593 | 10.24 |
ENST00000295766.5
|
TUBA1A
|
tubulin, alpha 1a |
| chr2_-_55496344 | 10.17 |
ENST00000403721.1
ENST00000263629.4 |
MTIF2
|
mitochondrial translational initiation factor 2 |
| chr8_+_109455845 | 10.12 |
ENST00000220853.3
|
EMC2
|
ER membrane protein complex subunit 2 |
| chr12_-_112847108 | 10.03 |
ENST00000549847.1
|
RPL6
|
ribosomal protein L6 |
| chr17_+_1936687 | 10.00 |
ENST00000570477.1
|
DPH1
|
diphthamide biosynthesis 1 |
| chr16_+_2820912 | 9.93 |
ENST00000570539.1
|
SRRM2
|
serine/arginine repetitive matrix 2 |
| chr8_+_30013813 | 9.87 |
ENST00000221114.3
|
DCTN6
|
dynactin 6 |
| chr12_-_47473642 | 9.77 |
ENST00000266581.4
|
AMIGO2
|
adhesion molecule with Ig-like domain 2 |
| chr7_+_115862858 | 9.76 |
ENST00000393481.2
|
TES
|
testis derived transcript (3 LIM domains) |
| chr1_-_94079648 | 9.68 |
ENST00000370247.3
|
BCAR3
|
breast cancer anti-estrogen resistance 3 |
| chr1_+_95616933 | 9.63 |
ENST00000604203.1
|
RP11-57H12.6
|
TMEM56-RWDD3 readthrough |
| chr16_-_4395905 | 9.56 |
ENST00000571941.1
|
PAM16
|
presequence translocase-associated motor 16 homolog (S. cerevisiae) |
| chr8_+_110551925 | 9.46 |
ENST00000395785.2
|
EBAG9
|
estrogen receptor binding site associated, antigen, 9 |
| chr10_+_5488564 | 9.45 |
ENST00000449083.1
ENST00000380359.3 |
NET1
|
neuroepithelial cell transforming 1 |
| chr12_+_28410128 | 9.45 |
ENST00000381259.1
ENST00000381256.1 |
CCDC91
|
coiled-coil domain containing 91 |
| chr12_+_53836339 | 9.35 |
ENST00000549135.1
|
PRR13
|
proline rich 13 |
| chr1_-_150669500 | 9.33 |
ENST00000271732.3
|
GOLPH3L
|
golgi phosphoprotein 3-like |
| chr12_-_76478446 | 9.24 |
ENST00000393263.3
ENST00000548044.1 ENST00000547704.1 ENST00000431879.3 ENST00000549596.1 ENST00000550934.1 ENST00000551600.1 ENST00000547479.1 ENST00000547773.1 ENST00000544816.1 ENST00000542344.1 ENST00000548273.1 |
NAP1L1
|
nucleosome assembly protein 1-like 1 |
| chr16_-_58585513 | 9.11 |
ENST00000245138.4
ENST00000567285.1 |
CNOT1
|
CCR4-NOT transcription complex, subunit 1 |
| chr17_+_18601299 | 9.10 |
ENST00000572555.1
ENST00000395902.3 ENST00000449552.2 |
TRIM16L
|
tripartite motif containing 16-like |
| chr8_-_49834299 | 9.07 |
ENST00000396822.1
|
SNAI2
|
snail family zinc finger 2 |
| chr14_+_102276209 | 9.07 |
ENST00000445439.3
ENST00000334743.5 ENST00000557095.1 |
PPP2R5C
|
protein phosphatase 2, regulatory subunit B', gamma |
| chr14_-_60636561 | 9.03 |
ENST00000536410.2
ENST00000216500.5 |
DHRS7
|
dehydrogenase/reductase (SDR family) member 7 |
| chr3_+_138340067 | 8.99 |
ENST00000479848.1
|
FAIM
|
Fas apoptotic inhibitory molecule |
| chr3_+_130569592 | 8.97 |
ENST00000533801.2
|
ATP2C1
|
ATPase, Ca++ transporting, type 2C, member 1 |
| chr14_-_51411194 | 8.81 |
ENST00000544180.2
|
PYGL
|
phosphorylase, glycogen, liver |
| chr3_+_159570722 | 8.69 |
ENST00000482804.1
|
SCHIP1
|
schwannomin interacting protein 1 |
| chr2_+_47596287 | 8.67 |
ENST00000263735.4
|
EPCAM
|
epithelial cell adhesion molecule |
| chr3_-_141868293 | 8.54 |
ENST00000317104.7
ENST00000494358.1 |
TFDP2
|
transcription factor Dp-2 (E2F dimerization partner 2) |
| chr9_-_128246769 | 8.52 |
ENST00000444226.1
|
MAPKAP1
|
mitogen-activated protein kinase associated protein 1 |
| chr3_-_165555200 | 8.51 |
ENST00000479451.1
ENST00000540653.1 ENST00000488954.1 ENST00000264381.3 |
BCHE
|
butyrylcholinesterase |
| chr6_+_125524785 | 8.47 |
ENST00000392482.2
|
TPD52L1
|
tumor protein D52-like 1 |
| chr2_-_55496174 | 8.27 |
ENST00000417363.1
ENST00000412530.1 ENST00000394600.3 ENST00000366137.2 ENST00000420637.1 |
MTIF2
|
mitochondrial translational initiation factor 2 |
| chr6_-_128841503 | 8.24 |
ENST00000368215.3
ENST00000532331.1 ENST00000368213.5 ENST00000368207.3 ENST00000525459.1 ENST00000368210.3 ENST00000368226.4 ENST00000368227.3 |
PTPRK
|
protein tyrosine phosphatase, receptor type, K |
| chr15_-_55489097 | 8.13 |
ENST00000260443.4
|
RSL24D1
|
ribosomal L24 domain containing 1 |
| chr3_+_158991025 | 8.09 |
ENST00000337808.6
|
IQCJ-SCHIP1
|
IQCJ-SCHIP1 readthrough |
| chr5_-_176836577 | 8.05 |
ENST00000253496.3
|
F12
|
coagulation factor XII (Hageman factor) |
| chr8_-_124054484 | 8.01 |
ENST00000419562.2
|
DERL1
|
derlin 1 |
| chr5_+_118812237 | 8.00 |
ENST00000513628.1
|
HSD17B4
|
hydroxysteroid (17-beta) dehydrogenase 4 |
| chr8_-_124037890 | 7.87 |
ENST00000519018.1
ENST00000523036.1 |
DERL1
|
derlin 1 |
| chr8_+_110552046 | 7.79 |
ENST00000529931.1
|
EBAG9
|
estrogen receptor binding site associated, antigen, 9 |
| chr15_-_55541227 | 7.76 |
ENST00000566877.1
|
RAB27A
|
RAB27A, member RAS oncogene family |
| chr3_+_9839335 | 7.72 |
ENST00000453882.1
|
ARPC4-TTLL3
|
ARPC4-TTLL3 readthrough |
| chr13_+_52598827 | 7.70 |
ENST00000521776.2
|
UTP14C
|
UTP14, U3 small nucleolar ribonucleoprotein, homolog C (yeast) |
| chr12_+_56435637 | 7.66 |
ENST00000356464.5
ENST00000552361.1 |
RPS26
|
ribosomal protein S26 |
| chr8_+_125486939 | 7.63 |
ENST00000303545.3
|
RNF139
|
ring finger protein 139 |
| chr14_-_51411146 | 7.63 |
ENST00000532462.1
|
PYGL
|
phosphorylase, glycogen, liver |
| chr1_+_74701062 | 7.58 |
ENST00000326637.3
|
TNNI3K
|
TNNI3 interacting kinase |
| chr10_+_13652047 | 7.57 |
ENST00000601460.1
|
RP11-295P9.3
|
Uncharacterized protein |
| chr12_-_92539614 | 7.56 |
ENST00000256015.3
|
BTG1
|
B-cell translocation gene 1, anti-proliferative |
| chr20_-_31989307 | 7.53 |
ENST00000473997.1
ENST00000544843.1 ENST00000346416.2 ENST00000357886.4 ENST00000339269.5 |
CDK5RAP1
|
CDK5 regulatory subunit associated protein 1 |
| chr8_+_31497271 | 7.47 |
ENST00000520407.1
|
NRG1
|
neuregulin 1 |
| chr12_+_1800179 | 7.42 |
ENST00000357103.4
|
ADIPOR2
|
adiponectin receptor 2 |
| chr17_-_29233769 | 7.37 |
ENST00000581216.1
|
TEFM
|
transcription elongation factor, mitochondrial |
| chr1_+_206557366 | 7.21 |
ENST00000414007.1
ENST00000419187.2 |
SRGAP2
|
SLIT-ROBO Rho GTPase activating protein 2 |
| chr10_+_122610687 | 7.12 |
ENST00000263461.6
|
WDR11
|
WD repeat domain 11 |
| chr9_-_88897426 | 6.98 |
ENST00000375991.4
ENST00000326094.4 |
ISCA1
|
iron-sulfur cluster assembly 1 |
| chr2_-_188419200 | 6.97 |
ENST00000233156.3
ENST00000426055.1 ENST00000453013.1 ENST00000417013.1 |
TFPI
|
tissue factor pathway inhibitor (lipoprotein-associated coagulation inhibitor) |
| chrX_+_107288197 | 6.97 |
ENST00000415430.3
|
VSIG1
|
V-set and immunoglobulin domain containing 1 |
| chr20_+_34802295 | 6.91 |
ENST00000432603.1
|
EPB41L1
|
erythrocyte membrane protein band 4.1-like 1 |
| chr22_-_36236623 | 6.90 |
ENST00000405409.2
|
RBFOX2
|
RNA binding protein, fox-1 homolog (C. elegans) 2 |
| chr3_+_157154578 | 6.81 |
ENST00000295927.3
|
PTX3
|
pentraxin 3, long |
| chr6_+_88182643 | 6.74 |
ENST00000369556.3
ENST00000544441.1 ENST00000369552.4 ENST00000369557.5 |
SLC35A1
|
solute carrier family 35 (CMP-sialic acid transporter), member A1 |
| chr20_-_33732952 | 6.71 |
ENST00000541621.1
|
EDEM2
|
ER degradation enhancer, mannosidase alpha-like 2 |
| chr3_-_196911002 | 6.67 |
ENST00000452595.1
|
DLG1
|
discs, large homolog 1 (Drosophila) |
| chr2_+_163175394 | 6.58 |
ENST00000446271.1
ENST00000429691.2 |
GCA
|
grancalcin, EF-hand calcium binding protein |
| chr16_-_10652993 | 6.57 |
ENST00000536829.1
|
EMP2
|
epithelial membrane protein 2 |
| chr10_+_5454505 | 6.51 |
ENST00000355029.4
|
NET1
|
neuroepithelial cell transforming 1 |
| chrX_-_99891796 | 6.51 |
ENST00000373020.4
|
TSPAN6
|
tetraspanin 6 |
| chr2_+_109237717 | 6.42 |
ENST00000409441.1
|
LIMS1
|
LIM and senescent cell antigen-like domains 1 |
| chr17_+_79953310 | 6.10 |
ENST00000582355.2
|
ASPSCR1
|
alveolar soft part sarcoma chromosome region, candidate 1 |
| chr10_+_51572408 | 6.06 |
ENST00000374082.1
|
NCOA4
|
nuclear receptor coactivator 4 |
| chr17_+_34171081 | 6.03 |
ENST00000585577.1
|
TAF15
|
TAF15 RNA polymerase II, TATA box binding protein (TBP)-associated factor, 68kDa |
| chr16_+_69958887 | 5.94 |
ENST00000568684.1
|
WWP2
|
WW domain containing E3 ubiquitin protein ligase 2 |
| chr8_-_49833978 | 5.92 |
ENST00000020945.1
|
SNAI2
|
snail family zinc finger 2 |
| chr12_+_21168630 | 5.87 |
ENST00000421593.2
|
SLCO1B7
|
solute carrier organic anion transporter family, member 1B7 (non-functional) |
| chr6_+_37321823 | 5.86 |
ENST00000487950.1
ENST00000469731.1 |
RNF8
|
ring finger protein 8, E3 ubiquitin protein ligase |
| chr3_+_69985734 | 5.85 |
ENST00000314557.6
ENST00000394351.3 |
MITF
|
microphthalmia-associated transcription factor |
| chr15_-_30113676 | 5.83 |
ENST00000400011.2
|
TJP1
|
tight junction protein 1 |
| chr17_-_17485731 | 5.76 |
ENST00000395783.1
|
PEMT
|
phosphatidylethanolamine N-methyltransferase |
| chr18_+_21032781 | 5.75 |
ENST00000339486.3
|
RIOK3
|
RIO kinase 3 |
| chr5_+_102201722 | 5.72 |
ENST00000274392.9
ENST00000455264.2 |
PAM
|
peptidylglycine alpha-amidating monooxygenase |
| chr15_+_41549105 | 5.70 |
ENST00000560965.1
|
CHP1
|
calcineurin-like EF-hand protein 1 |
| chr17_-_29233221 | 5.69 |
ENST00000580840.1
|
TEFM
|
transcription elongation factor, mitochondrial |
| chr22_-_18257249 | 5.68 |
ENST00000399765.1
ENST00000399767.1 ENST00000399774.3 |
BID
|
BH3 interacting domain death agonist |
| chr12_-_49582978 | 5.52 |
ENST00000301071.7
|
TUBA1A
|
tubulin, alpha 1a |
| chr1_-_24306835 | 5.47 |
ENST00000484146.2
|
SRSF10
|
serine/arginine-rich splicing factor 10 |
| chrX_-_41449204 | 5.42 |
ENST00000378179.3
|
CASK
|
calcium/calmodulin-dependent serine protein kinase (MAGUK family) |
| chr7_-_124569991 | 5.41 |
ENST00000446993.1
ENST00000357628.3 ENST00000393329.1 |
POT1
|
protection of telomeres 1 |
| chr2_-_165424973 | 5.35 |
ENST00000543549.1
|
GRB14
|
growth factor receptor-bound protein 14 |
| chr6_-_114194483 | 5.32 |
ENST00000434296.2
|
RP1-249H1.4
|
RP1-249H1.4 |
| chr2_+_143635067 | 5.29 |
ENST00000264170.4
|
KYNU
|
kynureninase |
| chr1_-_227505289 | 5.27 |
ENST00000366765.3
|
CDC42BPA
|
CDC42 binding protein kinase alpha (DMPK-like) |
| chr5_+_140579162 | 5.24 |
ENST00000536699.1
ENST00000354757.3 |
PCDHB11
|
protocadherin beta 11 |
| chr11_-_60674037 | 5.10 |
ENST00000541371.1
ENST00000227524.4 |
PRPF19
|
pre-mRNA processing factor 19 |
| chr17_-_60142609 | 4.98 |
ENST00000397786.2
|
MED13
|
mediator complex subunit 13 |
| chr11_-_102668879 | 4.98 |
ENST00000315274.6
|
MMP1
|
matrix metallopeptidase 1 (interstitial collagenase) |
| chr3_+_33840050 | 4.94 |
ENST00000457054.2
ENST00000413073.1 |
PDCD6IP
|
programmed cell death 6 interacting protein |
| chr4_-_103266626 | 4.92 |
ENST00000356736.4
|
SLC39A8
|
solute carrier family 39 (zinc transporter), member 8 |
| chr11_-_27723158 | 4.91 |
ENST00000395980.2
|
BDNF
|
brain-derived neurotrophic factor |
| chr3_-_128902759 | 4.91 |
ENST00000422453.2
ENST00000504813.1 ENST00000512338.1 |
CNBP
|
CCHC-type zinc finger, nucleic acid binding protein |
| chr8_-_95487331 | 4.86 |
ENST00000336148.5
|
RAD54B
|
RAD54 homolog B (S. cerevisiae) |
| chr8_-_124054587 | 4.82 |
ENST00000259512.4
|
DERL1
|
derlin 1 |
| chr14_+_35591858 | 4.79 |
ENST00000603544.1
|
KIAA0391
|
KIAA0391 |
| chr1_-_202927490 | 4.77 |
ENST00000340990.5
|
ADIPOR1
|
adiponectin receptor 1 |
| chr3_+_130650738 | 4.75 |
ENST00000504612.1
|
ATP2C1
|
ATPase, Ca++ transporting, type 2C, member 1 |
| chr7_-_32529973 | 4.72 |
ENST00000410044.1
ENST00000409987.1 ENST00000409782.1 ENST00000450169.2 |
LSM5
|
LSM5 homolog, U6 small nuclear RNA associated (S. cerevisiae) |
| chr4_+_1283639 | 4.71 |
ENST00000303400.4
ENST00000505177.2 ENST00000503653.1 ENST00000264750.6 ENST00000502558.1 ENST00000452175.2 ENST00000514708.1 |
MAEA
|
macrophage erythroblast attacher |
| chr22_-_39268308 | 4.71 |
ENST00000407418.3
|
CBX6
|
chromobox homolog 6 |
| chr10_+_35484793 | 4.71 |
ENST00000488741.1
ENST00000474931.1 ENST00000468236.1 ENST00000344351.5 ENST00000490511.1 |
CREM
|
cAMP responsive element modulator |
| chr20_+_44035847 | 4.71 |
ENST00000372712.2
|
DBNDD2
|
dysbindin (dystrobrevin binding protein 1) domain containing 2 |
| chr14_-_20801427 | 4.64 |
ENST00000557665.1
ENST00000358932.4 ENST00000353689.4 |
CCNB1IP1
|
cyclin B1 interacting protein 1, E3 ubiquitin protein ligase |
| chr5_+_140625147 | 4.61 |
ENST00000231173.3
|
PCDHB15
|
protocadherin beta 15 |
| chr7_-_72993033 | 4.57 |
ENST00000305632.5
|
TBL2
|
transducin (beta)-like 2 |
| chr7_-_26578407 | 4.54 |
ENST00000242109.3
|
KIAA0087
|
KIAA0087 |
| chr4_+_146403912 | 4.52 |
ENST00000507367.1
ENST00000394092.2 ENST00000515385.1 |
SMAD1
|
SMAD family member 1 |
| chr15_+_49715293 | 4.46 |
ENST00000267843.4
ENST00000560270.1 |
FGF7
|
fibroblast growth factor 7 |
| chr1_+_236686717 | 4.46 |
ENST00000341872.6
ENST00000450372.2 |
LGALS8
|
lectin, galactoside-binding, soluble, 8 |
| chr12_+_96588143 | 4.41 |
ENST00000228741.3
ENST00000547249.1 |
ELK3
|
ELK3, ETS-domain protein (SRF accessory protein 2) |
| chr1_+_84873913 | 4.26 |
ENST00000370662.3
|
DNASE2B
|
deoxyribonuclease II beta |
| chr2_-_188419078 | 4.25 |
ENST00000437725.1
ENST00000409676.1 ENST00000339091.4 ENST00000420747.1 |
TFPI
|
tissue factor pathway inhibitor (lipoprotein-associated coagulation inhibitor) |
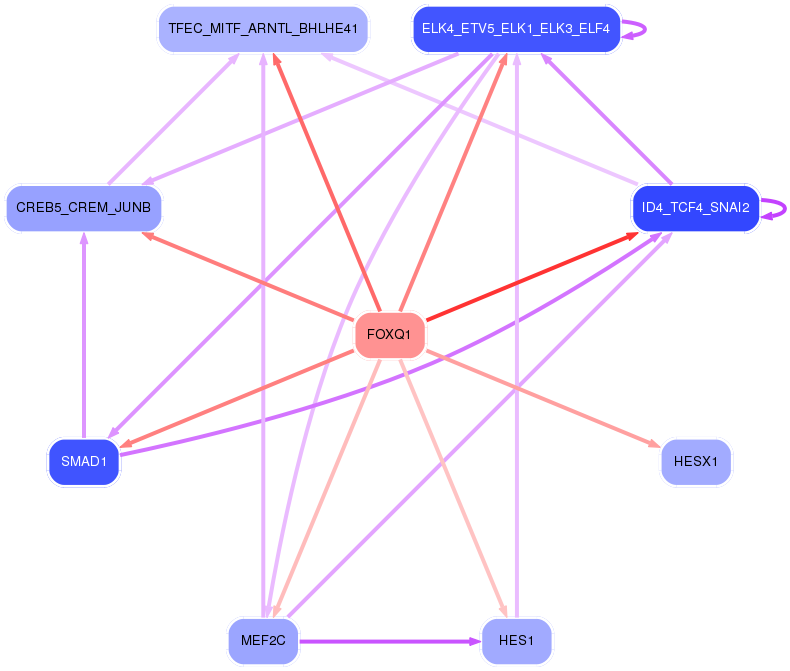
Network of associatons between targets according to the STRING database.

First level regulatory network of FOXQ1
Gene Ontology Analysis
Gene overrepresentation in biological_process category:
| Log-likelihood per target | Total log-likelihood | Term | Description |
|---|---|---|---|
| 6.5 | 25.9 | GO:0001831 | trophectodermal cellular morphogenesis(GO:0001831) |
| 6.0 | 18.0 | GO:0002188 | translation reinitiation(GO:0002188) |
| 5.4 | 16.1 | GO:1903676 | regulation of cap-dependent translational initiation(GO:1903674) positive regulation of cap-dependent translational initiation(GO:1903676) |
| 5.3 | 37.0 | GO:0006880 | intracellular sequestering of iron ion(GO:0006880) sequestering of iron ion(GO:0097577) |
| 5.0 | 15.0 | GO:0070563 | negative regulation of vitamin D receptor signaling pathway(GO:0070563) |
| 4.5 | 26.9 | GO:0006177 | GMP biosynthetic process(GO:0006177) |
| 4.4 | 17.6 | GO:0046035 | CMP salvage(GO:0006238) CMP biosynthetic process(GO:0009224) CMP metabolic process(GO:0046035) |
| 4.4 | 26.4 | GO:0032468 | Golgi calcium ion homeostasis(GO:0032468) |
| 4.3 | 51.8 | GO:0006388 | tRNA splicing, via endonucleolytic cleavage and ligation(GO:0006388) |
| 3.7 | 11.2 | GO:0060279 | regulation of ovulation(GO:0060278) positive regulation of ovulation(GO:0060279) |
| 3.7 | 14.7 | GO:0018364 | peptidyl-glutamine methylation(GO:0018364) |
| 3.6 | 21.8 | GO:0034625 | fatty acid elongation, saturated fatty acid(GO:0019367) fatty acid elongation, unsaturated fatty acid(GO:0019368) fatty acid elongation, monounsaturated fatty acid(GO:0034625) fatty acid elongation, polyunsaturated fatty acid(GO:0034626) |
| 3.4 | 20.7 | GO:0051708 | intracellular transport of viral protein in host cell(GO:0019060) symbiont intracellular protein transport in host(GO:0030581) intracellular protein transport in other organism involved in symbiotic interaction(GO:0051708) |
| 3.3 | 13.4 | GO:0006203 | dGTP catabolic process(GO:0006203) |
| 3.3 | 16.4 | GO:0046391 | 5-phosphoribose 1-diphosphate biosynthetic process(GO:0006015) 5-phosphoribose 1-diphosphate metabolic process(GO:0046391) |
| 3.3 | 19.6 | GO:0036111 | very long-chain fatty-acyl-CoA metabolic process(GO:0036111) |
| 3.1 | 18.4 | GO:0032790 | ribosome disassembly(GO:0032790) |
| 2.9 | 11.7 | GO:1903719 | regulation of I-kappaB phosphorylation(GO:1903719) positive regulation of I-kappaB phosphorylation(GO:1903721) |
| 2.9 | 8.7 | GO:2000048 | negative regulation of cell-cell adhesion mediated by cadherin(GO:2000048) |
| 2.8 | 8.5 | GO:0014016 | neuroblast differentiation(GO:0014016) |
| 2.6 | 15.9 | GO:1904721 | negative regulation of mRNA cleavage(GO:0031438) negative regulation of immunoglobulin secretion(GO:0051025) negative regulation of ribonuclease activity(GO:0060701) negative regulation of endoribonuclease activity(GO:0060702) negative regulation of mRNA endonucleolytic cleavage involved in unfolded protein response(GO:1904721) |
| 2.6 | 15.4 | GO:0090646 | mitochondrial tRNA processing(GO:0090646) |
| 2.3 | 7.0 | GO:0097052 | tryptophan catabolic process to acetyl-CoA(GO:0019442) L-kynurenine metabolic process(GO:0097052) |
| 2.3 | 11.6 | GO:0055014 | atrial cardiac muscle cell differentiation(GO:0055011) atrial cardiac muscle cell development(GO:0055014) |
| 2.3 | 22.9 | GO:0071578 | zinc II ion transmembrane import(GO:0071578) |
| 2.2 | 6.7 | GO:0036511 | trimming of terminal mannose on B branch(GO:0036509) trimming of first mannose on A branch(GO:0036511) trimming of second mannose on A branch(GO:0036512) |
| 2.2 | 6.6 | GO:0002541 | activation of plasma proteins involved in acute inflammatory response(GO:0002541) positive regulation of fibrinolysis(GO:0051919) |
| 2.1 | 18.6 | GO:1902459 | positive regulation of stem cell population maintenance(GO:1902459) |
| 2.0 | 8.1 | GO:1902626 | assembly of large subunit precursor of preribosome(GO:1902626) |
| 1.9 | 5.8 | GO:1901350 | cell-cell signaling involved in cell-cell junction organization(GO:1901350) |
| 1.9 | 7.7 | GO:0018094 | protein polyglycylation(GO:0018094) |
| 1.9 | 5.8 | GO:0039534 | negative regulation of MDA-5 signaling pathway(GO:0039534) |
| 1.9 | 48.4 | GO:0009235 | cobalamin metabolic process(GO:0009235) |
| 1.7 | 5.0 | GO:0044278 | cell wall disruption in other organism(GO:0044278) |
| 1.6 | 4.9 | GO:0090611 | ubiquitin-independent protein catabolic process via the multivesicular body sorting pathway(GO:0090611) |
| 1.6 | 4.9 | GO:0031548 | regulation of brain-derived neurotrophic factor receptor signaling pathway(GO:0031548) |
| 1.6 | 30.8 | GO:0008228 | opsonization(GO:0008228) |
| 1.6 | 11.2 | GO:0007598 | blood coagulation, extrinsic pathway(GO:0007598) |
| 1.6 | 20.6 | GO:0070986 | left/right axis specification(GO:0070986) |
| 1.6 | 15.5 | GO:0030263 | apoptotic chromosome condensation(GO:0030263) |
| 1.5 | 12.2 | GO:0033211 | adiponectin-activated signaling pathway(GO:0033211) |
| 1.5 | 13.7 | GO:0006987 | activation of signaling protein activity involved in unfolded protein response(GO:0006987) |
| 1.5 | 7.5 | GO:0070131 | positive regulation of mitochondrial translation(GO:0070131) |
| 1.5 | 4.5 | GO:0060437 | lung growth(GO:0060437) |
| 1.5 | 13.2 | GO:2000271 | positive regulation of fibroblast apoptotic process(GO:2000271) |
| 1.5 | 13.1 | GO:0006390 | mitochondrial DNA replication(GO:0006264) transcription from mitochondrial promoter(GO:0006390) |
| 1.4 | 5.7 | GO:0018032 | peptide amidation(GO:0001519) protein amidation(GO:0018032) peptide modification(GO:0031179) |
| 1.4 | 8.5 | GO:0030950 | establishment or maintenance of actin cytoskeleton polarity(GO:0030950) |
| 1.3 | 16.0 | GO:0051451 | myoblast migration(GO:0051451) |
| 1.3 | 2.6 | GO:0044211 | CTP salvage(GO:0044211) |
| 1.3 | 7.8 | GO:1903435 | positive regulation of constitutive secretory pathway(GO:1903435) |
| 1.3 | 10.0 | GO:0017183 | peptidyl-diphthamide metabolic process(GO:0017182) peptidyl-diphthamide biosynthetic process from peptidyl-histidine(GO:0017183) |
| 1.2 | 30.5 | GO:0045899 | positive regulation of RNA polymerase II transcriptional preinitiation complex assembly(GO:0045899) |
| 1.2 | 1.2 | GO:0050787 | detoxification of mercury ion(GO:0050787) |
| 1.2 | 15.4 | GO:0061458 | reproductive system development(GO:0061458) |
| 1.2 | 7.0 | GO:0097428 | protein maturation by iron-sulfur cluster transfer(GO:0097428) |
| 1.1 | 6.9 | GO:0010724 | regulation of definitive erythrocyte differentiation(GO:0010724) |
| 1.1 | 7.5 | GO:0021842 | directional guidance of interneurons involved in migration from the subpallium to the cortex(GO:0021840) chemorepulsion involved in interneuron migration from the subpallium to the cortex(GO:0021842) |
| 1.1 | 15.9 | GO:0006610 | ribosomal protein import into nucleus(GO:0006610) |
| 1.1 | 13.7 | GO:0010839 | negative regulation of keratinocyte proliferation(GO:0010839) |
| 1.0 | 15.8 | GO:0046007 | negative regulation of activated T cell proliferation(GO:0046007) |
| 1.0 | 6.7 | GO:1903760 | regulation of voltage-gated potassium channel activity involved in ventricular cardiac muscle cell action potential repolarization(GO:1903760) |
| 1.0 | 5.7 | GO:0070885 | negative regulation of calcineurin-NFAT signaling cascade(GO:0070885) |
| 0.9 | 10.2 | GO:0050703 | interleukin-1 alpha secretion(GO:0050703) |
| 0.9 | 2.7 | GO:0006121 | mitochondrial electron transport, succinate to ubiquinone(GO:0006121) |
| 0.9 | 21.4 | GO:0016339 | calcium-dependent cell-cell adhesion via plasma membrane cell adhesion molecules(GO:0016339) |
| 0.9 | 4.5 | GO:1904977 | lymphatic endothelial cell migration(GO:1904977) |
| 0.8 | 5.1 | GO:0000393 | spliceosomal conformational changes to generate catalytic conformation(GO:0000393) |
| 0.8 | 11.9 | GO:1904776 | regulation of protein localization to cell cortex(GO:1904776) positive regulation of protein localization to cell cortex(GO:1904778) |
| 0.8 | 21.9 | GO:0072662 | protein targeting to peroxisome(GO:0006625) protein localization to peroxisome(GO:0072662) establishment of protein localization to peroxisome(GO:0072663) |
| 0.8 | 5.9 | GO:0035093 | spermatogenesis, exchange of chromosomal proteins(GO:0035093) |
| 0.8 | 49.3 | GO:0007157 | heterophilic cell-cell adhesion via plasma membrane cell adhesion molecules(GO:0007157) |
| 0.8 | 3.2 | GO:0006432 | phenylalanyl-tRNA aminoacylation(GO:0006432) |
| 0.8 | 7.2 | GO:2001223 | negative regulation of neuron migration(GO:2001223) |
| 0.8 | 9.5 | GO:0090160 | Golgi to lysosome transport(GO:0090160) |
| 0.8 | 17.6 | GO:0032780 | negative regulation of ATPase activity(GO:0032780) |
| 0.8 | 3.0 | GO:0000255 | allantoin metabolic process(GO:0000255) |
| 0.7 | 5.8 | GO:0006686 | sphingomyelin biosynthetic process(GO:0006686) |
| 0.7 | 11.5 | GO:0043248 | proteasome assembly(GO:0043248) |
| 0.7 | 9.1 | GO:0033147 | negative regulation of intracellular estrogen receptor signaling pathway(GO:0033147) |
| 0.7 | 2.7 | GO:0048698 | negative regulation of collateral sprouting in absence of injury(GO:0048698) |
| 0.7 | 10.1 | GO:0034975 | protein folding in endoplasmic reticulum(GO:0034975) |
| 0.7 | 6.7 | GO:0015781 | pyrimidine nucleotide-sugar transport(GO:0015781) |
| 0.7 | 4.7 | GO:0043353 | enucleate erythrocyte differentiation(GO:0043353) |
| 0.7 | 6.6 | GO:0070836 | caveola assembly(GO:0070836) |
| 0.7 | 6.5 | GO:0039532 | negative regulation of viral-induced cytoplasmic pattern recognition receptor signaling pathway(GO:0039532) |
| 0.6 | 22.0 | GO:0060236 | regulation of mitotic spindle organization(GO:0060236) |
| 0.6 | 4.2 | GO:0098989 | NMDA selective glutamate receptor signaling pathway(GO:0098989) |
| 0.6 | 4.5 | GO:0002051 | osteoblast fate commitment(GO:0002051) |
| 0.6 | 10.6 | GO:0030277 | maintenance of gastrointestinal epithelium(GO:0030277) |
| 0.5 | 5.4 | GO:0051096 | telomere assembly(GO:0032202) positive regulation of helicase activity(GO:0051096) |
| 0.5 | 4.7 | GO:0048194 | Golgi vesicle budding(GO:0048194) |
| 0.5 | 3.6 | GO:0009597 | detection of virus(GO:0009597) |
| 0.5 | 14.5 | GO:0006891 | intra-Golgi vesicle-mediated transport(GO:0006891) |
| 0.5 | 1.4 | GO:0000821 | regulation of arginine metabolic process(GO:0000821) |
| 0.5 | 15.8 | GO:0030705 | cytoskeleton-dependent intracellular transport(GO:0030705) |
| 0.4 | 2.7 | GO:0038172 | interleukin-33-mediated signaling pathway(GO:0038172) |
| 0.4 | 6.7 | GO:0000244 | spliceosomal tri-snRNP complex assembly(GO:0000244) |
| 0.4 | 2.6 | GO:0030916 | otic vesicle formation(GO:0030916) |
| 0.4 | 10.3 | GO:0006978 | ribosomal small subunit assembly(GO:0000028) DNA damage response, signal transduction by p53 class mediator resulting in transcription of p21 class mediator(GO:0006978) DNA damage response, signal transduction resulting in transcription(GO:0042772) |
| 0.4 | 28.4 | GO:0006120 | mitochondrial electron transport, NADH to ubiquinone(GO:0006120) |
| 0.4 | 55.3 | GO:0006334 | nucleosome assembly(GO:0006334) |
| 0.4 | 1.6 | GO:0006828 | manganese ion transport(GO:0006828) |
| 0.4 | 17.6 | GO:1903959 | regulation of anion transmembrane transport(GO:1903959) |
| 0.4 | 3.7 | GO:0032808 | lacrimal gland development(GO:0032808) |
| 0.4 | 10.4 | GO:0072600 | establishment of protein localization to Golgi(GO:0072600) |
| 0.4 | 9.3 | GO:0002089 | lens morphogenesis in camera-type eye(GO:0002089) |
| 0.3 | 11.1 | GO:0000387 | spliceosomal snRNP assembly(GO:0000387) |
| 0.3 | 1.4 | GO:0090362 | positive regulation of platelet-derived growth factor production(GO:0090362) |
| 0.3 | 1.0 | GO:2000653 | regulation of genetic imprinting(GO:2000653) |
| 0.3 | 5.4 | GO:0060628 | regulation of ER to Golgi vesicle-mediated transport(GO:0060628) |
| 0.3 | 1.7 | GO:0071874 | cellular response to norepinephrine stimulus(GO:0071874) |
| 0.3 | 11.6 | GO:0000027 | ribosomal large subunit assembly(GO:0000027) |
| 0.3 | 3.3 | GO:0070884 | regulation of calcineurin-NFAT signaling cascade(GO:0070884) |
| 0.3 | 3.5 | GO:0070307 | lens fiber cell development(GO:0070307) |
| 0.3 | 7.6 | GO:0086069 | bundle of His cell to Purkinje myocyte communication(GO:0086069) |
| 0.3 | 1.3 | GO:0046116 | queuosine biosynthetic process(GO:0008616) queuosine metabolic process(GO:0046116) |
| 0.3 | 0.8 | GO:0000738 | DNA catabolic process, exonucleolytic(GO:0000738) |
| 0.3 | 0.6 | GO:0060164 | midbrain-hindbrain boundary morphogenesis(GO:0021555) cell-cell signaling involved in cell fate commitment(GO:0045168) regulation of timing of neuron differentiation(GO:0060164) |
| 0.3 | 1.4 | GO:0097338 | response to clozapine(GO:0097338) |
| 0.3 | 2.1 | GO:0018401 | peptidyl-proline hydroxylation to 4-hydroxy-L-proline(GO:0018401) |
| 0.3 | 0.8 | GO:0002027 | regulation of heart rate(GO:0002027) |
| 0.3 | 4.9 | GO:0006312 | mitotic recombination(GO:0006312) |
| 0.2 | 10.6 | GO:0000381 | regulation of alternative mRNA splicing, via spliceosome(GO:0000381) |
| 0.2 | 0.5 | GO:1900133 | regulation of renin secretion into blood stream(GO:1900133) |
| 0.2 | 0.9 | GO:0003185 | primary heart field specification(GO:0003138) sinoatrial valve development(GO:0003172) sinoatrial valve morphogenesis(GO:0003185) |
| 0.2 | 5.0 | GO:0032461 | positive regulation of protein oligomerization(GO:0032461) |
| 0.2 | 1.9 | GO:0016139 | glycoside catabolic process(GO:0016139) |
| 0.2 | 1.4 | GO:1902715 | positive regulation of interferon-gamma secretion(GO:1902715) |
| 0.2 | 7.7 | GO:0033119 | negative regulation of RNA splicing(GO:0033119) |
| 0.2 | 12.5 | GO:0070527 | platelet aggregation(GO:0070527) |
| 0.2 | 2.9 | GO:0035562 | negative regulation of chromatin binding(GO:0035562) |
| 0.2 | 1.1 | GO:0007197 | adenylate cyclase-inhibiting G-protein coupled acetylcholine receptor signaling pathway(GO:0007197) |
| 0.2 | 1.3 | GO:0070129 | regulation of mitochondrial translation(GO:0070129) |
| 0.2 | 14.7 | GO:0030834 | regulation of actin filament depolymerization(GO:0030834) |
| 0.2 | 9.1 | GO:1900739 | regulation of protein insertion into mitochondrial membrane involved in apoptotic signaling pathway(GO:1900739) positive regulation of protein insertion into mitochondrial membrane involved in apoptotic signaling pathway(GO:1900740) |
| 0.2 | 4.6 | GO:0001825 | blastocyst formation(GO:0001825) |
| 0.2 | 6.9 | GO:0030866 | cortical actin cytoskeleton organization(GO:0030866) |
| 0.2 | 11.2 | GO:0050850 | positive regulation of calcium-mediated signaling(GO:0050850) |
| 0.2 | 14.5 | GO:0016445 | somatic diversification of immunoglobulins(GO:0016445) |
| 0.2 | 6.4 | GO:1903393 | positive regulation of focal adhesion assembly(GO:0051894) positive regulation of adherens junction organization(GO:1903393) |
| 0.2 | 1.2 | GO:0060686 | negative regulation of prostatic bud formation(GO:0060686) |
| 0.2 | 7.7 | GO:0030490 | maturation of SSU-rRNA(GO:0030490) |
| 0.2 | 4.3 | GO:0006309 | apoptotic DNA fragmentation(GO:0006309) |
| 0.2 | 12.5 | GO:0070125 | mitochondrial translational elongation(GO:0070125) |
| 0.2 | 6.1 | GO:0006622 | protein targeting to lysosome(GO:0006622) |
| 0.2 | 0.9 | GO:0008582 | regulation of synaptic growth at neuromuscular junction(GO:0008582) |
| 0.2 | 0.6 | GO:0000103 | sulfate assimilation(GO:0000103) |
| 0.1 | 1.5 | GO:0005981 | regulation of glycogen catabolic process(GO:0005981) |
| 0.1 | 0.6 | GO:0045162 | clustering of voltage-gated sodium channels(GO:0045162) |
| 0.1 | 5.0 | GO:2000272 | negative regulation of receptor activity(GO:2000272) |
| 0.1 | 5.9 | GO:0070534 | protein K63-linked ubiquitination(GO:0070534) |
| 0.1 | 4.7 | GO:0043928 | exonucleolytic nuclear-transcribed mRNA catabolic process involved in deadenylation-dependent decay(GO:0043928) |
| 0.1 | 11.3 | GO:0031338 | regulation of vesicle fusion(GO:0031338) |
| 0.1 | 3.0 | GO:2000144 | positive regulation of DNA-templated transcription, initiation(GO:2000144) |
| 0.1 | 5.9 | GO:0043252 | sodium-independent organic anion transport(GO:0043252) |
| 0.1 | 0.9 | GO:0046600 | negative regulation of centriole replication(GO:0046600) |
| 0.1 | 8.9 | GO:0019886 | antigen processing and presentation of exogenous peptide antigen via MHC class II(GO:0019886) |
| 0.1 | 2.4 | GO:0010842 | retina layer formation(GO:0010842) |
| 0.1 | 1.3 | GO:0001867 | complement activation, lectin pathway(GO:0001867) |
| 0.1 | 5.2 | GO:0046627 | negative regulation of insulin receptor signaling pathway(GO:0046627) |
| 0.1 | 26.2 | GO:0007018 | microtubule-based movement(GO:0007018) |
| 0.1 | 0.3 | GO:0051088 | PMA-inducible membrane protein ectodomain proteolysis(GO:0051088) |
| 0.1 | 0.7 | GO:0040034 | regulation of development, heterochronic(GO:0040034) regulation of timing of cell differentiation(GO:0048505) |
| 0.1 | 1.8 | GO:0060512 | prostate gland morphogenesis(GO:0060512) |
| 0.1 | 2.7 | GO:0010447 | response to acidic pH(GO:0010447) |
| 0.1 | 5.8 | GO:1900047 | negative regulation of blood coagulation(GO:0030195) negative regulation of hemostasis(GO:1900047) |
| 0.1 | 0.3 | GO:0036071 | N-glycan fucosylation(GO:0036071) |
| 0.1 | 1.3 | GO:0005513 | detection of calcium ion(GO:0005513) |
| 0.1 | 2.9 | GO:0042149 | cellular response to glucose starvation(GO:0042149) |
| 0.1 | 0.7 | GO:0007168 | receptor guanylyl cyclase signaling pathway(GO:0007168) |
| 0.1 | 8.8 | GO:0006626 | protein targeting to mitochondrion(GO:0006626) |
| 0.1 | 8.8 | GO:0006302 | double-strand break repair(GO:0006302) |
| 0.1 | 4.7 | GO:0006687 | glycosphingolipid metabolic process(GO:0006687) |
| 0.1 | 4.8 | GO:0031532 | actin cytoskeleton reorganization(GO:0031532) |
| 0.1 | 8.1 | GO:0032874 | positive regulation of stress-activated MAPK cascade(GO:0032874) positive regulation of stress-activated protein kinase signaling cascade(GO:0070304) |
| 0.1 | 0.3 | GO:0071105 | response to interleukin-9(GO:0071104) response to interleukin-11(GO:0071105) |
| 0.0 | 1.3 | GO:0001580 | detection of chemical stimulus involved in sensory perception of bitter taste(GO:0001580) |
| 0.0 | 0.7 | GO:0061365 | positive regulation of triglyceride lipase activity(GO:0061365) |
| 0.0 | 2.6 | GO:0006418 | tRNA aminoacylation for protein translation(GO:0006418) |
| 0.0 | 19.6 | GO:0001558 | regulation of cell growth(GO:0001558) |
| 0.0 | 5.8 | GO:0034605 | cellular response to heat(GO:0034605) |
| 0.0 | 2.7 | GO:0036498 | IRE1-mediated unfolded protein response(GO:0036498) |
| 0.0 | 2.6 | GO:0006695 | cholesterol biosynthetic process(GO:0006695) |
| 0.0 | 1.7 | GO:0006400 | tRNA modification(GO:0006400) |
| 0.0 | 0.1 | GO:0019227 | neuronal action potential propagation(GO:0019227) action potential propagation(GO:0098870) |
| 0.0 | 0.3 | GO:0003417 | growth plate cartilage development(GO:0003417) |
| 0.0 | 1.1 | GO:0007160 | cell-matrix adhesion(GO:0007160) |
| 0.0 | 0.4 | GO:0000413 | protein peptidyl-prolyl isomerization(GO:0000413) |
| 0.0 | 0.6 | GO:0046785 | microtubule polymerization(GO:0046785) |
Gene overrepresentation in cellular_component category:
| Log-likelihood per target | Total log-likelihood | Term | Description |
|---|---|---|---|
| 7.4 | 51.8 | GO:0072669 | tRNA-splicing ligase complex(GO:0072669) |
| 5.3 | 37.0 | GO:0044326 | dendritic spine neck(GO:0044326) |
| 5.2 | 15.5 | GO:0009330 | DNA topoisomerase complex (ATP-hydrolyzing)(GO:0009330) |
| 5.2 | 20.7 | GO:0036502 | Derlin-1-VIMP complex(GO:0036502) |
| 4.9 | 14.7 | GO:0031428 | box C/D snoRNP complex(GO:0031428) |
| 4.3 | 21.5 | GO:0071148 | TEAD-1-YAP complex(GO:0071148) |
| 3.7 | 11.2 | GO:0043511 | inhibin complex(GO:0043511) inhibin A complex(GO:0043512) |
| 3.1 | 15.4 | GO:0030678 | mitochondrial ribonuclease P complex(GO:0030678) |
| 2.9 | 25.9 | GO:0005827 | polar microtubule(GO:0005827) |
| 2.5 | 30.5 | GO:0031595 | nuclear proteasome complex(GO:0031595) |
| 2.4 | 9.6 | GO:0001405 | presequence translocase-associated import motor(GO:0001405) |
| 1.6 | 4.7 | GO:0005826 | actomyosin contractile ring(GO:0005826) GID complex(GO:0034657) |
| 1.5 | 14.5 | GO:0030126 | COPI vesicle coat(GO:0030126) |
| 1.4 | 11.1 | GO:0097504 | Gemini of coiled bodies(GO:0097504) |
| 1.4 | 16.6 | GO:0043203 | axon hillock(GO:0043203) |
| 1.1 | 10.1 | GO:0072546 | ER membrane protein complex(GO:0072546) |
| 1.1 | 7.5 | GO:0036513 | Derlin-1 retrotranslocation complex(GO:0036513) |
| 1.0 | 17.6 | GO:0000164 | protein phosphatase type 1 complex(GO:0000164) |
| 1.0 | 5.1 | GO:0071012 | catalytic step 1 spliceosome(GO:0071012) |
| 1.0 | 3.0 | GO:0070195 | growth hormone receptor complex(GO:0070195) |
| 0.9 | 13.7 | GO:0005869 | dynactin complex(GO:0005869) |
| 0.9 | 9.1 | GO:0030015 | CCR4-NOT core complex(GO:0030015) |
| 0.9 | 20.0 | GO:0030992 | intraciliary transport particle B(GO:0030992) |
| 0.9 | 17.2 | GO:0005952 | cAMP-dependent protein kinase complex(GO:0005952) |
| 0.8 | 11.9 | GO:0008091 | spectrin(GO:0008091) |
| 0.7 | 7.2 | GO:0044327 | dendritic spine head(GO:0044327) |
| 0.7 | 5.8 | GO:0030688 | preribosome, small subunit precursor(GO:0030688) |
| 0.7 | 4.7 | GO:1990726 | Lsm1-7-Pat1 complex(GO:1990726) |
| 0.7 | 2.7 | GO:0045281 | mitochondrial respiratory chain complex II, succinate dehydrogenase complex (ubiquinone)(GO:0005749) succinate dehydrogenase complex (ubiquinone)(GO:0045257) respiratory chain complex II(GO:0045273) succinate dehydrogenase complex(GO:0045281) fumarate reductase complex(GO:0045283) |
| 0.7 | 18.6 | GO:0070971 | endoplasmic reticulum exit site(GO:0070971) |
| 0.6 | 7.8 | GO:0033093 | Weibel-Palade body(GO:0033093) |
| 0.6 | 6.7 | GO:0097025 | lateral loop(GO:0043219) MPP7-DLG1-LIN7 complex(GO:0097025) |
| 0.5 | 44.6 | GO:0031903 | peroxisomal membrane(GO:0005778) microbody membrane(GO:0031903) |
| 0.5 | 5.4 | GO:0070187 | telosome(GO:0070187) |
| 0.5 | 8.0 | GO:0005641 | nuclear envelope lumen(GO:0005641) |
| 0.5 | 20.5 | GO:0030660 | Golgi-associated vesicle membrane(GO:0030660) |
| 0.5 | 8.3 | GO:0000974 | Prp19 complex(GO:0000974) |
| 0.5 | 48.5 | GO:0015935 | small ribosomal subunit(GO:0015935) |
| 0.5 | 8.5 | GO:0031932 | TORC2 complex(GO:0031932) |
| 0.5 | 18.0 | GO:0031258 | lamellipodium membrane(GO:0031258) |
| 0.4 | 28.4 | GO:0030964 | mitochondrial respiratory chain complex I(GO:0005747) NADH dehydrogenase complex(GO:0030964) respiratory chain complex I(GO:0045271) |
| 0.4 | 7.7 | GO:0005885 | Arp2/3 protein complex(GO:0005885) |
| 0.4 | 6.1 | GO:0044754 | autolysosome(GO:0044754) |
| 0.4 | 1.1 | GO:0034680 | integrin alpha10-beta1 complex(GO:0034680) |
| 0.4 | 2.6 | GO:0097452 | GAIT complex(GO:0097452) |
| 0.3 | 5.4 | GO:0005652 | nuclear lamina(GO:0005652) |
| 0.3 | 7.7 | GO:0032040 | small-subunit processome(GO:0032040) |
| 0.3 | 14.9 | GO:0016235 | aggresome(GO:0016235) |
| 0.3 | 1.1 | GO:0032279 | asymmetric synapse(GO:0032279) |
| 0.3 | 6.7 | GO:0044322 | endoplasmic reticulum quality control compartment(GO:0044322) |
| 0.3 | 44.5 | GO:0042470 | melanosome(GO:0042470) pigment granule(GO:0048770) |
| 0.3 | 13.6 | GO:0035577 | azurophil granule membrane(GO:0035577) |
| 0.3 | 15.8 | GO:0005881 | cytoplasmic microtubule(GO:0005881) |
| 0.2 | 11.6 | GO:0031430 | M band(GO:0031430) |
| 0.2 | 20.5 | GO:0070821 | tertiary granule membrane(GO:0070821) |
| 0.2 | 1.0 | GO:0005943 | phosphatidylinositol 3-kinase complex, class IA(GO:0005943) |
| 0.2 | 11.1 | GO:0009295 | nucleoid(GO:0009295) mitochondrial nucleoid(GO:0042645) |
| 0.2 | 2.6 | GO:0097542 | ciliary tip(GO:0097542) |
| 0.2 | 5.9 | GO:0035861 | site of double-strand break(GO:0035861) |
| 0.2 | 1.2 | GO:0046581 | intercellular canaliculus(GO:0046581) |
| 0.2 | 5.8 | GO:0005921 | gap junction(GO:0005921) |
| 0.2 | 4.5 | GO:0071141 | SMAD protein complex(GO:0071141) |
| 0.2 | 6.5 | GO:0000159 | protein phosphatase type 2A complex(GO:0000159) |
| 0.2 | 40.5 | GO:0005802 | trans-Golgi network(GO:0005802) |
| 0.2 | 0.6 | GO:0042406 | extrinsic component of endoplasmic reticulum membrane(GO:0042406) |
| 0.2 | 19.7 | GO:0022625 | cytosolic large ribosomal subunit(GO:0022625) |
| 0.2 | 3.9 | GO:0071564 | npBAF complex(GO:0071564) |
| 0.2 | 10.8 | GO:0015030 | Cajal body(GO:0015030) |
| 0.2 | 22.7 | GO:0030176 | integral component of endoplasmic reticulum membrane(GO:0030176) |
| 0.1 | 4.6 | GO:0032391 | photoreceptor connecting cilium(GO:0032391) |
| 0.1 | 5.0 | GO:0016592 | mediator complex(GO:0016592) |
| 0.1 | 8.7 | GO:0016328 | lateral plasma membrane(GO:0016328) |
| 0.1 | 15.3 | GO:0005913 | cell-cell adherens junction(GO:0005913) |
| 0.1 | 1.8 | GO:0032433 | filopodium tip(GO:0032433) |
| 0.1 | 24.6 | GO:0005681 | spliceosomal complex(GO:0005681) |
| 0.1 | 5.3 | GO:0010008 | endosome membrane(GO:0010008) |
| 0.1 | 8.4 | GO:0035578 | azurophil granule lumen(GO:0035578) |
| 0.1 | 15.4 | GO:0034399 | nuclear periphery(GO:0034399) |
| 0.1 | 11.0 | GO:0005793 | endoplasmic reticulum-Golgi intermediate compartment(GO:0005793) |
| 0.1 | 5.7 | GO:0032592 | integral component of mitochondrial membrane(GO:0032592) |
| 0.1 | 4.7 | GO:0031519 | PcG protein complex(GO:0031519) |
| 0.1 | 12.5 | GO:0101002 | ficolin-1-rich granule(GO:0101002) ficolin-1-rich granule lumen(GO:1904813) |
| 0.1 | 6.1 | GO:0001750 | photoreceptor outer segment(GO:0001750) |
| 0.1 | 0.9 | GO:0097431 | mitotic spindle pole(GO:0097431) |
| 0.1 | 6.9 | GO:0000118 | histone deacetylase complex(GO:0000118) |
| 0.1 | 54.1 | GO:0005789 | endoplasmic reticulum membrane(GO:0005789) |
| 0.1 | 7.5 | GO:0031901 | early endosome membrane(GO:0031901) |
| 0.1 | 1.6 | GO:0005801 | cis-Golgi network(GO:0005801) |
| 0.1 | 8.1 | GO:0030027 | lamellipodium(GO:0030027) |
| 0.1 | 0.7 | GO:0043194 | axon initial segment(GO:0043194) |
| 0.1 | 24.7 | GO:0005925 | cell-substrate adherens junction(GO:0005924) focal adhesion(GO:0005925) |
| 0.1 | 8.7 | GO:0031225 | anchored component of membrane(GO:0031225) |
| 0.1 | 15.3 | GO:0016607 | nuclear speck(GO:0016607) |
| 0.1 | 8.7 | GO:0090575 | RNA polymerase II transcription factor complex(GO:0090575) |
| 0.0 | 0.3 | GO:0035985 | senescence-associated heterochromatin focus(GO:0035985) |
| 0.0 | 0.9 | GO:0030673 | axolemma(GO:0030673) |
| 0.0 | 2.6 | GO:0005901 | caveola(GO:0005901) |
| 0.0 | 2.3 | GO:0016020 | membrane(GO:0016020) |
| 0.0 | 1.2 | GO:0005811 | lipid particle(GO:0005811) |
| 0.0 | 1.5 | GO:0098791 | Golgi subcompartment(GO:0098791) |
| 0.0 | 1.3 | GO:0034705 | voltage-gated potassium channel complex(GO:0008076) potassium channel complex(GO:0034705) |
Gene overrepresentation in molecular_function category:
| Log-likelihood per target | Total log-likelihood | Term | Description |
|---|---|---|---|
| 6.7 | 26.9 | GO:0003938 | IMP dehydrogenase activity(GO:0003938) |
| 6.5 | 25.9 | GO:0031208 | POZ domain binding(GO:0031208) |
| 5.2 | 15.5 | GO:0003918 | DNA topoisomerase type II (ATP-hydrolyzing) activity(GO:0003918) DNA topoisomerase II activity(GO:0061505) |
| 5.0 | 14.9 | GO:0036317 | tyrosyl-RNA phosphodiesterase activity(GO:0036317) 5'-tyrosyl-DNA phosphodiesterase activity(GO:0070260) |
| 4.6 | 13.7 | GO:0033149 | FFAT motif binding(GO:0033149) |
| 4.5 | 13.4 | GO:0035529 | 8-oxo-7,8-dihydroguanosine triphosphate pyrophosphatase activity(GO:0008413) NADH pyrophosphatase activity(GO:0035529) 8-oxo-7,8-dihydrodeoxyguanosine triphosphate pyrophosphatase activity(GO:0035539) |
| 4.4 | 22.0 | GO:0061676 | importin-alpha family protein binding(GO:0061676) |
| 4.1 | 16.4 | GO:0008184 | purine nucleobase binding(GO:0002060) glycogen phosphorylase activity(GO:0008184) |
| 3.7 | 11.2 | GO:0070699 | type II activin receptor binding(GO:0070699) |
| 3.6 | 21.8 | GO:0102336 | fatty acid elongase activity(GO:0009922) 3-oxo-arachidoyl-CoA synthase activity(GO:0102336) 3-oxo-cerotoyl-CoA synthase activity(GO:0102337) 3-oxo-lignoceronyl-CoA synthase activity(GO:0102338) |
| 3.3 | 19.6 | GO:0044594 | 3alpha,7alpha,12alpha-trihydroxy-5beta-cholest-24-enoyl-CoA hydratase activity(GO:0033989) 17-beta-hydroxysteroid dehydrogenase (NAD+) activity(GO:0044594) |
| 3.3 | 13.1 | GO:0030337 | DNA polymerase processivity factor activity(GO:0030337) |
| 3.2 | 16.1 | GO:0071074 | eukaryotic initiation factor eIF2 binding(GO:0071074) |
| 2.9 | 20.2 | GO:0004849 | uridine kinase activity(GO:0004849) |
| 2.8 | 30.5 | GO:0036402 | proteasome-activating ATPase activity(GO:0036402) |
| 2.6 | 15.9 | GO:0060698 | endoribonuclease inhibitor activity(GO:0060698) |
| 2.4 | 23.9 | GO:0070053 | thrombospondin receptor activity(GO:0070053) |
| 2.1 | 8.5 | GO:0003990 | acetylcholinesterase activity(GO:0003990) |
| 1.9 | 7.7 | GO:0070735 | protein-glycine ligase activity(GO:0070735) |
| 1.9 | 5.8 | GO:0000773 | phosphatidyl-N-methylethanolamine N-methyltransferase activity(GO:0000773) phosphatidylethanolamine N-methyltransferase activity(GO:0004608) phosphatidyl-N-dimethylethanolamine N-methyltransferase activity(GO:0080101) |
| 1.8 | 7.0 | GO:0016822 | hydrolase activity, acting on acid carbon-carbon bonds(GO:0016822) hydrolase activity, acting on acid carbon-carbon bonds, in ketonic substances(GO:0016823) |
| 1.7 | 51.8 | GO:0000993 | RNA polymerase II core binding(GO:0000993) |
| 1.6 | 4.9 | GO:0005169 | neurotrophin TRKB receptor binding(GO:0005169) |
| 1.6 | 4.9 | GO:0015616 | DNA translocase activity(GO:0015616) |
| 1.5 | 15.4 | GO:0010314 | phosphatidylinositol-5-phosphate binding(GO:0010314) |
| 1.4 | 5.7 | GO:0004504 | peptidylglycine monooxygenase activity(GO:0004504) peptidylamidoglycolate lyase activity(GO:0004598) |
| 1.4 | 4.3 | GO:0004531 | deoxyribonuclease II activity(GO:0004531) |
| 1.3 | 18.4 | GO:0043024 | ribosomal small subunit binding(GO:0043024) |
| 1.2 | 4.9 | GO:0031871 | proteinase activated receptor binding(GO:0031871) |
| 1.2 | 22.9 | GO:0005385 | zinc ion transmembrane transporter activity(GO:0005385) |
| 1.2 | 11.9 | GO:0042731 | PH domain binding(GO:0042731) |
| 1.1 | 20.5 | GO:1990381 | ubiquitin-specific protease binding(GO:1990381) |
| 1.1 | 42.3 | GO:0004198 | calcium-dependent cysteine-type endopeptidase activity(GO:0004198) |
| 1.0 | 14.7 | GO:0030215 | semaphorin receptor binding(GO:0030215) |
| 1.0 | 27.6 | GO:0016505 | peptidase activator activity involved in apoptotic process(GO:0016505) |
| 1.0 | 14.7 | GO:0001094 | TFIID-class transcription factor binding(GO:0001094) |
| 1.0 | 15.4 | GO:0004526 | ribonuclease P activity(GO:0004526) |
| 1.0 | 6.7 | GO:0050733 | RS domain binding(GO:0050733) |
| 1.0 | 7.6 | GO:1904264 | ubiquitin protein ligase activity involved in ERAD pathway(GO:1904264) |
| 0.9 | 26.4 | GO:0005388 | calcium-transporting ATPase activity(GO:0005388) |
| 0.9 | 2.7 | GO:0008177 | succinate dehydrogenase (ubiquinone) activity(GO:0008177) |
| 0.9 | 16.0 | GO:0017049 | GTP-Rho binding(GO:0017049) |
| 0.9 | 20.3 | GO:0098641 | cadherin binding involved in cell-cell adhesion(GO:0098641) |
| 0.9 | 6.8 | GO:0001849 | complement component C1q binding(GO:0001849) |
| 0.8 | 6.7 | GO:0015165 | pyrimidine nucleotide-sugar transmembrane transporter activity(GO:0015165) |
| 0.8 | 3.2 | GO:0004826 | phenylalanine-tRNA ligase activity(GO:0004826) |
| 0.8 | 15.8 | GO:0008603 | cAMP-dependent protein kinase regulator activity(GO:0008603) |
| 0.8 | 24.6 | GO:0070064 | proline-rich region binding(GO:0070064) |
| 0.7 | 8.2 | GO:0045295 | gamma-catenin binding(GO:0045295) |
| 0.7 | 7.5 | GO:0005176 | ErbB-2 class receptor binding(GO:0005176) |
| 0.7 | 4.2 | GO:0047685 | amine sulfotransferase activity(GO:0047685) |
| 0.7 | 2.1 | GO:0032422 | purine-rich negative regulatory element binding(GO:0032422) |
| 0.7 | 9.9 | GO:0017151 | DEAD/H-box RNA helicase binding(GO:0017151) |
| 0.6 | 12.2 | GO:0016500 | protein-hormone receptor activity(GO:0016500) |
| 0.6 | 6.7 | GO:0004571 | mannosyl-oligosaccharide 1,2-alpha-mannosidase activity(GO:0004571) |
| 0.6 | 35.3 | GO:0019894 | kinesin binding(GO:0019894) |
| 0.6 | 6.7 | GO:0097016 | L27 domain binding(GO:0097016) |
| 0.6 | 12.0 | GO:0050786 | RAGE receptor binding(GO:0050786) |
| 0.6 | 21.9 | GO:0031593 | polyubiquitin binding(GO:0031593) |
| 0.6 | 8.0 | GO:0051787 | misfolded protein binding(GO:0051787) |
| 0.6 | 1.7 | GO:0008192 | RNA guanylyltransferase activity(GO:0008192) |
| 0.6 | 29.4 | GO:0008137 | NADH dehydrogenase (ubiquinone) activity(GO:0008137) NADH dehydrogenase (quinone) activity(GO:0050136) |
| 0.5 | 3.3 | GO:0008597 | calcium-dependent protein serine/threonine phosphatase regulator activity(GO:0008597) |
| 0.5 | 17.6 | GO:0008308 | voltage-gated anion channel activity(GO:0008308) |
| 0.5 | 2.7 | GO:0008420 | CTD phosphatase activity(GO:0008420) |
| 0.5 | 5.8 | GO:0089720 | caspase binding(GO:0089720) |
| 0.5 | 7.3 | GO:0042043 | neurexin family protein binding(GO:0042043) |
| 0.5 | 5.0 | GO:0070492 | oligosaccharide binding(GO:0070492) |
| 0.5 | 8.5 | GO:0080025 | phosphatidylinositol-3,5-bisphosphate binding(GO:0080025) |
| 0.5 | 9.1 | GO:0070016 | armadillo repeat domain binding(GO:0070016) |
| 0.4 | 2.7 | GO:0002114 | interleukin-33 receptor activity(GO:0002114) |
| 0.4 | 3.5 | GO:0008172 | S-methyltransferase activity(GO:0008172) |
| 0.4 | 15.9 | GO:0008139 | nuclear localization sequence binding(GO:0008139) |
| 0.4 | 10.7 | GO:0008198 | ferrous iron binding(GO:0008198) |
| 0.4 | 3.9 | GO:0031013 | troponin I binding(GO:0031013) |
| 0.4 | 4.7 | GO:0070273 | phosphatidylinositol-4-phosphate binding(GO:0070273) |
| 0.4 | 5.1 | GO:0034450 | ubiquitin-ubiquitin ligase activity(GO:0034450) |
| 0.4 | 9.9 | GO:0070742 | C2H2 zinc finger domain binding(GO:0070742) |
| 0.3 | 4.7 | GO:0008140 | cAMP response element binding protein binding(GO:0008140) |
| 0.3 | 5.0 | GO:0042809 | vitamin D receptor binding(GO:0042809) |
| 0.3 | 11.7 | GO:0001103 | RNA polymerase II repressing transcription factor binding(GO:0001103) |
| 0.3 | 3.6 | GO:0015194 | L-serine transmembrane transporter activity(GO:0015194) serine transmembrane transporter activity(GO:0022889) |
| 0.3 | 1.2 | GO:0008449 | N-acetylglucosamine-6-sulfatase activity(GO:0008449) |
| 0.3 | 7.8 | GO:0031489 | myosin V binding(GO:0031489) |
| 0.3 | 0.8 | GO:0008859 | exoribonuclease II activity(GO:0008859) |
| 0.3 | 18.0 | GO:0003743 | translation initiation factor activity(GO:0003743) |
| 0.3 | 5.9 | GO:0015125 | bile acid transmembrane transporter activity(GO:0015125) |
| 0.3 | 1.3 | GO:0008479 | queuine tRNA-ribosyltransferase activity(GO:0008479) |
| 0.2 | 1.5 | GO:0017018 | myosin phosphatase activity(GO:0017018) |
| 0.2 | 16.6 | GO:0050681 | androgen receptor binding(GO:0050681) |
| 0.2 | 1.2 | GO:0018479 | benzaldehyde dehydrogenase (NAD+) activity(GO:0018479) |
| 0.2 | 4.6 | GO:0031369 | translation initiation factor binding(GO:0031369) |
| 0.2 | 11.2 | GO:0005080 | protein kinase C binding(GO:0005080) |
| 0.2 | 1.7 | GO:0051425 | PTB domain binding(GO:0051425) |
| 0.2 | 1.1 | GO:0098639 | collagen binding involved in cell-matrix adhesion(GO:0098639) |
| 0.2 | 1.1 | GO:0016907 | G-protein coupled acetylcholine receptor activity(GO:0016907) |
| 0.2 | 36.3 | GO:0005178 | integrin binding(GO:0005178) |
| 0.2 | 5.7 | GO:0005123 | death receptor binding(GO:0005123) |
| 0.2 | 0.6 | GO:0004781 | adenylylsulfate kinase activity(GO:0004020) sulfate adenylyltransferase activity(GO:0004779) sulfate adenylyltransferase (ATP) activity(GO:0004781) |
| 0.2 | 0.6 | GO:0004947 | bradykinin receptor activity(GO:0004947) |
| 0.2 | 5.2 | GO:0005104 | fibroblast growth factor receptor binding(GO:0005104) |
| 0.2 | 39.9 | GO:0003735 | structural constituent of ribosome(GO:0003735) |
| 0.2 | 2.6 | GO:0035613 | RNA stem-loop binding(GO:0035613) |
| 0.2 | 2.6 | GO:0045505 | dynein intermediate chain binding(GO:0045505) |
| 0.1 | 1.0 | GO:0035005 | 1-phosphatidylinositol-4-phosphate 3-kinase activity(GO:0035005) |
| 0.1 | 1.4 | GO:0015174 | basic amino acid transmembrane transporter activity(GO:0015174) |
| 0.1 | 12.7 | GO:0003727 | single-stranded RNA binding(GO:0003727) |
| 0.1 | 1.6 | GO:0015279 | store-operated calcium channel activity(GO:0015279) |
| 0.1 | 1.3 | GO:0033038 | bitter taste receptor activity(GO:0033038) |
| 0.1 | 1.2 | GO:0043225 | anion transmembrane-transporting ATPase activity(GO:0043225) |
| 0.1 | 3.5 | GO:0005109 | frizzled binding(GO:0005109) |
| 0.1 | 1.4 | GO:0004691 | cAMP-dependent protein kinase activity(GO:0004691) |
| 0.1 | 7.2 | GO:0048365 | Rac GTPase binding(GO:0048365) |
| 0.1 | 3.5 | GO:0070577 | lysine-acetylated histone binding(GO:0070577) |
| 0.1 | 16.7 | GO:0005200 | structural constituent of cytoskeleton(GO:0005200) |
| 0.1 | 10.1 | GO:0004867 | serine-type endopeptidase inhibitor activity(GO:0004867) |
| 0.1 | 7.0 | GO:0015459 | potassium channel regulator activity(GO:0015459) |
| 0.1 | 0.9 | GO:0035198 | miRNA binding(GO:0035198) |
| 0.1 | 0.3 | GO:0008424 | glycoprotein 6-alpha-L-fucosyltransferase activity(GO:0008424) alpha-(1->6)-fucosyltransferase activity(GO:0046921) |
| 0.1 | 0.5 | GO:0003707 | steroid hormone receptor activity(GO:0003707) |
| 0.1 | 2.9 | GO:0004386 | helicase activity(GO:0004386) |
| 0.1 | 6.5 | GO:0019888 | protein phosphatase regulator activity(GO:0019888) |
| 0.1 | 9.8 | GO:0042393 | histone binding(GO:0042393) |
| 0.1 | 9.8 | GO:0017137 | Rab GTPase binding(GO:0017137) |
| 0.1 | 0.6 | GO:0086080 | protein binding involved in heterotypic cell-cell adhesion(GO:0086080) |
| 0.1 | 0.7 | GO:0003950 | NAD+ ADP-ribosyltransferase activity(GO:0003950) |
| 0.1 | 4.2 | GO:0016782 | transferase activity, transferring sulfur-containing groups(GO:0016782) |
| 0.0 | 1.3 | GO:0003746 | translation elongation factor activity(GO:0003746) |
| 0.0 | 2.6 | GO:0004177 | aminopeptidase activity(GO:0004177) |
| 0.0 | 0.2 | GO:0023024 | MHC class I protein complex binding(GO:0023024) |
| 0.0 | 0.3 | GO:0050693 | LBD domain binding(GO:0050693) |
| 0.0 | 11.7 | GO:0045296 | cadherin binding(GO:0045296) |
| 0.0 | 0.4 | GO:0016018 | cyclosporin A binding(GO:0016018) |
| 0.0 | 0.3 | GO:0030742 | GTP-dependent protein binding(GO:0030742) |
| 0.0 | 0.7 | GO:0004383 | guanylate cyclase activity(GO:0004383) |
| 0.0 | 7.5 | GO:0003924 | GTPase activity(GO:0003924) |
| 0.0 | 0.5 | GO:0005537 | mannose binding(GO:0005537) |
| 0.0 | 6.5 | GO:0003714 | transcription corepressor activity(GO:0003714) |
| 0.0 | 0.8 | GO:0043027 | cysteine-type endopeptidase inhibitor activity involved in apoptotic process(GO:0043027) |
| 0.0 | 3.4 | GO:0003705 | transcription factor activity, RNA polymerase II distal enhancer sequence-specific binding(GO:0003705) |
| 0.0 | 3.9 | GO:0061630 | ubiquitin protein ligase activity(GO:0061630) ubiquitin-like protein ligase activity(GO:0061659) |
| 0.0 | 2.0 | GO:0005070 | SH3/SH2 adaptor activity(GO:0005070) |
| 0.0 | 1.0 | GO:0000978 | RNA polymerase II core promoter proximal region sequence-specific DNA binding(GO:0000978) |
| 0.0 | 0.3 | GO:0004861 | cyclin-dependent protein serine/threonine kinase inhibitor activity(GO:0004861) |
| 0.0 | 1.2 | GO:0030165 | PDZ domain binding(GO:0030165) |
| 0.0 | 1.6 | GO:0004222 | metalloendopeptidase activity(GO:0004222) |
| 0.0 | 0.6 | GO:0042826 | histone deacetylase binding(GO:0042826) |
Gene overrepresentation in C2:CP category:
| Log-likelihood per target | Total log-likelihood | Term | Description |
|---|---|---|---|
| 0.8 | 25.9 | PID WNT CANONICAL PATHWAY | Canonical Wnt signaling pathway |
| 0.5 | 40.5 | PID DELTA NP63 PATHWAY | Validated transcriptional targets of deltaNp63 isoforms |
| 0.4 | 2.4 | PID NECTIN PATHWAY | Nectin adhesion pathway |
| 0.4 | 15.8 | PID ALK1 PATHWAY | ALK1 signaling events |
| 0.4 | 22.9 | PID NEPHRIN NEPH1 PATHWAY | Nephrin/Neph1 signaling in the kidney podocyte |
| 0.4 | 35.9 | PID TRKR PATHWAY | Neurotrophic factor-mediated Trk receptor signaling |
| 0.4 | 23.5 | PID PLK1 PATHWAY | PLK1 signaling events |
| 0.4 | 14.9 | PID CD40 PATHWAY | CD40/CD40L signaling |
| 0.3 | 5.7 | SA PROGRAMMED CELL DEATH | Programmed cell death, or apoptosis, eliminates damaged or unneeded cells. |
| 0.3 | 11.6 | PID HDAC CLASSIII PATHWAY | Signaling events mediated by HDAC Class III |
| 0.3 | 17.8 | PID KIT PATHWAY | Signaling events mediated by Stem cell factor receptor (c-Kit) |
| 0.3 | 9.9 | ST DIFFERENTIATION PATHWAY IN PC12 CELLS | Differentiation Pathway in PC12 Cells; this is a specific case of PAC1 Receptor Pathway. |
| 0.3 | 11.2 | PID SYNDECAN 4 PATHWAY | Syndecan-4-mediated signaling events |
| 0.3 | 8.5 | PID PI3KCI AKT PATHWAY | Class I PI3K signaling events mediated by Akt |
| 0.3 | 6.9 | PID PI3K PLC TRK PATHWAY | Trk receptor signaling mediated by PI3K and PLC-gamma |
| 0.2 | 6.8 | ST MYOCYTE AD PATHWAY | Myocyte Adrenergic Pathway is a specific case of the generalized Adrenergic Pathway. |
| 0.2 | 17.2 | PID INTEGRIN A4B1 PATHWAY | Alpha4 beta1 integrin signaling events |
| 0.2 | 5.3 | PID INSULIN PATHWAY | Insulin Pathway |
| 0.2 | 6.7 | PID ECADHERIN NASCENT AJ PATHWAY | E-cadherin signaling in the nascent adherens junction |
| 0.2 | 9.7 | PID CDC42 REG PATHWAY | Regulation of CDC42 activity |
| 0.2 | 5.4 | PID SYNDECAN 3 PATHWAY | Syndecan-3-mediated signaling events |
| 0.2 | 17.3 | PID ERA GENOMIC PATHWAY | Validated nuclear estrogen receptor alpha network |
| 0.2 | 5.9 | PID ATM PATHWAY | ATM pathway |
| 0.1 | 6.3 | PID HES HEY PATHWAY | Notch-mediated HES/HEY network |
| 0.1 | 13.1 | PID E2F PATHWAY | E2F transcription factor network |
| 0.1 | 6.4 | PID ILK PATHWAY | Integrin-linked kinase signaling |
| 0.1 | 7.7 | PID RHOA REG PATHWAY | Regulation of RhoA activity |
| 0.1 | 5.0 | PID SYNDECAN 1 PATHWAY | Syndecan-1-mediated signaling events |
| 0.1 | 6.7 | PID INTEGRIN3 PATHWAY | Beta3 integrin cell surface interactions |
| 0.1 | 2.7 | PID SMAD2 3PATHWAY | Regulation of cytoplasmic and nuclear SMAD2/3 signaling |
| 0.1 | 5.3 | PID CDC42 PATHWAY | CDC42 signaling events |
| 0.1 | 1.6 | PID P38 MKK3 6PATHWAY | p38 MAPK signaling pathway |
| 0.1 | 5.4 | PID TELOMERASE PATHWAY | Regulation of Telomerase |
| 0.1 | 2.6 | PID TGFBR PATHWAY | TGF-beta receptor signaling |
| 0.1 | 2.7 | PID IL1 PATHWAY | IL1-mediated signaling events |
| 0.1 | 4.4 | PID RB 1PATHWAY | Regulation of retinoblastoma protein |
| 0.1 | 1.7 | PID GLYPICAN 1PATHWAY | Glypican 1 network |
| 0.1 | 9.3 | PID P53 DOWNSTREAM PATHWAY | Direct p53 effectors |
| 0.1 | 3.2 | PID NFAT TFPATHWAY | Calcineurin-regulated NFAT-dependent transcription in lymphocytes |
| 0.1 | 1.1 | PID INTEGRIN1 PATHWAY | Beta1 integrin cell surface interactions |
| 0.0 | 3.5 | WNT SIGNALING | Genes related to Wnt-mediated signal transduction |
| 0.0 | 1.6 | PID ERBB1 DOWNSTREAM PATHWAY | ErbB1 downstream signaling |
| 0.0 | 0.7 | PID CONE PATHWAY | Visual signal transduction: Cones |
| 0.0 | 0.7 | PID FGF PATHWAY | FGF signaling pathway |
| 0.0 | 0.3 | PID PS1 PATHWAY | Presenilin action in Notch and Wnt signaling |
Gene overrepresentation in C2:CP:REACTOME category:
| Log-likelihood per target | Total log-likelihood | Term | Description |
|---|---|---|---|
| 1.6 | 26.9 | REACTOME PURINE RIBONUCLEOSIDE MONOPHOSPHATE BIOSYNTHESIS | Genes involved in Purine ribonucleoside monophosphate biosynthesis |
| 1.5 | 14.5 | REACTOME COPI MEDIATED TRANSPORT | Genes involved in COPI Mediated Transport |
| 1.4 | 22.9 | REACTOME ZINC TRANSPORTERS | Genes involved in Zinc transporters |
| 1.3 | 19.6 | REACTOME ALPHA LINOLENIC ACID ALA METABOLISM | Genes involved in alpha-linolenic acid (ALA) metabolism |
| 1.0 | 21.8 | REACTOME SYNTHESIS OF VERY LONG CHAIN FATTY ACYL COAS | Genes involved in Synthesis of very long-chain fatty acyl-CoAs |
| 0.9 | 27.4 | REACTOME SIGNALING BY HIPPO | Genes involved in Signaling by Hippo |
| 0.9 | 15.9 | REACTOME DESTABILIZATION OF MRNA BY TRISTETRAPROLIN TTP | Genes involved in Destabilization of mRNA by Tristetraprolin (TTP) |
| 0.9 | 10.4 | REACTOME RAF MAP KINASE CASCADE | Genes involved in RAF/MAP kinase cascade |
| 0.8 | 16.1 | REACTOME DCC MEDIATED ATTRACTIVE SIGNALING | Genes involved in DCC mediated attractive signaling |
| 0.7 | 9.8 | REACTOME GLYCOPROTEIN HORMONES | Genes involved in Glycoprotein hormones |
| 0.7 | 23.9 | REACTOME SIGNAL REGULATORY PROTEIN SIRP FAMILY INTERACTIONS | Genes involved in Signal regulatory protein (SIRP) family interactions |
| 0.6 | 16.4 | REACTOME GLYCOGEN BREAKDOWN GLYCOGENOLYSIS | Genes involved in Glycogen breakdown (glycogenolysis) |
| 0.6 | 15.8 | REACTOME POST CHAPERONIN TUBULIN FOLDING PATHWAY | Genes involved in Post-chaperonin tubulin folding pathway |
| 0.5 | 17.2 | REACTOME PKA MEDIATED PHOSPHORYLATION OF CREB | Genes involved in PKA-mediated phosphorylation of CREB |
| 0.5 | 17.6 | REACTOME PYRIMIDINE METABOLISM | Genes involved in Pyrimidine metabolism |
| 0.5 | 8.5 | REACTOME SYNTHESIS SECRETION AND DEACYLATION OF GHRELIN | Genes involved in Synthesis, Secretion, and Deacylation of Ghrelin |
| 0.5 | 25.8 | REACTOME ION TRANSPORT BY P TYPE ATPASES | Genes involved in Ion transport by P-type ATPases |
| 0.4 | 30.5 | REACTOME CROSS PRESENTATION OF SOLUBLE EXOGENOUS ANTIGENS ENDOSOMES | Genes involved in Cross-presentation of soluble exogenous antigens (endosomes) |
| 0.4 | 13.7 | REACTOME SPHINGOLIPID DE NOVO BIOSYNTHESIS | Genes involved in Sphingolipid de novo biosynthesis |
| 0.4 | 6.7 | REACTOME CALNEXIN CALRETICULIN CYCLE | Genes involved in Calnexin/calreticulin cycle |
| 0.4 | 4.7 | REACTOME MRNA DECAY BY 5 TO 3 EXORIBONUCLEASE | Genes involved in mRNA Decay by 5' to 3' Exoribonuclease |
| 0.4 | 7.5 | REACTOME SHC1 EVENTS IN ERBB4 SIGNALING | Genes involved in SHC1 events in ERBB4 signaling |
| 0.4 | 32.1 | REACTOME RESPIRATORY ELECTRON TRANSPORT | Genes involved in Respiratory electron transport |
| 0.4 | 23.5 | REACTOME MITOCHONDRIAL PROTEIN IMPORT | Genes involved in Mitochondrial Protein Import |
| 0.4 | 6.7 | REACTOME IONOTROPIC ACTIVITY OF KAINATE RECEPTORS | Genes involved in Ionotropic activity of Kainate Receptors |
| 0.3 | 7.8 | REACTOME INSULIN SYNTHESIS AND PROCESSING | Genes involved in Insulin Synthesis and Processing |
| 0.3 | 6.6 | REACTOME INTRINSIC PATHWAY | Genes involved in Intrinsic Pathway |
| 0.3 | 6.4 | REACTOME TIE2 SIGNALING | Genes involved in Tie2 Signaling |
| 0.3 | 5.7 | REACTOME ACTIVATION OF BH3 ONLY PROTEINS | Genes involved in Activation of BH3-only proteins |
| 0.3 | 6.5 | REACTOME PLATELET SENSITIZATION BY LDL | Genes involved in Platelet sensitization by LDL |
| 0.3 | 8.5 | REACTOME CD28 DEPENDENT PI3K AKT SIGNALING | Genes involved in CD28 dependent PI3K/Akt signaling |
| 0.3 | 5.2 | REACTOME ACTIVATED POINT MUTANTS OF FGFR2 | Genes involved in Activated point mutants of FGFR2 |
| 0.2 | 2.1 | REACTOME OXYGEN DEPENDENT PROLINE HYDROXYLATION OF HYPOXIA INDUCIBLE FACTOR ALPHA | Genes involved in Oxygen-dependent Proline Hydroxylation of Hypoxia-inducible Factor Alpha |
| 0.2 | 3.2 | REACTOME TRYPTOPHAN CATABOLISM | Genes involved in Tryptophan catabolism |
| 0.2 | 6.1 | REACTOME CELL EXTRACELLULAR MATRIX INTERACTIONS | Genes involved in Cell-extracellular matrix interactions |
| 0.2 | 5.8 | REACTOME SYNTHESIS OF PC | Genes involved in Synthesis of PC |
| 0.2 | 5.0 | REACTOME REGULATION OF INSULIN LIKE GROWTH FACTOR IGF ACTIVITY BY INSULIN LIKE GROWTH FACTOR BINDING PROTEINS IGFBPS | Genes involved in Regulation of Insulin-like Growth Factor (IGF) Activity by Insulin-like Growth Factor Binding Proteins (IGFBPs) |
| 0.2 | 11.1 | REACTOME METABOLISM OF NON CODING RNA | Genes involved in Metabolism of non-coding RNA |
| 0.2 | 6.8 | REACTOME SIGNALING BY ROBO RECEPTOR | Genes involved in Signaling by Robo receptor |
| 0.2 | 7.7 | REACTOME NRAGE SIGNALS DEATH THROUGH JNK | Genes involved in NRAGE signals death through JNK |
| 0.1 | 6.9 | REACTOME TRAFFICKING OF AMPA RECEPTORS | Genes involved in Trafficking of AMPA receptors |
| 0.1 | 1.6 | REACTOME ROLE OF SECOND MESSENGERS IN NETRIN1 SIGNALING | Genes involved in Role of second messengers in netrin-1 signaling |
| 0.1 | 6.7 | REACTOME TRANSPORT OF VITAMINS NUCLEOSIDES AND RELATED MOLECULES | Genes involved in Transport of vitamins, nucleosides, and related molecules |
| 0.1 | 10.5 | REACTOME GOLGI ASSOCIATED VESICLE BIOGENESIS | Genes involved in Golgi Associated Vesicle Biogenesis |
| 0.1 | 19.2 | REACTOME PEPTIDE CHAIN ELONGATION | Genes involved in Peptide chain elongation |
| 0.1 | 12.6 | REACTOME MHC CLASS II ANTIGEN PRESENTATION | Genes involved in MHC class II antigen presentation |
| 0.1 | 2.4 | REACTOME FORMATION OF FIBRIN CLOT CLOTTING CASCADE | Genes involved in Formation of Fibrin Clot (Clotting Cascade) |
| 0.1 | 6.9 | REACTOME ACTIVATION OF CHAPERONE GENES BY XBP1S | Genes involved in Activation of Chaperone Genes by XBP1(S) |
| 0.1 | 3.5 | REACTOME SULFUR AMINO ACID METABOLISM | Genes involved in Sulfur amino acid metabolism |
| 0.1 | 11.6 | REACTOME PPARA ACTIVATES GENE EXPRESSION | Genes involved in PPARA Activates Gene Expression |
| 0.1 | 15.2 | REACTOME ANTIGEN PROCESSING UBIQUITINATION PROTEASOME DEGRADATION | Genes involved in Antigen processing: Ubiquitination & Proteasome degradation |
| 0.1 | 1.5 | REACTOME HORMONE SENSITIVE LIPASE HSL MEDIATED TRIACYLGLYCEROL HYDROLYSIS | Genes involved in Hormone-sensitive lipase (HSL)-mediated triacylglycerol hydrolysis |
| 0.1 | 2.6 | REACTOME CYTOSOLIC TRNA AMINOACYLATION | Genes involved in Cytosolic tRNA aminoacylation |
| 0.1 | 1.7 | REACTOME ADVANCED GLYCOSYLATION ENDPRODUCT RECEPTOR SIGNALING | Genes involved in Advanced glycosylation endproduct receptor signaling |
| 0.1 | 1.0 | REACTOME PROLACTIN RECEPTOR SIGNALING | Genes involved in Prolactin receptor signaling |
| 0.1 | 2.7 | REACTOME IL1 SIGNALING | Genes involved in Interleukin-1 signaling |
| 0.0 | 0.3 | REACTOME RECEPTOR LIGAND BINDING INITIATES THE SECOND PROTEOLYTIC CLEAVAGE OF NOTCH RECEPTOR | Genes involved in Receptor-ligand binding initiates the second proteolytic cleavage of Notch receptor |
| 0.0 | 0.9 | REACTOME ERK MAPK TARGETS | Genes involved in ERK/MAPK targets |
| 0.0 | 1.2 | REACTOME ABC FAMILY PROTEINS MEDIATED TRANSPORT | Genes involved in ABC-family proteins mediated transport |
| 0.0 | 1.3 | REACTOME CGMP EFFECTS | Genes involved in cGMP effects |
| 0.0 | 1.1 | REACTOME AMINE LIGAND BINDING RECEPTORS | Genes involved in Amine ligand-binding receptors |
| 0.0 | 0.7 | REACTOME LIPID DIGESTION MOBILIZATION AND TRANSPORT | Genes involved in Lipid digestion, mobilization, and transport |
| 0.0 | 0.6 | REACTOME INTERACTION BETWEEN L1 AND ANKYRINS | Genes involved in Interaction between L1 and Ankyrins |
| 0.0 | 0.6 | REACTOME REGULATION OF BETA CELL DEVELOPMENT | Genes involved in Regulation of beta-cell development |
| 0.0 | 0.9 | REACTOME LOSS OF NLP FROM MITOTIC CENTROSOMES | Genes involved in Loss of Nlp from mitotic centrosomes |
| 0.0 | 0.6 | REACTOME PACKAGING OF TELOMERE ENDS | Genes involved in Packaging Of Telomere Ends |