Project
GNF SymAtlas + NCI-60 cancer cell lines, comparison of cancers vs non-cancers, human (Su, 2004; Ross, 2000)
Navigation
Downloads
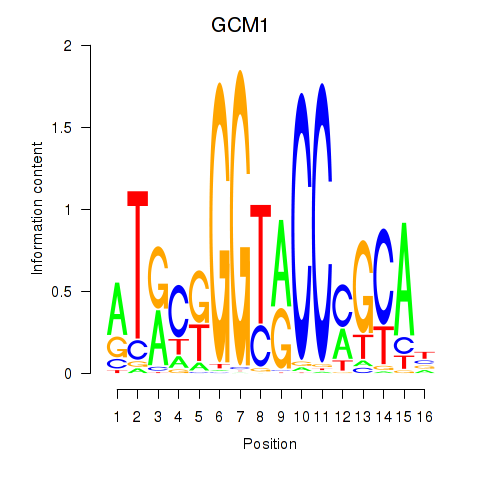
Results for GCM1
Z-value: 0.55
Motif logo
Transcription factors associated with GCM1
| Gene Symbol | Gene ID | Gene Info |
|---|---|---|
|
GCM1
|
ENSG00000137270.10 | glial cells missing transcription factor 1 |
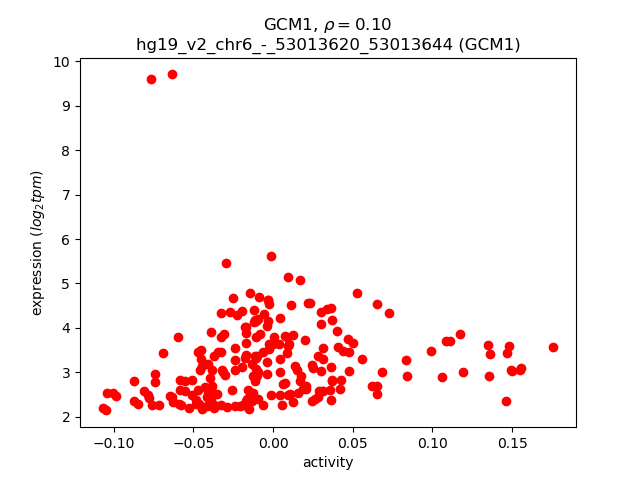
Activity-expression correlation:
| Gene | Promoter | Pearson corr. coef. | P-value | Plot |
|---|---|---|---|---|
| GCM1 | hg19_v2_chr6_-_53013620_53013644 | 0.10 | 1.4e-01 | Click! |
Activity profile of GCM1 motif
Sorted Z-values of GCM1 motif
| Promoter | Log-likelihood | Transcript | Gene | Gene Info |
|---|---|---|---|---|
| chr2_+_90108504 | 32.22 |
ENST00000390271.2
|
IGKV6D-41
|
immunoglobulin kappa variable 6D-41 (non-functional) |
| chr2_-_89459813 | 27.17 |
ENST00000390256.2
|
IGKV6-21
|
immunoglobulin kappa variable 6-21 (non-functional) |
| chr2_+_90060377 | 26.35 |
ENST00000436451.2
|
IGKV6D-21
|
immunoglobulin kappa variable 6D-21 (non-functional) |
| chr3_+_10206545 | 26.14 |
ENST00000256458.4
|
IRAK2
|
interleukin-1 receptor-associated kinase 2 |
| chr22_+_23165153 | 24.57 |
ENST00000390317.2
|
IGLV2-8
|
immunoglobulin lambda variable 2-8 |
| chr22_+_22930626 | 24.03 |
ENST00000390302.2
|
IGLV2-33
|
immunoglobulin lambda variable 2-33 (non-functional) |
| chr22_+_23077065 | 23.10 |
ENST00000390310.2
|
IGLV2-18
|
immunoglobulin lambda variable 2-18 |
| chr22_+_22786288 | 22.10 |
ENST00000390301.2
|
IGLV1-36
|
immunoglobulin lambda variable 1-36 |
| chr2_-_89385283 | 21.00 |
ENST00000390252.2
|
IGKV3-15
|
immunoglobulin kappa variable 3-15 |
| chr22_+_23040274 | 19.93 |
ENST00000390306.2
|
IGLV2-23
|
immunoglobulin lambda variable 2-23 |
| chr22_+_23101182 | 19.81 |
ENST00000390312.2
|
IGLV2-14
|
immunoglobulin lambda variable 2-14 |
| chr2_-_89630186 | 19.06 |
ENST00000390264.2
|
IGKV2-40
|
immunoglobulin kappa variable 2-40 |
| chr22_+_22712087 | 18.85 |
ENST00000390294.2
|
IGLV1-47
|
immunoglobulin lambda variable 1-47 |
| chr2_-_136875712 | 17.49 |
ENST00000241393.3
|
CXCR4
|
chemokine (C-X-C motif) receptor 4 |
| chr22_+_22936998 | 12.28 |
ENST00000390303.2
|
IGLV3-32
|
immunoglobulin lambda variable 3-32 (non-functional) |
| chr8_+_141521386 | 12.12 |
ENST00000220913.5
ENST00000519533.1 |
CHRAC1
|
chromatin accessibility complex 1 |
| chr22_+_22676808 | 10.65 |
ENST00000390290.2
|
IGLV1-51
|
immunoglobulin lambda variable 1-51 |
| chr3_-_46506563 | 9.98 |
ENST00000231751.4
|
LTF
|
lactotransferrin |
| chr22_+_23154239 | 9.97 |
ENST00000390315.2
|
IGLV3-10
|
immunoglobulin lambda variable 3-10 |
| chr22_+_22764088 | 9.94 |
ENST00000390299.2
|
IGLV1-40
|
immunoglobulin lambda variable 1-40 |
| chr17_-_15903002 | 9.70 |
ENST00000399277.1
|
ZSWIM7
|
zinc finger, SWIM-type containing 7 |
| chr3_-_46506358 | 9.25 |
ENST00000417439.1
ENST00000431944.1 |
LTF
|
lactotransferrin |
| chr20_+_30639991 | 8.91 |
ENST00000534862.1
ENST00000538448.1 ENST00000375862.2 |
HCK
|
hemopoietic cell kinase |
| chr17_-_3599327 | 8.34 |
ENST00000551178.1
ENST00000552276.1 ENST00000547178.1 |
P2RX5
|
purinergic receptor P2X, ligand-gated ion channel, 5 |
| chr17_-_3599492 | 8.22 |
ENST00000435558.1
ENST00000345901.3 |
P2RX5
|
purinergic receptor P2X, ligand-gated ion channel, 5 |
| chr16_+_3115611 | 7.96 |
ENST00000530890.1
ENST00000444393.3 ENST00000533097.2 ENST00000008180.9 ENST00000396890.2 ENST00000525228.1 ENST00000548652.1 ENST00000525377.2 ENST00000530538.2 ENST00000549213.1 ENST00000552936.1 ENST00000548476.1 ENST00000552664.1 ENST00000552356.1 ENST00000551513.1 ENST00000382213.3 ENST00000548246.1 |
IL32
|
interleukin 32 |
| chr14_-_23285069 | 7.15 |
ENST00000554758.1
ENST00000397528.4 |
SLC7A7
|
solute carrier family 7 (amino acid transporter light chain, y+L system), member 7 |
| chr19_+_12902289 | 7.11 |
ENST00000302754.4
|
JUNB
|
jun B proto-oncogene |
| chr16_+_3115378 | 7.06 |
ENST00000529550.1
ENST00000551122.1 ENST00000525643.2 ENST00000548807.1 ENST00000528163.2 |
IL32
|
interleukin 32 |
| chr17_-_42580738 | 6.94 |
ENST00000585614.1
ENST00000591680.1 ENST00000434000.1 ENST00000588554.1 ENST00000592154.1 |
GPATCH8
|
G patch domain containing 8 |
| chr11_-_64511575 | 6.84 |
ENST00000431822.1
ENST00000377486.3 ENST00000394432.3 |
RASGRP2
|
RAS guanyl releasing protein 2 (calcium and DAG-regulated) |
| chr9_-_116102562 | 6.82 |
ENST00000374193.4
ENST00000465979.1 |
WDR31
|
WD repeat domain 31 |
| chr1_+_161185032 | 6.79 |
ENST00000367992.3
ENST00000289902.1 |
FCER1G
|
Fc fragment of IgE, high affinity I, receptor for; gamma polypeptide |
| chr16_+_19729586 | 6.52 |
ENST00000564186.1
ENST00000541926.1 ENST00000433597.2 |
IQCK
|
IQ motif containing K |
| chr9_-_116102530 | 6.50 |
ENST00000374195.3
ENST00000341761.4 |
WDR31
|
WD repeat domain 31 |
| chr15_-_60884706 | 6.44 |
ENST00000449337.2
|
RORA
|
RAR-related orphan receptor A |
| chr16_+_2034183 | 6.42 |
ENST00000569451.1
ENST00000248114.6 ENST00000561710.1 |
GFER
|
growth factor, augmenter of liver regeneration |
| chr14_+_39736582 | 6.12 |
ENST00000556148.1
ENST00000348007.3 |
CTAGE5
|
CTAGE family, member 5 |
| chr6_+_42018251 | 6.07 |
ENST00000372978.3
ENST00000494547.1 ENST00000456846.2 ENST00000372982.4 ENST00000472818.1 ENST00000372977.3 |
TAF8
|
TAF8 RNA polymerase II, TATA box binding protein (TBP)-associated factor, 43kDa |
| chr9_-_35650900 | 5.71 |
ENST00000259608.3
|
SIT1
|
signaling threshold regulating transmembrane adaptor 1 |
| chr16_+_53468332 | 5.50 |
ENST00000262133.6
|
RBL2
|
retinoblastoma-like 2 (p130) |
| chr10_+_104678102 | 5.13 |
ENST00000433628.2
|
CNNM2
|
cyclin M2 |
| chr2_-_24583168 | 5.06 |
ENST00000361999.3
|
ITSN2
|
intersectin 2 |
| chr19_+_54705025 | 5.05 |
ENST00000441429.1
|
RPS9
|
ribosomal protein S9 |
| chr12_-_6665200 | 5.00 |
ENST00000336604.4
ENST00000396840.2 ENST00000356896.4 |
IFFO1
|
intermediate filament family orphan 1 |
| chr5_-_79287060 | 4.95 |
ENST00000512560.1
ENST00000509852.1 ENST00000512528.1 |
MTX3
|
metaxin 3 |
| chr4_+_76649797 | 4.94 |
ENST00000538159.1
ENST00000514213.2 |
USO1
|
USO1 vesicle transport factor |
| chr11_-_64511789 | 4.84 |
ENST00000419843.1
ENST00000394430.1 |
RASGRP2
|
RAS guanyl releasing protein 2 (calcium and DAG-regulated) |
| chr10_+_104678032 | 4.68 |
ENST00000369878.4
ENST00000369875.3 |
CNNM2
|
cyclin M2 |
| chr16_+_67063262 | 4.56 |
ENST00000565389.1
|
CBFB
|
core-binding factor, beta subunit |
| chr3_+_38080691 | 4.49 |
ENST00000308059.6
ENST00000346219.3 ENST00000452631.2 |
DLEC1
|
deleted in lung and esophageal cancer 1 |
| chr19_+_11658655 | 4.47 |
ENST00000588935.1
|
CNN1
|
calponin 1, basic, smooth muscle |
| chr20_+_34043085 | 4.46 |
ENST00000397527.1
ENST00000342580.4 |
CEP250
|
centrosomal protein 250kDa |
| chr4_-_57547870 | 4.42 |
ENST00000381260.3
ENST00000420433.1 ENST00000554144.1 ENST00000557328.1 |
HOPX
|
HOP homeobox |
| chr12_+_69864129 | 4.41 |
ENST00000547219.1
ENST00000299293.2 ENST00000549921.1 ENST00000550316.1 ENST00000548154.1 ENST00000547414.1 ENST00000550389.1 ENST00000550937.1 ENST00000549092.1 ENST00000550169.1 |
FRS2
|
fibroblast growth factor receptor substrate 2 |
| chr5_-_169725231 | 4.29 |
ENST00000046794.5
|
LCP2
|
lymphocyte cytosolic protein 2 (SH2 domain containing leukocyte protein of 76kDa) |
| chr19_+_54704718 | 4.28 |
ENST00000391752.1
ENST00000402367.1 ENST00000391751.3 |
RPS9
|
ribosomal protein S9 |
| chr7_-_152373216 | 4.19 |
ENST00000359321.1
|
XRCC2
|
X-ray repair complementing defective repair in Chinese hamster cells 2 |
| chr2_+_111878483 | 4.14 |
ENST00000308659.8
ENST00000357757.2 ENST00000393253.2 ENST00000337565.5 ENST00000393256.3 |
BCL2L11
|
BCL2-like 11 (apoptosis facilitator) |
| chr19_+_54704990 | 4.14 |
ENST00000391753.2
|
RPS9
|
ribosomal protein S9 |
| chr9_+_4985016 | 4.07 |
ENST00000539801.1
|
JAK2
|
Janus kinase 2 |
| chr11_+_17756279 | 3.71 |
ENST00000265969.6
|
KCNC1
|
potassium voltage-gated channel, Shaw-related subfamily, member 1 |
| chr2_+_946543 | 3.56 |
ENST00000308624.5
ENST00000407292.1 |
SNTG2
|
syntrophin, gamma 2 |
| chr16_-_21170762 | 3.48 |
ENST00000261383.3
ENST00000415178.1 |
DNAH3
|
dynein, axonemal, heavy chain 3 |
| chr2_+_234959376 | 3.46 |
ENST00000425558.1
|
SPP2
|
secreted phosphoprotein 2, 24kDa |
| chr12_+_11802753 | 3.45 |
ENST00000396373.4
|
ETV6
|
ets variant 6 |
| chr19_+_48867652 | 3.40 |
ENST00000344846.2
|
SYNGR4
|
synaptogyrin 4 |
| chr7_-_143966381 | 3.27 |
ENST00000487179.1
|
CTAGE8
|
CTAGE family, member 8 |
| chr9_-_99540328 | 3.26 |
ENST00000223428.4
ENST00000375231.1 ENST00000374641.3 |
ZNF510
|
zinc finger protein 510 |
| chr10_+_131265443 | 3.24 |
ENST00000306010.7
|
MGMT
|
O-6-methylguanine-DNA methyltransferase |
| chr21_-_45660723 | 3.24 |
ENST00000344330.4
ENST00000407780.3 ENST00000400379.3 |
ICOSLG
|
inducible T-cell co-stimulator ligand |
| chr1_-_40237020 | 3.23 |
ENST00000327582.5
|
OXCT2
|
3-oxoacid CoA transferase 2 |
| chr15_+_83776324 | 3.17 |
ENST00000379390.6
ENST00000379386.4 ENST00000565774.1 ENST00000565982.1 |
TM6SF1
|
transmembrane 6 superfamily member 1 |
| chr10_-_105677427 | 3.15 |
ENST00000369764.1
|
OBFC1
|
oligonucleotide/oligosaccharide-binding fold containing 1 |
| chr9_-_99381660 | 3.14 |
ENST00000375240.3
ENST00000463569.1 |
CDC14B
|
cell division cycle 14B |
| chr11_-_8190534 | 3.11 |
ENST00000309737.6
ENST00000425599.2 ENST00000539720.1 ENST00000531450.1 ENST00000419822.2 ENST00000335425.7 ENST00000343202.4 |
RIC3
|
RIC3 acetylcholine receptor chaperone |
| chr4_-_57547454 | 3.09 |
ENST00000556376.2
|
HOPX
|
HOP homeobox |
| chr1_+_27719148 | 3.07 |
ENST00000374024.3
|
GPR3
|
G protein-coupled receptor 3 |
| chr10_-_105677886 | 3.04 |
ENST00000224950.3
|
OBFC1
|
oligonucleotide/oligosaccharide-binding fold containing 1 |
| chr5_+_178322893 | 3.03 |
ENST00000361362.2
ENST00000520660.1 ENST00000520805.1 |
ZFP2
|
ZFP2 zinc finger protein |
| chr20_+_36946029 | 2.97 |
ENST00000417318.1
|
BPI
|
bactericidal/permeability-increasing protein |
| chr8_+_142138799 | 2.96 |
ENST00000518668.1
|
DENND3
|
DENN/MADD domain containing 3 |
| chr4_-_5894777 | 2.94 |
ENST00000324989.7
|
CRMP1
|
collapsin response mediator protein 1 |
| chr1_-_11907829 | 2.83 |
ENST00000376480.3
|
NPPA
|
natriuretic peptide A |
| chr21_+_35747773 | 2.82 |
ENST00000399292.3
ENST00000399299.1 ENST00000399295.2 |
SMIM11
|
small integral membrane protein 11 |
| chr19_-_12886327 | 2.79 |
ENST00000397668.3
ENST00000587178.1 ENST00000264827.5 |
HOOK2
|
hook microtubule-tethering protein 2 |
| chr7_-_50132860 | 2.79 |
ENST00000046087.2
|
ZPBP
|
zona pellucida binding protein |
| chr19_-_38806560 | 2.72 |
ENST00000591755.1
ENST00000337679.8 ENST00000339413.6 |
YIF1B
|
Yip1 interacting factor homolog B (S. cerevisiae) |
| chr7_-_50132801 | 2.71 |
ENST00000419417.1
|
ZPBP
|
zona pellucida binding protein |
| chr4_-_119274121 | 2.68 |
ENST00000296498.3
|
PRSS12
|
protease, serine, 12 (neurotrypsin, motopsin) |
| chr7_-_100253993 | 2.67 |
ENST00000461605.1
ENST00000160382.5 |
ACTL6B
|
actin-like 6B |
| chr12_-_4554780 | 2.64 |
ENST00000228837.2
|
FGF6
|
fibroblast growth factor 6 |
| chr19_-_1021113 | 2.63 |
ENST00000333175.5
ENST00000356663.3 |
TMEM259
|
transmembrane protein 259 |
| chr9_+_102668915 | 2.60 |
ENST00000259400.6
ENST00000531035.1 ENST00000525640.1 ENST00000534052.1 ENST00000526607.1 |
STX17
|
syntaxin 17 |
| chr6_+_42928485 | 2.58 |
ENST00000372808.3
|
GNMT
|
glycine N-methyltransferase |
| chr7_+_143880559 | 2.57 |
ENST00000486333.1
|
CTAGE4
|
CTAGE family, member 4 |
| chr1_+_158975744 | 2.56 |
ENST00000426592.2
|
IFI16
|
interferon, gamma-inducible protein 16 |
| chr1_+_67773044 | 2.53 |
ENST00000262345.1
ENST00000371000.1 |
IL12RB2
|
interleukin 12 receptor, beta 2 |
| chr2_+_88469835 | 2.52 |
ENST00000358591.2
ENST00000377254.3 ENST00000402102.1 ENST00000419759.1 ENST00000449349.1 ENST00000343544.4 |
THNSL2
|
threonine synthase-like 2 (S. cerevisiae) |
| chr10_-_134756030 | 2.49 |
ENST00000368586.5
ENST00000368582.2 |
TTC40
|
tetratricopeptide repeat domain 40 |
| chr6_-_30043539 | 2.47 |
ENST00000376751.3
ENST00000244360.6 |
RNF39
|
ring finger protein 39 |
| chr10_-_51371321 | 2.40 |
ENST00000602930.1
|
AGAP8
|
ArfGAP with GTPase domain, ankyrin repeat and PH domain 8 |
| chr1_+_45805342 | 2.39 |
ENST00000372090.5
|
TOE1
|
target of EGR1, member 1 (nuclear) |
| chr10_+_73975742 | 2.38 |
ENST00000299381.4
|
ANAPC16
|
anaphase promoting complex subunit 16 |
| chr16_-_90096309 | 2.34 |
ENST00000408886.2
|
C16orf3
|
chromosome 16 open reading frame 3 |
| chr7_-_44180673 | 2.32 |
ENST00000457314.1
ENST00000447951.1 ENST00000431007.1 |
MYL7
|
myosin, light chain 7, regulatory |
| chr14_+_39736299 | 2.30 |
ENST00000341502.5
ENST00000396158.2 ENST00000280083.3 |
CTAGE5
|
CTAGE family, member 5 |
| chr7_-_4901625 | 2.28 |
ENST00000404991.1
|
PAPOLB
|
poly(A) polymerase beta (testis specific) |
| chr20_-_3996036 | 2.26 |
ENST00000336095.6
|
RNF24
|
ring finger protein 24 |
| chr11_-_18656028 | 2.25 |
ENST00000336349.5
|
SPTY2D1
|
SPT2, Suppressor of Ty, domain containing 1 (S. cerevisiae) |
| chr19_+_50321528 | 2.21 |
ENST00000312865.6
ENST00000595185.1 ENST00000538643.1 |
MED25
|
mediator complex subunit 25 |
| chr7_-_44179972 | 2.21 |
ENST00000446581.1
|
MYL7
|
myosin, light chain 7, regulatory |
| chr9_-_111619239 | 2.19 |
ENST00000374667.3
|
ACTL7B
|
actin-like 7B |
| chr17_+_40913264 | 2.16 |
ENST00000587142.1
ENST00000588576.1 |
RAMP2
|
receptor (G protein-coupled) activity modifying protein 2 |
| chr1_-_228613026 | 2.13 |
ENST00000366696.1
|
HIST3H3
|
histone cluster 3, H3 |
| chr11_-_47470591 | 2.08 |
ENST00000524487.1
|
RAPSN
|
receptor-associated protein of the synapse |
| chr19_+_50936142 | 2.06 |
ENST00000357701.5
|
MYBPC2
|
myosin binding protein C, fast type |
| chr16_-_57513657 | 2.04 |
ENST00000566936.1
ENST00000568617.1 ENST00000567276.1 ENST00000569548.1 ENST00000569250.1 ENST00000564378.1 |
DOK4
|
docking protein 4 |
| chr16_+_2285817 | 2.01 |
ENST00000564065.1
|
DNASE1L2
|
deoxyribonuclease I-like 2 |
| chr6_+_110012462 | 1.96 |
ENST00000441478.2
ENST00000230124.3 |
FIG4
|
FIG4 homolog, SAC1 lipid phosphatase domain containing (S. cerevisiae) |
| chr2_+_26915584 | 1.95 |
ENST00000302909.3
|
KCNK3
|
potassium channel, subfamily K, member 3 |
| chr17_+_40913210 | 1.94 |
ENST00000253796.5
|
RAMP2
|
receptor (G protein-coupled) activity modifying protein 2 |
| chr1_+_24069952 | 1.93 |
ENST00000609199.1
|
TCEB3
|
transcription elongation factor B (SIII), polypeptide 3 (110kDa, elongin A) |
| chr12_+_52345448 | 1.92 |
ENST00000257963.4
ENST00000541224.1 ENST00000426655.2 ENST00000536420.1 ENST00000415850.2 |
ACVR1B
|
activin A receptor, type IB |
| chr2_+_234959323 | 1.90 |
ENST00000373368.1
ENST00000168148.3 |
SPP2
|
secreted phosphoprotein 2, 24kDa |
| chr17_-_7493390 | 1.90 |
ENST00000538513.2
ENST00000570788.1 ENST00000250055.2 |
SOX15
|
SRY (sex determining region Y)-box 15 |
| chr5_-_218251 | 1.88 |
ENST00000296824.3
|
CCDC127
|
coiled-coil domain containing 127 |
| chr4_+_56212270 | 1.85 |
ENST00000264228.4
|
SRD5A3
|
steroid 5 alpha-reductase 3 |
| chr22_+_19705928 | 1.84 |
ENST00000383045.3
ENST00000438754.2 |
SEPT5
|
septin 5 |
| chr11_+_20385666 | 1.81 |
ENST00000532081.1
ENST00000531058.1 |
HTATIP2
|
HIV-1 Tat interactive protein 2, 30kDa |
| chr1_-_148347506 | 1.80 |
ENST00000369189.3
|
NBPF20
|
neuroblastoma breakpoint family, member 20 |
| chr15_-_71407833 | 1.75 |
ENST00000449977.2
|
CT62
|
cancer/testis antigen 62 |
| chr5_-_133702761 | 1.72 |
ENST00000521118.1
ENST00000265334.4 ENST00000435211.1 |
CDKL3
|
cyclin-dependent kinase-like 3 |
| chr19_-_6379069 | 1.64 |
ENST00000597721.1
|
PSPN
|
persephin |
| chr12_-_71533055 | 1.64 |
ENST00000552128.1
|
TSPAN8
|
tetraspanin 8 |
| chr1_+_17634689 | 1.63 |
ENST00000375453.1
ENST00000375448.4 |
PADI4
|
peptidyl arginine deiminase, type IV |
| chr9_-_136004782 | 1.63 |
ENST00000393157.3
|
RALGDS
|
ral guanine nucleotide dissociation stimulator |
| chr11_-_75201791 | 1.62 |
ENST00000529721.1
|
GDPD5
|
glycerophosphodiester phosphodiesterase domain containing 5 |
| chr9_+_117373486 | 1.60 |
ENST00000288502.4
ENST00000374049.4 |
C9orf91
|
chromosome 9 open reading frame 91 |
| chr11_-_47470703 | 1.58 |
ENST00000298854.2
|
RAPSN
|
receptor-associated protein of the synapse |
| chr17_-_40913275 | 1.58 |
ENST00000589716.1
ENST00000360166.3 |
RAMP2-AS1
|
RAMP2 antisense RNA 1 |
| chr1_+_1215816 | 1.53 |
ENST00000379116.5
|
SCNN1D
|
sodium channel, non-voltage-gated 1, delta subunit |
| chr15_+_45422178 | 1.53 |
ENST00000389037.3
ENST00000558322.1 |
DUOX1
|
dual oxidase 1 |
| chr6_-_74363803 | 1.52 |
ENST00000355773.5
|
SLC17A5
|
solute carrier family 17 (acidic sugar transporter), member 5 |
| chr19_+_49977818 | 1.51 |
ENST00000594009.1
ENST00000595510.1 |
FLT3LG
|
fms-related tyrosine kinase 3 ligand |
| chr15_+_45422131 | 1.50 |
ENST00000321429.4
|
DUOX1
|
dual oxidase 1 |
| chr1_-_2145620 | 1.50 |
ENST00000545087.1
|
AL590822.1
|
Uncharacterized protein |
| chr7_-_26904317 | 1.49 |
ENST00000345317.2
|
SKAP2
|
src kinase associated phosphoprotein 2 |
| chr16_+_67062996 | 1.44 |
ENST00000561924.2
|
CBFB
|
core-binding factor, beta subunit |
| chr11_-_47470682 | 1.40 |
ENST00000529341.1
ENST00000352508.3 |
RAPSN
|
receptor-associated protein of the synapse |
| chr1_-_8483723 | 1.39 |
ENST00000476556.1
|
RERE
|
arginine-glutamic acid dipeptide (RE) repeats |
| chr9_-_104145795 | 1.38 |
ENST00000259407.2
|
BAAT
|
bile acid CoA: amino acid N-acyltransferase (glycine N-choloyltransferase) |
| chr15_-_78933567 | 1.35 |
ENST00000261751.3
ENST00000412074.2 |
CHRNB4
|
cholinergic receptor, nicotinic, beta 4 (neuronal) |
| chr11_-_62783303 | 1.34 |
ENST00000336232.2
ENST00000430500.2 |
SLC22A8
|
solute carrier family 22 (organic anion transporter), member 8 |
| chr19_+_641178 | 1.34 |
ENST00000166133.3
|
FGF22
|
fibroblast growth factor 22 |
| chrX_-_63615297 | 1.30 |
ENST00000374852.3
ENST00000453546.1 |
MTMR8
|
myotubularin related protein 8 |
| chr6_-_132032206 | 1.23 |
ENST00000314099.8
|
CTAGE9
|
CTAGE family, member 9 |
| chr9_+_100263912 | 1.20 |
ENST00000259365.4
|
TMOD1
|
tropomodulin 1 |
| chr16_+_8715536 | 1.16 |
ENST00000563958.1
ENST00000381920.3 ENST00000564554.1 |
METTL22
|
methyltransferase like 22 |
| chr7_-_31380502 | 1.14 |
ENST00000297142.3
|
NEUROD6
|
neuronal differentiation 6 |
| chr19_-_52227221 | 1.07 |
ENST00000222115.1
ENST00000540069.2 |
HAS1
|
hyaluronan synthase 1 |
| chr3_+_192958914 | 1.04 |
ENST00000264735.2
ENST00000602513.1 |
HRASLS
|
HRAS-like suppressor |
| chr17_+_41006095 | 1.03 |
ENST00000591562.1
ENST00000588033.1 |
AOC3
|
amine oxidase, copper containing 3 |
| chr11_-_62783276 | 1.02 |
ENST00000535878.1
ENST00000545207.1 |
SLC22A8
|
solute carrier family 22 (organic anion transporter), member 8 |
| chr5_+_69321074 | 1.01 |
ENST00000380751.5
ENST00000380750.3 ENST00000503931.1 ENST00000506542.1 |
SERF1B
|
small EDRK-rich factor 1B (centromeric) |
| chr14_+_50779071 | 0.98 |
ENST00000426751.2
|
ATP5S
|
ATP synthase, H+ transporting, mitochondrial Fo complex, subunit s (factor B) |
| chr16_+_8715574 | 0.97 |
ENST00000561758.1
|
METTL22
|
methyltransferase like 22 |
| chr17_+_4675175 | 0.92 |
ENST00000270560.3
|
TM4SF5
|
transmembrane 4 L six family member 5 |
| chr4_+_15704679 | 0.92 |
ENST00000382346.3
|
BST1
|
bone marrow stromal cell antigen 1 |
| chr9_+_34958254 | 0.91 |
ENST00000242315.3
|
KIAA1045
|
KIAA1045 |
| chr10_+_96162242 | 0.88 |
ENST00000225235.4
|
TBC1D12
|
TBC1 domain family, member 12 |
| chr15_+_78632666 | 0.86 |
ENST00000299529.6
|
CRABP1
|
cellular retinoic acid binding protein 1 |
| chr11_+_20691195 | 0.85 |
ENST00000532434.1
|
NELL1
|
NEL-like 1 (chicken) |
| chr6_-_97285336 | 0.83 |
ENST00000229955.3
ENST00000417980.1 |
GPR63
|
G protein-coupled receptor 63 |
| chr2_-_113993020 | 0.81 |
ENST00000465084.1
|
PAX8
|
paired box 8 |
| chr19_-_40596828 | 0.80 |
ENST00000414720.2
ENST00000455521.1 ENST00000340963.5 ENST00000595773.1 |
ZNF780A
|
zinc finger protein 780A |
| chr18_+_10526008 | 0.79 |
ENST00000542979.1
ENST00000322897.6 |
NAPG
|
N-ethylmaleimide-sensitive factor attachment protein, gamma |
| chr10_+_120789223 | 0.78 |
ENST00000425699.1
|
NANOS1
|
nanos homolog 1 (Drosophila) |
| chr20_+_2854066 | 0.78 |
ENST00000455631.1
ENST00000216877.6 ENST00000399903.2 ENST00000358719.4 ENST00000431048.1 ENST00000425918.2 ENST00000430705.1 ENST00000318266.5 |
PTPRA
|
protein tyrosine phosphatase, receptor type, A |
| chr16_+_72142195 | 0.76 |
ENST00000563819.1
ENST00000567142.2 |
DHX38
|
DEAH (Asp-Glu-Ala-His) box polypeptide 38 |
| chr1_+_44399466 | 0.74 |
ENST00000498139.2
ENST00000491846.1 |
ARTN
|
artemin |
| chr7_+_148936732 | 0.73 |
ENST00000335870.2
|
ZNF212
|
zinc finger protein 212 |
| chr11_+_124735282 | 0.73 |
ENST00000397801.1
|
ROBO3
|
roundabout, axon guidance receptor, homolog 3 (Drosophila) |
| chr19_-_18717627 | 0.71 |
ENST00000392386.3
|
CRLF1
|
cytokine receptor-like factor 1 |
| chr14_-_24732368 | 0.59 |
ENST00000544573.1
|
TGM1
|
transglutaminase 1 |
| chr5_+_176784837 | 0.58 |
ENST00000408923.3
|
RGS14
|
regulator of G-protein signaling 14 |
| chr4_+_110749143 | 0.57 |
ENST00000317735.4
|
RRH
|
retinal pigment epithelium-derived rhodopsin homolog |
| chr7_-_152133059 | 0.55 |
ENST00000262189.6
ENST00000355193.2 |
KMT2C
|
lysine (K)-specific methyltransferase 2C |
| chr19_-_40596767 | 0.55 |
ENST00000599972.1
ENST00000450241.2 ENST00000595687.2 |
ZNF780A
|
zinc finger protein 780A |
| chr17_-_7218631 | 0.55 |
ENST00000577040.2
ENST00000389167.5 ENST00000391950.3 |
GPS2
|
G protein pathway suppressor 2 |
| chr20_-_45061695 | 0.52 |
ENST00000445496.2
|
ELMO2
|
engulfment and cell motility 2 |
| chr12_+_106696581 | 0.51 |
ENST00000547153.1
ENST00000299045.3 ENST00000546625.1 ENST00000553098.1 |
TCP11L2
|
t-complex 11, testis-specific-like 2 |
| chr20_-_44991813 | 0.50 |
ENST00000372227.1
|
SLC35C2
|
solute carrier family 35 (GDP-fucose transporter), member C2 |
| chr11_-_100999775 | 0.49 |
ENST00000263463.5
|
PGR
|
progesterone receptor |
| chr16_+_10971037 | 0.36 |
ENST00000324288.8
ENST00000381835.5 |
CIITA
|
class II, major histocompatibility complex, transactivator |
| chr1_-_202897724 | 0.34 |
ENST00000435533.3
ENST00000367258.1 |
KLHL12
|
kelch-like family member 12 |
| chr8_-_6914251 | 0.33 |
ENST00000330590.2
|
DEFA5
|
defensin, alpha 5, Paneth cell-specific |
| chr19_-_41945804 | 0.32 |
ENST00000221943.9
ENST00000597457.1 ENST00000589970.1 ENST00000595425.1 ENST00000438807.3 ENST00000589102.1 ENST00000592922.2 |
ATP5SL
|
ATP5S-like |
| chr14_+_65878565 | 0.31 |
ENST00000556518.1
ENST00000557164.1 |
FUT8
|
fucosyltransferase 8 (alpha (1,6) fucosyltransferase) |
| chr16_+_333152 | 0.30 |
ENST00000219406.6
ENST00000404312.1 ENST00000456379.1 |
PDIA2
|
protein disulfide isomerase family A, member 2 |
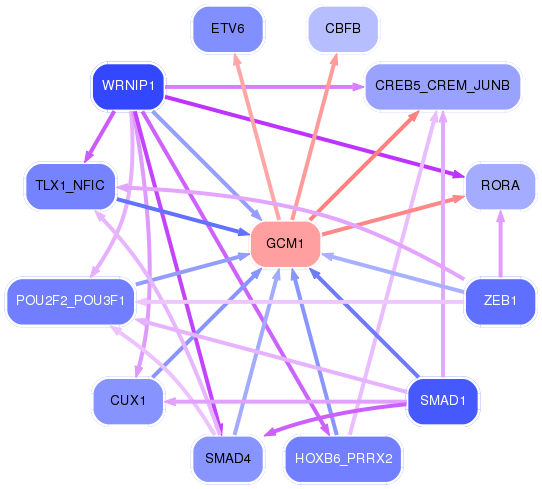
Network of associatons between targets according to the STRING database.

First level regulatory network of GCM1
Gene Ontology Analysis
Gene overrepresentation in biological_process category:
| Log-likelihood per target | Total log-likelihood | Term | Description |
|---|---|---|---|
| 6.4 | 19.2 | GO:0033212 | iron assimilation(GO:0033212) iron assimilation by chelation and transport(GO:0033214) positive regulation of bone mineralization involved in bone maturation(GO:1900159) negative regulation of tumor necrosis factor (ligand) superfamily member 11 production(GO:2000308) |
| 3.0 | 8.9 | GO:0002522 | leukocyte migration involved in immune response(GO:0002522) |
| 2.5 | 17.5 | GO:0039663 | fusion of virus membrane with host plasma membrane(GO:0019064) membrane fusion involved in viral entry into host cell(GO:0039663) multi-organism membrane fusion(GO:0044800) |
| 2.3 | 6.8 | GO:0001812 | positive regulation of type IIa hypersensitivity(GO:0001798) positive regulation of type I hypersensitivity(GO:0001812) positive regulation of type II hypersensitivity(GO:0002894) positive regulation of mast cell cytokine production(GO:0032765) mast cell homeostasis(GO:0033023) mast cell apoptotic process(GO:0033024) regulation of mast cell apoptotic process(GO:0033025) |
| 2.2 | 13.5 | GO:0045903 | positive regulation of translational fidelity(GO:0045903) |
| 1.7 | 5.1 | GO:1900073 | regulation of neuromuscular synaptic transmission(GO:1900073) positive regulation of neuromuscular synaptic transmission(GO:1900075) |
| 1.5 | 4.4 | GO:0046619 | optic placode formation involved in camera-type eye formation(GO:0046619) |
| 1.4 | 4.1 | GO:1902263 | apoptotic process involved in embryonic digit morphogenesis(GO:1902263) |
| 1.4 | 4.1 | GO:0060398 | regulation of growth hormone receptor signaling pathway(GO:0060398) |
| 1.2 | 7.1 | GO:0000821 | regulation of arginine metabolic process(GO:0000821) basic amino acid transmembrane transport(GO:1990822) |
| 1.2 | 26.1 | GO:0034162 | toll-like receptor 9 signaling pathway(GO:0034162) |
| 1.2 | 7.1 | GO:0060136 | embryonic process involved in female pregnancy(GO:0060136) |
| 1.0 | 174.7 | GO:0002377 | immunoglobulin production(GO:0002377) |
| 1.0 | 2.9 | GO:1904617 | negative regulation of actin filament binding(GO:1904530) negative regulation of actin binding(GO:1904617) |
| 0.9 | 6.5 | GO:1903818 | positive regulation of voltage-gated potassium channel activity(GO:1903818) |
| 0.9 | 124.8 | GO:0030449 | regulation of complement activation(GO:0030449) |
| 0.9 | 4.5 | GO:0030997 | regulation of centriole-centriole cohesion(GO:0030997) |
| 0.8 | 8.4 | GO:0070973 | protein localization to endoplasmic reticulum exit site(GO:0070973) |
| 0.8 | 2.5 | GO:0006566 | threonine metabolic process(GO:0006566) |
| 0.8 | 3.0 | GO:0042335 | cuticle development(GO:0042335) |
| 0.7 | 4.9 | GO:0048280 | vesicle fusion with Golgi apparatus(GO:0048280) |
| 0.7 | 4.2 | GO:0000707 | meiotic DNA recombinase assembly(GO:0000707) |
| 0.7 | 9.8 | GO:0010960 | magnesium ion homeostasis(GO:0010960) |
| 0.6 | 1.9 | GO:1901165 | positive regulation of trophoblast cell migration(GO:1901165) |
| 0.6 | 1.9 | GO:0070318 | myoblast development(GO:0048627) positive regulation of G0 to G1 transition(GO:0070318) |
| 0.6 | 1.8 | GO:0016095 | polyprenol catabolic process(GO:0016095) |
| 0.6 | 6.1 | GO:0001833 | inner cell mass cell proliferation(GO:0001833) |
| 0.6 | 3.4 | GO:0007296 | vitellogenesis(GO:0007296) |
| 0.5 | 16.6 | GO:0035590 | purinergic nucleotide receptor signaling pathway(GO:0035590) |
| 0.5 | 2.6 | GO:0016240 | autophagosome docking(GO:0016240) |
| 0.5 | 2.0 | GO:0003335 | corneocyte development(GO:0003335) |
| 0.5 | 1.5 | GO:0090290 | positive regulation of osteoclast proliferation(GO:0090290) |
| 0.5 | 4.1 | GO:0097646 | calcitonin family receptor signaling pathway(GO:0097646) amylin receptor signaling pathway(GO:0097647) |
| 0.4 | 6.4 | GO:0021694 | cerebellar Purkinje cell layer formation(GO:0021694) cerebellar Purkinje cell differentiation(GO:0021702) |
| 0.4 | 7.5 | GO:0001829 | trophectodermal cell differentiation(GO:0001829) |
| 0.3 | 1.4 | GO:0060084 | synaptic transmission involved in micturition(GO:0060084) |
| 0.3 | 1.6 | GO:0036414 | protein citrullination(GO:0018101) histone citrullination(GO:0036414) |
| 0.3 | 3.2 | GO:2000781 | positive regulation of double-strand break repair(GO:2000781) |
| 0.3 | 3.5 | GO:0036159 | inner dynein arm assembly(GO:0036159) |
| 0.3 | 3.0 | GO:0043031 | negative regulation of macrophage activation(GO:0043031) |
| 0.3 | 0.9 | GO:0008300 | isoprenoid catabolic process(GO:0008300) diterpenoid catabolic process(GO:0016103) terpenoid catabolic process(GO:0016115) retinoic acid catabolic process(GO:0034653) |
| 0.3 | 2.3 | GO:0001672 | regulation of chromatin assembly or disassembly(GO:0001672) |
| 0.3 | 2.0 | GO:0031642 | negative regulation of myelination(GO:0031642) |
| 0.3 | 0.8 | GO:0070460 | thyroid-stimulating hormone secretion(GO:0070460) regulation of thyroid-stimulating hormone secretion(GO:2000612) |
| 0.2 | 4.5 | GO:1904706 | negative regulation of vascular smooth muscle cell proliferation(GO:1904706) |
| 0.2 | 3.2 | GO:0051256 | mitotic spindle midzone assembly(GO:0051256) |
| 0.2 | 1.8 | GO:0016080 | synaptic vesicle targeting(GO:0016080) |
| 0.2 | 1.2 | GO:0051694 | pointed-end actin filament capping(GO:0051694) |
| 0.2 | 0.6 | GO:0043163 | cell envelope organization(GO:0043163) external encapsulating structure organization(GO:0045229) |
| 0.2 | 5.1 | GO:1903861 | positive regulation of dendrite extension(GO:1903861) |
| 0.2 | 0.7 | GO:2000672 | negative regulation of motor neuron apoptotic process(GO:2000672) |
| 0.2 | 1.4 | GO:0019530 | taurine metabolic process(GO:0019530) |
| 0.2 | 1.6 | GO:0048505 | regulation of development, heterochronic(GO:0040034) regulation of timing of cell differentiation(GO:0048505) |
| 0.1 | 0.7 | GO:0048537 | mucosal-associated lymphoid tissue development(GO:0048537) Peyer's patch development(GO:0048541) Peyer's patch morphogenesis(GO:0061146) lymphocyte migration into lymphoid organs(GO:0097021) |
| 0.1 | 2.1 | GO:0071688 | striated muscle myosin thick filament assembly(GO:0071688) |
| 0.1 | 5.7 | GO:0043029 | T cell homeostasis(GO:0043029) |
| 0.1 | 5.5 | GO:0007339 | binding of sperm to zona pellucida(GO:0007339) |
| 0.1 | 2.6 | GO:1904294 | positive regulation of ERAD pathway(GO:1904294) |
| 0.1 | 0.5 | GO:0060748 | tertiary branching involved in mammary gland duct morphogenesis(GO:0060748) |
| 0.1 | 5.7 | GO:0008333 | endosome to lysosome transport(GO:0008333) |
| 0.1 | 3.2 | GO:0006972 | hyperosmotic response(GO:0006972) |
| 0.1 | 1.4 | GO:0021942 | radial glia guided migration of Purkinje cell(GO:0021942) |
| 0.1 | 2.6 | GO:0001502 | cartilage condensation(GO:0001502) |
| 0.1 | 0.7 | GO:0016199 | axon midline choice point recognition(GO:0016199) |
| 0.1 | 2.6 | GO:0046500 | S-adenosylmethionine metabolic process(GO:0046500) |
| 0.1 | 2.2 | GO:0048147 | negative regulation of fibroblast proliferation(GO:0048147) |
| 0.1 | 2.0 | GO:0051481 | negative regulation of cytosolic calcium ion concentration(GO:0051481) |
| 0.1 | 0.6 | GO:0031914 | negative regulation of synaptic plasticity(GO:0031914) |
| 0.1 | 3.1 | GO:0040020 | regulation of meiotic nuclear division(GO:0040020) |
| 0.1 | 1.1 | GO:0010764 | negative regulation of fibroblast migration(GO:0010764) |
| 0.1 | 0.4 | GO:0045348 | positive regulation of MHC class II biosynthetic process(GO:0045348) |
| 0.1 | 2.1 | GO:0051290 | protein heterotetramerization(GO:0051290) |
| 0.1 | 5.5 | GO:0043550 | regulation of lipid kinase activity(GO:0043550) |
| 0.1 | 0.1 | GO:0002837 | regulation of response to tumor cell(GO:0002834) positive regulation of response to tumor cell(GO:0002836) regulation of immune response to tumor cell(GO:0002837) positive regulation of immune response to tumor cell(GO:0002839) negative regulation of endothelial cell chemotaxis(GO:2001027) |
| 0.1 | 2.5 | GO:0032729 | positive regulation of interferon-gamma production(GO:0032729) |
| 0.1 | 3.1 | GO:0007271 | synaptic transmission, cholinergic(GO:0007271) |
| 0.1 | 0.8 | GO:0033689 | negative regulation of osteoblast proliferation(GO:0033689) |
| 0.1 | 0.9 | GO:0030890 | positive regulation of B cell proliferation(GO:0030890) |
| 0.1 | 2.6 | GO:0042149 | cellular response to glucose starvation(GO:0042149) |
| 0.1 | 0.3 | GO:1903116 | positive regulation of actin filament-based movement(GO:1903116) positive regulation of cardiac conduction(GO:1903781) positive regulation of atrial cardiac muscle cell action potential(GO:1903949) positive regulation of regulation of vascular smooth muscle cell membrane depolarization(GO:1904199) regulation of vascular smooth muscle cell membrane depolarization(GO:1990736) |
| 0.1 | 5.4 | GO:0046849 | bone remodeling(GO:0046849) |
| 0.1 | 5.2 | GO:0071277 | cellular response to calcium ion(GO:0071277) |
| 0.1 | 2.4 | GO:0043252 | sodium-independent organic anion transport(GO:0043252) |
| 0.1 | 0.5 | GO:0036066 | protein O-linked fucosylation(GO:0036066) |
| 0.1 | 4.8 | GO:0000724 | double-strand break repair via homologous recombination(GO:0000724) recombinational repair(GO:0000725) |
| 0.1 | 1.1 | GO:0021542 | dentate gyrus development(GO:0021542) |
| 0.0 | 2.3 | GO:0043631 | mRNA polyadenylation(GO:0006378) RNA polyadenylation(GO:0043631) |
| 0.0 | 1.7 | GO:0030517 | negative regulation of axon extension(GO:0030517) |
| 0.0 | 0.1 | GO:0033591 | response to L-ascorbic acid(GO:0033591) |
| 0.0 | 9.0 | GO:0071897 | DNA biosynthetic process(GO:0071897) |
| 0.0 | 15.7 | GO:0002250 | adaptive immune response(GO:0002250) |
| 0.0 | 6.4 | GO:0001889 | liver development(GO:0001889) |
| 0.0 | 0.8 | GO:1900153 | regulation of nuclear-transcribed mRNA catabolic process, deadenylation-dependent decay(GO:1900151) positive regulation of nuclear-transcribed mRNA catabolic process, deadenylation-dependent decay(GO:1900153) |
| 0.0 | 0.6 | GO:0018298 | protein-chromophore linkage(GO:0018298) |
| 0.0 | 1.2 | GO:0042776 | mitochondrial ATP synthesis coupled proton transport(GO:0042776) |
| 0.0 | 1.0 | GO:0051354 | negative regulation of oxidoreductase activity(GO:0051354) |
| 0.0 | 1.6 | GO:0030195 | negative regulation of blood coagulation(GO:0030195) negative regulation of hemostasis(GO:1900047) |
| 0.0 | 2.7 | GO:0021510 | spinal cord development(GO:0021510) |
| 0.0 | 4.3 | GO:0050663 | cytokine secretion(GO:0050663) |
| 0.0 | 0.9 | GO:2000785 | regulation of autophagosome assembly(GO:2000785) |
| 0.0 | 2.7 | GO:0018022 | peptidyl-lysine methylation(GO:0018022) |
| 0.0 | 1.2 | GO:0050909 | sensory perception of taste(GO:0050909) |
| 0.0 | 0.2 | GO:0060346 | sequestering of TGFbeta in extracellular matrix(GO:0035583) bone trabecula formation(GO:0060346) |
| 0.0 | 0.3 | GO:0014029 | neural crest formation(GO:0014029) |
| 0.0 | 0.3 | GO:0034975 | protein folding in endoplasmic reticulum(GO:0034975) |
| 0.0 | 2.1 | GO:0035335 | peptidyl-tyrosine dephosphorylation(GO:0035335) |
| 0.0 | 1.5 | GO:0042113 | B cell activation(GO:0042113) |
| 0.0 | 0.1 | GO:0070777 | D-aspartate transport(GO:0070777) D-aspartate import(GO:0070779) |
| 0.0 | 0.1 | GO:0006021 | inositol biosynthetic process(GO:0006021) |
| 0.0 | 0.1 | GO:0070294 | renal sodium ion absorption(GO:0070294) |
| 0.0 | 1.4 | GO:0046854 | phosphatidylinositol phosphorylation(GO:0046854) |
| 0.0 | 0.1 | GO:0002922 | positive regulation of antimicrobial peptide production(GO:0002225) positive regulation of antimicrobial humoral response(GO:0002760) positive regulation of antibacterial peptide production(GO:0002803) positive regulation of humoral immune response(GO:0002922) |
| 0.0 | 0.9 | GO:0006891 | intra-Golgi vesicle-mediated transport(GO:0006891) |
| 0.0 | 0.9 | GO:1901264 | carbohydrate derivative transport(GO:1901264) |
| 0.0 | 0.8 | GO:0031124 | mRNA 3'-end processing(GO:0031124) |
| 0.0 | 0.3 | GO:0050832 | defense response to fungus(GO:0050832) |
| 0.0 | 0.2 | GO:0006298 | mismatch repair(GO:0006298) |
Gene overrepresentation in cellular_component category:
| Log-likelihood per target | Total log-likelihood | Term | Description |
|---|---|---|---|
| 2.7 | 19.2 | GO:0097013 | phagocytic vesicle lumen(GO:0097013) |
| 2.4 | 12.1 | GO:0008622 | epsilon DNA polymerase complex(GO:0008622) |
| 0.9 | 7.1 | GO:0035976 | AP1 complex(GO:0035976) |
| 0.9 | 4.3 | GO:0036398 | TCR signalosome(GO:0036398) |
| 0.8 | 16.6 | GO:0044453 | integral component of nuclear inner membrane(GO:0005639) intrinsic component of nuclear inner membrane(GO:0031229) nuclear membrane part(GO:0044453) |
| 0.7 | 4.2 | GO:0033063 | DNA recombinase mediator complex(GO:0033061) Rad51B-Rad51C-Rad51D-XRCC2 complex(GO:0033063) |
| 0.7 | 2.8 | GO:0070695 | FHF complex(GO:0070695) |
| 0.6 | 4.1 | GO:1903440 | calcitonin family receptor complex(GO:1903439) amylin receptor complex(GO:1903440) |
| 0.4 | 5.1 | GO:0099634 | postsynaptic specialization membrane(GO:0099634) |
| 0.4 | 3.6 | GO:0016013 | syntrophin complex(GO:0016013) |
| 0.4 | 2.6 | GO:0030868 | smooth endoplasmic reticulum membrane(GO:0030868) smooth endoplasmic reticulum part(GO:0097425) |
| 0.3 | 4.1 | GO:0097136 | Bcl-2 family protein complex(GO:0097136) |
| 0.3 | 8.4 | GO:0070971 | endoplasmic reticulum exit site(GO:0070971) |
| 0.3 | 5.4 | GO:0031089 | platelet dense granule lumen(GO:0031089) |
| 0.2 | 3.5 | GO:0005858 | axonemal dynein complex(GO:0005858) |
| 0.2 | 0.7 | GO:0097058 | CRLF-CLCF1 complex(GO:0097058) |
| 0.2 | 5.5 | GO:0002080 | acrosomal membrane(GO:0002080) |
| 0.2 | 2.7 | GO:0043083 | synaptic cleft(GO:0043083) |
| 0.2 | 9.9 | GO:1990391 | DNA repair complex(GO:1990391) |
| 0.2 | 13.5 | GO:0022627 | cytosolic small ribosomal subunit(GO:0022627) |
| 0.2 | 39.9 | GO:0072562 | blood microparticle(GO:0072562) |
| 0.2 | 1.9 | GO:0044798 | nuclear transcription factor complex(GO:0044798) |
| 0.2 | 2.1 | GO:0000788 | nuclear nucleosome(GO:0000788) |
| 0.1 | 6.1 | GO:0005669 | transcription factor TFIID complex(GO:0005669) |
| 0.1 | 4.1 | GO:0031904 | endosome lumen(GO:0031904) |
| 0.1 | 3.7 | GO:0032809 | neuronal cell body membrane(GO:0032809) cell body membrane(GO:0044298) |
| 0.1 | 2.7 | GO:0071565 | nBAF complex(GO:0071565) |
| 0.1 | 192.1 | GO:0005615 | extracellular space(GO:0005615) |
| 0.1 | 4.5 | GO:0031672 | A band(GO:0031672) |
| 0.1 | 1.0 | GO:0005902 | microvillus(GO:0005902) |
| 0.1 | 1.6 | GO:0097038 | perinuclear endoplasmic reticulum(GO:0097038) |
| 0.1 | 8.1 | GO:0070821 | tertiary granule membrane(GO:0070821) |
| 0.1 | 19.4 | GO:0005770 | late endosome(GO:0005770) |
| 0.1 | 8.9 | GO:0005901 | caveola(GO:0005901) |
| 0.1 | 2.7 | GO:0030173 | integral component of Golgi membrane(GO:0030173) |
| 0.1 | 2.1 | GO:0032982 | myosin filament(GO:0032982) |
| 0.1 | 0.9 | GO:0031254 | uropod(GO:0001931) cell trailing edge(GO:0031254) |
| 0.1 | 4.9 | GO:0099501 | synaptic vesicle membrane(GO:0030672) exocytic vesicle membrane(GO:0099501) |
| 0.1 | 3.0 | GO:0035580 | specific granule lumen(GO:0035580) |
| 0.1 | 21.9 | GO:0010008 | endosome membrane(GO:0010008) |
| 0.1 | 1.2 | GO:0033177 | proton-transporting two-sector ATPase complex, proton-transporting domain(GO:0033177) proton-transporting ATP synthase complex, coupling factor F(o)(GO:0045263) |
| 0.1 | 5.0 | GO:0005882 | intermediate filament(GO:0005882) |
| 0.1 | 1.0 | GO:0005903 | brush border(GO:0005903) |
| 0.1 | 0.6 | GO:0044666 | MLL3/4 complex(GO:0044666) |
| 0.0 | 11.3 | GO:0016323 | basolateral plasma membrane(GO:0016323) |
| 0.0 | 4.4 | GO:0005913 | cell-cell adherens junction(GO:0005913) |
| 0.0 | 1.3 | GO:0012507 | ER to Golgi transport vesicle membrane(GO:0012507) |
| 0.0 | 1.2 | GO:0008180 | COP9 signalosome(GO:0008180) |
| 0.0 | 1.8 | GO:0008021 | synaptic vesicle(GO:0008021) |
| 0.0 | 0.1 | GO:0034388 | Pwp2p-containing subcomplex of 90S preribosome(GO:0034388) |
| 0.0 | 3.2 | GO:0031514 | motile cilium(GO:0031514) |
| 0.0 | 3.0 | GO:0005814 | centriole(GO:0005814) |
| 0.0 | 1.5 | GO:0031907 | peroxisomal matrix(GO:0005782) microbody lumen(GO:0031907) |
| 0.0 | 0.8 | GO:0031201 | SNARE complex(GO:0031201) |
| 0.0 | 0.2 | GO:0033588 | Elongator holoenzyme complex(GO:0033588) |
| 0.0 | 0.2 | GO:0001527 | microfibril(GO:0001527) fibril(GO:0043205) |
| 0.0 | 2.5 | GO:0032587 | ruffle membrane(GO:0032587) |
| 0.0 | 0.1 | GO:0030673 | axolemma(GO:0030673) |
| 0.0 | 1.9 | GO:1902554 | serine/threonine protein kinase complex(GO:1902554) |
| 0.0 | 0.6 | GO:0001533 | cornified envelope(GO:0001533) |
| 0.0 | 0.9 | GO:0005776 | autophagosome(GO:0005776) |
| 0.0 | 0.5 | GO:0033116 | endoplasmic reticulum-Golgi intermediate compartment membrane(GO:0033116) |
| 0.0 | 0.3 | GO:0034706 | sodium channel complex(GO:0034706) |
| 0.0 | 0.1 | GO:0005796 | Golgi lumen(GO:0005796) |
| 0.0 | 1.7 | GO:0009897 | external side of plasma membrane(GO:0009897) |
Gene overrepresentation in molecular_function category:
| Log-likelihood per target | Total log-likelihood | Term | Description |
|---|---|---|---|
| 1.7 | 13.5 | GO:1990932 | 5.8S rRNA binding(GO:1990932) |
| 1.6 | 6.4 | GO:0016971 | flavin-linked sulfhydryl oxidase activity(GO:0016971) thiol oxidase activity(GO:0016972) |
| 1.6 | 17.5 | GO:0016494 | C-X-C chemokine receptor activity(GO:0016494) |
| 1.5 | 16.6 | GO:0004931 | extracellular ATP-gated cation channel activity(GO:0004931) ATP-gated ion channel activity(GO:0035381) |
| 1.1 | 6.8 | GO:0019763 | immunoglobulin receptor activity(GO:0019763) |
| 1.0 | 242.0 | GO:0003823 | antigen binding(GO:0003823) |
| 0.9 | 6.4 | GO:0008142 | oxysterol binding(GO:0008142) |
| 0.8 | 2.5 | GO:0016838 | carbon-oxygen lyase activity, acting on phosphates(GO:0016838) |
| 0.7 | 22.2 | GO:0001530 | lipopolysaccharide binding(GO:0001530) |
| 0.6 | 11.7 | GO:0019992 | diacylglycerol binding(GO:0019992) |
| 0.6 | 12.2 | GO:0033130 | acetylcholine receptor binding(GO:0033130) |
| 0.6 | 1.8 | GO:0033765 | 3-oxo-5-alpha-steroid 4-dehydrogenase activity(GO:0003865) steroid dehydrogenase activity, acting on the CH-CH group of donors(GO:0033765) cholestenone 5-alpha-reductase activity(GO:0047751) |
| 0.6 | 4.1 | GO:0097643 | amylin receptor activity(GO:0097643) |
| 0.5 | 7.2 | GO:0015095 | magnesium ion transmembrane transporter activity(GO:0015095) |
| 0.5 | 3.6 | GO:0097109 | neuroligin family protein binding(GO:0097109) |
| 0.5 | 2.0 | GO:0043812 | phosphatidylinositol-4-phosphate phosphatase activity(GO:0043812) |
| 0.5 | 1.9 | GO:0016361 | activin receptor activity, type I(GO:0016361) |
| 0.5 | 1.4 | GO:0008267 | poly-glutamine tract binding(GO:0008267) |
| 0.4 | 4.7 | GO:0015174 | basic amino acid transmembrane transporter activity(GO:0015174) |
| 0.4 | 12.1 | GO:0003887 | DNA-directed DNA polymerase activity(GO:0003887) |
| 0.4 | 3.2 | GO:0008172 | S-methyltransferase activity(GO:0008172) DNA-methyltransferase activity(GO:0009008) |
| 0.4 | 1.6 | GO:0008889 | glycerophosphodiester phosphodiesterase activity(GO:0008889) |
| 0.4 | 4.4 | GO:0019211 | phosphatase activator activity(GO:0019211) |
| 0.4 | 4.2 | GO:0000150 | recombinase activity(GO:0000150) |
| 0.4 | 1.1 | GO:0050501 | hyaluronan synthase activity(GO:0050501) |
| 0.3 | 1.0 | GO:0052594 | tryptamine:oxygen oxidoreductase (deaminating) activity(GO:0052593) aminoacetone:oxygen oxidoreductase(deaminating) activity(GO:0052594) aliphatic-amine oxidase activity(GO:0052595) phenethylamine:oxygen oxidoreductase (deaminating) activity(GO:0052596) |
| 0.3 | 1.6 | GO:0004668 | protein-arginine deiminase activity(GO:0004668) |
| 0.3 | 2.3 | GO:0004652 | polynucleotide adenylyltransferase activity(GO:0004652) |
| 0.3 | 0.9 | GO:0003953 | NAD+ nucleosidase activity(GO:0003953) NAD(P)+ nucleosidase activity(GO:0050135) |
| 0.2 | 6.3 | GO:0051959 | dynein light intermediate chain binding(GO:0051959) |
| 0.2 | 2.3 | GO:0001042 | RNA polymerase I core binding(GO:0001042) |
| 0.2 | 3.0 | GO:0016174 | NAD(P)H oxidase activity(GO:0016174) |
| 0.2 | 2.6 | GO:0016594 | glycine binding(GO:0016594) |
| 0.1 | 5.5 | GO:1990841 | promoter-specific chromatin binding(GO:1990841) |
| 0.1 | 8.9 | GO:0001784 | phosphotyrosine binding(GO:0001784) |
| 0.1 | 4.0 | GO:0005104 | fibroblast growth factor receptor binding(GO:0005104) |
| 0.1 | 3.7 | GO:0005251 | delayed rectifier potassium channel activity(GO:0005251) |
| 0.1 | 0.7 | GO:0005127 | ciliary neurotrophic factor receptor binding(GO:0005127) |
| 0.1 | 2.9 | GO:0031005 | filamin binding(GO:0031005) |
| 0.1 | 5.7 | GO:0042169 | SH2 domain binding(GO:0042169) |
| 0.1 | 2.4 | GO:0004535 | poly(A)-specific ribonuclease activity(GO:0004535) |
| 0.1 | 1.8 | GO:0015280 | ligand-gated sodium channel activity(GO:0015280) |
| 0.1 | 1.4 | GO:0016290 | palmitoyl-CoA hydrolase activity(GO:0016290) |
| 0.1 | 4.1 | GO:0070840 | dynein complex binding(GO:0070840) |
| 0.1 | 0.8 | GO:0004996 | thyroid-stimulating hormone receptor activity(GO:0004996) |
| 0.1 | 2.3 | GO:0097493 | structural molecule activity conferring elasticity(GO:0097493) |
| 0.1 | 2.0 | GO:0044548 | S100 protein binding(GO:0044548) |
| 0.1 | 2.8 | GO:0051428 | peptide hormone receptor binding(GO:0051428) |
| 0.1 | 1.5 | GO:0005351 | sugar:proton symporter activity(GO:0005351) cation:sugar symporter activity(GO:0005402) |
| 0.1 | 2.2 | GO:0046965 | retinoid X receptor binding(GO:0046965) |
| 0.1 | 0.6 | GO:0003810 | protein-glutamine gamma-glutamyltransferase activity(GO:0003810) |
| 0.1 | 3.2 | GO:0008138 | protein tyrosine/serine/threonine phosphatase activity(GO:0008138) |
| 0.1 | 2.4 | GO:0005452 | inorganic anion exchanger activity(GO:0005452) |
| 0.1 | 16.5 | GO:0005125 | cytokine activity(GO:0005125) |
| 0.1 | 6.6 | GO:0005070 | SH3/SH2 adaptor activity(GO:0005070) |
| 0.1 | 2.0 | GO:0005158 | insulin receptor binding(GO:0005158) |
| 0.1 | 0.9 | GO:0016918 | retinal binding(GO:0016918) |
| 0.1 | 3.0 | GO:0017112 | Rab guanyl-nucleotide exchange factor activity(GO:0017112) |
| 0.1 | 2.6 | GO:0005484 | SNAP receptor activity(GO:0005484) |
| 0.1 | 1.4 | GO:0022848 | acetylcholine-gated cation channel activity(GO:0022848) |
| 0.1 | 0.6 | GO:0008020 | G-protein coupled photoreceptor activity(GO:0008020) |
| 0.0 | 2.7 | GO:0005044 | scavenger receptor activity(GO:0005044) |
| 0.0 | 2.7 | GO:0016278 | lysine N-methyltransferase activity(GO:0016278) protein-lysine N-methyltransferase activity(GO:0016279) |
| 0.0 | 28.0 | GO:0046982 | protein heterodimerization activity(GO:0046982) |
| 0.0 | 1.2 | GO:0005523 | tropomyosin binding(GO:0005523) |
| 0.0 | 0.8 | GO:0005001 | transmembrane receptor protein tyrosine phosphatase activity(GO:0005001) transmembrane receptor protein phosphatase activity(GO:0019198) |
| 0.0 | 0.6 | GO:0032794 | GTPase activating protein binding(GO:0032794) |
| 0.0 | 0.3 | GO:0031545 | peptidyl-proline 4-dioxygenase activity(GO:0031545) |
| 0.0 | 1.7 | GO:0004693 | cyclin-dependent protein serine/threonine kinase activity(GO:0004693) |
| 0.0 | 0.8 | GO:0030371 | translation repressor activity(GO:0030371) |
| 0.0 | 2.4 | GO:0008083 | growth factor activity(GO:0008083) |
| 0.0 | 0.3 | GO:0004438 | phosphatidylinositol-3-phosphatase activity(GO:0004438) phosphatidylinositol monophosphate phosphatase activity(GO:0052744) |
| 0.0 | 0.2 | GO:0008607 | phosphorylase kinase regulator activity(GO:0008607) |
| 0.0 | 3.6 | GO:0005200 | structural constituent of cytoskeleton(GO:0005200) |
| 0.0 | 0.1 | GO:0052832 | inositol monophosphate 1-phosphatase activity(GO:0008934) inositol monophosphate 3-phosphatase activity(GO:0052832) inositol monophosphate 4-phosphatase activity(GO:0052833) inositol monophosphate phosphatase activity(GO:0052834) |
| 0.0 | 0.1 | GO:0015501 | glutamate:sodium symporter activity(GO:0015501) |
| 0.0 | 4.5 | GO:0005516 | calmodulin binding(GO:0005516) |
| 0.0 | 1.6 | GO:0008022 | protein C-terminus binding(GO:0008022) |
| 0.0 | 2.6 | GO:0001047 | core promoter binding(GO:0001047) |
| 0.0 | 9.3 | GO:0008047 | enzyme activator activity(GO:0008047) |
| 0.0 | 2.0 | GO:0004519 | endonuclease activity(GO:0004519) |
| 0.0 | 0.5 | GO:0030971 | receptor tyrosine kinase binding(GO:0030971) |
| 0.0 | 4.7 | GO:0003713 | transcription coactivator activity(GO:0003713) |
| 0.0 | 0.2 | GO:0030983 | mismatched DNA binding(GO:0030983) |
| 0.0 | 0.1 | GO:0004046 | aminoacylase activity(GO:0004046) |
| 0.0 | 9.1 | GO:0008270 | zinc ion binding(GO:0008270) |
Gene overrepresentation in C2:CP category:
| Log-likelihood per target | Total log-likelihood | Term | Description |
|---|---|---|---|
| 0.8 | 26.1 | PID TOLL ENDOGENOUS PATHWAY | Endogenous TLR signaling |
| 0.5 | 21.6 | PID S1P S1P3 PATHWAY | S1P3 pathway |
| 0.3 | 5.5 | SA PTEN PATHWAY | PTEN is a tumor suppressor that dephosphorylates the lipid messenger phosphatidylinositol triphosphate. |
| 0.2 | 11.7 | PID RAS PATHWAY | Regulation of Ras family activation |
| 0.2 | 8.9 | PID IL8 CXCR1 PATHWAY | IL8- and CXCR1-mediated signaling events |
| 0.2 | 4.9 | PID ARF 3PATHWAY | Arf1 pathway |
| 0.2 | 4.3 | PID TCR JNK PATHWAY | JNK signaling in the CD4+ TCR pathway |
| 0.2 | 4.1 | SA PROGRAMMED CELL DEATH | Programmed cell death, or apoptosis, eliminates damaged or unneeded cells. |
| 0.1 | 6.8 | PID FCER1 PATHWAY | Fc-epsilon receptor I signaling in mast cells |
| 0.1 | 6.4 | PID RET PATHWAY | Signaling events regulated by Ret tyrosine kinase |
| 0.1 | 7.1 | PID TCR CALCIUM PATHWAY | Calcium signaling in the CD4+ TCR pathway |
| 0.1 | 2.5 | PID IL27 PATHWAY | IL27-mediated signaling events |
| 0.0 | 3.2 | PID PLK1 PATHWAY | PLK1 signaling events |
| 0.0 | 2.7 | PID FGF PATHWAY | FGF signaling pathway |
| 0.0 | 0.5 | PID ANTHRAX PATHWAY | Cellular roles of Anthrax toxin |
| 0.0 | 0.8 | PID INSULIN PATHWAY | Insulin Pathway |
| 0.0 | 5.9 | NABA SECRETED FACTORS | Genes encoding secreted soluble factors |
| 0.0 | 1.6 | PID ERBB1 DOWNSTREAM PATHWAY | ErbB1 downstream signaling |
| 0.0 | 0.3 | PID WNT CANONICAL PATHWAY | Canonical Wnt signaling pathway |
Gene overrepresentation in C2:CP:REACTOME category:
| Log-likelihood per target | Total log-likelihood | Term | Description |
|---|---|---|---|
| 3.5 | 17.5 | REACTOME BINDING AND ENTRY OF HIV VIRION | Genes involved in Binding and entry of HIV virion |
| 2.6 | 26.1 | REACTOME IRAK2 MEDIATED ACTIVATION OF TAK1 COMPLEX UPON TLR7 8 OR 9 STIMULATION | Genes involved in IRAK2 mediated activation of TAK1 complex upon TLR7/8 or 9 stimulation |
| 0.4 | 19.2 | REACTOME LATENT INFECTION OF HOMO SAPIENS WITH MYCOBACTERIUM TUBERCULOSIS | Genes involved in Latent infection of Homo sapiens with Mycobacterium tuberculosis |
| 0.4 | 6.8 | REACTOME PLATELET ADHESION TO EXPOSED COLLAGEN | Genes involved in Platelet Adhesion to exposed collagen |
| 0.3 | 8.9 | REACTOME REGULATION OF SIGNALING BY CBL | Genes involved in Regulation of signaling by CBL |
| 0.3 | 11.1 | REACTOME EFFECTS OF PIP2 HYDROLYSIS | Genes involved in Effects of PIP2 hydrolysis |
| 0.2 | 4.1 | REACTOME IL 6 SIGNALING | Genes involved in Interleukin-6 signaling |
| 0.2 | 6.4 | REACTOME CIRCADIAN REPRESSION OF EXPRESSION BY REV ERBA | Genes involved in Circadian Repression of Expression by REV-ERBA |
| 0.2 | 4.0 | REACTOME FGFR1 LIGAND BINDING AND ACTIVATION | Genes involved in FGFR1 ligand binding and activation |
| 0.2 | 4.1 | REACTOME ACTIVATION OF BH3 ONLY PROTEINS | Genes involved in Activation of BH3-only proteins |
| 0.2 | 4.4 | REACTOME PROLONGED ERK ACTIVATION EVENTS | Genes involved in Prolonged ERK activation events |
| 0.2 | 2.0 | REACTOME SYNTHESIS OF PIPS AT THE LATE ENDOSOME MEMBRANE | Genes involved in Synthesis of PIPs at the late endosome membrane |
| 0.2 | 5.5 | REACTOME G0 AND EARLY G1 | Genes involved in G0 and Early G1 |
| 0.2 | 7.1 | REACTOME SMAD2 SMAD3 SMAD4 HETEROTRIMER REGULATES TRANSCRIPTION | Genes involved in SMAD2/SMAD3:SMAD4 heterotrimer regulates transcription |
| 0.2 | 13.0 | REACTOME FORMATION OF THE TERNARY COMPLEX AND SUBSEQUENTLY THE 43S COMPLEX | Genes involved in Formation of the ternary complex, and subsequently, the 43S complex |
| 0.1 | 2.8 | REACTOME YAP1 AND WWTR1 TAZ STIMULATED GENE EXPRESSION | Genes involved in YAP1- and WWTR1 (TAZ)-stimulated gene expression |
| 0.1 | 1.8 | REACTOME ANDROGEN BIOSYNTHESIS | Genes involved in Androgen biosynthesis |
| 0.1 | 4.3 | REACTOME GPVI MEDIATED ACTIVATION CASCADE | Genes involved in GPVI-mediated activation cascade |
| 0.1 | 2.9 | REACTOME CRMPS IN SEMA3A SIGNALING | Genes involved in CRMPs in Sema3A signaling |
| 0.1 | 4.7 | REACTOME AMINO ACID TRANSPORT ACROSS THE PLASMA MEMBRANE | Genes involved in Amino acid transport across the plasma membrane |
| 0.1 | 2.4 | REACTOME ORGANIC CATION ANION ZWITTERION TRANSPORT | Genes involved in Organic cation/anion/zwitterion transport |
| 0.1 | 3.2 | REACTOME COSTIMULATION BY THE CD28 FAMILY | Genes involved in Costimulation by the CD28 family |
| 0.1 | 1.9 | REACTOME SIGNALING BY NODAL | Genes involved in Signaling by NODAL |
| 0.1 | 1.4 | REACTOME RECYCLING OF BILE ACIDS AND SALTS | Genes involved in Recycling of bile acids and salts |
| 0.1 | 1.4 | REACTOME PRESYNAPTIC NICOTINIC ACETYLCHOLINE RECEPTORS | Genes involved in Presynaptic nicotinic acetylcholine receptors |
| 0.1 | 3.7 | REACTOME VOLTAGE GATED POTASSIUM CHANNELS | Genes involved in Voltage gated Potassium channels |
| 0.1 | 1.7 | REACTOME AMINO ACID AND OLIGOPEPTIDE SLC TRANSPORTERS | Genes involved in Amino acid and oligopeptide SLC transporters |
| 0.1 | 1.6 | REACTOME P38MAPK EVENTS | Genes involved in p38MAPK events |
| 0.1 | 1.5 | REACTOME SIGNAL REGULATORY PROTEIN SIRP FAMILY INTERACTIONS | Genes involved in Signal regulatory protein (SIRP) family interactions |
| 0.1 | 0.6 | REACTOME OPSINS | Genes involved in Opsins |
| 0.0 | 3.3 | REACTOME STRIATED MUSCLE CONTRACTION | Genes involved in Striated Muscle Contraction |
| 0.0 | 2.1 | REACTOME PACKAGING OF TELOMERE ENDS | Genes involved in Packaging Of Telomere Ends |
| 0.0 | 3.5 | REACTOME LOSS OF NLP FROM MITOTIC CENTROSOMES | Genes involved in Loss of Nlp from mitotic centrosomes |
| 0.0 | 2.4 | REACTOME NCAM1 INTERACTIONS | Genes involved in NCAM1 interactions |
| 0.0 | 3.2 | REACTOME DNA REPAIR | Genes involved in DNA Repair |
| 0.0 | 1.1 | REACTOME ELONGATION ARREST AND RECOVERY | Genes involved in Elongation arrest and recovery |
| 0.0 | 0.3 | REACTOME DEFENSINS | Genes involved in Defensins |
| 0.0 | 0.8 | REACTOME MRNA 3 END PROCESSING | Genes involved in mRNA 3'-end processing |
| 0.0 | 0.7 | REACTOME SIGNALING BY ROBO RECEPTOR | Genes involved in Signaling by Robo receptor |
| 0.0 | 3.4 | REACTOME GENERIC TRANSCRIPTION PATHWAY | Genes involved in Generic Transcription Pathway |