Project
GNF SymAtlas + NCI-60 cancer cell lines, comparison of cancers vs non-cancers, human (Su, 2004; Ross, 2000)
Navigation
Downloads
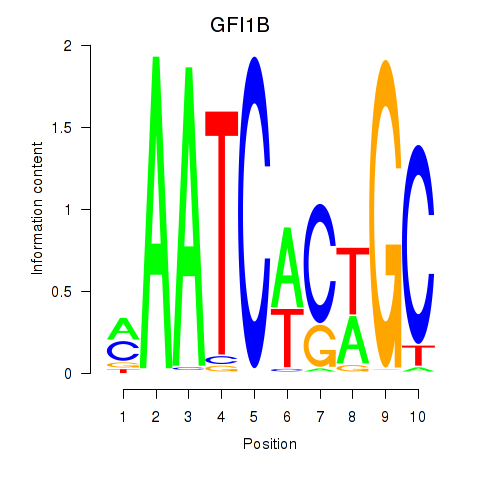
Results for GFI1B
Z-value: 0.48
Motif logo
Transcription factors associated with GFI1B
| Gene Symbol | Gene ID | Gene Info |
|---|---|---|
|
GFI1B
|
ENSG00000165702.8 | growth factor independent 1B transcriptional repressor |
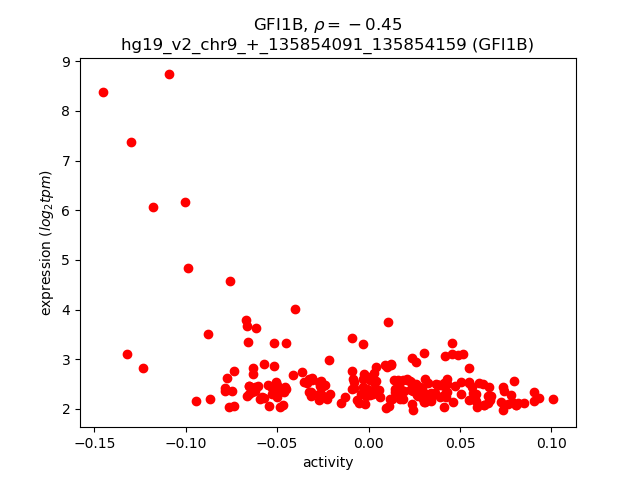
Activity-expression correlation:
| Gene | Promoter | Pearson corr. coef. | P-value | Plot |
|---|---|---|---|---|
| GFI1B | hg19_v2_chr9_+_135854091_135854159 | -0.45 | 1.7e-12 | Click! |
Activity profile of GFI1B motif
Sorted Z-values of GFI1B motif
| Promoter | Log-likelihood | Transcript | Gene | Gene Info |
|---|---|---|---|---|
| chr3_-_149688655 | 33.32 |
ENST00000461930.1
ENST00000423691.2 ENST00000490975.1 ENST00000461868.1 ENST00000452853.2 |
PFN2
|
profilin 2 |
| chr3_-_149688896 | 31.00 |
ENST00000239940.7
|
PFN2
|
profilin 2 |
| chr6_-_56707943 | 23.67 |
ENST00000370769.4
ENST00000421834.2 ENST00000312431.6 ENST00000361203.3 ENST00000523817.1 |
DST
|
dystonin |
| chr6_-_56708459 | 16.59 |
ENST00000370788.2
|
DST
|
dystonin |
| chr9_-_14180778 | 15.76 |
ENST00000380924.1
ENST00000543693.1 |
NFIB
|
nuclear factor I/B |
| chr5_+_36608422 | 15.18 |
ENST00000381918.3
|
SLC1A3
|
solute carrier family 1 (glial high affinity glutamate transporter), member 3 |
| chr4_-_176733897 | 13.86 |
ENST00000393658.2
|
GPM6A
|
glycoprotein M6A |
| chr1_-_23886285 | 11.83 |
ENST00000374561.5
|
ID3
|
inhibitor of DNA binding 3, dominant negative helix-loop-helix protein |
| chr4_+_41362796 | 11.75 |
ENST00000508501.1
ENST00000512946.1 ENST00000313860.7 ENST00000512632.1 ENST00000512820.1 |
LIMCH1
|
LIM and calponin homology domains 1 |
| chr4_+_154125565 | 11.32 |
ENST00000338700.5
|
TRIM2
|
tripartite motif containing 2 |
| chr12_+_48513570 | 11.15 |
ENST00000551804.1
|
PFKM
|
phosphofructokinase, muscle |
| chr12_+_48513009 | 10.76 |
ENST00000359794.5
ENST00000551339.1 ENST00000395233.2 ENST00000548345.1 |
PFKM
|
phosphofructokinase, muscle |
| chr22_+_24204375 | 10.53 |
ENST00000433835.3
|
AP000350.10
|
Uncharacterized protein |
| chr12_-_123752624 | 9.96 |
ENST00000542174.1
ENST00000535796.1 |
CDK2AP1
|
cyclin-dependent kinase 2 associated protein 1 |
| chr10_+_124221036 | 9.78 |
ENST00000368984.3
|
HTRA1
|
HtrA serine peptidase 1 |
| chr7_+_134576317 | 9.69 |
ENST00000424922.1
ENST00000495522.1 |
CALD1
|
caldesmon 1 |
| chr14_-_53417732 | 9.26 |
ENST00000399304.3
ENST00000395631.2 ENST00000341590.3 ENST00000343279.4 |
FERMT2
|
fermitin family member 2 |
| chr17_-_79827808 | 8.92 |
ENST00000580685.1
|
ARHGDIA
|
Rho GDP dissociation inhibitor (GDI) alpha |
| chr7_+_134576151 | 8.86 |
ENST00000393118.2
|
CALD1
|
caldesmon 1 |
| chr11_+_32112431 | 8.42 |
ENST00000054950.3
|
RCN1
|
reticulocalbin 1, EF-hand calcium binding domain |
| chr17_+_49230897 | 8.26 |
ENST00000393196.3
ENST00000336097.3 ENST00000480143.1 ENST00000511355.1 ENST00000013034.3 ENST00000393198.3 ENST00000608447.1 ENST00000393193.2 ENST00000376392.6 ENST00000555572.1 |
NME1
NME1-NME2
NME2
|
NME/NM23 nucleoside diphosphate kinase 1 NME1-NME2 readthrough NME/NM23 nucleoside diphosphate kinase 2 |
| chr15_+_32933866 | 8.08 |
ENST00000300175.4
ENST00000413748.2 ENST00000494364.1 ENST00000497208.1 |
SCG5
|
secretogranin V (7B2 protein) |
| chr6_-_131384347 | 7.99 |
ENST00000530481.1
|
EPB41L2
|
erythrocyte membrane protein band 4.1-like 2 |
| chr19_-_44123734 | 7.66 |
ENST00000598676.1
|
ZNF428
|
zinc finger protein 428 |
| chr17_-_46688334 | 7.57 |
ENST00000239165.7
|
HOXB7
|
homeobox B7 |
| chr8_-_49834299 | 7.44 |
ENST00000396822.1
|
SNAI2
|
snail family zinc finger 2 |
| chr6_+_123100620 | 7.32 |
ENST00000368444.3
|
FABP7
|
fatty acid binding protein 7, brain |
| chr13_-_67802549 | 7.31 |
ENST00000328454.5
ENST00000377865.2 |
PCDH9
|
protocadherin 9 |
| chr17_+_70117153 | 7.30 |
ENST00000245479.2
|
SOX9
|
SRY (sex determining region Y)-box 9 |
| chr17_-_79895097 | 7.25 |
ENST00000402252.2
ENST00000583564.1 ENST00000585244.1 ENST00000337943.5 ENST00000579698.1 |
PYCR1
|
pyrroline-5-carboxylate reductase 1 |
| chr3_-_165555200 | 7.14 |
ENST00000479451.1
ENST00000540653.1 ENST00000488954.1 ENST00000264381.3 |
BCHE
|
butyrylcholinesterase |
| chr6_-_131384373 | 7.13 |
ENST00000392427.3
ENST00000525271.1 ENST00000527411.1 |
EPB41L2
|
erythrocyte membrane protein band 4.1-like 2 |
| chr9_-_95056010 | 7.09 |
ENST00000443024.2
|
IARS
|
isoleucyl-tRNA synthetase |
| chrX_+_77359726 | 7.08 |
ENST00000442431.1
|
PGK1
|
phosphoglycerate kinase 1 |
| chr5_-_146461027 | 7.03 |
ENST00000394410.2
ENST00000508267.1 ENST00000504198.1 |
PPP2R2B
|
protein phosphatase 2, regulatory subunit B, beta |
| chr6_-_131384412 | 6.94 |
ENST00000445890.2
ENST00000368128.2 ENST00000337057.3 |
EPB41L2
|
erythrocyte membrane protein band 4.1-like 2 |
| chr7_+_79765071 | 6.90 |
ENST00000457358.2
|
GNAI1
|
guanine nucleotide binding protein (G protein), alpha inhibiting activity polypeptide 1 |
| chrX_+_77359671 | 6.89 |
ENST00000373316.4
|
PGK1
|
phosphoglycerate kinase 1 |
| chr17_-_79895154 | 6.88 |
ENST00000405481.4
ENST00000585215.1 ENST00000577624.1 ENST00000403172.4 |
PYCR1
|
pyrroline-5-carboxylate reductase 1 |
| chr11_-_61582579 | 6.85 |
ENST00000539419.1
ENST00000545245.1 ENST00000545405.1 ENST00000542506.1 |
FADS1
|
fatty acid desaturase 1 |
| chr2_-_9563469 | 6.77 |
ENST00000484735.1
ENST00000456913.2 |
ITGB1BP1
|
integrin beta 1 binding protein 1 |
| chr7_+_39663061 | 6.70 |
ENST00000005257.2
|
RALA
|
v-ral simian leukemia viral oncogene homolog A (ras related) |
| chr14_-_103523745 | 6.68 |
ENST00000361246.2
|
CDC42BPB
|
CDC42 binding protein kinase beta (DMPK-like) |
| chr1_-_94703118 | 6.33 |
ENST00000260526.6
ENST00000370217.3 |
ARHGAP29
|
Rho GTPase activating protein 29 |
| chr10_+_31610064 | 6.30 |
ENST00000446923.2
ENST00000559476.1 |
ZEB1
|
zinc finger E-box binding homeobox 1 |
| chr14_-_68162464 | 6.24 |
ENST00000553384.1
ENST00000557726.1 ENST00000381346.4 |
RDH11
|
retinol dehydrogenase 11 (all-trans/9-cis/11-cis) |
| chr1_-_230513367 | 6.22 |
ENST00000321327.2
ENST00000525115.1 |
PGBD5
|
piggyBac transposable element derived 5 |
| chr4_-_102268484 | 6.15 |
ENST00000394853.4
|
PPP3CA
|
protein phosphatase 3, catalytic subunit, alpha isozyme |
| chr7_+_112063192 | 5.94 |
ENST00000005558.4
|
IFRD1
|
interferon-related developmental regulator 1 |
| chr5_-_125930929 | 5.88 |
ENST00000553117.1
ENST00000447989.2 ENST00000409134.3 |
ALDH7A1
|
aldehyde dehydrogenase 7 family, member A1 |
| chr8_-_49833978 | 5.81 |
ENST00000020945.1
|
SNAI2
|
snail family zinc finger 2 |
| chr2_-_110371720 | 5.80 |
ENST00000356688.4
|
SEPT10
|
septin 10 |
| chr2_-_10978103 | 5.78 |
ENST00000404824.2
|
PDIA6
|
protein disulfide isomerase family A, member 6 |
| chr6_-_131321863 | 5.73 |
ENST00000528282.1
|
EPB41L2
|
erythrocyte membrane protein band 4.1-like 2 |
| chr17_+_34848049 | 5.68 |
ENST00000588902.1
ENST00000591067.1 |
ZNHIT3
|
zinc finger, HIT-type containing 3 |
| chr7_+_150758304 | 5.63 |
ENST00000482950.1
ENST00000463414.1 ENST00000310317.5 |
SLC4A2
|
solute carrier family 4 (anion exchanger), member 2 |
| chr19_-_44124019 | 5.55 |
ENST00000300811.3
|
ZNF428
|
zinc finger protein 428 |
| chr19_+_33071974 | 5.47 |
ENST00000590247.2
ENST00000419343.3 ENST00000592786.1 ENST00000379316.3 |
PDCD5
|
programmed cell death 5 |
| chr2_+_54683419 | 5.46 |
ENST00000356805.4
|
SPTBN1
|
spectrin, beta, non-erythrocytic 1 |
| chr2_-_110371777 | 5.45 |
ENST00000397712.2
|
SEPT10
|
septin 10 |
| chr2_-_9563319 | 5.32 |
ENST00000497105.1
ENST00000360635.3 ENST00000359712.3 |
ITGB1BP1
|
integrin beta 1 binding protein 1 |
| chr7_+_141438393 | 5.27 |
ENST00000484178.1
ENST00000473783.1 ENST00000481508.1 |
SSBP1
|
single-stranded DNA binding protein 1, mitochondrial |
| chr2_-_96874553 | 5.27 |
ENST00000337288.5
ENST00000443962.1 |
STARD7
|
StAR-related lipid transfer (START) domain containing 7 |
| chr10_+_63661053 | 5.20 |
ENST00000279873.7
|
ARID5B
|
AT rich interactive domain 5B (MRF1-like) |
| chr1_+_39796810 | 5.17 |
ENST00000289893.4
|
MACF1
|
microtubule-actin crosslinking factor 1 |
| chr16_-_18441131 | 5.15 |
ENST00000339303.5
|
NPIPA8
|
nuclear pore complex interacting protein family, member A8 |
| chr17_-_9929581 | 5.11 |
ENST00000437099.2
ENST00000396115.2 |
GAS7
|
growth arrest-specific 7 |
| chr6_+_44215603 | 5.11 |
ENST00000371554.1
|
HSP90AB1
|
heat shock protein 90kDa alpha (cytosolic), class B member 1 |
| chr12_+_117176090 | 5.10 |
ENST00000257575.4
ENST00000407967.3 ENST00000392549.2 |
RNFT2
|
ring finger protein, transmembrane 2 |
| chr2_-_110371412 | 5.06 |
ENST00000415095.1
ENST00000334001.6 ENST00000437928.1 ENST00000493445.1 ENST00000397714.2 ENST00000461295.1 |
SEPT10
|
septin 10 |
| chr1_+_164528866 | 4.99 |
ENST00000420696.2
|
PBX1
|
pre-B-cell leukemia homeobox 1 |
| chr1_-_237167718 | 4.96 |
ENST00000464121.2
|
MT1HL1
|
metallothionein 1H-like 1 |
| chr7_+_134551583 | 4.96 |
ENST00000435928.1
|
CALD1
|
caldesmon 1 |
| chr5_+_79703823 | 4.94 |
ENST00000338008.5
ENST00000510158.1 ENST00000505560.1 |
ZFYVE16
|
zinc finger, FYVE domain containing 16 |
| chr1_+_162602244 | 4.90 |
ENST00000367922.3
ENST00000367921.3 |
DDR2
|
discoidin domain receptor tyrosine kinase 2 |
| chr3_-_33759699 | 4.89 |
ENST00000399362.4
ENST00000359576.5 ENST00000307312.7 |
CLASP2
|
cytoplasmic linker associated protein 2 |
| chr17_-_19281203 | 4.87 |
ENST00000487415.2
|
B9D1
|
B9 protein domain 1 |
| chr10_+_17272608 | 4.80 |
ENST00000421459.2
|
VIM
|
vimentin |
| chr2_+_201754050 | 4.77 |
ENST00000426253.1
ENST00000416651.1 ENST00000454952.1 ENST00000409020.1 ENST00000359683.4 |
NIF3L1
|
NIF3 NGG1 interacting factor 3-like 1 (S. cerevisiae) |
| chr7_-_108096765 | 4.71 |
ENST00000379024.4
ENST00000351718.4 |
NRCAM
|
neuronal cell adhesion molecule |
| chr7_+_141438118 | 4.64 |
ENST00000265304.6
ENST00000498107.1 ENST00000467681.1 ENST00000465582.1 ENST00000463093.1 |
SSBP1
|
single-stranded DNA binding protein 1, mitochondrial |
| chr6_-_116601044 | 4.62 |
ENST00000368608.3
|
TSPYL1
|
TSPY-like 1 |
| chr11_-_117748138 | 4.54 |
ENST00000527717.1
|
FXYD6
|
FXYD domain containing ion transport regulator 6 |
| chr2_+_201754135 | 4.54 |
ENST00000409357.1
ENST00000409129.2 |
NIF3L1
|
NIF3 NGG1 interacting factor 3-like 1 (S. cerevisiae) |
| chr18_-_5419797 | 4.47 |
ENST00000542146.1
ENST00000427684.2 |
EPB41L3
|
erythrocyte membrane protein band 4.1-like 3 |
| chr19_-_14945933 | 4.47 |
ENST00000322301.3
|
OR7A5
|
olfactory receptor, family 7, subfamily A, member 5 |
| chr2_-_9563575 | 4.38 |
ENST00000488451.1
ENST00000238091.4 ENST00000355346.4 |
ITGB1BP1
|
integrin beta 1 binding protein 1 |
| chr2_+_11752379 | 4.31 |
ENST00000396123.1
|
GREB1
|
growth regulation by estrogen in breast cancer 1 |
| chr12_+_117176113 | 4.30 |
ENST00000319176.7
|
RNFT2
|
ring finger protein, transmembrane 2 |
| chr2_-_190044480 | 4.30 |
ENST00000374866.3
|
COL5A2
|
collagen, type V, alpha 2 |
| chr1_-_143767881 | 4.28 |
ENST00000419275.1
|
PPIAL4G
|
peptidylprolyl isomerase A (cyclophilin A)-like 4G |
| chr11_-_33774944 | 4.25 |
ENST00000532057.1
ENST00000531080.1 |
FBXO3
|
F-box protein 3 |
| chr2_-_55496344 | 4.23 |
ENST00000403721.1
ENST00000263629.4 |
MTIF2
|
mitochondrial translational initiation factor 2 |
| chr7_+_56119323 | 3.99 |
ENST00000275603.4
ENST00000335503.3 ENST00000540286.1 |
CCT6A
|
chaperonin containing TCP1, subunit 6A (zeta 1) |
| chr2_-_55496174 | 3.94 |
ENST00000417363.1
ENST00000412530.1 ENST00000394600.3 ENST00000366137.2 ENST00000420637.1 |
MTIF2
|
mitochondrial translational initiation factor 2 |
| chr1_-_144364246 | 3.92 |
ENST00000540273.1
|
PPIAL4B
|
peptidylprolyl isomerase A (cyclophilin A)-like 4B |
| chr2_+_47630108 | 3.88 |
ENST00000233146.2
ENST00000454849.1 ENST00000543555.1 |
MSH2
|
mutS homolog 2 |
| chr7_-_108096822 | 3.88 |
ENST00000379028.3
ENST00000413765.2 ENST00000379022.4 |
NRCAM
|
neuronal cell adhesion molecule |
| chr18_-_24445729 | 3.85 |
ENST00000383168.4
|
AQP4
|
aquaporin 4 |
| chr7_+_39663485 | 3.81 |
ENST00000436179.1
|
RALA
|
v-ral simian leukemia viral oncogene homolog A (ras related) |
| chr2_+_171785012 | 3.79 |
ENST00000234160.4
|
GORASP2
|
golgi reassembly stacking protein 2, 55kDa |
| chr14_+_78870030 | 3.67 |
ENST00000553631.1
ENST00000554719.1 |
NRXN3
|
neurexin 3 |
| chr6_+_12290586 | 3.67 |
ENST00000379375.5
|
EDN1
|
endothelin 1 |
| chr10_-_129924468 | 3.63 |
ENST00000368653.3
|
MKI67
|
marker of proliferation Ki-67 |
| chr9_+_12693336 | 3.56 |
ENST00000381137.2
ENST00000388918.5 |
TYRP1
|
tyrosinase-related protein 1 |
| chr7_-_87856280 | 3.56 |
ENST00000490437.1
ENST00000431660.1 |
SRI
|
sorcin |
| chr22_+_38864041 | 3.55 |
ENST00000216014.4
ENST00000409006.3 |
KDELR3
|
KDEL (Lys-Asp-Glu-Leu) endoplasmic reticulum protein retention receptor 3 |
| chr19_-_55660561 | 3.52 |
ENST00000587758.1
ENST00000356783.5 ENST00000291901.8 ENST00000588426.1 ENST00000588147.1 ENST00000536926.1 ENST00000588981.1 |
TNNT1
|
troponin T type 1 (skeletal, slow) |
| chr11_-_61659006 | 3.51 |
ENST00000278829.2
|
FADS3
|
fatty acid desaturase 3 |
| chrX_+_119737806 | 3.39 |
ENST00000371317.5
|
MCTS1
|
malignant T cell amplified sequence 1 |
| chr11_+_93861993 | 3.38 |
ENST00000227638.3
ENST00000436171.2 |
PANX1
|
pannexin 1 |
| chr17_-_79481666 | 3.37 |
ENST00000575659.1
|
ACTG1
|
actin, gamma 1 |
| chr4_+_41937131 | 3.32 |
ENST00000504986.1
ENST00000508448.1 ENST00000513702.1 ENST00000325094.5 |
TMEM33
|
transmembrane protein 33 |
| chr1_-_148202536 | 3.30 |
ENST00000544708.1
|
PPIAL4D
|
peptidylprolyl isomerase A (cyclophilin A)-like 4D |
| chr5_+_150591678 | 3.19 |
ENST00000523466.1
|
GM2A
|
GM2 ganglioside activator |
| chr1_+_149553003 | 3.17 |
ENST00000369222.3
|
PPIAL4C
|
peptidylprolyl isomerase A (cyclophilin A)-like 4C |
| chr20_-_33999766 | 3.14 |
ENST00000349714.5
ENST00000438533.1 ENST00000359226.2 ENST00000374384.2 ENST00000374377.5 ENST00000407996.2 ENST00000424405.1 ENST00000542501.1 ENST00000397554.1 ENST00000540457.1 ENST00000374380.2 ENST00000374385.5 |
UQCC1
|
ubiquinol-cytochrome c reductase complex assembly factor 1 |
| chr7_-_100808394 | 3.11 |
ENST00000445482.2
|
VGF
|
VGF nerve growth factor inducible |
| chr10_-_129924611 | 3.07 |
ENST00000368654.3
|
MKI67
|
marker of proliferation Ki-67 |
| chr10_+_88516396 | 3.06 |
ENST00000372037.3
|
BMPR1A
|
bone morphogenetic protein receptor, type IA |
| chr18_+_11857439 | 2.96 |
ENST00000602628.1
|
GNAL
|
guanine nucleotide binding protein (G protein), alpha activating activity polypeptide, olfactory type |
| chr1_+_150337144 | 2.94 |
ENST00000539519.1
ENST00000369067.3 ENST00000369068.4 |
RPRD2
|
regulation of nuclear pre-mRNA domain containing 2 |
| chr1_-_115300579 | 2.91 |
ENST00000358528.4
ENST00000525132.1 |
CSDE1
|
cold shock domain containing E1, RNA-binding |
| chr7_+_73106926 | 2.89 |
ENST00000453316.1
|
WBSCR22
|
Williams Beuren syndrome chromosome region 22 |
| chr2_-_158732340 | 2.87 |
ENST00000539637.1
ENST00000413751.1 ENST00000434821.1 ENST00000424669.1 |
ACVR1
|
activin A receptor, type I |
| chrX_+_129473916 | 2.84 |
ENST00000545805.1
ENST00000543953.1 ENST00000218197.5 |
SLC25A14
|
solute carrier family 25 (mitochondrial carrier, brain), member 14 |
| chr20_-_32262165 | 2.83 |
ENST00000606690.1
ENST00000246190.6 ENST00000439478.1 ENST00000375238.4 |
NECAB3
|
N-terminal EF-hand calcium binding protein 3 |
| chr16_+_4526341 | 2.81 |
ENST00000458134.3
ENST00000219700.6 ENST00000575120.1 ENST00000572812.1 ENST00000574466.1 ENST00000576827.1 ENST00000570445.1 |
HMOX2
|
heme oxygenase (decycling) 2 |
| chr6_+_71122974 | 2.77 |
ENST00000418814.2
|
FAM135A
|
family with sequence similarity 135, member A |
| chr5_+_159436120 | 2.75 |
ENST00000522793.1
ENST00000231238.5 |
TTC1
|
tetratricopeptide repeat domain 1 |
| chr12_+_95867919 | 2.74 |
ENST00000261220.9
ENST00000549502.1 ENST00000553151.1 ENST00000550777.1 ENST00000551840.1 |
METAP2
|
methionyl aminopeptidase 2 |
| chr1_+_206516200 | 2.71 |
ENST00000295713.5
|
SRGAP2
|
SLIT-ROBO Rho GTPase activating protein 2 |
| chr11_-_102595681 | 2.70 |
ENST00000236826.3
|
MMP8
|
matrix metallopeptidase 8 (neutrophil collagenase) |
| chr1_+_226736446 | 2.70 |
ENST00000366788.3
ENST00000366789.4 |
C1orf95
|
chromosome 1 open reading frame 95 |
| chr11_+_101785727 | 2.69 |
ENST00000263468.8
|
KIAA1377
|
KIAA1377 |
| chr12_+_54447637 | 2.64 |
ENST00000609810.1
ENST00000430889.2 |
HOXC4
HOXC4
|
homeobox C4 Homeobox protein Hox-C4 |
| chr1_+_150337100 | 2.63 |
ENST00000401000.4
|
RPRD2
|
regulation of nuclear pre-mRNA domain containing 2 |
| chr15_-_34331243 | 2.62 |
ENST00000306730.3
|
AVEN
|
apoptosis, caspase activation inhibitor |
| chr9_-_70488865 | 2.60 |
ENST00000377392.5
|
CBWD5
|
COBW domain containing 5 |
| chr15_+_67458357 | 2.58 |
ENST00000537194.2
|
SMAD3
|
SMAD family member 3 |
| chr1_-_21377383 | 2.55 |
ENST00000374935.3
|
EIF4G3
|
eukaryotic translation initiation factor 4 gamma, 3 |
| chrX_+_7137475 | 2.54 |
ENST00000217961.4
|
STS
|
steroid sulfatase (microsomal), isozyme S |
| chr1_-_147955419 | 2.54 |
ENST00000539781.1
|
PPIAL4A
|
peptidylprolyl isomerase A (cyclophilin A)-like 4A |
| chr17_-_1395954 | 2.53 |
ENST00000359786.5
|
MYO1C
|
myosin IC |
| chr11_+_27076764 | 2.50 |
ENST00000525090.1
|
BBOX1
|
butyrobetaine (gamma), 2-oxoglutarate dioxygenase (gamma-butyrobetaine hydroxylase) 1 |
| chr1_-_21377447 | 2.50 |
ENST00000374937.3
ENST00000264211.8 |
EIF4G3
|
eukaryotic translation initiation factor 4 gamma, 3 |
| chr1_-_68698222 | 2.46 |
ENST00000370976.3
ENST00000354777.2 ENST00000262348.4 ENST00000540432.1 |
WLS
|
wntless Wnt ligand secretion mediator |
| chr20_-_35274548 | 2.40 |
ENST00000262866.4
|
SLA2
|
Src-like-adaptor 2 |
| chr11_+_35684288 | 2.40 |
ENST00000299413.5
|
TRIM44
|
tripartite motif containing 44 |
| chr1_-_115300592 | 2.38 |
ENST00000261443.5
ENST00000534699.1 ENST00000339438.6 ENST00000529046.1 ENST00000525970.1 ENST00000369530.1 ENST00000530886.1 |
CSDE1
|
cold shock domain containing E1, RNA-binding |
| chr19_+_21265028 | 2.36 |
ENST00000291770.7
|
ZNF714
|
zinc finger protein 714 |
| chr19_-_10687907 | 2.32 |
ENST00000589348.1
|
AP1M2
|
adaptor-related protein complex 1, mu 2 subunit |
| chr5_+_15500280 | 2.30 |
ENST00000504595.1
|
FBXL7
|
F-box and leucine-rich repeat protein 7 |
| chr12_+_93861264 | 2.28 |
ENST00000549982.1
ENST00000361630.2 |
MRPL42
|
mitochondrial ribosomal protein L42 |
| chr2_-_130886795 | 2.23 |
ENST00000409914.2
|
POTEF
|
POTE ankyrin domain family, member F |
| chr8_-_22926623 | 2.20 |
ENST00000276431.4
|
TNFRSF10B
|
tumor necrosis factor receptor superfamily, member 10b |
| chr1_-_220220000 | 2.20 |
ENST00000366923.3
|
EPRS
|
glutamyl-prolyl-tRNA synthetase |
| chr3_-_49466686 | 2.16 |
ENST00000273598.3
ENST00000436744.2 |
NICN1
|
nicolin 1 |
| chr2_+_110371905 | 2.16 |
ENST00000356454.3
|
SOWAHC
|
sosondowah ankyrin repeat domain family member C |
| chr14_+_29236269 | 2.15 |
ENST00000313071.4
|
FOXG1
|
forkhead box G1 |
| chr19_-_43708378 | 2.11 |
ENST00000599746.1
|
PSG4
|
pregnancy specific beta-1-glycoprotein 4 |
| chr12_+_6603253 | 2.11 |
ENST00000382457.4
ENST00000545962.1 |
NCAPD2
|
non-SMC condensin I complex, subunit D2 |
| chr1_+_15272271 | 2.07 |
ENST00000400797.3
|
KAZN
|
kazrin, periplakin interacting protein |
| chr9_-_127263265 | 2.05 |
ENST00000373587.3
|
NR5A1
|
nuclear receptor subfamily 5, group A, member 1 |
| chr11_-_102595512 | 2.00 |
ENST00000438475.2
|
MMP8
|
matrix metallopeptidase 8 (neutrophil collagenase) |
| chr17_-_9862772 | 1.99 |
ENST00000580865.1
ENST00000583882.1 |
GAS7
|
growth arrest-specific 7 |
| chr6_+_116601265 | 1.96 |
ENST00000452085.3
|
DSE
|
dermatan sulfate epimerase |
| chr12_-_82153087 | 1.93 |
ENST00000547623.1
ENST00000549396.1 |
PPFIA2
|
protein tyrosine phosphatase, receptor type, f polypeptide (PTPRF), interacting protein (liprin), alpha 2 |
| chr1_+_35544968 | 1.92 |
ENST00000359858.4
ENST00000373330.1 |
ZMYM1
|
zinc finger, MYM-type 1 |
| chr7_-_14029515 | 1.91 |
ENST00000430479.1
ENST00000405218.2 ENST00000343495.5 |
ETV1
|
ets variant 1 |
| chr19_+_41770269 | 1.88 |
ENST00000378215.4
|
HNRNPUL1
|
heterogeneous nuclear ribonucleoprotein U-like 1 |
| chr5_+_140261703 | 1.87 |
ENST00000409494.1
ENST00000289272.2 |
PCDHA13
|
protocadherin alpha 13 |
| chr16_-_18468926 | 1.86 |
ENST00000545114.1
|
RP11-1212A22.4
|
LOC339047 protein; Nuclear pore complex-interacting protein family member A3; Nuclear pore complex-interacting protein family member A5; Protein PKD1P1 |
| chr14_-_106069247 | 1.77 |
ENST00000479229.1
|
RP11-731F5.1
|
RP11-731F5.1 |
| chr19_+_41770349 | 1.76 |
ENST00000602130.1
|
HNRNPUL1
|
heterogeneous nuclear ribonucleoprotein U-like 1 |
| chrM_+_4431 | 1.76 |
ENST00000361453.3
|
MT-ND2
|
mitochondrially encoded NADH dehydrogenase 2 |
| chr2_-_110371664 | 1.75 |
ENST00000545389.1
ENST00000423520.1 |
SEPT10
|
septin 10 |
| chr1_+_95616933 | 1.73 |
ENST00000604203.1
|
RP11-57H12.6
|
TMEM56-RWDD3 readthrough |
| chr5_+_14143728 | 1.69 |
ENST00000344204.4
ENST00000537187.1 |
TRIO
|
trio Rho guanine nucleotide exchange factor |
| chr2_-_85788652 | 1.68 |
ENST00000430215.3
|
GGCX
|
gamma-glutamyl carboxylase |
| chr22_+_19951192 | 1.68 |
ENST00000428707.1
|
COMT
|
catechol-O-methyltransferase |
| chr6_-_13621126 | 1.65 |
ENST00000600057.1
|
AL441883.1
|
Uncharacterized protein |
| chr20_-_57607347 | 1.64 |
ENST00000395663.1
ENST00000395659.1 ENST00000243997.3 |
ATP5E
|
ATP synthase, H+ transporting, mitochondrial F1 complex, epsilon subunit |
| chr15_-_83378638 | 1.55 |
ENST00000261722.3
|
AP3B2
|
adaptor-related protein complex 3, beta 2 subunit |
| chr9_+_35490101 | 1.52 |
ENST00000361226.3
|
RUSC2
|
RUN and SH3 domain containing 2 |
| chr11_-_26743546 | 1.52 |
ENST00000280467.6
ENST00000396005.3 |
SLC5A12
|
solute carrier family 5 (sodium/monocarboxylate cotransporter), member 12 |
| chr20_-_48330377 | 1.49 |
ENST00000371711.4
|
B4GALT5
|
UDP-Gal:betaGlcNAc beta 1,4- galactosyltransferase, polypeptide 5 |
| chr3_+_173116225 | 1.45 |
ENST00000457714.1
|
NLGN1
|
neuroligin 1 |
| chr6_+_71123107 | 1.40 |
ENST00000370479.3
ENST00000505769.1 ENST00000515323.1 ENST00000515280.1 ENST00000507085.1 ENST00000457062.2 ENST00000361499.3 |
FAM135A
|
family with sequence similarity 135, member A |
| chr19_-_4831701 | 1.39 |
ENST00000248244.5
|
TICAM1
|
toll-like receptor adaptor molecule 1 |
| chr11_+_30253410 | 1.39 |
ENST00000533718.1
|
FSHB
|
follicle stimulating hormone, beta polypeptide |
| chr19_+_57862622 | 1.39 |
ENST00000391705.3
ENST00000443917.2 ENST00000598744.1 |
ZNF304
|
zinc finger protein 304 |
| chr14_-_93214915 | 1.34 |
ENST00000553918.1
ENST00000555699.1 ENST00000553802.1 ENST00000554397.1 ENST00000554919.1 ENST00000554080.1 ENST00000553371.1 |
LGMN
|
legumain |
| chr22_+_41865109 | 1.33 |
ENST00000216254.4
ENST00000396512.3 |
ACO2
|
aconitase 2, mitochondrial |
| chr4_-_159080806 | 1.32 |
ENST00000590648.1
|
FAM198B
|
family with sequence similarity 198, member B |
| chr7_-_100808843 | 1.32 |
ENST00000249330.2
|
VGF
|
VGF nerve growth factor inducible |
| chr11_+_76571911 | 1.30 |
ENST00000534206.1
ENST00000532485.1 ENST00000526597.1 ENST00000533873.1 ENST00000538157.1 |
ACER3
|
alkaline ceramidase 3 |
| chr10_+_72575643 | 1.29 |
ENST00000373202.3
|
SGPL1
|
sphingosine-1-phosphate lyase 1 |
| chr14_-_93214988 | 1.28 |
ENST00000557434.1
ENST00000393218.2 ENST00000334869.4 |
LGMN
|
legumain |
| chr15_-_42500351 | 1.25 |
ENST00000348544.4
ENST00000318006.5 |
VPS39
|
vacuolar protein sorting 39 homolog (S. cerevisiae) |
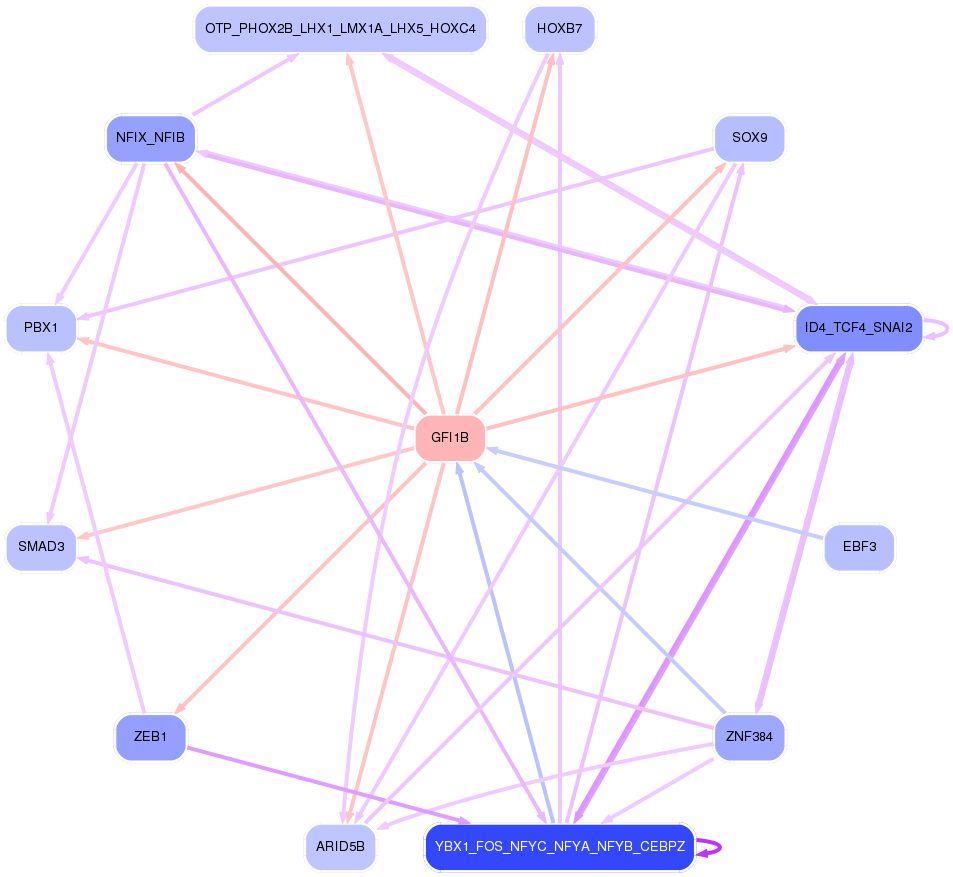
Network of associatons between targets according to the STRING database.

First level regulatory network of GFI1B
Gene Ontology Analysis
Gene overrepresentation in biological_process category:
| Log-likelihood per target | Total log-likelihood | Term | Description |
|---|---|---|---|
| 7.3 | 21.9 | GO:0093001 | glycolysis from storage polysaccharide through glucose-1-phosphate(GO:0093001) |
| 5.4 | 64.3 | GO:1900028 | negative regulation of ruffle assembly(GO:1900028) |
| 4.5 | 40.3 | GO:0008090 | retrograde axonal transport(GO:0008090) |
| 4.4 | 13.2 | GO:0070563 | negative regulation of vitamin D receptor signaling pathway(GO:0070563) |
| 2.7 | 16.5 | GO:0006933 | negative regulation of cell adhesion involved in substrate-bound cell migration(GO:0006933) |
| 2.4 | 7.3 | GO:0060018 | astrocyte fate commitment(GO:0060018) retinal rod cell differentiation(GO:0060221) |
| 2.4 | 7.1 | GO:0014016 | neuroblast differentiation(GO:0014016) |
| 2.4 | 7.1 | GO:0006428 | isoleucyl-tRNA aminoacylation(GO:0006428) |
| 2.4 | 14.1 | GO:0055129 | proline biosynthetic process(GO:0006561) L-proline biosynthetic process(GO:0055129) |
| 2.3 | 32.4 | GO:1904778 | regulation of protein localization to cell cortex(GO:1904776) positive regulation of protein localization to cell cortex(GO:1904778) |
| 2.3 | 15.8 | GO:2000795 | trigeminal sensory nucleus development(GO:0021730) principal sensory nucleus of trigeminal nerve development(GO:0021740) negative regulation of epithelial cell proliferation involved in lung morphogenesis(GO:2000795) |
| 2.2 | 15.2 | GO:0006537 | glutamate biosynthetic process(GO:0006537) gamma-aminobutyric acid biosynthetic process(GO:0009449) |
| 2.1 | 6.2 | GO:1905205 | positive regulation of connective tissue replacement(GO:1905205) |
| 2.0 | 5.9 | GO:0007518 | myoblast fate determination(GO:0007518) |
| 2.0 | 9.8 | GO:0060718 | chorionic trophoblast cell differentiation(GO:0060718) |
| 1.4 | 11.6 | GO:0032790 | ribosome disassembly(GO:0032790) |
| 1.4 | 8.6 | GO:0045162 | clustering of voltage-gated sodium channels(GO:0045162) |
| 1.4 | 13.8 | GO:0051096 | positive regulation of helicase activity(GO:0051096) |
| 1.4 | 5.5 | GO:1903644 | regulation of chaperone-mediated protein folding(GO:1903644) |
| 1.4 | 5.5 | GO:1900042 | positive regulation of interleukin-2 secretion(GO:1900042) |
| 1.3 | 5.1 | GO:1903660 | negative regulation of complement-dependent cytotoxicity(GO:1903660) |
| 1.2 | 3.7 | GO:0060584 | regulation of prostaglandin-endoperoxide synthase activity(GO:0060584) positive regulation of prostaglandin-endoperoxide synthase activity(GO:0060585) |
| 1.2 | 3.5 | GO:0061357 | positive regulation of Wnt protein secretion(GO:0061357) |
| 1.1 | 3.3 | GO:1903371 | regulation of endoplasmic reticulum tubular network organization(GO:1903371) |
| 1.1 | 4.3 | GO:1903224 | regulation of endodermal cell differentiation(GO:1903224) |
| 1.1 | 5.3 | GO:0070966 | nuclear-transcribed mRNA catabolic process, no-go decay(GO:0070966) |
| 1.0 | 2.0 | GO:0007538 | primary sex determination(GO:0007538) |
| 1.0 | 3.1 | GO:0048382 | mesendoderm development(GO:0048382) |
| 1.0 | 2.9 | GO:2000017 | positive regulation of determination of dorsal identity(GO:2000017) |
| 0.9 | 2.8 | GO:0006788 | heme oxidation(GO:0006788) |
| 0.9 | 10.5 | GO:0051665 | membrane raft localization(GO:0051665) |
| 0.9 | 2.6 | GO:0006624 | vacuolar protein processing(GO:0006624) |
| 0.8 | 3.4 | GO:0050717 | positive regulation of interleukin-1 alpha secretion(GO:0050717) |
| 0.8 | 5.9 | GO:0042426 | choline catabolic process(GO:0042426) |
| 0.8 | 8.3 | GO:0018202 | peptidyl-histidine modification(GO:0018202) |
| 0.8 | 9.8 | GO:0090091 | positive regulation of extracellular matrix disassembly(GO:0090091) |
| 0.7 | 4.5 | GO:0002175 | protein localization to paranode region of axon(GO:0002175) |
| 0.7 | 6.3 | GO:0045602 | negative regulation of endothelial cell differentiation(GO:0045602) |
| 0.7 | 11.8 | GO:0030903 | notochord development(GO:0030903) |
| 0.6 | 3.1 | GO:0070131 | positive regulation of mitochondrial translation(GO:0070131) |
| 0.5 | 6.2 | GO:0009642 | response to light intensity(GO:0009642) |
| 0.5 | 2.6 | GO:0061767 | negative regulation of lung blood pressure(GO:0061767) |
| 0.5 | 3.6 | GO:0006880 | intracellular sequestering of iron ion(GO:0006880) sequestering of iron ion(GO:0097577) |
| 0.5 | 14.0 | GO:0031639 | plasminogen activation(GO:0031639) |
| 0.5 | 1.0 | GO:0021940 | positive regulation of cerebellar granule cell precursor proliferation(GO:0021940) |
| 0.5 | 1.5 | GO:0098923 | retrograde trans-synaptic signaling by soluble gas(GO:0098923) trans-synaptic signaling by soluble gas(GO:0099543) trans-synaptic signaling by trans-synaptic complex(GO:0099545) |
| 0.5 | 4.8 | GO:0060020 | Bergmann glial cell differentiation(GO:0060020) |
| 0.5 | 1.4 | GO:1900114 | positive regulation of histone H3-K9 trimethylation(GO:1900114) |
| 0.4 | 1.7 | GO:0007185 | transmembrane receptor protein tyrosine phosphatase signaling pathway(GO:0007185) |
| 0.4 | 2.5 | GO:1900748 | positive regulation of vascular endothelial growth factor signaling pathway(GO:1900748) |
| 0.4 | 13.9 | GO:0051491 | positive regulation of filopodium assembly(GO:0051491) |
| 0.4 | 3.6 | GO:0048023 | positive regulation of melanin biosynthetic process(GO:0048023) positive regulation of secondary metabolite biosynthetic process(GO:1900378) |
| 0.4 | 3.5 | GO:0031444 | slow-twitch skeletal muscle fiber contraction(GO:0031444) |
| 0.4 | 6.9 | GO:0043651 | linoleic acid metabolic process(GO:0043651) |
| 0.3 | 2.7 | GO:0006689 | ganglioside catabolic process(GO:0006689) |
| 0.3 | 1.7 | GO:0050666 | cellular response to phosphate starvation(GO:0016036) regulation of sulfur amino acid metabolic process(GO:0031335) positive regulation of sulfur amino acid metabolic process(GO:0031337) regulation of homocysteine metabolic process(GO:0050666) positive regulation of homocysteine metabolic process(GO:0050668) |
| 0.3 | 3.5 | GO:0006621 | protein retention in ER lumen(GO:0006621) |
| 0.3 | 8.4 | GO:0021846 | cell proliferation in forebrain(GO:0021846) |
| 0.3 | 1.3 | GO:1902774 | late endosome to lysosome transport(GO:1902774) |
| 0.3 | 4.0 | GO:1904869 | regulation of protein localization to Cajal body(GO:1904869) positive regulation of protein localization to Cajal body(GO:1904871) |
| 0.3 | 7.0 | GO:0070262 | peptidyl-serine dephosphorylation(GO:0070262) |
| 0.3 | 3.4 | GO:0018206 | peptidyl-methionine modification(GO:0018206) |
| 0.3 | 1.1 | GO:0006668 | sphinganine-1-phosphate metabolic process(GO:0006668) |
| 0.3 | 5.2 | GO:0002021 | response to dietary excess(GO:0002021) |
| 0.3 | 2.7 | GO:0021815 | modulation of microtubule cytoskeleton involved in cerebral cortex radial glia guided migration(GO:0021815) |
| 0.3 | 7.6 | GO:0090190 | positive regulation of branching involved in ureteric bud morphogenesis(GO:0090190) |
| 0.3 | 1.3 | GO:0035900 | response to isolation stress(GO:0035900) |
| 0.3 | 2.1 | GO:0010032 | meiotic chromosome condensation(GO:0010032) |
| 0.3 | 2.5 | GO:0045329 | carnitine biosynthetic process(GO:0045329) |
| 0.2 | 2.3 | GO:0010265 | SCF complex assembly(GO:0010265) |
| 0.2 | 3.0 | GO:0030321 | transepithelial chloride transport(GO:0030321) |
| 0.2 | 8.2 | GO:0071526 | semaphorin-plexin signaling pathway(GO:0071526) |
| 0.2 | 2.8 | GO:0042983 | amyloid precursor protein biosynthetic process(GO:0042983) regulation of amyloid precursor protein biosynthetic process(GO:0042984) |
| 0.2 | 3.7 | GO:0090129 | positive regulation of synapse maturation(GO:0090129) |
| 0.2 | 10.3 | GO:0000413 | protein peptidyl-prolyl isomerization(GO:0000413) |
| 0.2 | 1.1 | GO:0080009 | mRNA methylation(GO:0080009) |
| 0.2 | 1.4 | GO:0045080 | positive regulation of chemokine biosynthetic process(GO:0045080) |
| 0.2 | 7.9 | GO:0016486 | peptide hormone processing(GO:0016486) |
| 0.2 | 0.9 | GO:0072719 | cellular response to cisplatin(GO:0072719) |
| 0.2 | 1.5 | GO:0035873 | lactate transport(GO:0015727) lactate transmembrane transport(GO:0035873) |
| 0.2 | 2.8 | GO:0050849 | negative regulation of calcium-mediated signaling(GO:0050849) |
| 0.1 | 3.3 | GO:0033622 | integrin activation(GO:0033622) |
| 0.1 | 5.2 | GO:0016577 | histone demethylation(GO:0016577) |
| 0.1 | 4.9 | GO:0006622 | protein targeting to lysosome(GO:0006622) |
| 0.1 | 5.2 | GO:0043001 | Golgi to plasma membrane protein transport(GO:0043001) |
| 0.1 | 3.0 | GO:0007191 | adenylate cyclase-activating dopamine receptor signaling pathway(GO:0007191) |
| 0.1 | 2.0 | GO:0017187 | peptidyl-glutamic acid carboxylation(GO:0017187) protein carboxylation(GO:0018214) |
| 0.1 | 0.5 | GO:0032906 | transforming growth factor beta2 production(GO:0032906) regulation of transforming growth factor beta2 production(GO:0032909) |
| 0.1 | 5.3 | GO:0006656 | phosphatidylcholine biosynthetic process(GO:0006656) |
| 0.1 | 6.7 | GO:0030212 | hyaluronan metabolic process(GO:0030212) |
| 0.1 | 2.5 | GO:0006833 | water transport(GO:0006833) |
| 0.1 | 1.3 | GO:0046520 | diol biosynthetic process(GO:0034312) sphingosine biosynthetic process(GO:0046512) sphingoid biosynthetic process(GO:0046520) |
| 0.1 | 2.9 | GO:0009954 | proximal/distal pattern formation(GO:0009954) |
| 0.1 | 5.6 | GO:0015701 | bicarbonate transport(GO:0015701) |
| 0.1 | 1.5 | GO:0048490 | anterograde synaptic vesicle transport(GO:0048490) synaptic vesicle cytoskeletal transport(GO:0099514) synaptic vesicle transport along microtubule(GO:0099517) |
| 0.1 | 2.2 | GO:0007250 | activation of NF-kappaB-inducing kinase activity(GO:0007250) |
| 0.1 | 1.2 | GO:0036158 | outer dynein arm assembly(GO:0036158) |
| 0.1 | 0.8 | GO:0001574 | ganglioside biosynthetic process(GO:0001574) |
| 0.1 | 5.3 | GO:0043277 | apoptotic cell clearance(GO:0043277) |
| 0.1 | 2.5 | GO:0006706 | steroid catabolic process(GO:0006706) |
| 0.1 | 2.2 | GO:0030208 | dermatan sulfate biosynthetic process(GO:0030208) |
| 0.1 | 1.3 | GO:0030149 | sphingolipid catabolic process(GO:0030149) |
| 0.1 | 1.9 | GO:0048935 | peripheral nervous system neuron differentiation(GO:0048934) peripheral nervous system neuron development(GO:0048935) |
| 0.1 | 0.2 | GO:0061743 | motor learning(GO:0061743) |
| 0.1 | 5.6 | GO:0001895 | retina homeostasis(GO:0001895) |
| 0.1 | 0.2 | GO:0060577 | subthalamic nucleus development(GO:0021763) prolactin secreting cell differentiation(GO:0060127) left lung development(GO:0060459) left lung morphogenesis(GO:0060460) pulmonary vein morphogenesis(GO:0060577) superior vena cava morphogenesis(GO:0060578) |
| 0.1 | 4.5 | GO:2000649 | regulation of sodium ion transmembrane transporter activity(GO:2000649) |
| 0.1 | 1.2 | GO:1990001 | inhibition of cysteine-type endopeptidase activity involved in apoptotic process(GO:1990001) |
| 0.1 | 9.9 | GO:0007156 | homophilic cell adhesion via plasma membrane adhesion molecules(GO:0007156) |
| 0.1 | 3.4 | GO:0042733 | embryonic digit morphogenesis(GO:0042733) |
| 0.1 | 4.7 | GO:0030574 | collagen catabolic process(GO:0030574) |
| 0.1 | 0.8 | GO:0046415 | urate metabolic process(GO:0046415) |
| 0.1 | 3.5 | GO:0006636 | unsaturated fatty acid biosynthetic process(GO:0006636) |
| 0.1 | 0.7 | GO:0046600 | negative regulation of centriole replication(GO:0046600) |
| 0.1 | 0.3 | GO:0003415 | chondrocyte hypertrophy(GO:0003415) |
| 0.1 | 2.3 | GO:0050690 | regulation of defense response to virus by virus(GO:0050690) |
| 0.1 | 2.7 | GO:0050911 | detection of chemical stimulus involved in sensory perception of smell(GO:0050911) |
| 0.1 | 0.4 | GO:1903265 | positive regulation of tumor necrosis factor-mediated signaling pathway(GO:1903265) |
| 0.1 | 5.1 | GO:0006446 | regulation of translational initiation(GO:0006446) |
| 0.1 | 0.6 | GO:0034638 | phosphatidylcholine catabolic process(GO:0034638) |
| 0.1 | 8.1 | GO:0031032 | actomyosin structure organization(GO:0031032) |
| 0.0 | 2.9 | GO:0043039 | amino acid activation(GO:0043038) tRNA aminoacylation(GO:0043039) |
| 0.0 | 0.4 | GO:0007217 | tachykinin receptor signaling pathway(GO:0007217) |
| 0.0 | 0.4 | GO:0044241 | lipid digestion(GO:0044241) |
| 0.0 | 1.9 | GO:0014047 | glutamate secretion(GO:0014047) |
| 0.0 | 1.2 | GO:0061049 | physiological muscle hypertrophy(GO:0003298) physiological cardiac muscle hypertrophy(GO:0003301) cell growth involved in cardiac muscle cell development(GO:0061049) |
| 0.0 | 0.7 | GO:0006488 | dolichol-linked oligosaccharide biosynthetic process(GO:0006488) |
| 0.0 | 7.0 | GO:0006261 | DNA-dependent DNA replication(GO:0006261) |
| 0.0 | 10.2 | GO:0043523 | regulation of neuron apoptotic process(GO:0043523) |
| 0.0 | 0.1 | GO:0001951 | intestinal D-glucose absorption(GO:0001951) |
| 0.0 | 1.5 | GO:0018146 | keratan sulfate biosynthetic process(GO:0018146) |
| 0.0 | 3.1 | GO:0009301 | snRNA transcription(GO:0009301) snRNA transcription from RNA polymerase II promoter(GO:0042795) |
| 0.0 | 0.3 | GO:0042364 | water-soluble vitamin biosynthetic process(GO:0042364) |
| 0.0 | 0.8 | GO:0048268 | clathrin coat assembly(GO:0048268) |
| 0.0 | 0.9 | GO:0005980 | glycogen catabolic process(GO:0005980) |
| 0.0 | 15.6 | GO:0006936 | muscle contraction(GO:0006936) |
| 0.0 | 2.3 | GO:0070126 | mitochondrial translational elongation(GO:0070125) mitochondrial translational termination(GO:0070126) |
| 0.0 | 4.5 | GO:0007266 | Rho protein signal transduction(GO:0007266) |
| 0.0 | 0.9 | GO:0061001 | regulation of dendritic spine morphogenesis(GO:0061001) |
| 0.0 | 0.2 | GO:0046498 | S-adenosylmethionine cycle(GO:0033353) S-adenosylhomocysteine metabolic process(GO:0046498) |
| 0.0 | 0.2 | GO:0010133 | proline catabolic process to glutamate(GO:0010133) |
| 0.0 | 0.8 | GO:0006308 | DNA catabolic process(GO:0006308) |
| 0.0 | 2.8 | GO:0007030 | Golgi organization(GO:0007030) |
| 0.0 | 2.9 | GO:0006334 | nucleosome assembly(GO:0006334) |
| 0.0 | 0.4 | GO:0033141 | positive regulation of peptidyl-serine phosphorylation of STAT protein(GO:0033141) |
| 0.0 | 11.6 | GO:0051301 | cell division(GO:0051301) |
| 0.0 | 0.8 | GO:0010501 | RNA secondary structure unwinding(GO:0010501) |
| 0.0 | 2.6 | GO:0015992 | proton transport(GO:0015992) |
| 0.0 | 0.4 | GO:0043161 | proteasomal protein catabolic process(GO:0010498) proteasome-mediated ubiquitin-dependent protein catabolic process(GO:0043161) |
| 0.0 | 1.2 | GO:0090002 | establishment of protein localization to plasma membrane(GO:0090002) |
| 0.0 | 0.6 | GO:0010466 | negative regulation of peptidase activity(GO:0010466) |
| 0.0 | 0.3 | GO:0019373 | epoxygenase P450 pathway(GO:0019373) |
| 0.0 | 0.2 | GO:1903861 | positive regulation of dendrite extension(GO:1903861) |
| 0.0 | 2.7 | GO:0007050 | cell cycle arrest(GO:0007050) |
| 0.0 | 0.0 | GO:0097210 | response to gonadotropin-releasing hormone(GO:0097210) cellular response to gonadotropin-releasing hormone(GO:0097211) |
| 0.0 | 0.8 | GO:0006968 | cellular defense response(GO:0006968) |
Gene overrepresentation in cellular_component category:
| Log-likelihood per target | Total log-likelihood | Term | Description |
|---|---|---|---|
| 10.1 | 40.3 | GO:0031673 | H zone(GO:0031673) |
| 4.4 | 21.9 | GO:0005945 | 6-phosphofructokinase complex(GO:0005945) |
| 2.4 | 33.2 | GO:0008091 | spectrin(GO:0008091) |
| 1.6 | 23.5 | GO:0030478 | actin cap(GO:0030478) |
| 1.4 | 4.3 | GO:0005588 | collagen type V trimer(GO:0005588) |
| 1.3 | 15.8 | GO:0044300 | cerebellar mossy fiber(GO:0044300) |
| 1.3 | 3.9 | GO:0032302 | MutSbeta complex(GO:0032302) |
| 1.3 | 5.1 | GO:0034751 | aryl hydrocarbon receptor complex(GO:0034751) |
| 0.8 | 3.2 | GO:0005889 | hydrogen:potassium-exchanging ATPase complex(GO:0005889) |
| 0.7 | 2.2 | GO:0005874 | microtubule(GO:0005874) |
| 0.7 | 6.2 | GO:0005955 | calcineurin complex(GO:0005955) |
| 0.7 | 13.9 | GO:0044295 | axonal growth cone(GO:0044295) |
| 0.6 | 7.1 | GO:0005641 | nuclear envelope lumen(GO:0005641) |
| 0.6 | 64.3 | GO:0043195 | terminal bouton(GO:0043195) |
| 0.6 | 2.5 | GO:0045160 | myosin I complex(GO:0045160) |
| 0.5 | 8.6 | GO:0043194 | axon initial segment(GO:0043194) |
| 0.5 | 5.3 | GO:0070937 | CRD-mediated mRNA stability complex(GO:0070937) |
| 0.5 | 2.1 | GO:0000799 | nuclear condensin complex(GO:0000799) |
| 0.5 | 3.6 | GO:0042584 | chromaffin granule membrane(GO:0042584) dendritic spine neck(GO:0044326) |
| 0.5 | 4.9 | GO:0045180 | basal cortex(GO:0045180) |
| 0.4 | 9.3 | GO:0017101 | aminoacyl-tRNA synthetase multienzyme complex(GO:0017101) |
| 0.4 | 2.8 | GO:0000137 | Golgi cis cisterna(GO:0000137) |
| 0.4 | 3.6 | GO:0033162 | melanosome membrane(GO:0033162) chitosome(GO:0045009) |
| 0.4 | 2.6 | GO:0036021 | endolysosome lumen(GO:0036021) |
| 0.4 | 1.1 | GO:0036396 | MIS complex(GO:0036396) mRNA editing complex(GO:0045293) |
| 0.3 | 2.6 | GO:0071144 | SMAD2-SMAD3 protein complex(GO:0071144) |
| 0.3 | 3.7 | GO:0033093 | Weibel-Palade body(GO:0033093) |
| 0.3 | 2.8 | GO:0030123 | AP-3 adaptor complex(GO:0030123) |
| 0.3 | 4.5 | GO:0033270 | paranode region of axon(GO:0033270) |
| 0.3 | 2.7 | GO:0044327 | dendritic spine head(GO:0044327) |
| 0.3 | 3.4 | GO:0097433 | dense body(GO:0097433) |
| 0.2 | 9.3 | GO:0031258 | lamellipodium membrane(GO:0031258) |
| 0.2 | 3.1 | GO:1990712 | HFE-transferrin receptor complex(GO:1990712) |
| 0.2 | 1.6 | GO:0000275 | mitochondrial proton-transporting ATP synthase complex, catalytic core F(1)(GO:0000275) |
| 0.2 | 5.1 | GO:0016281 | eukaryotic translation initiation factor 4F complex(GO:0016281) |
| 0.2 | 4.0 | GO:0005832 | chaperonin-containing T-complex(GO:0005832) |
| 0.2 | 7.0 | GO:0000159 | protein phosphatase type 2A complex(GO:0000159) |
| 0.2 | 3.4 | GO:0032059 | bleb(GO:0032059) |
| 0.2 | 9.9 | GO:0042645 | nucleoid(GO:0009295) mitochondrial nucleoid(GO:0042645) |
| 0.2 | 9.9 | GO:0005834 | heterotrimeric G-protein complex(GO:0005834) |
| 0.2 | 1.2 | GO:0036157 | outer dynein arm(GO:0036157) |
| 0.1 | 3.5 | GO:0005861 | troponin complex(GO:0005861) |
| 0.1 | 1.2 | GO:0032133 | chromosome passenger complex(GO:0032133) |
| 0.1 | 6.2 | GO:0001917 | photoreceptor inner segment(GO:0001917) |
| 0.1 | 3.5 | GO:0032839 | dendrite cytoplasm(GO:0032839) |
| 0.1 | 10.5 | GO:0097610 | cleavage furrow(GO:0032154) cell surface furrow(GO:0097610) |
| 0.1 | 13.1 | GO:0005882 | intermediate filament(GO:0005882) |
| 0.1 | 1.5 | GO:0017146 | NMDA selective glutamate receptor complex(GO:0017146) |
| 0.1 | 0.9 | GO:0005964 | phosphorylase kinase complex(GO:0005964) |
| 0.1 | 2.1 | GO:0030057 | desmosome(GO:0030057) |
| 0.1 | 0.7 | GO:0097197 | tetraspanin-enriched microdomain(GO:0097197) |
| 0.1 | 4.8 | GO:1990904 | intracellular ribonucleoprotein complex(GO:0030529) ribonucleoprotein complex(GO:1990904) |
| 0.1 | 7.3 | GO:0044291 | cell-cell contact zone(GO:0044291) |
| 0.1 | 2.3 | GO:0005763 | organellar small ribosomal subunit(GO:0000314) mitochondrial small ribosomal subunit(GO:0005763) |
| 0.1 | 2.2 | GO:0016514 | SWI/SNF complex(GO:0016514) |
| 0.1 | 7.6 | GO:0042641 | actomyosin(GO:0042641) |
| 0.1 | 9.1 | GO:0042470 | melanosome(GO:0042470) pigment granule(GO:0048770) |
| 0.1 | 4.8 | GO:0035580 | specific granule lumen(GO:0035580) |
| 0.1 | 10.8 | GO:0001726 | ruffle(GO:0001726) |
| 0.1 | 3.4 | GO:0022627 | cytosolic small ribosomal subunit(GO:0022627) |
| 0.1 | 3.1 | GO:0016591 | DNA-directed RNA polymerase II, holoenzyme(GO:0016591) |
| 0.0 | 0.6 | GO:0097342 | ripoptosome(GO:0097342) |
| 0.0 | 2.3 | GO:0019005 | SCF ubiquitin ligase complex(GO:0019005) |
| 0.0 | 0.7 | GO:0000242 | pericentriolar material(GO:0000242) |
| 0.0 | 2.8 | GO:0034707 | chloride channel complex(GO:0034707) |
| 0.0 | 7.4 | GO:0044798 | nuclear transcription factor complex(GO:0044798) |
| 0.0 | 15.2 | GO:0005759 | mitochondrial matrix(GO:0005759) |
| 0.0 | 2.9 | GO:1902554 | serine/threonine protein kinase complex(GO:1902554) |
| 0.0 | 10.1 | GO:0043025 | neuronal cell body(GO:0043025) |
| 0.0 | 5.1 | GO:0000775 | chromosome, centromeric region(GO:0000775) |
| 0.0 | 2.8 | GO:0035579 | specific granule membrane(GO:0035579) |
| 0.0 | 1.1 | GO:0030131 | clathrin adaptor complex(GO:0030131) |
| 0.0 | 0.4 | GO:0044298 | neuronal cell body membrane(GO:0032809) cell body membrane(GO:0044298) |
| 0.0 | 8.3 | GO:0016324 | apical plasma membrane(GO:0016324) |
| 0.0 | 1.9 | GO:0031903 | peroxisomal membrane(GO:0005778) microbody membrane(GO:0031903) |
| 0.0 | 3.4 | GO:0098793 | presynapse(GO:0098793) |
| 0.0 | 5.8 | GO:0005911 | cell-cell junction(GO:0005911) |
| 0.0 | 0.5 | GO:0035861 | site of double-strand break(GO:0035861) |
| 0.0 | 0.4 | GO:0097228 | sperm principal piece(GO:0097228) |
| 0.0 | 0.9 | GO:0044309 | dendritic spine(GO:0043197) neuron spine(GO:0044309) |
| 0.0 | 2.2 | GO:0005741 | mitochondrial outer membrane(GO:0005741) |
| 0.0 | 5.1 | GO:0005743 | mitochondrial inner membrane(GO:0005743) |
| 0.0 | 1.2 | GO:0032580 | Golgi cisterna membrane(GO:0032580) |
| 0.0 | 2.4 | GO:0005667 | transcription factor complex(GO:0005667) |
Gene overrepresentation in molecular_function category:
| Log-likelihood per target | Total log-likelihood | Term | Description |
|---|---|---|---|
| 4.7 | 14.0 | GO:0004618 | phosphoglycerate kinase activity(GO:0004618) |
| 3.7 | 21.9 | GO:0003872 | 6-phosphofructokinase activity(GO:0003872) |
| 3.5 | 14.1 | GO:0004735 | pyrroline-5-carboxylate reductase activity(GO:0004735) |
| 2.8 | 27.8 | GO:0042731 | PH domain binding(GO:0042731) |
| 2.4 | 7.1 | GO:0004822 | isoleucine-tRNA ligase activity(GO:0004822) |
| 2.2 | 15.2 | GO:0015501 | glutamate:sodium symporter activity(GO:0015501) |
| 1.8 | 5.5 | GO:0010698 | acetyltransferase activator activity(GO:0010698) |
| 1.8 | 7.1 | GO:0003990 | acetylcholinesterase activity(GO:0003990) |
| 1.7 | 5.1 | GO:0002134 | pyrimidine nucleoside binding(GO:0001884) UTP binding(GO:0002134) sulfonylurea receptor binding(GO:0017098) pyrimidine ribonucleoside binding(GO:0032551) |
| 1.6 | 42.9 | GO:0051010 | microtubule plus-end binding(GO:0051010) |
| 1.4 | 64.3 | GO:0003785 | actin monomer binding(GO:0003785) |
| 1.4 | 6.9 | GO:0016717 | oxidoreductase activity, acting on paired donors, with oxidation of a pair of donors resulting in the reduction of molecular oxygen to two molecules of water(GO:0016717) |
| 1.3 | 3.9 | GO:0032181 | heteroduplex DNA loop binding(GO:0000404) double-strand/single-strand DNA junction binding(GO:0000406) dinucleotide repeat insertion binding(GO:0032181) |
| 1.2 | 8.3 | GO:0004673 | protein histidine kinase activity(GO:0004673) |
| 1.0 | 25.4 | GO:0005092 | GDP-dissociation inhibitor activity(GO:0005092) |
| 1.0 | 27.0 | GO:0005523 | tropomyosin binding(GO:0005523) |
| 1.0 | 4.0 | GO:0071987 | WD40-repeat domain binding(GO:0071987) |
| 1.0 | 4.9 | GO:0038062 | protein tyrosine kinase collagen receptor activity(GO:0038062) |
| 0.9 | 2.8 | GO:0004392 | heme oxygenase (decyclizing) activity(GO:0004392) |
| 0.9 | 6.2 | GO:0052650 | NADP-retinol dehydrogenase activity(GO:0052650) |
| 0.8 | 3.4 | GO:0055077 | gap junction hemi-channel activity(GO:0055077) |
| 0.8 | 7.3 | GO:0097157 | pre-mRNA intronic binding(GO:0097157) |
| 0.8 | 4.8 | GO:1990254 | keratin filament binding(GO:1990254) |
| 0.7 | 3.7 | GO:0031708 | endothelin B receptor binding(GO:0031708) |
| 0.7 | 2.9 | GO:0016361 | activin receptor activity, type I(GO:0016361) |
| 0.7 | 8.6 | GO:0086080 | protein binding involved in heterotypic cell-cell adhesion(GO:0086080) |
| 0.7 | 2.0 | GO:0047757 | chondroitin-glucuronate 5-epimerase activity(GO:0047757) |
| 0.6 | 8.2 | GO:0043024 | ribosomal small subunit binding(GO:0043024) |
| 0.6 | 2.5 | GO:0008336 | gamma-butyrobetaine dioxygenase activity(GO:0008336) |
| 0.6 | 6.2 | GO:0033192 | calmodulin-dependent protein phosphatase activity(GO:0033192) |
| 0.6 | 6.9 | GO:0031821 | G-protein coupled serotonin receptor binding(GO:0031821) |
| 0.5 | 4.9 | GO:0008158 | hedgehog receptor activity(GO:0008158) |
| 0.5 | 2.6 | GO:0031962 | mineralocorticoid receptor binding(GO:0031962) |
| 0.4 | 1.3 | GO:0051538 | 3 iron, 4 sulfur cluster binding(GO:0051538) |
| 0.4 | 3.2 | GO:0004563 | beta-N-acetylhexosaminidase activity(GO:0004563) |
| 0.4 | 3.5 | GO:0046923 | ER retention sequence binding(GO:0046923) |
| 0.4 | 2.2 | GO:0045569 | TRAIL binding(GO:0045569) |
| 0.4 | 1.1 | GO:0016422 | mRNA (2'-O-methyladenosine-N6-)-methyltransferase activity(GO:0016422) |
| 0.3 | 1.3 | GO:0017040 | ceramidase activity(GO:0017040) |
| 0.3 | 3.5 | GO:0031852 | mu-type opioid receptor binding(GO:0031852) |
| 0.3 | 1.3 | GO:0098821 | BMP receptor activity(GO:0098821) |
| 0.3 | 5.6 | GO:0008510 | sodium:bicarbonate symporter activity(GO:0008510) |
| 0.3 | 10.0 | GO:0070182 | DNA polymerase binding(GO:0070182) |
| 0.3 | 14.2 | GO:0005547 | phosphatidylinositol-3,4,5-trisphosphate binding(GO:0005547) |
| 0.3 | 9.8 | GO:0005520 | insulin-like growth factor binding(GO:0005520) |
| 0.3 | 5.3 | GO:0016864 | protein disulfide isomerase activity(GO:0003756) intramolecular oxidoreductase activity, transposing S-S bonds(GO:0016864) |
| 0.2 | 5.9 | GO:0004029 | aldehyde dehydrogenase (NAD) activity(GO:0004029) |
| 0.2 | 5.1 | GO:0000339 | RNA cap binding(GO:0000339) |
| 0.2 | 3.7 | GO:0097109 | neuroligin family protein binding(GO:0097109) |
| 0.2 | 5.5 | GO:0030506 | ankyrin binding(GO:0030506) |
| 0.2 | 3.8 | GO:0015250 | water channel activity(GO:0015250) |
| 0.2 | 0.7 | GO:0004040 | amidase activity(GO:0004040) |
| 0.2 | 11.8 | GO:0005504 | fatty acid binding(GO:0005504) |
| 0.2 | 10.3 | GO:0003755 | peptidyl-prolyl cis-trans isomerase activity(GO:0003755) |
| 0.2 | 3.0 | GO:0015106 | bicarbonate transmembrane transporter activity(GO:0015106) |
| 0.2 | 0.7 | GO:0097603 | temperature-gated ion channel activity(GO:0097603) |
| 0.2 | 7.1 | GO:0003700 | nucleic acid binding transcription factor activity(GO:0001071) transcription factor activity, sequence-specific DNA binding(GO:0003700) |
| 0.2 | 2.5 | GO:0017160 | Ral GTPase binding(GO:0017160) |
| 0.2 | 1.5 | GO:0015129 | lactate transmembrane transporter activity(GO:0015129) |
| 0.2 | 3.0 | GO:0031683 | G-protein beta/gamma-subunit complex binding(GO:0031683) |
| 0.2 | 5.2 | GO:0032452 | histone demethylase activity(GO:0032452) |
| 0.1 | 2.2 | GO:0035613 | RNA stem-loop binding(GO:0035613) |
| 0.1 | 1.5 | GO:0003831 | beta-N-acetylglucosaminylglycopeptide beta-1,4-galactosyltransferase activity(GO:0003831) |
| 0.1 | 5.7 | GO:0046966 | thyroid hormone receptor binding(GO:0046966) |
| 0.1 | 9.8 | GO:0019003 | GDP binding(GO:0019003) |
| 0.1 | 0.4 | GO:0036487 | nitric-oxide synthase inhibitor activity(GO:0036487) |
| 0.1 | 3.3 | GO:0017056 | structural constituent of nuclear pore(GO:0017056) |
| 0.1 | 18.4 | GO:0003705 | transcription factor activity, RNA polymerase II distal enhancer sequence-specific binding(GO:0003705) |
| 0.1 | 1.0 | GO:0030249 | guanylate cyclase regulator activity(GO:0030249) |
| 0.1 | 2.2 | GO:0005057 | receptor signaling protein activity(GO:0005057) |
| 0.1 | 6.3 | GO:0070888 | E-box binding(GO:0070888) |
| 0.1 | 2.5 | GO:0008484 | sulfuric ester hydrolase activity(GO:0008484) |
| 0.1 | 0.9 | GO:0004689 | phosphorylase kinase activity(GO:0004689) |
| 0.1 | 1.5 | GO:0042043 | neurexin family protein binding(GO:0042043) |
| 0.1 | 11.5 | GO:0005262 | calcium channel activity(GO:0005262) |
| 0.1 | 3.6 | GO:0004198 | calcium-dependent cysteine-type endopeptidase activity(GO:0004198) |
| 0.1 | 4.5 | GO:0017080 | sodium channel regulator activity(GO:0017080) |
| 0.1 | 0.8 | GO:0016888 | endodeoxyribonuclease activity, producing 5'-phosphomonoesters(GO:0016888) |
| 0.1 | 0.4 | GO:0004995 | tachykinin receptor activity(GO:0004995) |
| 0.1 | 0.8 | GO:0015143 | urate transmembrane transporter activity(GO:0015143) salt transmembrane transporter activity(GO:1901702) |
| 0.1 | 8.1 | GO:0017048 | Rho GTPase binding(GO:0017048) |
| 0.1 | 10.7 | GO:0051082 | unfolded protein binding(GO:0051082) |
| 0.1 | 0.6 | GO:0047499 | calcium-independent phospholipase A2 activity(GO:0047499) |
| 0.1 | 7.0 | GO:0019888 | protein phosphatase regulator activity(GO:0019888) |
| 0.1 | 0.8 | GO:0003836 | beta-galactoside (CMP) alpha-2,3-sialyltransferase activity(GO:0003836) |
| 0.1 | 0.1 | GO:0005171 | hepatocyte growth factor receptor binding(GO:0005171) |
| 0.1 | 18.5 | GO:0005525 | GTP binding(GO:0005525) |
| 0.1 | 3.4 | GO:0003743 | translation initiation factor activity(GO:0003743) |
| 0.1 | 6.8 | GO:0003697 | single-stranded DNA binding(GO:0003697) |
| 0.1 | 9.0 | GO:0005200 | structural constituent of cytoskeleton(GO:0005200) |
| 0.1 | 0.8 | GO:0035612 | AP-2 adaptor complex binding(GO:0035612) |
| 0.1 | 1.3 | GO:0016832 | aldehyde-lyase activity(GO:0016832) |
| 0.1 | 2.7 | GO:0004984 | olfactory receptor activity(GO:0004984) |
| 0.1 | 3.6 | GO:0005507 | copper ion binding(GO:0005507) |
| 0.1 | 3.4 | GO:0004177 | aminopeptidase activity(GO:0004177) |
| 0.0 | 0.3 | GO:0032451 | demethylase activity(GO:0032451) |
| 0.0 | 1.7 | GO:0005184 | neuropeptide hormone activity(GO:0005184) |
| 0.0 | 1.4 | GO:1990841 | promoter-specific chromatin binding(GO:1990841) |
| 0.0 | 4.6 | GO:0004222 | metalloendopeptidase activity(GO:0004222) |
| 0.0 | 2.1 | GO:0003682 | chromatin binding(GO:0003682) |
| 0.0 | 0.2 | GO:0004657 | proline dehydrogenase activity(GO:0004657) |
| 0.0 | 0.2 | GO:0016802 | adenosylhomocysteinase activity(GO:0004013) trialkylsulfonium hydrolase activity(GO:0016802) |
| 0.0 | 2.3 | GO:0030165 | PDZ domain binding(GO:0030165) |
| 0.0 | 0.4 | GO:0008392 | arachidonic acid monooxygenase activity(GO:0008391) arachidonic acid epoxygenase activity(GO:0008392) |
| 0.0 | 2.9 | GO:0046332 | SMAD binding(GO:0046332) |
| 0.0 | 6.0 | GO:0008017 | microtubule binding(GO:0008017) |
| 0.0 | 0.9 | GO:0046875 | ephrin receptor binding(GO:0046875) |
| 0.0 | 0.4 | GO:0005132 | type I interferon receptor binding(GO:0005132) |
| 0.0 | 2.2 | GO:0004715 | non-membrane spanning protein tyrosine kinase activity(GO:0004715) |
| 0.0 | 0.4 | GO:0097602 | cullin family protein binding(GO:0097602) |
| 0.0 | 9.0 | GO:0004842 | ubiquitin-protein transferase activity(GO:0004842) |
| 0.0 | 0.1 | GO:0005412 | glucose:sodium symporter activity(GO:0005412) |
| 0.0 | 0.8 | GO:0016709 | oxidoreductase activity, acting on paired donors, with incorporation or reduction of molecular oxygen, NAD(P)H as one donor, and incorporation of one atom of oxygen(GO:0016709) |
| 0.0 | 2.6 | GO:0052689 | carboxylic ester hydrolase activity(GO:0052689) |
| 0.0 | 12.0 | GO:0005509 | calcium ion binding(GO:0005509) |
| 0.0 | 2.2 | GO:0017137 | Rab GTPase binding(GO:0017137) |
| 0.0 | 3.2 | GO:0008022 | protein C-terminus binding(GO:0008022) |
| 0.0 | 0.8 | GO:0008186 | ATP-dependent RNA helicase activity(GO:0004004) RNA-dependent ATPase activity(GO:0008186) |
| 0.0 | 3.6 | GO:0000978 | RNA polymerase II core promoter proximal region sequence-specific DNA binding(GO:0000978) |
Gene overrepresentation in C2:CP category:
| Log-likelihood per target | Total log-likelihood | Term | Description |
|---|---|---|---|
| 1.0 | 61.3 | SIG REGULATION OF THE ACTIN CYTOSKELETON BY RHO GTPASES | Genes related to regulation of the actin cytoskeleton |
| 0.7 | 7.1 | ST PHOSPHOINOSITIDE 3 KINASE PATHWAY | PI3K Pathway |
| 0.4 | 40.0 | PID TAP63 PATHWAY | Validated transcriptional targets of TAp63 isoforms |
| 0.4 | 7.0 | PID S1P S1P4 PATHWAY | S1P4 pathway |
| 0.4 | 8.3 | PID ARF6 DOWNSTREAM PATHWAY | Arf6 downstream pathway |
| 0.3 | 2.4 | PID S1P META PATHWAY | Sphingosine 1-phosphate (S1P) pathway |
| 0.3 | 14.0 | PID HIF2PATHWAY | HIF-2-alpha transcription factor network |
| 0.2 | 2.9 | PID ALK2 PATHWAY | ALK2 signaling events |
| 0.2 | 10.5 | PID ARF6 TRAFFICKING PATHWAY | Arf6 trafficking events |
| 0.2 | 8.9 | PID THROMBIN PAR1 PATHWAY | PAR1-mediated thrombin signaling events |
| 0.2 | 11.5 | PID TGFBR PATHWAY | TGF-beta receptor signaling |
| 0.2 | 13.2 | PID KIT PATHWAY | Signaling events mediated by Stem cell factor receptor (c-Kit) |
| 0.1 | 18.9 | PID MYC ACTIV PATHWAY | Validated targets of C-MYC transcriptional activation |
| 0.1 | 6.2 | PID IL12 STAT4 PATHWAY | IL12 signaling mediated by STAT4 |
| 0.1 | 6.6 | PID ENDOTHELIN PATHWAY | Endothelins |
| 0.1 | 7.9 | PID ATR PATHWAY | ATR signaling pathway |
| 0.1 | 9.4 | PID HNF3A PATHWAY | FOXA1 transcription factor network |
| 0.1 | 6.9 | PID AURORA B PATHWAY | Aurora B signaling |
| 0.1 | 2.2 | PID TRAIL PATHWAY | TRAIL signaling pathway |
| 0.1 | 4.3 | NABA COLLAGENS | Genes encoding collagen proteins |
| 0.1 | 3.1 | PID BMP PATHWAY | BMP receptor signaling |
| 0.1 | 5.1 | PID VEGFR1 2 PATHWAY | Signaling events mediated by VEGFR1 and VEGFR2 |
| 0.1 | 4.9 | PID ILK PATHWAY | Integrin-linked kinase signaling |
| 0.1 | 1.9 | PID P38 MK2 PATHWAY | p38 signaling mediated by MAPKAP kinases |
| 0.1 | 1.7 | PID NETRIN PATHWAY | Netrin-mediated signaling events |
| 0.1 | 4.3 | PID ERA GENOMIC PATHWAY | Validated nuclear estrogen receptor alpha network |
| 0.0 | 4.5 | PID MYC REPRESS PATHWAY | Validated targets of C-MYC transcriptional repression |
| 0.0 | 1.4 | PID TOLL ENDOGENOUS PATHWAY | Endogenous TLR signaling |
| 0.0 | 3.3 | ST FAS SIGNALING PATHWAY | Fas Signaling Pathway |
| 0.0 | 0.7 | PID PI3K PLC TRK PATHWAY | Trk receptor signaling mediated by PI3K and PLC-gamma |
| 0.0 | 2.5 | PID REG GR PATHWAY | Glucocorticoid receptor regulatory network |
| 0.0 | 0.5 | SA B CELL RECEPTOR COMPLEXES | Antigen binding to B cell receptors activates protein tyrosine kinases, such as the Src family, which ultimate activate MAP kinases. |
| 0.0 | 6.4 | NABA ECM REGULATORS | Genes encoding enzymes and their regulators involved in the remodeling of the extracellular matrix |
| 0.0 | 2.1 | PID SMAD2 3NUCLEAR PATHWAY | Regulation of nuclear SMAD2/3 signaling |
| 0.0 | 0.2 | SIG CHEMOTAXIS | Genes related to chemotaxis |
Gene overrepresentation in C2:CP:REACTOME category:
| Log-likelihood per target | Total log-likelihood | Term | Description |
|---|---|---|---|
| 1.3 | 67.0 | REACTOME SIGNALING BY ROBO RECEPTOR | Genes involved in Signaling by Robo receptor |
| 0.7 | 35.9 | REACTOME GLYCOLYSIS | Genes involved in Glycolysis |
| 0.6 | 9.9 | REACTOME ADENYLATE CYCLASE INHIBITORY PATHWAY | Genes involved in Adenylate cyclase inhibitory pathway |
| 0.5 | 15.8 | REACTOME RNA POL III TRANSCRIPTION TERMINATION | Genes involved in RNA Polymerase III Transcription Termination |
| 0.4 | 8.5 | REACTOME THE NLRP3 INFLAMMASOME | Genes involved in The NLRP3 inflammasome |
| 0.4 | 7.1 | REACTOME SYNTHESIS SECRETION AND DEACYLATION OF GHRELIN | Genes involved in Synthesis, Secretion, and Deacylation of Ghrelin |
| 0.4 | 14.0 | REACTOME INTERACTION BETWEEN L1 AND ANKYRINS | Genes involved in Interaction between L1 and Ankyrins |
| 0.4 | 23.5 | REACTOME SMOOTH MUSCLE CONTRACTION | Genes involved in Smooth Muscle Contraction |
| 0.4 | 10.5 | REACTOME P38MAPK EVENTS | Genes involved in p38MAPK events |
| 0.4 | 6.9 | REACTOME ALPHA LINOLENIC ACID ALA METABOLISM | Genes involved in alpha-linolenic acid (ALA) metabolism |
| 0.3 | 9.3 | REACTOME CELL EXTRACELLULAR MATRIX INTERACTIONS | Genes involved in Cell-extracellular matrix interactions |
| 0.3 | 3.8 | REACTOME PASSIVE TRANSPORT BY AQUAPORINS | Genes involved in Passive Transport by Aquaporins |
| 0.3 | 9.3 | REACTOME CYTOSOLIC TRNA AMINOACYLATION | Genes involved in Cytosolic tRNA aminoacylation |
| 0.3 | 8.3 | REACTOME SYNTHESIS AND INTERCONVERSION OF NUCLEOTIDE DI AND TRIPHOSPHATES | Genes involved in Synthesis and interconversion of nucleotide di- and triphosphates |
| 0.2 | 9.3 | REACTOME METABOLISM OF STEROID HORMONES AND VITAMINS A AND D | Genes involved in Metabolism of steroid hormones and vitamins A and D |
| 0.2 | 2.5 | REACTOME THE ACTIVATION OF ARYLSULFATASES | Genes involved in The activation of arylsulfatases |
| 0.2 | 2.3 | REACTOME NEF MEDIATED DOWNREGULATION OF MHC CLASS I COMPLEX CELL SURFACE EXPRESSION | Genes involved in Nef mediated downregulation of MHC class I complex cell surface expression |
| 0.2 | 8.3 | REACTOME MUSCLE CONTRACTION | Genes involved in Muscle contraction |
| 0.1 | 6.2 | REACTOME DARPP 32 EVENTS | Genes involved in DARPP-32 events |
| 0.1 | 2.0 | REACTOME GAMMA CARBOXYLATION TRANSPORT AND AMINO TERMINAL CLEAVAGE OF PROTEINS | Genes involved in Gamma-carboxylation, transport, and amino-terminal cleavage of proteins |
| 0.1 | 4.0 | REACTOME FORMATION OF TUBULIN FOLDING INTERMEDIATES BY CCT TRIC | Genes involved in Formation of tubulin folding intermediates by CCT/TriC |
| 0.1 | 4.7 | REACTOME DEGRADATION OF THE EXTRACELLULAR MATRIX | Genes involved in Degradation of the extracellular matrix |
| 0.1 | 4.8 | REACTOME SIGNALING BY BMP | Genes involved in Signaling by BMP |
| 0.1 | 1.4 | REACTOME IKK COMPLEX RECRUITMENT MEDIATED BY RIP1 | Genes involved in IKK complex recruitment mediated by RIP1 |
| 0.1 | 3.7 | REACTOME SPHINGOLIPID DE NOVO BIOSYNTHESIS | Genes involved in Sphingolipid de novo biosynthesis |
| 0.1 | 2.6 | REACTOME SIGNALING BY NODAL | Genes involved in Signaling by NODAL |
| 0.1 | 2.8 | REACTOME METABOLISM OF PORPHYRINS | Genes involved in Metabolism of porphyrins |
| 0.1 | 1.0 | REACTOME GLYCOPROTEIN HORMONES | Genes involved in Glycoprotein hormones |
| 0.1 | 13.4 | REACTOME SIGNALING BY RHO GTPASES | Genes involved in Signaling by Rho GTPases |
| 0.1 | 2.7 | REACTOME SPHINGOLIPID METABOLISM | Genes involved in Sphingolipid metabolism |
| 0.1 | 1.5 | REACTOME N GLYCAN ANTENNAE ELONGATION | Genes involved in N-Glycan antennae elongation |
| 0.1 | 4.3 | REACTOME NCAM1 INTERACTIONS | Genes involved in NCAM1 interactions |
| 0.1 | 2.7 | REACTOME OLFACTORY SIGNALING PATHWAY | Genes involved in Olfactory Signaling Pathway |
| 0.0 | 5.1 | REACTOME ANTIVIRAL MECHANISM BY IFN STIMULATED GENES | Genes involved in Antiviral mechanism by IFN-stimulated genes |
| 0.0 | 0.9 | REACTOME GLYCOGEN BREAKDOWN GLYCOGENOLYSIS | Genes involved in Glycogen breakdown (glycogenolysis) |
| 0.0 | 2.2 | REACTOME CHONDROITIN SULFATE DERMATAN SULFATE METABOLISM | Genes involved in Chondroitin sulfate/dermatan sulfate metabolism |
| 0.0 | 0.8 | REACTOME FACILITATIVE NA INDEPENDENT GLUCOSE TRANSPORTERS | Genes involved in Facilitative Na+-independent glucose transporters |
| 0.0 | 0.5 | REACTOME ACTIVATION OF THE AP1 FAMILY OF TRANSCRIPTION FACTORS | Genes involved in Activation of the AP-1 family of transcription factors |
| 0.0 | 2.6 | REACTOME ACTIVATION OF CHAPERONE GENES BY XBP1S | Genes involved in Activation of Chaperone Genes by XBP1(S) |
| 0.0 | 3.9 | REACTOME TRANSPORT OF INORGANIC CATIONS ANIONS AND AMINO ACIDS OLIGOPEPTIDES | Genes involved in Transport of inorganic cations/anions and amino acids/oligopeptides |
| 0.0 | 0.7 | REACTOME BIOSYNTHESIS OF THE N GLYCAN PRECURSOR DOLICHOL LIPID LINKED OLIGOSACCHARIDE LLO AND TRANSFER TO A NASCENT PROTEIN | Genes involved in Biosynthesis of the N-glycan precursor (dolichol lipid-linked oligosaccharide, LLO) and transfer to a nascent protein |
| 0.0 | 1.3 | REACTOME MITOCHONDRIAL PROTEIN IMPORT | Genes involved in Mitochondrial Protein Import |
| 0.0 | 1.5 | REACTOME NUCLEAR RECEPTOR TRANSCRIPTION PATHWAY | Genes involved in Nuclear Receptor transcription pathway |
| 0.0 | 0.4 | REACTOME REGULATION OF IFNA SIGNALING | Genes involved in Regulation of IFNA signaling |
| 0.0 | 1.2 | REACTOME MITOTIC PROMETAPHASE | Genes involved in Mitotic Prometaphase |