Project
GNF SymAtlas + NCI-60 cancer cell lines, comparison of cancers vs non-cancers, human (Su, 2004; Ross, 2000)
Navigation
Downloads
Results for GGCAAGA
Z-value: 0.48
Motif logo

miRNA associated with seed GGCAAGA
| Name | miRBASE accession |
|---|---|
|
hsa-miR-31-5p
|
MIMAT0000089 |
Activity profile of GGCAAGA motif
Sorted Z-values of GGCAAGA motif
| Promoter | Log-likelihood | Transcript | Gene | Gene Info |
|---|---|---|---|---|
| chr17_-_1532106 | 2.40 |
ENST00000301335.5
ENST00000382147.4 |
SLC43A2
|
solute carrier family 43 (amino acid system L transporter), member 2 |
| chr12_-_42538657 | 2.35 |
ENST00000398675.3
|
GXYLT1
|
glucoside xylosyltransferase 1 |
| chr16_+_58283814 | 2.22 |
ENST00000443128.2
ENST00000219299.4 |
CCDC113
|
coiled-coil domain containing 113 |
| chr17_-_27278304 | 2.03 |
ENST00000577226.1
|
PHF12
|
PHD finger protein 12 |
| chr15_+_31619013 | 1.86 |
ENST00000307145.3
|
KLF13
|
Kruppel-like factor 13 |
| chr16_+_30710462 | 1.83 |
ENST00000262518.4
ENST00000395059.2 ENST00000344771.4 |
SRCAP
|
Snf2-related CREBBP activator protein |
| chr2_-_218808771 | 1.81 |
ENST00000449814.1
ENST00000171887.4 |
TNS1
|
tensin 1 |
| chr3_-_114790179 | 1.75 |
ENST00000462705.1
|
ZBTB20
|
zinc finger and BTB domain containing 20 |
| chr12_-_49110613 | 1.71 |
ENST00000261900.3
|
CCNT1
|
cyclin T1 |
| chr2_-_9143786 | 1.65 |
ENST00000462696.1
ENST00000305997.3 |
MBOAT2
|
membrane bound O-acyltransferase domain containing 2 |
| chr7_-_35734730 | 1.63 |
ENST00000396081.1
ENST00000311350.3 |
HERPUD2
|
HERPUD family member 2 |
| chr2_-_38604398 | 1.54 |
ENST00000443098.1
ENST00000449130.1 ENST00000378954.4 ENST00000539122.1 ENST00000419554.2 ENST00000451483.1 ENST00000406122.1 |
ATL2
|
atlastin GTPase 2 |
| chr3_-_133614597 | 1.49 |
ENST00000285208.4
ENST00000460865.3 |
RAB6B
|
RAB6B, member RAS oncogene family |
| chr6_-_91006461 | 1.38 |
ENST00000257749.4
ENST00000343122.3 ENST00000406998.2 ENST00000453877.1 |
BACH2
|
BTB and CNC homology 1, basic leucine zipper transcription factor 2 |
| chr10_+_101088836 | 1.38 |
ENST00000356713.4
|
CNNM1
|
cyclin M1 |
| chr17_+_64961026 | 1.37 |
ENST00000262138.3
|
CACNG4
|
calcium channel, voltage-dependent, gamma subunit 4 |
| chr12_-_6798523 | 1.32 |
ENST00000319770.3
|
ZNF384
|
zinc finger protein 384 |
| chr11_+_119076745 | 1.31 |
ENST00000264033.4
|
CBL
|
Cbl proto-oncogene, E3 ubiquitin protein ligase |
| chrX_-_107979616 | 1.30 |
ENST00000372129.2
|
IRS4
|
insulin receptor substrate 4 |
| chr20_-_42939782 | 1.28 |
ENST00000396825.3
|
FITM2
|
fat storage-inducing transmembrane protein 2 |
| chr8_+_136469684 | 1.26 |
ENST00000355849.5
|
KHDRBS3
|
KH domain containing, RNA binding, signal transduction associated 3 |
| chr3_-_185216766 | 1.22 |
ENST00000296254.3
|
TMEM41A
|
transmembrane protein 41A |
| chr5_+_56111361 | 1.21 |
ENST00000399503.3
|
MAP3K1
|
mitogen-activated protein kinase kinase kinase 1, E3 ubiquitin protein ligase |
| chr4_+_106629929 | 1.21 |
ENST00000512828.1
ENST00000394730.3 ENST00000507281.1 ENST00000515279.1 |
GSTCD
|
glutathione S-transferase, C-terminal domain containing |
| chr2_+_45878790 | 1.19 |
ENST00000306156.3
|
PRKCE
|
protein kinase C, epsilon |
| chr2_+_61404624 | 1.19 |
ENST00000394457.3
|
AHSA2
|
AHA1, activator of heat shock 90kDa protein ATPase homolog 2 (yeast) |
| chr14_-_74551172 | 1.18 |
ENST00000553458.1
|
ALDH6A1
|
aldehyde dehydrogenase 6 family, member A1 |
| chr10_-_120514720 | 1.17 |
ENST00000369151.3
ENST00000340214.4 |
CACUL1
|
CDK2-associated, cullin domain 1 |
| chr16_-_402639 | 1.15 |
ENST00000262320.3
|
AXIN1
|
axin 1 |
| chr2_-_220110187 | 1.12 |
ENST00000295759.7
ENST00000392089.2 |
GLB1L
|
galactosidase, beta 1-like |
| chr1_-_154842741 | 1.09 |
ENST00000271915.4
|
KCNN3
|
potassium intermediate/small conductance calcium-activated channel, subfamily N, member 3 |
| chr16_+_70148230 | 1.08 |
ENST00000398122.3
ENST00000568530.1 |
PDPR
|
pyruvate dehydrogenase phosphatase regulatory subunit |
| chr5_-_74326724 | 0.98 |
ENST00000322348.4
|
GCNT4
|
glucosaminyl (N-acetyl) transferase 4, core 2 |
| chr2_+_27070964 | 0.96 |
ENST00000288699.6
|
DPYSL5
|
dihydropyrimidinase-like 5 |
| chr11_-_86666427 | 0.95 |
ENST00000531380.1
|
FZD4
|
frizzled family receptor 4 |
| chr1_-_179198702 | 0.94 |
ENST00000502732.1
|
ABL2
|
c-abl oncogene 2, non-receptor tyrosine kinase |
| chr17_-_4167142 | 0.90 |
ENST00000570535.1
ENST00000574367.1 ENST00000341657.4 ENST00000433651.1 |
ANKFY1
|
ankyrin repeat and FYVE domain containing 1 |
| chr1_+_78245303 | 0.90 |
ENST00000370791.3
ENST00000443751.2 |
FAM73A
|
family with sequence similarity 73, member A |
| chr19_-_3606838 | 0.90 |
ENST00000375190.4
|
TBXA2R
|
thromboxane A2 receptor |
| chr16_+_4897632 | 0.85 |
ENST00000262376.6
|
UBN1
|
ubinuclein 1 |
| chr1_-_41131326 | 0.85 |
ENST00000372684.3
|
RIMS3
|
regulating synaptic membrane exocytosis 3 |
| chr10_+_102295616 | 0.83 |
ENST00000299163.6
|
HIF1AN
|
hypoxia inducible factor 1, alpha subunit inhibitor |
| chr14_-_23388338 | 0.82 |
ENST00000555209.1
ENST00000554256.1 ENST00000557403.1 ENST00000557549.1 ENST00000555676.1 ENST00000557571.1 ENST00000557464.1 ENST00000554618.1 ENST00000556862.1 ENST00000555722.1 ENST00000346528.5 ENST00000542016.2 ENST00000399922.2 ENST00000557227.1 ENST00000359890.3 |
RBM23
|
RNA binding motif protein 23 |
| chr16_+_2587998 | 0.82 |
ENST00000441549.3
ENST00000268673.7 |
PDPK1
|
3-phosphoinositide dependent protein kinase-1 |
| chr20_+_35974532 | 0.81 |
ENST00000373578.2
|
SRC
|
v-src avian sarcoma (Schmidt-Ruppin A-2) viral oncogene homolog |
| chr1_+_203444887 | 0.81 |
ENST00000343110.2
|
PRELP
|
proline/arginine-rich end leucine-rich repeat protein |
| chr8_-_89339705 | 0.77 |
ENST00000286614.6
|
MMP16
|
matrix metallopeptidase 16 (membrane-inserted) |
| chr3_+_14989076 | 0.76 |
ENST00000413118.1
ENST00000425241.1 |
NR2C2
|
nuclear receptor subfamily 2, group C, member 2 |
| chr3_-_120461378 | 0.74 |
ENST00000273375.3
|
RABL3
|
RAB, member of RAS oncogene family-like 3 |
| chr16_-_70472946 | 0.74 |
ENST00000342907.2
|
ST3GAL2
|
ST3 beta-galactoside alpha-2,3-sialyltransferase 2 |
| chr21_+_35445827 | 0.74 |
ENST00000608209.1
ENST00000381151.3 |
SLC5A3
SLC5A3
|
sodium/myo-inositol cotransporter solute carrier family 5 (sodium/myo-inositol cotransporter), member 3 |
| chr12_+_7342178 | 0.73 |
ENST00000266563.5
ENST00000543974.1 |
PEX5
|
peroxisomal biogenesis factor 5 |
| chr3_+_57541975 | 0.72 |
ENST00000487257.1
ENST00000311180.8 |
PDE12
|
phosphodiesterase 12 |
| chr17_+_7184986 | 0.72 |
ENST00000317370.8
ENST00000571308.1 |
SLC2A4
|
solute carrier family 2 (facilitated glucose transporter), member 4 |
| chr15_-_71055878 | 0.71 |
ENST00000322954.6
|
UACA
|
uveal autoantigen with coiled-coil domains and ankyrin repeats |
| chr3_+_139654018 | 0.71 |
ENST00000458420.3
|
CLSTN2
|
calsyntenin 2 |
| chr12_+_113229737 | 0.71 |
ENST00000551052.1
ENST00000415485.3 |
RPH3A
|
rabphilin 3A homolog (mouse) |
| chr22_+_38035459 | 0.70 |
ENST00000357436.4
|
SH3BP1
|
SH3-domain binding protein 1 |
| chr17_+_8213590 | 0.70 |
ENST00000361926.3
|
ARHGEF15
|
Rho guanine nucleotide exchange factor (GEF) 15 |
| chr9_-_23821273 | 0.68 |
ENST00000380110.4
|
ELAVL2
|
ELAV like neuron-specific RNA binding protein 2 |
| chr15_-_35047166 | 0.67 |
ENST00000290374.4
|
GJD2
|
gap junction protein, delta 2, 36kDa |
| chr4_-_90229142 | 0.65 |
ENST00000609438.1
|
GPRIN3
|
GPRIN family member 3 |
| chr2_+_166095898 | 0.63 |
ENST00000424833.1
ENST00000375437.2 ENST00000357398.3 |
SCN2A
|
sodium channel, voltage-gated, type II, alpha subunit |
| chr1_-_23857698 | 0.63 |
ENST00000361729.2
|
E2F2
|
E2F transcription factor 2 |
| chr2_+_120770645 | 0.62 |
ENST00000443902.2
|
EPB41L5
|
erythrocyte membrane protein band 4.1 like 5 |
| chr17_-_34890759 | 0.62 |
ENST00000431794.3
|
MYO19
|
myosin XIX |
| chr22_+_20067738 | 0.59 |
ENST00000351989.3
ENST00000383024.2 |
DGCR8
|
DGCR8 microprocessor complex subunit |
| chrX_+_49020121 | 0.59 |
ENST00000415364.1
ENST00000376338.3 ENST00000425285.1 |
MAGIX
|
MAGI family member, X-linked |
| chr5_-_11904152 | 0.58 |
ENST00000304623.8
ENST00000458100.2 |
CTNND2
|
catenin (cadherin-associated protein), delta 2 |
| chr10_-_75634260 | 0.58 |
ENST00000372765.1
ENST00000351293.3 |
CAMK2G
|
calcium/calmodulin-dependent protein kinase II gamma |
| chr21_+_37858165 | 0.57 |
ENST00000595927.1
|
AP000695.1
|
AP000695.1 |
| chr4_+_87856129 | 0.57 |
ENST00000395146.4
ENST00000507468.1 |
AFF1
|
AF4/FMR2 family, member 1 |
| chr8_+_28351707 | 0.56 |
ENST00000537916.1
ENST00000523546.1 ENST00000240093.3 |
FZD3
|
frizzled family receptor 3 |
| chr20_+_42875887 | 0.54 |
ENST00000342560.5
|
GDAP1L1
|
ganglioside induced differentiation associated protein 1-like 1 |
| chr16_+_19078911 | 0.54 |
ENST00000321998.5
|
COQ7
|
coenzyme Q7 homolog, ubiquinone (yeast) |
| chr10_-_126432619 | 0.54 |
ENST00000337318.3
|
FAM53B
|
family with sequence similarity 53, member B |
| chr20_+_62711482 | 0.54 |
ENST00000336866.2
ENST00000355631.4 |
OPRL1
|
opiate receptor-like 1 |
| chr14_-_75593708 | 0.53 |
ENST00000557673.1
ENST00000238616.5 |
NEK9
|
NIMA-related kinase 9 |
| chr14_+_69865401 | 0.53 |
ENST00000556605.1
ENST00000336643.5 ENST00000031146.4 |
SLC39A9
|
solute carrier family 39, member 9 |
| chr15_+_62853562 | 0.52 |
ENST00000561311.1
|
TLN2
|
talin 2 |
| chr6_+_28109703 | 0.51 |
ENST00000457389.2
ENST00000330236.6 |
ZKSCAN8
|
zinc finger with KRAB and SCAN domains 8 |
| chr22_+_31090793 | 0.51 |
ENST00000332585.6
ENST00000382310.3 ENST00000446658.2 |
OSBP2
|
oxysterol binding protein 2 |
| chr19_+_3359561 | 0.50 |
ENST00000589123.1
ENST00000346156.5 ENST00000395111.3 ENST00000586919.1 |
NFIC
|
nuclear factor I/C (CCAAT-binding transcription factor) |
| chr1_+_226411319 | 0.50 |
ENST00000542034.1
ENST00000366810.5 |
MIXL1
|
Mix paired-like homeobox |
| chr2_-_178937478 | 0.50 |
ENST00000286063.6
|
PDE11A
|
phosphodiesterase 11A |
| chr10_-_70287231 | 0.50 |
ENST00000609923.1
|
SLC25A16
|
solute carrier family 25 (mitochondrial carrier; Graves disease autoantigen), member 16 |
| chr1_-_115323245 | 0.48 |
ENST00000060969.5
ENST00000369528.5 |
SIKE1
|
suppressor of IKBKE 1 |
| chr1_+_27114418 | 0.48 |
ENST00000078527.4
|
PIGV
|
phosphatidylinositol glycan anchor biosynthesis, class V |
| chr1_-_208417620 | 0.47 |
ENST00000367033.3
|
PLXNA2
|
plexin A2 |
| chr15_+_79724858 | 0.47 |
ENST00000305428.3
|
KIAA1024
|
KIAA1024 |
| chr1_+_199996702 | 0.47 |
ENST00000367362.3
|
NR5A2
|
nuclear receptor subfamily 5, group A, member 2 |
| chr19_+_15218180 | 0.47 |
ENST00000342784.2
ENST00000597977.1 ENST00000600440.1 |
SYDE1
|
synapse defective 1, Rho GTPase, homolog 1 (C. elegans) |
| chr4_-_41216619 | 0.46 |
ENST00000508676.1
ENST00000506352.1 ENST00000295974.8 |
APBB2
|
amyloid beta (A4) precursor protein-binding, family B, member 2 |
| chr19_-_33793430 | 0.45 |
ENST00000498907.2
|
CEBPA
|
CCAAT/enhancer binding protein (C/EBP), alpha |
| chr5_+_141303373 | 0.44 |
ENST00000432126.2
ENST00000194118.4 |
KIAA0141
|
KIAA0141 |
| chr11_-_35440796 | 0.44 |
ENST00000278379.3
|
SLC1A2
|
solute carrier family 1 (glial high affinity glutamate transporter), member 2 |
| chr15_-_42500351 | 0.44 |
ENST00000348544.4
ENST00000318006.5 |
VPS39
|
vacuolar protein sorting 39 homolog (S. cerevisiae) |
| chr11_-_6624801 | 0.43 |
ENST00000534343.1
ENST00000254605.6 |
RRP8
|
ribosomal RNA processing 8, methyltransferase, homolog (yeast) |
| chr14_-_34420259 | 0.43 |
ENST00000250457.3
ENST00000547327.2 |
EGLN3
|
egl-9 family hypoxia-inducible factor 3 |
| chr5_-_59189545 | 0.43 |
ENST00000340635.6
|
PDE4D
|
phosphodiesterase 4D, cAMP-specific |
| chr13_+_49280951 | 0.42 |
ENST00000282018.3
|
CYSLTR2
|
cysteinyl leukotriene receptor 2 |
| chr3_-_116164306 | 0.41 |
ENST00000490035.2
|
LSAMP
|
limbic system-associated membrane protein |
| chr16_-_4987065 | 0.41 |
ENST00000590782.2
ENST00000345988.2 |
PPL
|
periplakin |
| chr16_+_69599861 | 0.40 |
ENST00000354436.2
|
NFAT5
|
nuclear factor of activated T-cells 5, tonicity-responsive |
| chr17_-_617949 | 0.39 |
ENST00000401468.3
ENST00000574029.1 ENST00000291074.5 ENST00000571805.1 ENST00000437048.2 ENST00000446250.2 |
VPS53
|
vacuolar protein sorting 53 homolog (S. cerevisiae) |
| chr14_-_78174344 | 0.38 |
ENST00000216489.3
|
ALKBH1
|
alkB, alkylation repair homolog 1 (E. coli) |
| chr2_+_5832799 | 0.37 |
ENST00000322002.3
|
SOX11
|
SRY (sex determining region Y)-box 11 |
| chr3_-_87040233 | 0.36 |
ENST00000398399.2
|
VGLL3
|
vestigial like 3 (Drosophila) |
| chr3_-_170626418 | 0.36 |
ENST00000474096.1
ENST00000295822.2 |
EIF5A2
|
eukaryotic translation initiation factor 5A2 |
| chr13_-_72441315 | 0.35 |
ENST00000305425.4
ENST00000313174.7 ENST00000354591.4 |
DACH1
|
dachshund homolog 1 (Drosophila) |
| chr1_-_171711387 | 0.35 |
ENST00000236192.7
|
VAMP4
|
vesicle-associated membrane protein 4 |
| chr17_-_63052929 | 0.34 |
ENST00000439174.2
|
GNA13
|
guanine nucleotide binding protein (G protein), alpha 13 |
| chr15_-_52821247 | 0.33 |
ENST00000399231.3
ENST00000399233.2 |
MYO5A
|
myosin VA (heavy chain 12, myoxin) |
| chr16_+_84853580 | 0.33 |
ENST00000262424.5
ENST00000566151.1 ENST00000567845.1 ENST00000564567.1 ENST00000569090.1 |
CRISPLD2
|
cysteine-rich secretory protein LCCL domain containing 2 |
| chr13_+_42622781 | 0.32 |
ENST00000337343.4
ENST00000261491.5 ENST00000379274.2 |
DGKH
|
diacylglycerol kinase, eta |
| chr10_-_30348439 | 0.32 |
ENST00000375377.1
|
KIAA1462
|
KIAA1462 |
| chr16_-_31147020 | 0.32 |
ENST00000568261.1
ENST00000567797.1 ENST00000317508.6 |
PRSS8
|
protease, serine, 8 |
| chr1_+_26560676 | 0.31 |
ENST00000451429.2
ENST00000252992.4 |
CEP85
|
centrosomal protein 85kDa |
| chr9_-_37034028 | 0.31 |
ENST00000520281.1
ENST00000446742.1 ENST00000522003.1 ENST00000523145.1 ENST00000414447.1 ENST00000377847.2 ENST00000377853.2 ENST00000377852.2 ENST00000523241.1 ENST00000520154.1 ENST00000358127.4 |
PAX5
|
paired box 5 |
| chr1_+_70876891 | 0.31 |
ENST00000411986.2
|
CTH
|
cystathionase (cystathionine gamma-lyase) |
| chr1_+_167190066 | 0.31 |
ENST00000367866.2
ENST00000429375.2 ENST00000452019.1 ENST00000420254.3 ENST00000541643.3 |
POU2F1
|
POU class 2 homeobox 1 |
| chr5_-_137090028 | 0.30 |
ENST00000314940.4
|
HNRNPA0
|
heterogeneous nuclear ribonucleoprotein A0 |
| chr10_+_18549645 | 0.30 |
ENST00000396576.2
|
CACNB2
|
calcium channel, voltage-dependent, beta 2 subunit |
| chr8_+_61591337 | 0.30 |
ENST00000423902.2
|
CHD7
|
chromodomain helicase DNA binding protein 7 |
| chr1_+_57110972 | 0.29 |
ENST00000371244.4
|
PRKAA2
|
protein kinase, AMP-activated, alpha 2 catalytic subunit |
| chr12_+_122516626 | 0.29 |
ENST00000319080.7
|
MLXIP
|
MLX interacting protein |
| chr6_-_100912785 | 0.29 |
ENST00000369208.3
|
SIM1
|
single-minded family bHLH transcription factor 1 |
| chr14_-_22005343 | 0.26 |
ENST00000327430.3
|
SALL2
|
spalt-like transcription factor 2 |
| chr4_-_42659102 | 0.25 |
ENST00000264449.10
ENST00000510289.1 ENST00000381668.5 |
ATP8A1
|
ATPase, aminophospholipid transporter (APLT), class I, type 8A, member 1 |
| chr12_-_54673871 | 0.25 |
ENST00000209875.4
|
CBX5
|
chromobox homolog 5 |
| chrX_+_12156582 | 0.25 |
ENST00000380682.1
|
FRMPD4
|
FERM and PDZ domain containing 4 |
| chr15_-_74988281 | 0.25 |
ENST00000566828.1
ENST00000563009.1 ENST00000568176.1 ENST00000566243.1 ENST00000566219.1 ENST00000426797.3 ENST00000566119.1 ENST00000315127.4 |
EDC3
|
enhancer of mRNA decapping 3 |
| chr19_-_44100275 | 0.24 |
ENST00000422989.1
ENST00000598324.1 |
IRGQ
|
immunity-related GTPase family, Q |
| chr1_-_40105617 | 0.24 |
ENST00000372852.3
|
HEYL
|
hes-related family bHLH transcription factor with YRPW motif-like |
| chr5_-_168006591 | 0.22 |
ENST00000239231.6
|
PANK3
|
pantothenate kinase 3 |
| chr1_+_28099683 | 0.22 |
ENST00000373943.4
|
STX12
|
syntaxin 12 |
| chr12_+_113416191 | 0.21 |
ENST00000342315.4
ENST00000392583.2 |
OAS2
|
2'-5'-oligoadenylate synthetase 2, 69/71kDa |
| chr8_-_71316021 | 0.19 |
ENST00000452400.2
|
NCOA2
|
nuclear receptor coactivator 2 |
| chr6_-_30710510 | 0.18 |
ENST00000376389.3
|
FLOT1
|
flotillin 1 |
| chr5_+_153418466 | 0.18 |
ENST00000522782.1
ENST00000439768.2 ENST00000436816.1 ENST00000322602.5 ENST00000522177.1 ENST00000520899.1 |
MFAP3
|
microfibrillar-associated protein 3 |
| chr13_-_33859819 | 0.18 |
ENST00000336934.5
|
STARD13
|
StAR-related lipid transfer (START) domain containing 13 |
| chr19_-_38146289 | 0.17 |
ENST00000392144.1
ENST00000591444.1 ENST00000351218.2 ENST00000587809.1 |
ZFP30
|
ZFP30 zinc finger protein |
| chr7_+_94139105 | 0.16 |
ENST00000297273.4
|
CASD1
|
CAS1 domain containing 1 |
| chr7_+_92158083 | 0.16 |
ENST00000265732.5
ENST00000481551.1 ENST00000496410.1 |
RBM48
|
RNA binding motif protein 48 |
| chr1_-_157108130 | 0.15 |
ENST00000368192.4
|
ETV3
|
ets variant 3 |
| chr18_+_46065393 | 0.15 |
ENST00000256413.3
|
CTIF
|
CBP80/20-dependent translation initiation factor |
| chr4_+_38665810 | 0.15 |
ENST00000261438.5
ENST00000514033.1 |
KLF3
|
Kruppel-like factor 3 (basic) |
| chrX_-_33146477 | 0.15 |
ENST00000378677.2
|
DMD
|
dystrophin |
| chr2_-_153032484 | 0.15 |
ENST00000263904.4
|
STAM2
|
signal transducing adaptor molecule (SH3 domain and ITAM motif) 2 |
| chr1_+_163039143 | 0.14 |
ENST00000531057.1
ENST00000527809.1 ENST00000367908.4 |
RGS4
|
regulator of G-protein signaling 4 |
| chr6_+_7107999 | 0.13 |
ENST00000491191.1
ENST00000379938.2 ENST00000471433.1 |
RREB1
|
ras responsive element binding protein 1 |
| chr2_-_70475730 | 0.12 |
ENST00000445587.1
ENST00000433529.2 ENST00000415783.2 |
TIA1
|
TIA1 cytotoxic granule-associated RNA binding protein |
| chr14_+_37131058 | 0.12 |
ENST00000361487.6
|
PAX9
|
paired box 9 |
| chr6_-_99395787 | 0.11 |
ENST00000369244.2
ENST00000229971.1 |
FBXL4
|
F-box and leucine-rich repeat protein 4 |
| chr17_-_79885576 | 0.10 |
ENST00000574686.1
ENST00000357736.4 |
MAFG
|
v-maf avian musculoaponeurotic fibrosarcoma oncogene homolog G |
| chr17_+_4901199 | 0.10 |
ENST00000320785.5
ENST00000574165.1 |
KIF1C
|
kinesin family member 1C |
| chr1_+_65613217 | 0.09 |
ENST00000545314.1
|
AK4
|
adenylate kinase 4 |
| chrX_-_151619746 | 0.09 |
ENST00000370314.4
|
GABRA3
|
gamma-aminobutyric acid (GABA) A receptor, alpha 3 |
| chr17_+_39845134 | 0.09 |
ENST00000591776.1
ENST00000469257.1 |
EIF1
|
eukaryotic translation initiation factor 1 |
| chr2_-_71221942 | 0.09 |
ENST00000272438.4
|
TEX261
|
testis expressed 261 |
| chr16_+_11762270 | 0.08 |
ENST00000329565.5
|
SNN
|
stannin |
| chr7_-_112430647 | 0.08 |
ENST00000312814.6
|
TMEM168
|
transmembrane protein 168 |
| chr14_+_50779029 | 0.08 |
ENST00000245448.6
|
ATP5S
|
ATP synthase, H+ transporting, mitochondrial Fo complex, subunit s (factor B) |
| chr7_-_93204033 | 0.08 |
ENST00000359558.2
ENST00000360249.4 ENST00000426151.1 |
CALCR
|
calcitonin receptor |
| chr20_-_35374456 | 0.07 |
ENST00000373803.2
ENST00000359675.2 ENST00000540765.1 ENST00000349004.1 |
NDRG3
|
NDRG family member 3 |
| chr3_-_48885228 | 0.07 |
ENST00000454963.1
ENST00000296446.8 ENST00000419216.1 ENST00000265563.8 |
PRKAR2A
|
protein kinase, cAMP-dependent, regulatory, type II, alpha |
| chr2_-_208030647 | 0.06 |
ENST00000309446.6
|
KLF7
|
Kruppel-like factor 7 (ubiquitous) |
| chr8_+_77593448 | 0.05 |
ENST00000521891.2
|
ZFHX4
|
zinc finger homeobox 4 |
| chr3_+_14444063 | 0.04 |
ENST00000454876.2
ENST00000360861.3 ENST00000416216.2 |
SLC6A6
|
solute carrier family 6 (neurotransmitter transporter), member 6 |
| chr5_+_71403061 | 0.03 |
ENST00000512974.1
ENST00000296755.7 |
MAP1B
|
microtubule-associated protein 1B |
| chr5_-_78809950 | 0.03 |
ENST00000334082.6
|
HOMER1
|
homer homolog 1 (Drosophila) |
| chr14_+_57046500 | 0.03 |
ENST00000261556.6
|
TMEM260
|
transmembrane protein 260 |
| chr11_-_77532050 | 0.03 |
ENST00000308488.6
|
RSF1
|
remodeling and spacing factor 1 |
| chr1_+_36396677 | 0.03 |
ENST00000373191.4
ENST00000397828.2 |
AGO3
|
argonaute RISC catalytic component 3 |
| chr3_-_9291063 | 0.03 |
ENST00000383836.3
|
SRGAP3
|
SLIT-ROBO Rho GTPase activating protein 3 |
| chr10_+_123748702 | 0.02 |
ENST00000369005.1
ENST00000513429.1 ENST00000515273.1 ENST00000515603.1 |
TACC2
|
transforming, acidic coiled-coil containing protein 2 |
| chr18_+_55711575 | 0.01 |
ENST00000356462.6
ENST00000400345.3 ENST00000589054.1 ENST00000256832.7 |
NEDD4L
|
neural precursor cell expressed, developmentally down-regulated 4-like, E3 ubiquitin protein ligase |
| chr1_-_37499726 | 0.01 |
ENST00000373091.3
ENST00000373093.4 |
GRIK3
|
glutamate receptor, ionotropic, kainate 3 |
| chr1_-_155942086 | 0.01 |
ENST00000368315.4
|
ARHGEF2
|
Rho/Rac guanine nucleotide exchange factor (GEF) 2 |
| chr9_+_470288 | 0.00 |
ENST00000382303.1
|
KANK1
|
KN motif and ankyrin repeat domains 1 |
| chr5_-_16509101 | 0.00 |
ENST00000399793.2
|
FAM134B
|
family with sequence similarity 134, member B |
Network of associatons between targets according to the STRING database.

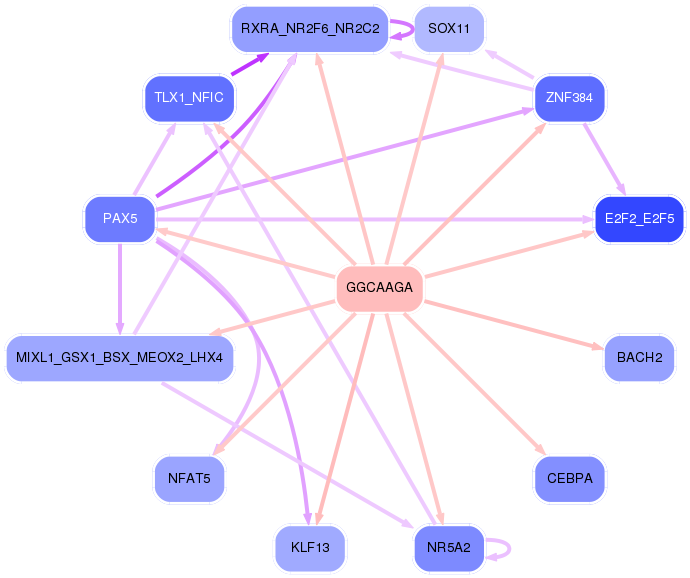
First level regulatory network of GGCAAGA
Gene Ontology Analysis
Gene overrepresentation in biological_process category:
| Log-likelihood per target | Total log-likelihood | Term | Description |
|---|---|---|---|
| 0.4 | 1.8 | GO:0048319 | axial mesoderm morphogenesis(GO:0048319) |
| 0.3 | 0.9 | GO:0038193 | thromboxane A2 signaling pathway(GO:0038193) |
| 0.3 | 1.2 | GO:0019859 | pyrimidine nucleobase catabolic process(GO:0006208) thymine catabolic process(GO:0006210) thymine metabolic process(GO:0019859) |
| 0.3 | 0.8 | GO:0042264 | peptidyl-aspartic acid hydroxylation(GO:0042264) |
| 0.2 | 0.9 | GO:0061304 | extracellular matrix-cell signaling(GO:0035426) retinal blood vessel morphogenesis(GO:0061304) |
| 0.2 | 0.8 | GO:0071393 | cellular response to progesterone stimulus(GO:0071393) |
| 0.2 | 1.3 | GO:0090650 | response to oxygen-glucose deprivation(GO:0090649) cellular response to oxygen-glucose deprivation(GO:0090650) |
| 0.2 | 1.9 | GO:0045647 | negative regulation of erythrocyte differentiation(GO:0045647) |
| 0.2 | 0.6 | GO:0045976 | negative regulation of mitotic cell cycle, embryonic(GO:0045976) |
| 0.2 | 1.3 | GO:0010890 | positive regulation of sequestering of triglyceride(GO:0010890) |
| 0.1 | 0.9 | GO:0048549 | positive regulation of pinocytosis(GO:0048549) |
| 0.1 | 0.7 | GO:1901090 | regulation of protein tetramerization(GO:1901090) negative regulation of protein tetramerization(GO:1901091) regulation of protein homotetramerization(GO:1901093) negative regulation of protein homotetramerization(GO:1901094) |
| 0.1 | 0.5 | GO:1904059 | regulation of locomotor rhythm(GO:1904059) |
| 0.1 | 0.4 | GO:0002101 | tRNA wobble cytosine modification(GO:0002101) |
| 0.1 | 0.6 | GO:1990086 | lens fiber cell apoptotic process(GO:1990086) |
| 0.1 | 0.4 | GO:0061386 | closure of optic fissure(GO:0061386) |
| 0.1 | 1.2 | GO:0070257 | positive regulation of mucus secretion(GO:0070257) |
| 0.1 | 1.2 | GO:1901409 | positive regulation of phosphorylation of RNA polymerase II C-terminal domain(GO:1901409) |
| 0.1 | 0.5 | GO:1901165 | positive regulation of trophoblast cell migration(GO:1901165) |
| 0.1 | 1.0 | GO:0002118 | aggressive behavior(GO:0002118) |
| 0.1 | 0.5 | GO:2000382 | positive regulation of mesoderm development(GO:2000382) |
| 0.1 | 0.3 | GO:0003221 | right ventricular cardiac muscle tissue morphogenesis(GO:0003221) |
| 0.1 | 0.7 | GO:0061299 | retina vasculature morphogenesis in camera-type eye(GO:0061299) |
| 0.1 | 0.5 | GO:0061113 | pancreas morphogenesis(GO:0061113) |
| 0.1 | 0.4 | GO:1902774 | late endosome to lysosome transport(GO:1902774) |
| 0.1 | 0.7 | GO:0015791 | polyol transport(GO:0015791) |
| 0.1 | 0.8 | GO:1990416 | cellular response to brain-derived neurotrophic factor stimulus(GO:1990416) |
| 0.1 | 0.2 | GO:2000824 | negative regulation of androgen receptor activity(GO:2000824) |
| 0.1 | 0.5 | GO:0021785 | branchiomotor neuron axon guidance(GO:0021785) |
| 0.1 | 0.3 | GO:0018352 | protein-pyridoxal-5-phosphate linkage(GO:0018352) |
| 0.1 | 0.4 | GO:0061737 | leukotriene signaling pathway(GO:0061737) |
| 0.1 | 2.8 | GO:1902475 | L-alpha-amino acid transmembrane transport(GO:1902475) |
| 0.1 | 0.2 | GO:1904016 | response to Thyroglobulin triiodothyronine(GO:1904016) |
| 0.1 | 0.3 | GO:0061092 | regulation of phospholipid translocation(GO:0061091) positive regulation of phospholipid translocation(GO:0061092) |
| 0.1 | 1.4 | GO:2000311 | regulation of alpha-amino-3-hydroxy-5-methyl-4-isoxazole propionate selective glutamate receptor activity(GO:2000311) |
| 0.1 | 0.4 | GO:0046015 | regulation of transcription by glucose(GO:0046015) |
| 0.1 | 0.2 | GO:0051835 | positive regulation of synapse structural plasticity(GO:0051835) |
| 0.1 | 1.1 | GO:0010510 | regulation of acetyl-CoA biosynthetic process from pyruvate(GO:0010510) |
| 0.1 | 1.7 | GO:0036152 | phosphatidylethanolamine acyl-chain remodeling(GO:0036152) |
| 0.1 | 0.3 | GO:0051643 | regulation of inositol 1,4,5-trisphosphate-sensitive calcium-release channel activity(GO:0031585) secretory granule localization(GO:0032252) endoplasmic reticulum localization(GO:0051643) |
| 0.1 | 3.1 | GO:0016266 | O-glycan processing(GO:0016266) |
| 0.1 | 1.0 | GO:1901897 | regulation of relaxation of cardiac muscle(GO:1901897) |
| 0.1 | 0.3 | GO:1904879 | positive regulation of calcium ion transmembrane transport via high voltage-gated calcium channel(GO:1904879) |
| 0.0 | 0.6 | GO:0008627 | intrinsic apoptotic signaling pathway in response to osmotic stress(GO:0008627) |
| 0.0 | 0.4 | GO:0006452 | translational frameshifting(GO:0006452) positive regulation of translational termination(GO:0045905) |
| 0.0 | 0.3 | GO:0060244 | negative regulation of cell proliferation involved in contact inhibition(GO:0060244) |
| 0.0 | 0.8 | GO:0042340 | keratan sulfate catabolic process(GO:0042340) |
| 0.0 | 0.6 | GO:0031053 | primary miRNA processing(GO:0031053) |
| 0.0 | 0.4 | GO:0000050 | urea cycle(GO:0000050) |
| 0.0 | 0.8 | GO:0097094 | craniofacial suture morphogenesis(GO:0097094) |
| 0.0 | 1.5 | GO:0048791 | calcium ion-regulated exocytosis of neurotransmitter(GO:0048791) |
| 0.0 | 1.9 | GO:0032728 | positive regulation of interferon-beta production(GO:0032728) |
| 0.0 | 0.2 | GO:0031087 | nuclear-transcribed mRNA catabolic process, deadenylation-independent decay(GO:0031086) deadenylation-independent decapping of nuclear-transcribed mRNA(GO:0031087) |
| 0.0 | 0.2 | GO:0097498 | endothelial tube lumen extension(GO:0097498) |
| 0.0 | 1.8 | GO:0010761 | fibroblast migration(GO:0010761) |
| 0.0 | 0.4 | GO:0035641 | locomotory exploration behavior(GO:0035641) |
| 0.0 | 0.1 | GO:1903691 | positive regulation of wound healing, spreading of epidermal cells(GO:1903691) |
| 0.0 | 0.3 | GO:0031584 | activation of phospholipase D activity(GO:0031584) |
| 0.0 | 0.5 | GO:0007016 | cytoskeletal anchoring at plasma membrane(GO:0007016) |
| 0.0 | 0.2 | GO:0018377 | protein myristoylation(GO:0018377) |
| 0.0 | 0.5 | GO:0046069 | cGMP catabolic process(GO:0046069) |
| 0.0 | 0.5 | GO:0006744 | ubiquinone biosynthetic process(GO:0006744) quinone biosynthetic process(GO:1901663) |
| 0.0 | 1.4 | GO:0007029 | endoplasmic reticulum organization(GO:0007029) |
| 0.0 | 0.3 | GO:0090161 | Golgi ribbon formation(GO:0090161) |
| 0.0 | 0.7 | GO:0035428 | hexose transmembrane transport(GO:0035428) glucose transmembrane transport(GO:1904659) |
| 0.0 | 1.2 | GO:0002755 | MyD88-dependent toll-like receptor signaling pathway(GO:0002755) |
| 0.0 | 1.5 | GO:0006891 | intra-Golgi vesicle-mediated transport(GO:0006891) |
| 0.0 | 0.5 | GO:0016254 | preassembly of GPI anchor in ER membrane(GO:0016254) |
| 0.0 | 0.5 | GO:0006829 | zinc II ion transport(GO:0006829) |
| 0.0 | 0.9 | GO:2000249 | regulation of actin cytoskeleton reorganization(GO:2000249) |
| 0.0 | 0.3 | GO:0051573 | negative regulation of histone H3-K9 methylation(GO:0051573) |
| 0.0 | 0.9 | GO:0034724 | DNA replication-independent nucleosome assembly(GO:0006336) DNA replication-independent nucleosome organization(GO:0034724) |
| 0.0 | 0.5 | GO:0035411 | catenin import into nucleus(GO:0035411) |
| 0.0 | 0.3 | GO:0055089 | fatty acid homeostasis(GO:0055089) |
| 0.0 | 0.3 | GO:0046602 | regulation of mitotic centrosome separation(GO:0046602) |
| 0.0 | 0.6 | GO:0090140 | regulation of mitochondrial fission(GO:0090140) |
| 0.0 | 0.1 | GO:1903608 | protein localization to cytoplasmic stress granule(GO:1903608) |
| 0.0 | 0.2 | GO:0097011 | cellular response to granulocyte macrophage colony-stimulating factor stimulus(GO:0097011) response to granulocyte macrophage colony-stimulating factor(GO:0097012) |
| 0.0 | 0.7 | GO:0090503 | RNA phosphodiester bond hydrolysis, exonucleolytic(GO:0090503) |
| 0.0 | 0.1 | GO:0014809 | regulation of skeletal muscle contraction by regulation of release of sequestered calcium ion(GO:0014809) |
| 0.0 | 0.4 | GO:0060325 | face morphogenesis(GO:0060325) |
| 0.0 | 0.1 | GO:0046940 | nucleoside monophosphate phosphorylation(GO:0046940) |
| 0.0 | 0.1 | GO:0009048 | dosage compensation by inactivation of X chromosome(GO:0009048) |
| 0.0 | 1.2 | GO:0032781 | positive regulation of ATPase activity(GO:0032781) |
| 0.0 | 0.8 | GO:0006397 | mRNA processing(GO:0006397) |
| 0.0 | 0.3 | GO:0046473 | phosphatidic acid metabolic process(GO:0046473) |
| 0.0 | 0.0 | GO:0007206 | phospholipase C-activating G-protein coupled glutamate receptor signaling pathway(GO:0007206) |
| 0.0 | 0.2 | GO:0015937 | coenzyme A biosynthetic process(GO:0015937) |
| 0.0 | 0.6 | GO:0060997 | dendritic spine morphogenesis(GO:0060997) |
Gene overrepresentation in cellular_component category:
| Log-likelihood per target | Total log-likelihood | Term | Description |
|---|---|---|---|
| 0.2 | 0.9 | GO:0044352 | pinosome(GO:0044352) macropinosome(GO:0044354) |
| 0.2 | 1.7 | GO:0008024 | cyclin/CDK positive transcription elongation factor complex(GO:0008024) |
| 0.1 | 1.0 | GO:0032593 | insulin-responsive compartment(GO:0032593) |
| 0.1 | 1.5 | GO:0016600 | flotillin complex(GO:0016600) |
| 0.1 | 0.4 | GO:1990745 | EARP complex(GO:1990745) |
| 0.1 | 0.5 | GO:0031501 | mannosyltransferase complex(GO:0031501) |
| 0.1 | 2.2 | GO:0034451 | centriolar satellite(GO:0034451) |
| 0.1 | 1.2 | GO:0030877 | beta-catenin destruction complex(GO:0030877) |
| 0.1 | 0.4 | GO:0033553 | rDNA heterochromatin(GO:0033553) |
| 0.1 | 1.3 | GO:0016580 | Sin3 complex(GO:0016580) |
| 0.0 | 0.1 | GO:0033565 | ESCRT-0 complex(GO:0033565) |
| 0.0 | 1.4 | GO:0032281 | AMPA glutamate receptor complex(GO:0032281) |
| 0.0 | 1.5 | GO:0005793 | endoplasmic reticulum-Golgi intermediate compartment(GO:0005793) |
| 0.0 | 0.5 | GO:0002116 | semaphorin receptor complex(GO:0002116) |
| 0.0 | 0.4 | GO:0030123 | AP-3 adaptor complex(GO:0030123) |
| 0.0 | 0.6 | GO:0033270 | voltage-gated sodium channel complex(GO:0001518) paranode region of axon(GO:0033270) |
| 0.0 | 0.3 | GO:0042584 | chromaffin granule membrane(GO:0042584) |
| 0.0 | 1.3 | GO:0048786 | presynaptic active zone(GO:0048786) |
| 0.0 | 0.3 | GO:0098563 | integral component of synaptic vesicle membrane(GO:0030285) intrinsic component of synaptic vesicle membrane(GO:0098563) |
| 0.0 | 0.5 | GO:0005922 | connexon complex(GO:0005922) |
| 0.0 | 0.3 | GO:1990454 | L-type voltage-gated calcium channel complex(GO:1990454) |
| 0.0 | 0.5 | GO:0097440 | apical dendrite(GO:0097440) |
| 0.0 | 1.4 | GO:0031463 | Cul3-RING ubiquitin ligase complex(GO:0031463) |
| 0.0 | 0.3 | GO:0000242 | pericentriolar material(GO:0000242) |
| 0.0 | 0.4 | GO:0031588 | nucleotide-activated protein kinase complex(GO:0031588) |
| 0.0 | 0.4 | GO:0090568 | nuclear transcriptional repressor complex(GO:0090568) |
| 0.0 | 0.2 | GO:0031618 | nuclear pericentric heterochromatin(GO:0031618) |
| 0.0 | 0.4 | GO:0030673 | axolemma(GO:0030673) |
| 0.0 | 0.1 | GO:0097165 | nuclear stress granule(GO:0097165) |
| 0.0 | 0.1 | GO:0016013 | syntrophin complex(GO:0016013) |
| 0.0 | 0.4 | GO:0005891 | voltage-gated calcium channel complex(GO:0005891) |
| 0.0 | 0.4 | GO:0030057 | desmosome(GO:0030057) |
| 0.0 | 0.6 | GO:0008023 | transcription elongation factor complex(GO:0008023) |
| 0.0 | 1.9 | GO:0043204 | perikaryon(GO:0043204) |
| 0.0 | 0.2 | GO:0031083 | BLOC-1 complex(GO:0031083) |
| 0.0 | 0.6 | GO:0033017 | sarcoplasmic reticulum membrane(GO:0033017) |
| 0.0 | 0.4 | GO:0005719 | nuclear euchromatin(GO:0005719) |
| 0.0 | 0.1 | GO:1903439 | calcitonin family receptor complex(GO:1903439) amylin receptor complex(GO:1903440) |
| 0.0 | 0.7 | GO:0099501 | synaptic vesicle membrane(GO:0030672) exocytic vesicle membrane(GO:0099501) |
| 0.0 | 0.9 | GO:0001669 | acrosomal vesicle(GO:0001669) |
| 0.0 | 0.3 | GO:0043197 | dendritic spine(GO:0043197) |
| 0.0 | 0.3 | GO:0046658 | anchored component of plasma membrane(GO:0046658) |
| 0.0 | 0.6 | GO:0002102 | podosome(GO:0002102) |
| 0.0 | 0.0 | GO:0031213 | RSF complex(GO:0031213) |
Gene overrepresentation in molecular_function category:
| Log-likelihood per target | Total log-likelihood | Term | Description |
|---|---|---|---|
| 0.5 | 2.3 | GO:0035252 | UDP-xylosyltransferase activity(GO:0035252) xylosyltransferase activity(GO:0042285) |
| 0.3 | 1.0 | GO:0003829 | beta-1,3-galactosyl-O-glycosyl-glycoprotein beta-1,6-N-acetylglucosaminyltransferase activity(GO:0003829) |
| 0.3 | 0.9 | GO:0004960 | thromboxane receptor activity(GO:0004960) thromboxane A2 receptor activity(GO:0004961) |
| 0.3 | 1.2 | GO:0035276 | ethanol binding(GO:0035276) |
| 0.3 | 0.8 | GO:0004676 | 3-phosphoinositide-dependent protein kinase activity(GO:0004676) |
| 0.2 | 1.1 | GO:0016286 | small conductance calcium-activated potassium channel activity(GO:0016286) |
| 0.2 | 1.7 | GO:0097322 | 7SK snRNA binding(GO:0097322) |
| 0.2 | 1.7 | GO:0047144 | 2-acylglycerol-3-phosphate O-acyltransferase activity(GO:0047144) |
| 0.2 | 1.1 | GO:0004741 | [pyruvate dehydrogenase (lipoamide)] phosphatase activity(GO:0004741) |
| 0.1 | 0.7 | GO:0005052 | peroxisome matrix targeting signal-1 binding(GO:0005052) |
| 0.1 | 1.1 | GO:0004565 | beta-galactosidase activity(GO:0004565) |
| 0.1 | 1.3 | GO:0036312 | phosphatidylinositol 3-kinase regulatory subunit binding(GO:0036312) |
| 0.1 | 2.0 | GO:0001222 | transcription corepressor binding(GO:0001222) |
| 0.1 | 1.4 | GO:0001206 | transcriptional repressor activity, RNA polymerase II distal enhancer sequence-specific binding(GO:0001206) |
| 0.1 | 0.5 | GO:0004376 | glycolipid mannosyltransferase activity(GO:0004376) |
| 0.1 | 0.8 | GO:0071532 | ankyrin repeat binding(GO:0071532) |
| 0.1 | 0.6 | GO:0004525 | ribonuclease III activity(GO:0004525) double-stranded RNA-specific ribonuclease activity(GO:0032296) |
| 0.1 | 0.8 | GO:0071253 | connexin binding(GO:0071253) |
| 0.1 | 0.3 | GO:0047322 | [hydroxymethylglutaryl-CoA reductase (NADPH)] kinase activity(GO:0047322) [acetyl-CoA carboxylase] kinase activity(GO:0050405) |
| 0.1 | 0.7 | GO:0015166 | polyol transmembrane transporter activity(GO:0015166) |
| 0.1 | 0.4 | GO:0004974 | leukotriene receptor activity(GO:0004974) |
| 0.1 | 0.5 | GO:0004118 | cGMP-stimulated cyclic-nucleotide phosphodiesterase activity(GO:0004118) |
| 0.1 | 0.4 | GO:0015501 | glutamate:sodium symporter activity(GO:0015501) |
| 0.1 | 0.7 | GO:0042301 | phosphate ion binding(GO:0042301) |
| 0.1 | 0.6 | GO:0060002 | plus-end directed microfilament motor activity(GO:0060002) |
| 0.1 | 2.4 | GO:0015175 | neutral amino acid transmembrane transporter activity(GO:0015175) |
| 0.1 | 1.5 | GO:0042813 | Wnt-activated receptor activity(GO:0042813) |
| 0.1 | 1.2 | GO:0070411 | I-SMAD binding(GO:0070411) |
| 0.1 | 0.7 | GO:0005243 | gap junction channel activity(GO:0005243) |
| 0.1 | 0.2 | GO:0035939 | microsatellite binding(GO:0035939) |
| 0.1 | 0.7 | GO:0003836 | beta-galactoside (CMP) alpha-2,3-sialyltransferase activity(GO:0003836) |
| 0.1 | 0.2 | GO:0004594 | pantothenate kinase activity(GO:0004594) |
| 0.1 | 1.3 | GO:0043548 | phosphatidylinositol 3-kinase binding(GO:0043548) |
| 0.1 | 0.7 | GO:0055056 | D-glucose transmembrane transporter activity(GO:0055056) |
| 0.0 | 0.2 | GO:0030375 | thyroid hormone receptor activator activity(GO:0010861) thyroid hormone receptor coactivator activity(GO:0030375) |
| 0.0 | 1.2 | GO:0000062 | fatty-acyl-CoA binding(GO:0000062) |
| 0.0 | 0.7 | GO:0004535 | poly(A)-specific ribonuclease activity(GO:0004535) |
| 0.0 | 0.5 | GO:0004985 | opioid receptor activity(GO:0004985) |
| 0.0 | 1.7 | GO:0005245 | voltage-gated calcium channel activity(GO:0005245) |
| 0.0 | 0.3 | GO:0016846 | carbon-sulfur lyase activity(GO:0016846) |
| 0.0 | 1.2 | GO:0004709 | MAP kinase kinase kinase activity(GO:0004709) |
| 0.0 | 1.2 | GO:0001671 | ATPase activator activity(GO:0001671) |
| 0.0 | 0.8 | GO:0070006 | metalloaminopeptidase activity(GO:0070006) |
| 0.0 | 0.6 | GO:1905030 | voltage-gated sodium channel activity(GO:0005248) voltage-gated ion channel activity involved in regulation of postsynaptic membrane potential(GO:1905030) |
| 0.0 | 0.7 | GO:0031489 | myosin V binding(GO:0031489) |
| 0.0 | 0.5 | GO:0017154 | semaphorin receptor activity(GO:0017154) |
| 0.0 | 1.7 | GO:0004402 | histone acetyltransferase activity(GO:0004402) |
| 0.0 | 0.3 | GO:0001075 | transcription factor activity, RNA polymerase II core promoter sequence-specific binding involved in preinitiation complex assembly(GO:0001075) |
| 0.0 | 0.1 | GO:0046899 | nucleoside triphosphate adenylate kinase activity(GO:0046899) |
| 0.0 | 0.4 | GO:0031698 | beta-2 adrenergic receptor binding(GO:0031698) |
| 0.0 | 0.4 | GO:0003906 | DNA-(apurinic or apyrimidinic site) lyase activity(GO:0003906) |
| 0.0 | 0.2 | GO:0017151 | DEAD/H-box RNA helicase binding(GO:0017151) |
| 0.0 | 0.9 | GO:0003785 | actin monomer binding(GO:0003785) |
| 0.0 | 0.3 | GO:0031702 | angiotensin receptor binding(GO:0031701) type 1 angiotensin receptor binding(GO:0031702) |
| 0.0 | 0.2 | GO:0001730 | 2'-5'-oligoadenylate synthetase activity(GO:0001730) |
| 0.0 | 0.2 | GO:0016413 | O-acetyltransferase activity(GO:0016413) |
| 0.0 | 0.1 | GO:0004948 | calcitonin receptor activity(GO:0004948) |
| 0.0 | 0.3 | GO:0004143 | diacylglycerol kinase activity(GO:0004143) |
| 0.0 | 0.3 | GO:0000983 | transcription factor activity, RNA polymerase II core promoter sequence-specific(GO:0000983) |
| 0.0 | 1.8 | GO:0003705 | transcription factor activity, RNA polymerase II distal enhancer sequence-specific binding(GO:0003705) |
| 0.0 | 0.4 | GO:0003746 | translation elongation factor activity(GO:0003746) |
| 0.0 | 0.6 | GO:0004683 | calmodulin-dependent protein kinase activity(GO:0004683) |
| 0.0 | 0.5 | GO:0004364 | glutathione transferase activity(GO:0004364) |
| 0.0 | 1.8 | GO:0001078 | transcriptional repressor activity, RNA polymerase II core promoter proximal region sequence-specific binding(GO:0001078) |
| 0.0 | 0.3 | GO:0000146 | microfilament motor activity(GO:0000146) |
| 0.0 | 0.5 | GO:0005484 | SNAP receptor activity(GO:0005484) |
| 0.0 | 1.7 | GO:0017124 | SH3 domain binding(GO:0017124) |
| 0.0 | 0.5 | GO:0015485 | cholesterol binding(GO:0015485) |
| 0.0 | 0.3 | GO:0004012 | phospholipid-translocating ATPase activity(GO:0004012) |
Gene overrepresentation in C2:CP category:
| Log-likelihood per target | Total log-likelihood | Term | Description |
|---|---|---|---|
| 0.1 | 3.2 | PID IL8 CXCR1 PATHWAY | IL8- and CXCR1-mediated signaling events |
| 0.1 | 1.2 | PID TCR JNK PATHWAY | JNK signaling in the CD4+ TCR pathway |
| 0.0 | 0.8 | ST STAT3 PATHWAY | STAT3 Pathway |
| 0.0 | 1.2 | PID BETA CATENIN DEG PATHWAY | Degradation of beta catenin |
| 0.0 | 0.9 | PID WNT SIGNALING PATHWAY | Wnt signaling network |
| 0.0 | 1.0 | ST WNT CA2 CYCLIC GMP PATHWAY | Wnt/Ca2+/cyclic GMP signaling. |
| 0.0 | 0.3 | PID S1P S1P4 PATHWAY | S1P4 pathway |
| 0.0 | 0.6 | SA REG CASCADE OF CYCLIN EXPR | Expression of cyclins regulates progression through the cell cycle by activating cyclin-dependent kinases. |
| 0.0 | 1.7 | PID AR TF PATHWAY | Regulation of Androgen receptor activity |
| 0.0 | 0.8 | PID HIF1A PATHWAY | Hypoxic and oxygen homeostasis regulation of HIF-1-alpha |
| 0.0 | 1.6 | PID ILK PATHWAY | Integrin-linked kinase signaling |
| 0.0 | 1.7 | SIG INSULIN RECEPTOR PATHWAY IN CARDIAC MYOCYTES | Genes related to the insulin receptor pathway |
| 0.0 | 0.5 | PID EPHA FWDPATHWAY | EPHA forward signaling |
| 0.0 | 0.3 | PID WNT NONCANONICAL PATHWAY | Noncanonical Wnt signaling pathway |
| 0.0 | 0.8 | NABA PROTEOGLYCANS | Genes encoding proteoglycans |
| 0.0 | 0.6 | ST GA13 PATHWAY | G alpha 13 Pathway |
Gene overrepresentation in C2:CP:REACTOME category:
| Log-likelihood per target | Total log-likelihood | Term | Description |
|---|---|---|---|
| 0.1 | 2.1 | REACTOME SPRY REGULATION OF FGF SIGNALING | Genes involved in Spry regulation of FGF signaling |
| 0.1 | 0.9 | REACTOME PROSTANOID LIGAND RECEPTORS | Genes involved in Prostanoid ligand receptors |
| 0.1 | 0.6 | REACTOME MICRORNA MIRNA BIOGENESIS | Genes involved in MicroRNA (miRNA) Biogenesis |
| 0.1 | 1.7 | REACTOME ACYL CHAIN REMODELLING OF PE | Genes involved in Acyl chain remodelling of PE |
| 0.1 | 1.1 | REACTOME REGULATION OF PYRUVATE DEHYDROGENASE PDH COMPLEX | Genes involved in Regulation of pyruvate dehydrogenase (PDH) complex |
| 0.1 | 1.2 | REACTOME CTNNB1 PHOSPHORYLATION CASCADE | Genes involved in Beta-catenin phosphorylation cascade |
| 0.1 | 0.4 | REACTOME EICOSANOID LIGAND BINDING RECEPTORS | Genes involved in Eicosanoid ligand-binding receptors |
| 0.1 | 2.4 | REACTOME AMINO ACID TRANSPORT ACROSS THE PLASMA MEMBRANE | Genes involved in Amino acid transport across the plasma membrane |
| 0.1 | 0.3 | REACTOME THROMBOXANE SIGNALLING THROUGH TP RECEPTOR | Genes involved in Thromboxane signalling through TP receptor |
| 0.1 | 0.6 | REACTOME CDC6 ASSOCIATION WITH THE ORC ORIGIN COMPLEX | Genes involved in CDC6 association with the ORC:origin complex |
| 0.1 | 1.4 | REACTOME CRMPS IN SEMA3A SIGNALING | Genes involved in CRMPs in Sema3A signaling |
| 0.1 | 0.7 | REACTOME VITAMIN B5 PANTOTHENATE METABOLISM | Genes involved in Vitamin B5 (pantothenate) metabolism |
| 0.0 | 1.6 | REACTOME KERATAN SULFATE BIOSYNTHESIS | Genes involved in Keratan sulfate biosynthesis |
| 0.0 | 1.2 | REACTOME BRANCHED CHAIN AMINO ACID CATABOLISM | Genes involved in Branched-chain amino acid catabolism |
| 0.0 | 1.6 | REACTOME A TETRASACCHARIDE LINKER SEQUENCE IS REQUIRED FOR GAG SYNTHESIS | Genes involved in A tetrasaccharide linker sequence is required for GAG synthesis |
| 0.0 | 1.7 | REACTOME ELONGATION ARREST AND RECOVERY | Genes involved in Elongation arrest and recovery |
| 0.0 | 0.3 | REACTOME INHIBITION OF INSULIN SECRETION BY ADRENALINE NORADRENALINE | Genes involved in Inhibition of Insulin Secretion by Adrenaline/Noradrenaline |
| 0.0 | 0.8 | REACTOME CTLA4 INHIBITORY SIGNALING | Genes involved in CTLA4 inhibitory signaling |
| 0.0 | 0.7 | REACTOME FACILITATIVE NA INDEPENDENT GLUCOSE TRANSPORTERS | Genes involved in Facilitative Na+-independent glucose transporters |
| 0.0 | 1.0 | REACTOME O LINKED GLYCOSYLATION OF MUCINS | Genes involved in O-linked glycosylation of mucins |
| 0.0 | 1.4 | REACTOME TRAFFICKING OF AMPA RECEPTORS | Genes involved in Trafficking of AMPA receptors |
| 0.0 | 0.5 | REACTOME GAP JUNCTION ASSEMBLY | Genes involved in Gap junction assembly |
| 0.0 | 0.5 | REACTOME TRAF3 DEPENDENT IRF ACTIVATION PATHWAY | Genes involved in TRAF3-dependent IRF activation pathway |
| 0.0 | 1.3 | REACTOME G ALPHA Z SIGNALLING EVENTS | Genes involved in G alpha (z) signalling events |
| 0.0 | 0.8 | REACTOME REGULATION OF HYPOXIA INDUCIBLE FACTOR HIF BY OXYGEN | Genes involved in Regulation of Hypoxia-inducible Factor (HIF) by Oxygen |
| 0.0 | 0.5 | REACTOME SYNTHESIS OF GLYCOSYLPHOSPHATIDYLINOSITOL GPI | Genes involved in Synthesis of glycosylphosphatidylinositol (GPI) |
| 0.0 | 0.8 | REACTOME DEGRADATION OF THE EXTRACELLULAR MATRIX | Genes involved in Degradation of the extracellular matrix |
| 0.0 | 0.6 | REACTOME INTERACTION BETWEEN L1 AND ANKYRINS | Genes involved in Interaction between L1 and Ankyrins |
| 0.0 | 0.4 | REACTOME AMINO ACID AND OLIGOPEPTIDE SLC TRANSPORTERS | Genes involved in Amino acid and oligopeptide SLC transporters |
| 0.0 | 0.2 | REACTOME MRNA DECAY BY 5 TO 3 EXORIBONUCLEASE | Genes involved in mRNA Decay by 5' to 3' Exoribonuclease |
| 0.0 | 1.5 | REACTOME CLASS B 2 SECRETIN FAMILY RECEPTORS | Genes involved in Class B/2 (Secretin family receptors) |
| 0.0 | 0.8 | REACTOME SIGNALING BY ROBO RECEPTOR | Genes involved in Signaling by Robo receptor |
| 0.0 | 0.3 | REACTOME REGULATION OF RHEB GTPASE ACTIVITY BY AMPK | Genes involved in Regulation of Rheb GTPase activity by AMPK |
| 0.0 | 0.5 | REACTOME REGULATION OF BETA CELL DEVELOPMENT | Genes involved in Regulation of beta-cell development |
| 0.0 | 0.5 | REACTOME CGMP EFFECTS | Genes involved in cGMP effects |
| 0.0 | 0.3 | REACTOME RNA POL III TRANSCRIPTION INITIATION FROM TYPE 3 PROMOTER | Genes involved in RNA Polymerase III Transcription Initiation From Type 3 Promoter |
| 0.0 | 1.1 | REACTOME POTASSIUM CHANNELS | Genes involved in Potassium Channels |