Project
GNF SymAtlas + NCI-60 cancer cell lines, comparison of cancers vs non-cancers, human (Su, 2004; Ross, 2000)
Navigation
Downloads
Results for GGCAGUG
Z-value: 0.97
Motif logo

miRNA associated with seed GGCAGUG
| Name | miRBASE accession |
|---|---|
|
hsa-miR-34a-5p
|
MIMAT0000255 |
|
hsa-miR-34c-5p
|
MIMAT0000686 |
|
hsa-miR-449a
|
MIMAT0001541 |
|
hsa-miR-449b-5p
|
MIMAT0003327 |
Activity profile of GGCAGUG motif
Sorted Z-values of GGCAGUG motif
| Promoter | Log-likelihood | Transcript | Gene | Gene Info |
|---|---|---|---|---|
| chr20_+_10199468 | 29.59 |
ENST00000254976.2
ENST00000304886.2 |
SNAP25
|
synaptosomal-associated protein, 25kDa |
| chrX_+_64708615 | 27.91 |
ENST00000338957.4
ENST00000423889.3 |
ZC3H12B
|
zinc finger CCCH-type containing 12B |
| chr12_+_79258547 | 25.87 |
ENST00000457153.2
|
SYT1
|
synaptotagmin I |
| chr10_+_105036909 | 22.72 |
ENST00000369849.4
|
INA
|
internexin neuronal intermediate filament protein, alpha |
| chr17_-_8066250 | 18.46 |
ENST00000488857.1
ENST00000481878.1 ENST00000316509.6 ENST00000498285.1 |
VAMP2
RP11-599B13.6
|
vesicle-associated membrane protein 2 (synaptobrevin 2) Uncharacterized protein |
| chr2_+_203499901 | 17.65 |
ENST00000303116.6
ENST00000392238.2 |
FAM117B
|
family with sequence similarity 117, member B |
| chr9_-_104249319 | 17.02 |
ENST00000374847.1
|
TMEM246
|
transmembrane protein 246 |
| chr8_+_11141925 | 16.88 |
ENST00000221086.3
|
MTMR9
|
myotubularin related protein 9 |
| chr16_+_56225248 | 15.66 |
ENST00000262493.6
|
GNAO1
|
guanine nucleotide binding protein (G protein), alpha activating activity polypeptide O |
| chr17_+_43971643 | 15.42 |
ENST00000344290.5
ENST00000262410.5 ENST00000351559.5 ENST00000340799.5 ENST00000535772.1 ENST00000347967.5 |
MAPT
|
microtubule-associated protein tau |
| chr5_-_11904152 | 14.77 |
ENST00000304623.8
ENST00000458100.2 |
CTNND2
|
catenin (cadherin-associated protein), delta 2 |
| chr20_+_37434329 | 14.76 |
ENST00000299824.1
ENST00000373331.2 |
PPP1R16B
|
protein phosphatase 1, regulatory subunit 16B |
| chr1_+_160085501 | 14.56 |
ENST00000361216.3
|
ATP1A2
|
ATPase, Na+/K+ transporting, alpha 2 polypeptide |
| chr9_-_101471479 | 13.92 |
ENST00000259455.2
|
GABBR2
|
gamma-aminobutyric acid (GABA) B receptor, 2 |
| chr19_+_18794470 | 12.88 |
ENST00000321949.8
ENST00000338797.6 |
CRTC1
|
CREB regulated transcription coactivator 1 |
| chr3_-_18466787 | 12.00 |
ENST00000338745.6
ENST00000450898.1 |
SATB1
|
SATB homeobox 1 |
| chr1_-_41131326 | 11.97 |
ENST00000372684.3
|
RIMS3
|
regulating synaptic membrane exocytosis 3 |
| chr17_+_40834580 | 11.82 |
ENST00000264638.4
|
CNTNAP1
|
contactin associated protein 1 |
| chr10_-_62149433 | 11.24 |
ENST00000280772.2
|
ANK3
|
ankyrin 3, node of Ranvier (ankyrin G) |
| chr19_-_46296011 | 11.13 |
ENST00000377735.3
ENST00000270223.6 |
DMWD
|
dystrophia myotonica, WD repeat containing |
| chr6_-_6007200 | 11.05 |
ENST00000244766.2
|
NRN1
|
neuritin 1 |
| chr14_-_77843390 | 10.81 |
ENST00000216468.7
|
TMED8
|
transmembrane emp24 protein transport domain containing 8 |
| chr6_+_31795506 | 10.80 |
ENST00000375650.3
|
HSPA1B
|
heat shock 70kDa protein 1B |
| chr15_+_43803143 | 10.60 |
ENST00000382031.1
|
MAP1A
|
microtubule-associated protein 1A |
| chr8_+_42752053 | 10.01 |
ENST00000307602.4
|
HOOK3
|
hook microtubule-tethering protein 3 |
| chr2_-_201936302 | 9.57 |
ENST00000453765.1
ENST00000452799.1 ENST00000446678.1 ENST00000418596.3 |
FAM126B
|
family with sequence similarity 126, member B |
| chr1_+_28052456 | 9.56 |
ENST00000373954.6
ENST00000419687.2 |
FAM76A
|
family with sequence similarity 76, member A |
| chr9_-_86571628 | 9.54 |
ENST00000376344.3
|
C9orf64
|
chromosome 9 open reading frame 64 |
| chr9_+_126773880 | 9.35 |
ENST00000373615.4
|
LHX2
|
LIM homeobox 2 |
| chr2_+_239335449 | 9.08 |
ENST00000264607.4
|
ASB1
|
ankyrin repeat and SOCS box containing 1 |
| chr7_+_138916231 | 9.03 |
ENST00000473989.3
ENST00000288561.8 |
UBN2
|
ubinuclein 2 |
| chr4_+_47033345 | 9.03 |
ENST00000295454.3
|
GABRB1
|
gamma-aminobutyric acid (GABA) A receptor, beta 1 |
| chr11_-_118047376 | 8.96 |
ENST00000278947.5
|
SCN2B
|
sodium channel, voltage-gated, type II, beta subunit |
| chr4_+_113970772 | 8.91 |
ENST00000504454.1
ENST00000394537.3 ENST00000357077.4 ENST00000264366.6 |
ANK2
|
ankyrin 2, neuronal |
| chr3_-_128879875 | 8.50 |
ENST00000418265.1
ENST00000393292.3 ENST00000273541.8 |
ISY1-RAB43
ISY1
|
ISY1-RAB43 readthrough ISY1 splicing factor homolog (S. cerevisiae) |
| chr8_-_18871159 | 8.47 |
ENST00000327040.8
ENST00000440756.2 |
PSD3
|
pleckstrin and Sec7 domain containing 3 |
| chr2_+_26915584 | 8.43 |
ENST00000302909.3
|
KCNK3
|
potassium channel, subfamily K, member 3 |
| chr11_-_64410787 | 8.21 |
ENST00000301894.2
|
NRXN2
|
neurexin 2 |
| chr7_+_87563458 | 8.20 |
ENST00000398204.4
|
ADAM22
|
ADAM metallopeptidase domain 22 |
| chr1_+_84543734 | 8.07 |
ENST00000370689.2
|
PRKACB
|
protein kinase, cAMP-dependent, catalytic, beta |
| chr11_-_134281812 | 7.92 |
ENST00000392580.1
ENST00000312527.4 |
B3GAT1
|
beta-1,3-glucuronyltransferase 1 (glucuronosyltransferase P) |
| chr17_-_61777459 | 7.87 |
ENST00000578993.1
ENST00000583211.1 ENST00000259006.3 |
LIMD2
|
LIM domain containing 2 |
| chr7_-_44924939 | 7.77 |
ENST00000395699.2
|
PURB
|
purine-rich element binding protein B |
| chr12_+_107168342 | 7.76 |
ENST00000392837.4
|
RIC8B
|
RIC8 guanine nucleotide exchange factor B |
| chr11_-_62369291 | 7.59 |
ENST00000278823.2
|
MTA2
|
metastasis associated 1 family, member 2 |
| chr7_-_103629963 | 7.53 |
ENST00000428762.1
ENST00000343529.5 ENST00000424685.2 |
RELN
|
reelin |
| chr1_+_205012293 | 7.41 |
ENST00000331830.4
|
CNTN2
|
contactin 2 (axonal) |
| chr8_-_96281419 | 7.38 |
ENST00000286688.5
|
C8orf37
|
chromosome 8 open reading frame 37 |
| chr1_-_21978312 | 7.35 |
ENST00000359708.4
ENST00000290101.4 |
RAP1GAP
|
RAP1 GTPase activating protein |
| chr1_+_162039558 | 7.33 |
ENST00000530878.1
ENST00000361897.5 |
NOS1AP
|
nitric oxide synthase 1 (neuronal) adaptor protein |
| chr11_-_46722117 | 7.09 |
ENST00000311956.4
|
ARHGAP1
|
Rho GTPase activating protein 1 |
| chr9_+_34958254 | 7.09 |
ENST00000242315.3
|
KIAA1045
|
KIAA1045 |
| chr14_+_24583836 | 7.00 |
ENST00000559115.1
ENST00000558215.1 ENST00000557810.1 ENST00000561375.1 ENST00000446197.3 ENST00000559796.1 ENST00000560713.1 ENST00000560901.1 ENST00000559382.1 |
DCAF11
|
DDB1 and CUL4 associated factor 11 |
| chr9_-_138799070 | 6.74 |
ENST00000389532.4
ENST00000409386.3 |
CAMSAP1
|
calmodulin regulated spectrin-associated protein 1 |
| chr17_-_71640227 | 6.68 |
ENST00000388726.3
ENST00000392650.3 |
SDK2
|
sidekick cell adhesion molecule 2 |
| chr17_-_41977964 | 6.67 |
ENST00000377184.3
|
MPP2
|
membrane protein, palmitoylated 2 (MAGUK p55 subfamily member 2) |
| chrX_+_23352133 | 6.61 |
ENST00000379361.4
|
PTCHD1
|
patched domain containing 1 |
| chr13_-_27334879 | 6.61 |
ENST00000405846.3
|
GPR12
|
G protein-coupled receptor 12 |
| chr3_-_114790179 | 6.60 |
ENST00000462705.1
|
ZBTB20
|
zinc finger and BTB domain containing 20 |
| chr17_-_62207485 | 6.59 |
ENST00000433197.3
|
ERN1
|
endoplasmic reticulum to nucleus signaling 1 |
| chr3_+_138066539 | 6.45 |
ENST00000289104.4
|
MRAS
|
muscle RAS oncogene homolog |
| chrX_-_18372792 | 6.45 |
ENST00000251900.4
|
SCML2
|
sex comb on midleg-like 2 (Drosophila) |
| chr11_+_92085262 | 6.38 |
ENST00000298047.6
ENST00000409404.2 ENST00000541502.1 |
FAT3
|
FAT atypical cadherin 3 |
| chr2_+_61404624 | 6.22 |
ENST00000394457.3
|
AHSA2
|
AHA1, activator of heat shock 90kDa protein ATPase homolog 2 (yeast) |
| chr18_-_65184217 | 6.16 |
ENST00000310045.7
|
DSEL
|
dermatan sulfate epimerase-like |
| chr2_+_16080659 | 6.09 |
ENST00000281043.3
|
MYCN
|
v-myc avian myelocytomatosis viral oncogene neuroblastoma derived homolog |
| chr5_+_172483347 | 5.99 |
ENST00000522692.1
ENST00000296953.2 ENST00000540014.1 ENST00000520420.1 |
CREBRF
|
CREB3 regulatory factor |
| chr11_+_107461948 | 5.99 |
ENST00000265840.7
ENST00000443271.2 |
ELMOD1
|
ELMO/CED-12 domain containing 1 |
| chr17_+_29718642 | 5.97 |
ENST00000325874.8
|
RAB11FIP4
|
RAB11 family interacting protein 4 (class II) |
| chr9_-_135996537 | 5.77 |
ENST00000372050.3
ENST00000372047.3 |
RALGDS
|
ral guanine nucleotide dissociation stimulator |
| chr9_-_122131696 | 5.74 |
ENST00000373964.2
ENST00000265922.3 |
BRINP1
|
bone morphogenetic protein/retinoic acid inducible neural-specific 1 |
| chr17_+_2240775 | 5.71 |
ENST00000268989.3
ENST00000426855.2 |
SGSM2
|
small G protein signaling modulator 2 |
| chr7_-_139876812 | 5.65 |
ENST00000397560.2
|
JHDM1D
|
lysine (K)-specific demethylase 7A |
| chr5_-_132299313 | 5.58 |
ENST00000265343.5
|
AFF4
|
AF4/FMR2 family, member 4 |
| chr12_+_74931551 | 5.53 |
ENST00000519948.2
|
ATXN7L3B
|
ataxin 7-like 3B |
| chr17_-_1083078 | 5.45 |
ENST00000574266.1
ENST00000302538.5 |
ABR
|
active BCR-related |
| chr12_-_58135903 | 5.33 |
ENST00000257897.3
|
AGAP2
|
ArfGAP with GTPase domain, ankyrin repeat and PH domain 2 |
| chr11_-_22851367 | 5.32 |
ENST00000354193.4
|
SVIP
|
small VCP/p97-interacting protein |
| chr11_+_64794875 | 5.28 |
ENST00000377244.3
ENST00000534637.1 ENST00000524831.1 |
SNX15
|
sorting nexin 15 |
| chr1_-_151688528 | 5.27 |
ENST00000290585.4
|
CELF3
|
CUGBP, Elav-like family member 3 |
| chr3_+_39851094 | 5.27 |
ENST00000302541.6
|
MYRIP
|
myosin VIIA and Rab interacting protein |
| chr14_+_29234870 | 5.27 |
ENST00000382535.3
|
FOXG1
|
forkhead box G1 |
| chr14_-_75389975 | 5.25 |
ENST00000555647.1
ENST00000557413.1 |
RPS6KL1
|
ribosomal protein S6 kinase-like 1 |
| chr19_-_6279932 | 5.21 |
ENST00000252674.7
|
MLLT1
|
myeloid/lymphoid or mixed-lineage leukemia (trithorax homolog, Drosophila); translocated to, 1 |
| chr19_-_2783363 | 5.18 |
ENST00000221566.2
|
SGTA
|
small glutamine-rich tetratricopeptide repeat (TPR)-containing, alpha |
| chr16_+_30077055 | 5.06 |
ENST00000564595.2
ENST00000569798.1 |
ALDOA
|
aldolase A, fructose-bisphosphate |
| chr16_+_66878814 | 4.98 |
ENST00000394069.3
|
CA7
|
carbonic anhydrase VII |
| chr14_-_75593708 | 4.97 |
ENST00000557673.1
ENST00000238616.5 |
NEK9
|
NIMA-related kinase 9 |
| chr12_+_27396901 | 4.97 |
ENST00000541191.1
ENST00000389032.3 |
STK38L
|
serine/threonine kinase 38 like |
| chr9_-_3525968 | 4.96 |
ENST00000382004.3
ENST00000302303.1 ENST00000449190.1 |
RFX3
|
regulatory factor X, 3 (influences HLA class II expression) |
| chr5_+_149109825 | 4.91 |
ENST00000360453.4
ENST00000394320.3 ENST00000309241.5 |
PPARGC1B
|
peroxisome proliferator-activated receptor gamma, coactivator 1 beta |
| chr22_-_38902325 | 4.91 |
ENST00000396821.3
ENST00000381633.3 |
DDX17
|
DEAD (Asp-Glu-Ala-Asp) box helicase 17 |
| chr6_-_110500905 | 4.85 |
ENST00000392587.2
|
WASF1
|
WAS protein family, member 1 |
| chr14_-_99737565 | 4.70 |
ENST00000357195.3
|
BCL11B
|
B-cell CLL/lymphoma 11B (zinc finger protein) |
| chr9_+_102668915 | 4.66 |
ENST00000259400.6
ENST00000531035.1 ENST00000525640.1 ENST00000534052.1 ENST00000526607.1 |
STX17
|
syntaxin 17 |
| chr1_-_154474589 | 4.63 |
ENST00000304760.2
|
SHE
|
Src homology 2 domain containing E |
| chr9_-_139440314 | 4.62 |
ENST00000277541.6
|
NOTCH1
|
notch 1 |
| chr11_-_119599794 | 4.59 |
ENST00000264025.3
|
PVRL1
|
poliovirus receptor-related 1 (herpesvirus entry mediator C) |
| chr2_-_157189180 | 4.58 |
ENST00000539077.1
ENST00000424077.1 ENST00000426264.1 ENST00000339562.4 ENST00000421709.1 |
NR4A2
|
nuclear receptor subfamily 4, group A, member 2 |
| chr1_+_66797687 | 4.57 |
ENST00000371045.5
ENST00000531025.1 ENST00000526197.1 |
PDE4B
|
phosphodiesterase 4B, cAMP-specific |
| chr22_+_29469012 | 4.56 |
ENST00000400335.4
ENST00000400338.2 |
KREMEN1
|
kringle containing transmembrane protein 1 |
| chr14_+_23299088 | 4.56 |
ENST00000355151.5
ENST00000397496.3 ENST00000555345.1 ENST00000432849.3 ENST00000553711.1 ENST00000556465.1 ENST00000397505.2 ENST00000557221.1 ENST00000311892.6 ENST00000556840.1 ENST00000555536.1 |
MRPL52
|
mitochondrial ribosomal protein L52 |
| chr17_-_37382105 | 4.55 |
ENST00000333461.5
|
STAC2
|
SH3 and cysteine rich domain 2 |
| chr17_-_31620006 | 4.48 |
ENST00000225823.2
|
ASIC2
|
acid-sensing (proton-gated) ion channel 2 |
| chr3_+_38495333 | 4.46 |
ENST00000352511.4
|
ACVR2B
|
activin A receptor, type IIB |
| chr17_-_1420182 | 4.43 |
ENST00000421807.2
|
INPP5K
|
inositol polyphosphate-5-phosphatase K |
| chr9_+_103204553 | 4.38 |
ENST00000502978.1
ENST00000334943.6 |
MSANTD3-TMEFF1
TMEFF1
|
MSANTD3-TMEFF1 readthrough transmembrane protein with EGF-like and two follistatin-like domains 1 |
| chr6_+_96463840 | 4.36 |
ENST00000302103.5
|
FUT9
|
fucosyltransferase 9 (alpha (1,3) fucosyltransferase) |
| chr7_-_71801980 | 4.33 |
ENST00000329008.5
|
CALN1
|
calneuron 1 |
| chr2_+_48541776 | 4.29 |
ENST00000413569.1
ENST00000340553.3 |
FOXN2
|
forkhead box N2 |
| chr10_+_95517566 | 4.29 |
ENST00000542308.1
|
LGI1
|
leucine-rich, glioma inactivated 1 |
| chr19_+_54371114 | 4.29 |
ENST00000448420.1
ENST00000439000.1 ENST00000391770.4 ENST00000391771.1 |
MYADM
|
myeloid-associated differentiation marker |
| chr3_+_50712672 | 4.25 |
ENST00000266037.9
|
DOCK3
|
dedicator of cytokinesis 3 |
| chr1_+_160175117 | 4.17 |
ENST00000360472.4
|
PEA15
|
phosphoprotein enriched in astrocytes 15 |
| chr20_+_42875887 | 4.12 |
ENST00000342560.5
|
GDAP1L1
|
ganglioside induced differentiation associated protein 1-like 1 |
| chr12_-_93323013 | 4.06 |
ENST00000322349.8
|
EEA1
|
early endosome antigen 1 |
| chr17_+_42836329 | 4.03 |
ENST00000200557.6
|
ADAM11
|
ADAM metallopeptidase domain 11 |
| chr12_-_49504655 | 3.95 |
ENST00000551782.1
ENST00000267102.8 |
LMBR1L
|
limb development membrane protein 1-like |
| chr5_+_175223313 | 3.90 |
ENST00000359546.4
|
CPLX2
|
complexin 2 |
| chr11_-_2906979 | 3.89 |
ENST00000380725.1
ENST00000313407.6 ENST00000430149.2 ENST00000440480.2 ENST00000414822.3 |
CDKN1C
|
cyclin-dependent kinase inhibitor 1C (p57, Kip2) |
| chr2_+_24272543 | 3.88 |
ENST00000380991.4
|
FKBP1B
|
FK506 binding protein 1B, 12.6 kDa |
| chr8_-_133493200 | 3.80 |
ENST00000388996.4
|
KCNQ3
|
potassium voltage-gated channel, KQT-like subfamily, member 3 |
| chr19_-_14316980 | 3.80 |
ENST00000361434.3
ENST00000340736.6 |
LPHN1
|
latrophilin 1 |
| chr5_+_176560742 | 3.71 |
ENST00000439151.2
|
NSD1
|
nuclear receptor binding SET domain protein 1 |
| chr8_-_82024290 | 3.68 |
ENST00000220597.4
|
PAG1
|
phosphoprotein associated with glycosphingolipid microdomains 1 |
| chr3_-_50540854 | 3.56 |
ENST00000423994.2
ENST00000424201.2 ENST00000479441.1 ENST00000429770.1 |
CACNA2D2
|
calcium channel, voltage-dependent, alpha 2/delta subunit 2 |
| chr11_+_66025167 | 3.54 |
ENST00000394067.2
ENST00000316924.5 ENST00000421552.1 ENST00000394078.1 |
KLC2
|
kinesin light chain 2 |
| chr11_-_9025541 | 3.46 |
ENST00000525100.1
ENST00000309166.3 ENST00000531090.1 |
NRIP3
|
nuclear receptor interacting protein 3 |
| chr4_+_94750014 | 3.37 |
ENST00000306011.3
|
ATOH1
|
atonal homolog 1 (Drosophila) |
| chr17_+_46125707 | 3.36 |
ENST00000584137.1
ENST00000362042.3 ENST00000585291.1 ENST00000357480.5 |
NFE2L1
|
nuclear factor, erythroid 2-like 1 |
| chr5_-_175964366 | 3.34 |
ENST00000274811.4
|
RNF44
|
ring finger protein 44 |
| chr9_-_89562104 | 3.32 |
ENST00000298743.7
|
GAS1
|
growth arrest-specific 1 |
| chr2_-_166930131 | 3.28 |
ENST00000303395.4
ENST00000409050.1 ENST00000423058.2 ENST00000375405.3 |
SCN1A
|
sodium channel, voltage-gated, type I, alpha subunit |
| chr7_+_142985308 | 3.28 |
ENST00000310447.5
|
CASP2
|
caspase 2, apoptosis-related cysteine peptidase |
| chr17_+_33448593 | 3.27 |
ENST00000158009.5
|
FNDC8
|
fibronectin type III domain containing 8 |
| chr13_+_42622781 | 3.24 |
ENST00000337343.4
ENST00000261491.5 ENST00000379274.2 |
DGKH
|
diacylglycerol kinase, eta |
| chr2_+_45168875 | 3.23 |
ENST00000260653.3
|
SIX3
|
SIX homeobox 3 |
| chr9_+_103235365 | 3.19 |
ENST00000374879.4
|
TMEFF1
|
transmembrane protein with EGF-like and two follistatin-like domains 1 |
| chr5_+_49961727 | 3.17 |
ENST00000505697.2
ENST00000503750.2 ENST00000514342.2 |
PARP8
|
poly (ADP-ribose) polymerase family, member 8 |
| chr6_+_136172820 | 3.13 |
ENST00000308191.6
|
PDE7B
|
phosphodiesterase 7B |
| chr3_-_53381539 | 3.04 |
ENST00000606822.1
ENST00000294241.6 ENST00000607628.1 |
DCP1A
|
decapping mRNA 1A |
| chr17_+_12692774 | 3.01 |
ENST00000379672.5
ENST00000340825.3 |
ARHGAP44
|
Rho GTPase activating protein 44 |
| chr20_+_49348081 | 2.99 |
ENST00000371610.2
|
PARD6B
|
par-6 family cell polarity regulator beta |
| chr22_-_29784519 | 2.93 |
ENST00000357586.2
ENST00000356015.2 ENST00000432560.2 ENST00000317368.7 |
AP1B1
|
adaptor-related protein complex 1, beta 1 subunit |
| chr11_+_31391381 | 2.90 |
ENST00000465995.1
ENST00000536040.1 |
DNAJC24
|
DnaJ (Hsp40) homolog, subfamily C, member 24 |
| chr4_+_124320665 | 2.88 |
ENST00000394339.2
|
SPRY1
|
sprouty homolog 1, antagonist of FGF signaling (Drosophila) |
| chr2_+_105471969 | 2.87 |
ENST00000361360.2
|
POU3F3
|
POU class 3 homeobox 3 |
| chr5_-_150948414 | 2.86 |
ENST00000261800.5
|
FAT2
|
FAT atypical cadherin 2 |
| chr3_+_113251143 | 2.84 |
ENST00000264852.4
ENST00000393830.3 |
SIDT1
|
SID1 transmembrane family, member 1 |
| chr4_+_144257915 | 2.79 |
ENST00000262995.4
|
GAB1
|
GRB2-associated binding protein 1 |
| chr1_+_3607228 | 2.73 |
ENST00000378285.1
ENST00000378280.1 ENST00000378288.4 |
TP73
|
tumor protein p73 |
| chr4_-_109089573 | 2.72 |
ENST00000265165.1
|
LEF1
|
lymphoid enhancer-binding factor 1 |
| chr6_-_30585009 | 2.70 |
ENST00000376511.2
|
PPP1R10
|
protein phosphatase 1, regulatory subunit 10 |
| chr15_+_71389281 | 2.70 |
ENST00000355327.3
|
THSD4
|
thrombospondin, type I, domain containing 4 |
| chr22_+_40297079 | 2.67 |
ENST00000344138.4
ENST00000543252.1 |
GRAP2
|
GRB2-related adaptor protein 2 |
| chr5_-_149492904 | 2.63 |
ENST00000286301.3
ENST00000511344.1 |
CSF1R
|
colony stimulating factor 1 receptor |
| chr7_+_2443202 | 2.53 |
ENST00000258711.6
|
CHST12
|
carbohydrate (chondroitin 4) sulfotransferase 12 |
| chr4_+_81951957 | 2.50 |
ENST00000282701.2
|
BMP3
|
bone morphogenetic protein 3 |
| chr17_-_27224621 | 2.49 |
ENST00000394906.2
ENST00000585169.1 ENST00000394908.4 |
FLOT2
|
flotillin 2 |
| chr5_+_54455946 | 2.49 |
ENST00000503787.1
ENST00000296734.6 ENST00000515370.1 |
GPX8
|
glutathione peroxidase 8 (putative) |
| chr18_+_55018044 | 2.48 |
ENST00000324000.3
|
ST8SIA3
|
ST8 alpha-N-acetyl-neuraminide alpha-2,8-sialyltransferase 3 |
| chr9_+_129677039 | 2.47 |
ENST00000259351.5
ENST00000424082.2 ENST00000394022.3 ENST00000394011.3 ENST00000319107.4 |
RALGPS1
|
Ral GEF with PH domain and SH3 binding motif 1 |
| chr2_+_242577027 | 2.47 |
ENST00000402096.1
ENST00000404914.3 |
ATG4B
|
autophagy related 4B, cysteine peptidase |
| chr11_+_46299199 | 2.46 |
ENST00000529193.1
ENST00000288400.3 |
CREB3L1
|
cAMP responsive element binding protein 3-like 1 |
| chr16_+_68298405 | 2.45 |
ENST00000219343.6
ENST00000566834.1 ENST00000566454.1 |
SLC7A6
|
solute carrier family 7 (amino acid transporter light chain, y+L system), member 6 |
| chr7_+_20370746 | 2.43 |
ENST00000222573.4
|
ITGB8
|
integrin, beta 8 |
| chr10_+_126490354 | 2.43 |
ENST00000298492.5
|
FAM175B
|
family with sequence similarity 175, member B |
| chr20_+_39765581 | 2.41 |
ENST00000244007.3
|
PLCG1
|
phospholipase C, gamma 1 |
| chr10_+_134000404 | 2.41 |
ENST00000338492.4
ENST00000368629.1 |
DPYSL4
|
dihydropyrimidinase-like 4 |
| chr3_+_11034403 | 2.41 |
ENST00000287766.4
ENST00000425938.1 |
SLC6A1
|
solute carrier family 6 (neurotransmitter transporter), member 1 |
| chr1_+_151171012 | 2.39 |
ENST00000349792.5
ENST00000409426.1 ENST00000441902.2 ENST00000368890.4 ENST00000424999.1 ENST00000368888.4 |
PIP5K1A
|
phosphatidylinositol-4-phosphate 5-kinase, type I, alpha |
| chr15_+_79724858 | 2.33 |
ENST00000305428.3
|
KIAA1024
|
KIAA1024 |
| chr18_+_55102917 | 2.32 |
ENST00000491143.2
|
ONECUT2
|
one cut homeobox 2 |
| chr2_-_239197201 | 2.31 |
ENST00000254658.3
|
PER2
|
period circadian clock 2 |
| chr2_-_70995307 | 2.24 |
ENST00000264436.4
ENST00000355733.3 ENST00000447731.2 ENST00000430656.1 ENST00000413157.2 |
ADD2
|
adducin 2 (beta) |
| chr11_+_64126614 | 2.21 |
ENST00000528057.1
ENST00000334205.4 ENST00000294261.4 |
RPS6KA4
|
ribosomal protein S6 kinase, 90kDa, polypeptide 4 |
| chr16_-_17564738 | 2.21 |
ENST00000261381.6
|
XYLT1
|
xylosyltransferase I |
| chr8_+_28174649 | 2.21 |
ENST00000301908.3
|
PNOC
|
prepronociceptin |
| chr12_+_112563335 | 2.19 |
ENST00000549358.1
ENST00000257604.5 ENST00000548092.1 ENST00000552896.1 |
TRAFD1
|
TRAF-type zinc finger domain containing 1 |
| chr5_-_138210977 | 2.18 |
ENST00000274711.6
ENST00000521094.2 |
LRRTM2
|
leucine rich repeat transmembrane neuronal 2 |
| chr11_+_117049445 | 2.18 |
ENST00000324225.4
ENST00000532960.1 |
SIDT2
|
SID1 transmembrane family, member 2 |
| chr9_+_131549483 | 2.16 |
ENST00000372648.5
ENST00000539497.1 |
TBC1D13
|
TBC1 domain family, member 13 |
| chr7_-_73133959 | 2.09 |
ENST00000395155.3
ENST00000395154.3 ENST00000222812.3 ENST00000395156.3 |
STX1A
|
syntaxin 1A (brain) |
| chrX_+_118108571 | 2.09 |
ENST00000304778.7
|
LONRF3
|
LON peptidase N-terminal domain and ring finger 3 |
| chr18_-_57027194 | 1.96 |
ENST00000251047.5
|
LMAN1
|
lectin, mannose-binding, 1 |
| chr2_-_74570520 | 1.94 |
ENST00000394019.2
ENST00000346834.4 ENST00000359484.4 ENST00000423644.1 ENST00000377634.4 ENST00000436454.1 |
SLC4A5
|
solute carrier family 4 (sodium bicarbonate cotransporter), member 5 |
| chr21_-_34100244 | 1.92 |
ENST00000382491.3
ENST00000357345.3 ENST00000429236.1 |
SYNJ1
|
synaptojanin 1 |
| chr7_+_128864848 | 1.92 |
ENST00000325006.3
ENST00000446544.2 |
AHCYL2
|
adenosylhomocysteinase-like 2 |
| chr7_-_143059845 | 1.91 |
ENST00000443739.2
|
FAM131B
|
family with sequence similarity 131, member B |
| chr11_+_35684288 | 1.87 |
ENST00000299413.5
|
TRIM44
|
tripartite motif containing 44 |
| chr5_+_110559784 | 1.87 |
ENST00000282356.4
|
CAMK4
|
calcium/calmodulin-dependent protein kinase IV |
| chr9_-_131534160 | 1.86 |
ENST00000291900.2
|
ZER1
|
zyg-11 related, cell cycle regulator |
| chr8_-_42698433 | 1.82 |
ENST00000345117.2
ENST00000254250.3 |
THAP1
|
THAP domain containing, apoptosis associated protein 1 |
| chr12_+_52306113 | 1.80 |
ENST00000547400.1
ENST00000550683.1 ENST00000419526.2 |
ACVRL1
|
activin A receptor type II-like 1 |
| chr12_+_20522179 | 1.75 |
ENST00000359062.3
|
PDE3A
|
phosphodiesterase 3A, cGMP-inhibited |
| chr11_+_65405556 | 1.75 |
ENST00000534313.1
ENST00000533361.1 ENST00000526137.1 |
SIPA1
|
signal-induced proliferation-associated 1 |
| chr17_+_61086917 | 1.69 |
ENST00000424789.2
ENST00000389520.4 |
TANC2
|
tetratricopeptide repeat, ankyrin repeat and coiled-coil containing 2 |
| chr8_+_9413410 | 1.69 |
ENST00000520408.1
ENST00000310430.6 ENST00000522110.1 |
TNKS
|
tankyrase, TRF1-interacting ankyrin-related ADP-ribose polymerase |
| chr10_-_30348439 | 1.66 |
ENST00000375377.1
|
KIAA1462
|
KIAA1462 |
| chr8_-_60031762 | 1.64 |
ENST00000361421.1
|
TOX
|
thymocyte selection-associated high mobility group box |
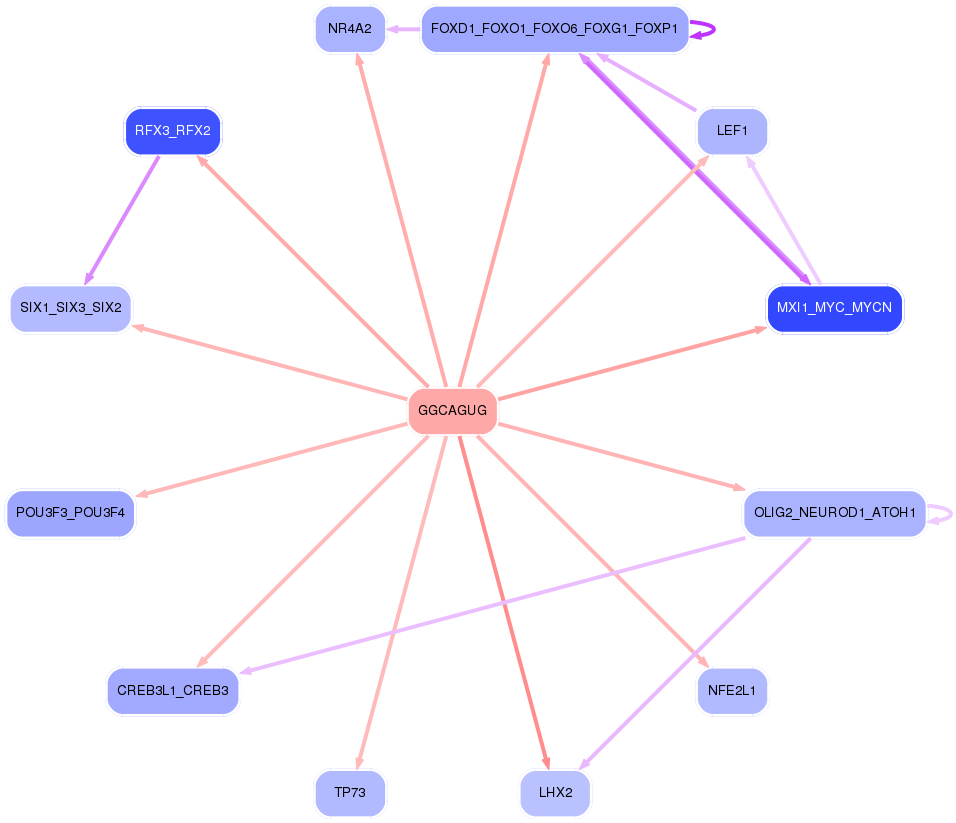
Network of associatons between targets according to the STRING database.

First level regulatory network of GGCAGUG
Gene Ontology Analysis
Gene overrepresentation in biological_process category:
| Log-likelihood per target | Total log-likelihood | Term | Description |
|---|---|---|---|
| 8.6 | 25.9 | GO:0098746 | fast, calcium ion-dependent exocytosis of neurotransmitter(GO:0098746) |
| 5.8 | 29.2 | GO:0099590 | neurotransmitter receptor internalization(GO:0099590) |
| 4.9 | 14.8 | GO:1902309 | negative regulation of peptidyl-serine dephosphorylation(GO:1902309) |
| 4.3 | 12.9 | GO:1902630 | regulation of membrane hyperpolarization(GO:1902630) |
| 3.5 | 10.5 | GO:1903070 | negative regulation of ER-associated ubiquitin-dependent protein catabolic process(GO:1903070) |
| 3.4 | 16.9 | GO:0051946 | regulation of amino acid uptake involved in synaptic transmission(GO:0051941) regulation of glutamate uptake involved in transmission of nerve impulse(GO:0051946) regulation of L-glutamate import(GO:1900920) |
| 3.1 | 15.4 | GO:0090258 | negative regulation of mitochondrial fission(GO:0090258) |
| 3.0 | 8.9 | GO:0036309 | protein localization to M-band(GO:0036309) protein localization to T-tubule(GO:0036371) |
| 2.8 | 11.2 | GO:0072658 | positive regulation of cell communication by electrical coupling(GO:0010650) maintenance of protein location in membrane(GO:0072658) maintenance of protein location in plasma membrane(GO:0072660) positive regulation of membrane depolarization during cardiac muscle cell action potential(GO:1900827) |
| 2.7 | 10.8 | GO:0070426 | positive regulation of nucleotide-binding oligomerization domain containing signaling pathway(GO:0070426) positive regulation of nucleotide-binding oligomerization domain containing 2 signaling pathway(GO:0070434) |
| 2.6 | 18.5 | GO:1903593 | regulation of histamine secretion by mast cell(GO:1903593) |
| 2.5 | 10.0 | GO:0022027 | interkinetic nuclear migration(GO:0022027) |
| 2.5 | 7.4 | GO:0060168 | regulation of axon diameter(GO:0031133) positive regulation of adenosine receptor signaling pathway(GO:0060168) |
| 2.4 | 7.3 | GO:1903697 | negative regulation of microvillus assembly(GO:1903697) |
| 2.4 | 7.1 | GO:1903336 | negative regulation of vacuolar transport(GO:1903336) |
| 2.3 | 22.7 | GO:0060052 | neurofilament cytoskeleton organization(GO:0060052) |
| 2.2 | 9.0 | GO:0046684 | response to pyrethroid(GO:0046684) |
| 2.1 | 8.5 | GO:0000350 | generation of catalytic spliceosome for second transesterification step(GO:0000350) |
| 2.0 | 6.0 | GO:1900169 | regulation of glucocorticoid mediated signaling pathway(GO:1900169) |
| 1.9 | 7.5 | GO:0097477 | NMDA glutamate receptor clustering(GO:0097114) spinal cord motor neuron migration(GO:0097476) lateral motor column neuron migration(GO:0097477) positive regulation of alpha-amino-3-hydroxy-5-methyl-4-isoxazole propionate selective glutamate receptor activity(GO:2000969) |
| 1.8 | 7.3 | GO:1902261 | positive regulation of delayed rectifier potassium channel activity(GO:1902261) |
| 1.8 | 5.5 | GO:0043314 | negative regulation of neutrophil degranulation(GO:0043314) |
| 1.7 | 19.0 | GO:0098870 | neuronal action potential propagation(GO:0019227) action potential propagation(GO:0098870) |
| 1.7 | 5.0 | GO:0072560 | glandular epithelial cell maturation(GO:0002071) type B pancreatic cell maturation(GO:0072560) |
| 1.6 | 8.1 | GO:0097338 | response to clozapine(GO:0097338) |
| 1.5 | 4.6 | GO:0003241 | atrioventricular node development(GO:0003162) cardiac right atrium morphogenesis(GO:0003213) growth involved in heart morphogenesis(GO:0003241) apoptotic process involved in embryonic digit morphogenesis(GO:1902263) |
| 1.5 | 4.6 | GO:0021538 | epithalamus development(GO:0021538) habenula development(GO:0021986) |
| 1.2 | 4.7 | GO:0021773 | striatal medium spiny neuron differentiation(GO:0021773) |
| 1.2 | 14.0 | GO:0021978 | telencephalon regionalization(GO:0021978) |
| 1.1 | 4.4 | GO:2001153 | regulation of renal water transport(GO:2001151) positive regulation of renal water transport(GO:2001153) |
| 1.1 | 6.6 | GO:0036289 | peptidyl-serine autophosphorylation(GO:0036289) |
| 1.1 | 4.3 | GO:0090038 | negative regulation of protein kinase C signaling(GO:0090038) |
| 1.0 | 8.2 | GO:0097116 | gephyrin clustering involved in postsynaptic density assembly(GO:0097116) |
| 1.0 | 4.1 | GO:0016240 | autophagosome docking(GO:0016240) |
| 1.0 | 5.0 | GO:0032849 | positive regulation of cellular pH reduction(GO:0032849) |
| 0.9 | 3.6 | GO:0060024 | rhythmic synaptic transmission(GO:0060024) |
| 0.8 | 2.5 | GO:0051697 | protein delipidation(GO:0051697) |
| 0.8 | 2.4 | GO:0045925 | positive regulation of female receptivity(GO:0045925) |
| 0.8 | 8.4 | GO:0030322 | stabilization of membrane potential(GO:0030322) |
| 0.7 | 11.4 | GO:0043374 | CD8-positive, alpha-beta T cell differentiation(GO:0043374) |
| 0.7 | 2.1 | GO:0010701 | positive regulation of norepinephrine secretion(GO:0010701) |
| 0.7 | 3.4 | GO:2000980 | regulation of auditory receptor cell differentiation(GO:0045607) regulation of mechanoreceptor differentiation(GO:0045631) regulation of inner ear receptor cell differentiation(GO:2000980) |
| 0.6 | 4.5 | GO:0050915 | sensory perception of sour taste(GO:0050915) |
| 0.6 | 4.8 | GO:0051388 | positive regulation of neurotrophin TRK receptor signaling pathway(GO:0051388) |
| 0.6 | 2.4 | GO:0014054 | positive regulation of gamma-aminobutyric acid secretion(GO:0014054) |
| 0.6 | 4.2 | GO:0035234 | ectopic germ cell programmed cell death(GO:0035234) |
| 0.6 | 10.1 | GO:0050650 | chondroitin sulfate proteoglycan biosynthetic process(GO:0050650) |
| 0.6 | 2.9 | GO:0051387 | negative regulation of neurotrophin TRK receptor signaling pathway(GO:0051387) |
| 0.6 | 2.9 | GO:0072069 | thick ascending limb development(GO:0072023) DCT cell differentiation(GO:0072069) metanephric thick ascending limb development(GO:0072233) metanephric DCT cell differentiation(GO:0072240) |
| 0.6 | 1.7 | GO:0070213 | protein auto-ADP-ribosylation(GO:0070213) |
| 0.6 | 3.9 | GO:1902746 | regulation of lens fiber cell differentiation(GO:1902746) |
| 0.5 | 4.9 | GO:0006390 | transcription from mitochondrial promoter(GO:0006390) |
| 0.5 | 2.7 | GO:0071895 | odontoblast differentiation(GO:0071895) |
| 0.5 | 6.0 | GO:0070314 | G1 to G0 transition(GO:0070314) |
| 0.5 | 3.7 | GO:0000414 | regulation of histone H3-K36 methylation(GO:0000414) |
| 0.5 | 1.9 | GO:1904978 | regulation of endosome organization(GO:1904978) |
| 0.5 | 20.0 | GO:0007214 | gamma-aminobutyric acid signaling pathway(GO:0007214) |
| 0.5 | 5.0 | GO:0033227 | dsRNA transport(GO:0033227) |
| 0.4 | 0.9 | GO:1903410 | nitric oxide production involved in inflammatory response(GO:0002537) lysine import(GO:0034226) L-lysine import(GO:0061461) L-lysine import into cell(GO:1903410) |
| 0.4 | 2.2 | GO:0043988 | histone H3-S28 phosphorylation(GO:0043988) |
| 0.4 | 1.8 | GO:0060282 | positive regulation of oocyte development(GO:0060282) |
| 0.4 | 2.6 | GO:0045217 | cell-cell junction maintenance(GO:0045217) |
| 0.4 | 1.7 | GO:0042631 | cellular response to water deprivation(GO:0042631) |
| 0.4 | 3.0 | GO:0000290 | deadenylation-dependent decapping of nuclear-transcribed mRNA(GO:0000290) |
| 0.4 | 3.0 | GO:0035021 | negative regulation of Rac protein signal transduction(GO:0035021) |
| 0.4 | 8.5 | GO:0032012 | regulation of ARF protein signal transduction(GO:0032012) |
| 0.4 | 6.3 | GO:0060746 | maternal behavior(GO:0042711) parental behavior(GO:0060746) |
| 0.4 | 1.3 | GO:0014042 | posterior midgut development(GO:0007497) positive regulation of neuron maturation(GO:0014042) |
| 0.4 | 5.8 | GO:0021794 | thalamus development(GO:0021794) |
| 0.4 | 2.5 | GO:1903903 | regulation of establishment of T cell polarity(GO:1903903) |
| 0.4 | 1.2 | GO:1900114 | positive regulation of histone H3-K9 trimethylation(GO:1900114) |
| 0.4 | 4.5 | GO:0032927 | positive regulation of activin receptor signaling pathway(GO:0032927) |
| 0.4 | 19.9 | GO:0014072 | response to isoquinoline alkaloid(GO:0014072) response to morphine(GO:0043278) |
| 0.4 | 1.9 | GO:0033326 | cerebrospinal fluid secretion(GO:0033326) |
| 0.4 | 4.6 | GO:1901898 | negative regulation of relaxation of cardiac muscle(GO:1901898) |
| 0.4 | 6.7 | GO:0060219 | camera-type eye photoreceptor cell differentiation(GO:0060219) |
| 0.4 | 4.4 | GO:0042354 | fucose catabolic process(GO:0019317) L-fucose metabolic process(GO:0042354) L-fucose catabolic process(GO:0042355) |
| 0.4 | 2.9 | GO:0017183 | peptidyl-diphthamide metabolic process(GO:0017182) peptidyl-diphthamide biosynthetic process from peptidyl-histidine(GO:0017183) |
| 0.4 | 2.9 | GO:1903800 | positive regulation of production of miRNAs involved in gene silencing by miRNA(GO:1903800) |
| 0.4 | 5.3 | GO:0030050 | vesicle transport along actin filament(GO:0030050) |
| 0.3 | 8.7 | GO:0030208 | dermatan sulfate biosynthetic process(GO:0030208) |
| 0.3 | 12.0 | GO:0048791 | calcium ion-regulated exocytosis of neurotransmitter(GO:0048791) |
| 0.3 | 2.5 | GO:0001574 | ganglioside biosynthetic process(GO:0001574) |
| 0.3 | 2.5 | GO:0070278 | extracellular matrix constituent secretion(GO:0070278) |
| 0.3 | 1.8 | GO:0090500 | endocardial cushion to mesenchymal transition(GO:0090500) |
| 0.3 | 3.9 | GO:0031915 | positive regulation of synaptic plasticity(GO:0031915) |
| 0.3 | 5.1 | GO:0030388 | fructose 1,6-bisphosphate metabolic process(GO:0030388) |
| 0.3 | 8.2 | GO:0032292 | myelination in peripheral nervous system(GO:0022011) peripheral nervous system axon ensheathment(GO:0032292) |
| 0.3 | 5.3 | GO:0030575 | nuclear body organization(GO:0030575) |
| 0.3 | 1.9 | GO:0033353 | S-adenosylmethionine cycle(GO:0033353) |
| 0.3 | 1.4 | GO:0010513 | positive regulation of phosphatidylinositol biosynthetic process(GO:0010513) |
| 0.3 | 2.2 | GO:0002091 | negative regulation of receptor internalization(GO:0002091) |
| 0.3 | 1.9 | GO:0002371 | dendritic cell cytokine production(GO:0002371) |
| 0.3 | 5.1 | GO:0033148 | positive regulation of intracellular estrogen receptor signaling pathway(GO:0033148) |
| 0.3 | 6.6 | GO:0032728 | positive regulation of interferon-beta production(GO:0032728) |
| 0.3 | 1.0 | GO:0070212 | protein poly-ADP-ribosylation(GO:0070212) |
| 0.2 | 14.8 | GO:0060997 | dendritic spine morphogenesis(GO:0060997) |
| 0.2 | 2.7 | GO:0048251 | elastic fiber assembly(GO:0048251) |
| 0.2 | 3.8 | GO:0060081 | membrane hyperpolarization(GO:0060081) |
| 0.2 | 0.9 | GO:1990167 | protein K27-linked deubiquitination(GO:1990167) |
| 0.2 | 2.4 | GO:0001573 | ganglioside metabolic process(GO:0001573) |
| 0.2 | 3.3 | GO:0060628 | regulation of ER to Golgi vesicle-mediated transport(GO:0060628) |
| 0.2 | 1.4 | GO:1901727 | protein kinase D signaling(GO:0089700) positive regulation of histone deacetylase activity(GO:1901727) |
| 0.2 | 0.8 | GO:2000049 | positive regulation of cell-cell adhesion mediated by cadherin(GO:2000049) |
| 0.2 | 0.6 | GO:0060061 | Spemann organizer formation(GO:0060061) |
| 0.2 | 1.1 | GO:0097411 | hypoxia-inducible factor-1alpha signaling pathway(GO:0097411) |
| 0.2 | 6.7 | GO:0046710 | GDP metabolic process(GO:0046710) |
| 0.2 | 1.4 | GO:0032482 | Rab protein signal transduction(GO:0032482) |
| 0.2 | 2.7 | GO:0060044 | negative regulation of cardiac muscle cell proliferation(GO:0060044) |
| 0.2 | 1.5 | GO:0060012 | synaptic transmission, glycinergic(GO:0060012) |
| 0.2 | 11.1 | GO:0006501 | C-terminal protein lipidation(GO:0006501) |
| 0.2 | 1.0 | GO:0016560 | protein import into peroxisome matrix, docking(GO:0016560) |
| 0.2 | 1.0 | GO:1903715 | regulation of aerobic respiration(GO:1903715) |
| 0.2 | 4.1 | GO:0039703 | viral RNA genome replication(GO:0039694) RNA replication(GO:0039703) |
| 0.1 | 9.5 | GO:0006400 | tRNA modification(GO:0006400) |
| 0.1 | 3.0 | GO:0007163 | establishment or maintenance of cell polarity(GO:0007163) |
| 0.1 | 2.0 | GO:0034498 | early endosome to Golgi transport(GO:0034498) |
| 0.1 | 4.8 | GO:0007205 | protein kinase C-activating G-protein coupled receptor signaling pathway(GO:0007205) |
| 0.1 | 1.6 | GO:0007379 | segment specification(GO:0007379) positive regulation of Wnt signaling pathway, planar cell polarity pathway(GO:2000096) |
| 0.1 | 3.3 | GO:0043161 | proteasome-mediated ubiquitin-dependent protein catabolic process(GO:0043161) |
| 0.1 | 4.9 | GO:0042036 | negative regulation of cytokine biosynthetic process(GO:0042036) |
| 0.1 | 0.7 | GO:0051694 | pointed-end actin filament capping(GO:0051694) |
| 0.1 | 0.7 | GO:0014050 | negative regulation of glutamate secretion(GO:0014050) |
| 0.1 | 20.3 | GO:0006661 | phosphatidylinositol biosynthetic process(GO:0006661) |
| 0.1 | 1.2 | GO:1901652 | response to peptide(GO:1901652) |
| 0.1 | 1.0 | GO:0098903 | regulation of membrane repolarization during action potential(GO:0098903) |
| 0.1 | 3.4 | GO:0006783 | heme biosynthetic process(GO:0006783) |
| 0.1 | 3.1 | GO:0006198 | cAMP catabolic process(GO:0006198) |
| 0.1 | 0.3 | GO:0060335 | positive regulation of response to interferon-gamma(GO:0060332) positive regulation of interferon-gamma-mediated signaling pathway(GO:0060335) |
| 0.1 | 7.9 | GO:0031338 | regulation of vesicle fusion(GO:0031338) |
| 0.1 | 2.2 | GO:0051016 | barbed-end actin filament capping(GO:0051016) |
| 0.1 | 1.0 | GO:1990573 | potassium ion import across plasma membrane(GO:1990573) |
| 0.1 | 2.3 | GO:0048935 | peripheral nervous system neuron differentiation(GO:0048934) peripheral nervous system neuron development(GO:0048935) |
| 0.1 | 6.3 | GO:0032781 | positive regulation of ATPase activity(GO:0032781) |
| 0.1 | 2.4 | GO:0043536 | positive regulation of blood vessel endothelial cell migration(GO:0043536) |
| 0.1 | 4.3 | GO:0035914 | skeletal muscle cell differentiation(GO:0035914) |
| 0.1 | 5.0 | GO:0007077 | mitotic nuclear envelope disassembly(GO:0007077) |
| 0.1 | 4.3 | GO:0006306 | DNA alkylation(GO:0006305) DNA methylation(GO:0006306) |
| 0.1 | 6.9 | GO:0090305 | nucleic acid phosphodiester bond hydrolysis(GO:0090305) |
| 0.1 | 0.4 | GO:0006655 | phosphatidylglycerol biosynthetic process(GO:0006655) |
| 0.1 | 2.5 | GO:1902475 | L-alpha-amino acid transmembrane transport(GO:1902475) |
| 0.1 | 1.4 | GO:0006895 | Golgi to endosome transport(GO:0006895) |
| 0.1 | 0.2 | GO:2000189 | positive regulation of cholesterol homeostasis(GO:2000189) |
| 0.1 | 6.4 | GO:1903955 | positive regulation of protein targeting to mitochondrion(GO:1903955) |
| 0.1 | 2.5 | GO:0010862 | positive regulation of pathway-restricted SMAD protein phosphorylation(GO:0010862) |
| 0.1 | 7.2 | GO:0019886 | antigen processing and presentation of exogenous peptide antigen via MHC class II(GO:0019886) |
| 0.1 | 0.7 | GO:0035640 | exploration behavior(GO:0035640) |
| 0.1 | 1.8 | GO:0001935 | endothelial cell proliferation(GO:0001935) |
| 0.1 | 8.6 | GO:0007156 | homophilic cell adhesion via plasma membrane adhesion molecules(GO:0007156) |
| 0.1 | 6.4 | GO:1990823 | response to leukemia inhibitory factor(GO:1990823) cellular response to leukemia inhibitory factor(GO:1990830) |
| 0.1 | 6.4 | GO:0006368 | transcription elongation from RNA polymerase II promoter(GO:0006368) |
| 0.1 | 0.1 | GO:0002384 | hepatic immune response(GO:0002384) |
| 0.1 | 0.3 | GO:0098795 | mRNA cleavage involved in gene silencing by miRNA(GO:0035279) mRNA cleavage involved in gene silencing by siRNA(GO:0090625) mRNA cleavage involved in gene silencing(GO:0098795) |
| 0.0 | 3.4 | GO:0030279 | negative regulation of ossification(GO:0030279) |
| 0.0 | 0.1 | GO:0038098 | sequestering of BMP from receptor via BMP binding(GO:0038098) |
| 0.0 | 4.3 | GO:0050806 | positive regulation of synaptic transmission(GO:0050806) |
| 0.0 | 2.2 | GO:0045824 | negative regulation of innate immune response(GO:0045824) |
| 0.0 | 4.1 | GO:0006749 | glutathione metabolic process(GO:0006749) |
| 0.0 | 0.4 | GO:0002115 | store-operated calcium entry(GO:0002115) |
| 0.0 | 0.4 | GO:0045324 | late endosome to vacuole transport(GO:0045324) |
| 0.0 | 0.7 | GO:0007202 | activation of phospholipase C activity(GO:0007202) |
| 0.0 | 1.3 | GO:1901385 | regulation of voltage-gated calcium channel activity(GO:1901385) |
| 0.0 | 0.8 | GO:0035025 | positive regulation of Rho protein signal transduction(GO:0035025) |
| 0.0 | 2.2 | GO:0007218 | neuropeptide signaling pathway(GO:0007218) |
| 0.0 | 0.5 | GO:0033147 | negative regulation of intracellular estrogen receptor signaling pathway(GO:0033147) |
| 0.0 | 2.7 | GO:0031295 | T cell costimulation(GO:0031295) |
| 0.0 | 3.7 | GO:0007173 | epidermal growth factor receptor signaling pathway(GO:0007173) |
| 0.0 | 2.1 | GO:0032436 | positive regulation of proteasomal ubiquitin-dependent protein catabolic process(GO:0032436) |
| 0.0 | 6.8 | GO:0016579 | protein deubiquitination(GO:0016579) |
| 0.0 | 0.5 | GO:0010172 | embryonic body morphogenesis(GO:0010172) |
| 0.0 | 1.9 | GO:0051438 | regulation of ubiquitin-protein transferase activity(GO:0051438) |
| 0.0 | 1.7 | GO:0001701 | in utero embryonic development(GO:0001701) |
| 0.0 | 0.2 | GO:0002430 | complement receptor mediated signaling pathway(GO:0002430) |
| 0.0 | 1.2 | GO:0046847 | filopodium assembly(GO:0046847) |
| 0.0 | 0.7 | GO:0034504 | protein import into nucleus(GO:0006606) protein import(GO:0017038) protein localization to nucleus(GO:0034504) protein targeting to nucleus(GO:0044744) nuclear import(GO:0051170) single-organism nuclear import(GO:1902593) |
| 0.0 | 4.8 | GO:0018105 | peptidyl-serine phosphorylation(GO:0018105) |
| 0.0 | 0.0 | GO:0099541 | trans-synaptic signaling by lipid(GO:0099541) trans-synaptic signaling by endocannabinoid(GO:0099542) |
| 0.0 | 1.2 | GO:0042177 | negative regulation of protein catabolic process(GO:0042177) |
| 0.0 | 0.7 | GO:1900034 | regulation of cellular response to heat(GO:1900034) |
| 0.0 | 1.1 | GO:0070126 | mitochondrial translational elongation(GO:0070125) mitochondrial translational termination(GO:0070126) |
| 0.0 | 0.6 | GO:0007229 | integrin-mediated signaling pathway(GO:0007229) |
| 0.0 | 1.3 | GO:1990748 | cellular oxidant detoxification(GO:0098869) cellular detoxification(GO:1990748) |
| 0.0 | 0.1 | GO:0006004 | fucose metabolic process(GO:0006004) |
| 0.0 | 0.8 | GO:0001578 | microtubule bundle formation(GO:0001578) |
Gene overrepresentation in cellular_component category:
| Log-likelihood per target | Total log-likelihood | Term | Description |
|---|---|---|---|
| 12.5 | 50.2 | GO:0070032 | synaptobrevin 2-SNAP-25-syntaxin-1a-complexin I complex(GO:0070032) |
| 5.2 | 25.9 | GO:0060201 | clathrin-sculpted acetylcholine transport vesicle(GO:0060200) clathrin-sculpted acetylcholine transport vesicle membrane(GO:0060201) |
| 4.6 | 13.9 | GO:0038039 | G-protein coupled receptor heterodimeric complex(GO:0038039) |
| 3.1 | 15.4 | GO:0045298 | tubulin complex(GO:0045298) |
| 2.8 | 8.5 | GO:0071020 | post-spliceosomal complex(GO:0071020) |
| 2.5 | 10.0 | GO:0070695 | FHF complex(GO:0070695) |
| 1.6 | 6.6 | GO:1990604 | IRE1-TRAF2-ASK1 complex(GO:1990604) |
| 1.5 | 22.7 | GO:0005883 | neurofilament(GO:0005883) |
| 1.5 | 7.3 | GO:1902937 | inward rectifier potassium channel complex(GO:1902937) |
| 1.2 | 7.1 | GO:0097443 | sorting endosome(GO:0097443) |
| 1.2 | 3.5 | GO:0016938 | kinesin I complex(GO:0016938) |
| 1.1 | 10.0 | GO:0030868 | smooth endoplasmic reticulum membrane(GO:0030868) smooth endoplasmic reticulum part(GO:0097425) |
| 1.1 | 18.3 | GO:0043194 | axon initial segment(GO:0043194) |
| 1.0 | 11.0 | GO:0033010 | paranodal junction(GO:0033010) |
| 0.9 | 4.6 | GO:0002193 | MAML1-RBP-Jkappa- ICN1 complex(GO:0002193) |
| 0.8 | 4.1 | GO:0044308 | axonal spine(GO:0044308) |
| 0.8 | 2.4 | GO:0034686 | integrin alphav-beta8 complex(GO:0034686) |
| 0.8 | 15.5 | GO:0005890 | sodium:potassium-exchanging ATPase complex(GO:0005890) |
| 0.7 | 7.4 | GO:0033268 | node of Ranvier(GO:0033268) |
| 0.6 | 9.0 | GO:0001518 | voltage-gated sodium channel complex(GO:0001518) |
| 0.6 | 3.9 | GO:0070554 | synaptobrevin 2-SNAP-25-syntaxin-3-complexin complex(GO:0070554) |
| 0.5 | 7.8 | GO:0005662 | DNA replication factor A complex(GO:0005662) |
| 0.5 | 1.5 | GO:0016935 | glycine-gated chloride channel complex(GO:0016935) |
| 0.5 | 2.0 | GO:0033655 | host cell cytoplasm(GO:0030430) host cell cytoplasm part(GO:0033655) |
| 0.4 | 2.6 | GO:1990682 | CSF1-CSF1R complex(GO:1990682) |
| 0.4 | 8.1 | GO:0005952 | cAMP-dependent protein kinase complex(GO:0005952) |
| 0.4 | 6.7 | GO:0032591 | dendritic spine membrane(GO:0032591) |
| 0.3 | 4.8 | GO:0031209 | SCAR complex(GO:0031209) |
| 0.3 | 5.3 | GO:0031045 | dense core granule(GO:0031045) |
| 0.3 | 12.8 | GO:0005720 | nuclear heterochromatin(GO:0005720) |
| 0.3 | 16.2 | GO:0005834 | heterotrimeric G-protein complex(GO:0005834) |
| 0.3 | 7.4 | GO:0097546 | ciliary base(GO:0097546) |
| 0.3 | 1.4 | GO:0098837 | postsynaptic recycling endosome(GO:0098837) |
| 0.3 | 2.7 | GO:0072357 | PTW/PP1 phosphatase complex(GO:0072357) |
| 0.3 | 14.0 | GO:0031430 | M band(GO:0031430) |
| 0.3 | 12.0 | GO:0048786 | presynaptic active zone(GO:0048786) |
| 0.3 | 8.4 | GO:0080008 | Cul4-RING E3 ubiquitin ligase complex(GO:0080008) |
| 0.2 | 2.7 | GO:1990907 | beta-catenin-TCF complex(GO:1990907) |
| 0.2 | 1.9 | GO:0031462 | Cul2-RING ubiquitin ligase complex(GO:0031462) |
| 0.2 | 2.4 | GO:0005847 | mRNA cleavage and polyadenylation specificity factor complex(GO:0005847) |
| 0.2 | 10.8 | GO:0016235 | aggresome(GO:0016235) |
| 0.2 | 5.4 | GO:0035327 | transcriptionally active chromatin(GO:0035327) |
| 0.2 | 0.7 | GO:0030314 | junctional membrane complex(GO:0030314) |
| 0.2 | 6.1 | GO:1902710 | GABA receptor complex(GO:1902710) |
| 0.2 | 4.6 | GO:0000930 | gamma-tubulin complex(GO:0000930) |
| 0.1 | 2.2 | GO:0008290 | F-actin capping protein complex(GO:0008290) |
| 0.1 | 4.9 | GO:0016592 | mediator complex(GO:0016592) |
| 0.1 | 4.4 | GO:0032580 | Golgi cisterna membrane(GO:0032580) |
| 0.1 | 2.7 | GO:0001527 | microfibril(GO:0001527) fibril(GO:0043205) |
| 0.1 | 6.7 | GO:0005874 | microtubule(GO:0005874) |
| 0.1 | 0.7 | GO:0002177 | manchette(GO:0002177) |
| 0.1 | 6.4 | GO:0031519 | PcG protein complex(GO:0031519) |
| 0.1 | 14.8 | GO:0043204 | perikaryon(GO:0043204) |
| 0.1 | 1.7 | GO:0097431 | mitotic spindle pole(GO:0097431) |
| 0.1 | 3.3 | GO:0046658 | anchored component of plasma membrane(GO:0046658) |
| 0.1 | 6.7 | GO:0034704 | calcium channel complex(GO:0034704) |
| 0.1 | 2.5 | GO:0002080 | acrosomal membrane(GO:0002080) |
| 0.1 | 12.9 | GO:0032587 | ruffle membrane(GO:0032587) |
| 0.1 | 1.7 | GO:0005911 | cell-cell junction(GO:0005911) |
| 0.1 | 5.8 | GO:0005903 | brush border(GO:0005903) |
| 0.1 | 4.9 | GO:0030118 | clathrin coat(GO:0030118) |
| 0.1 | 13.2 | GO:0005875 | microtubule associated complex(GO:0005875) |
| 0.1 | 3.6 | GO:0008023 | transcription elongation factor complex(GO:0008023) |
| 0.1 | 33.1 | GO:0030425 | dendrite(GO:0030425) |
| 0.1 | 2.5 | GO:0030173 | integral component of Golgi membrane(GO:0030173) |
| 0.1 | 8.1 | GO:0031225 | anchored component of membrane(GO:0031225) |
| 0.1 | 0.8 | GO:0005577 | fibrinogen complex(GO:0005577) |
| 0.1 | 5.5 | GO:0043005 | neuron projection(GO:0043005) |
| 0.1 | 1.2 | GO:0030027 | lamellipodium(GO:0030027) |
| 0.1 | 0.1 | GO:0070110 | ciliary neurotrophic factor receptor complex(GO:0070110) |
| 0.0 | 0.4 | GO:0000815 | ESCRT III complex(GO:0000815) |
| 0.0 | 5.7 | GO:0048770 | melanosome(GO:0042470) pigment granule(GO:0048770) |
| 0.0 | 7.5 | GO:0030139 | endocytic vesicle(GO:0030139) |
| 0.0 | 4.0 | GO:0015629 | actin cytoskeleton(GO:0015629) |
| 0.0 | 1.1 | GO:0000315 | organellar large ribosomal subunit(GO:0000315) mitochondrial large ribosomal subunit(GO:0005762) |
| 0.0 | 0.3 | GO:0035068 | micro-ribonucleoprotein complex(GO:0035068) |
| 0.0 | 2.6 | GO:0005856 | cytoskeleton(GO:0005856) |
| 0.0 | 5.2 | GO:0005840 | ribosome(GO:0005840) |
| 0.0 | 0.5 | GO:0000421 | autophagosome membrane(GO:0000421) |
| 0.0 | 3.9 | GO:0005938 | cell cortex(GO:0005938) |
| 0.0 | 0.7 | GO:0005865 | striated muscle thin filament(GO:0005865) |
| 0.0 | 11.1 | GO:0048471 | perinuclear region of cytoplasm(GO:0048471) |
| 0.0 | 1.8 | GO:0016605 | PML body(GO:0016605) |
| 0.0 | 1.6 | GO:0005788 | endoplasmic reticulum lumen(GO:0005788) |
| 0.0 | 1.3 | GO:0009986 | cell surface(GO:0009986) |
| 0.0 | 0.1 | GO:0044666 | MLL3/4 complex(GO:0044666) |
Gene overrepresentation in molecular_function category:
| Log-likelihood per target | Total log-likelihood | Term | Description |
|---|---|---|---|
| 5.2 | 25.9 | GO:0030348 | syntaxin-3 binding(GO:0030348) |
| 4.6 | 13.9 | GO:0004965 | G-protein coupled GABA receptor activity(GO:0004965) |
| 3.9 | 15.4 | GO:0099609 | microtubule lateral binding(GO:0099609) |
| 2.6 | 7.9 | GO:0015018 | galactosylgalactosylxylosylprotein 3-beta-glucuronosyltransferase activity(GO:0015018) |
| 2.5 | 7.5 | GO:0070326 | very-low-density lipoprotein particle receptor binding(GO:0070326) |
| 2.1 | 6.2 | GO:0047757 | chondroitin-glucuronate 5-epimerase activity(GO:0047757) |
| 2.0 | 52.0 | GO:0017075 | syntaxin-1 binding(GO:0017075) |
| 1.8 | 9.0 | GO:0086006 | voltage-gated sodium channel activity involved in cardiac muscle cell action potential(GO:0086006) |
| 1.7 | 5.2 | GO:1904288 | BAT3 complex binding(GO:1904288) |
| 1.4 | 18.8 | GO:0052629 | phosphatidylinositol-3,5-bisphosphate 3-phosphatase activity(GO:0052629) |
| 1.4 | 15.7 | GO:0051429 | corticotropin-releasing hormone receptor binding(GO:0051429) corticotropin-releasing hormone receptor 1 binding(GO:0051430) |
| 1.2 | 3.7 | GO:0042799 | histone methyltransferase activity (H4-K20 specific)(GO:0042799) |
| 1.0 | 14.6 | GO:1990239 | steroid hormone binding(GO:1990239) |
| 1.0 | 10.8 | GO:0055131 | C3HC4-type RING finger domain binding(GO:0055131) |
| 1.0 | 2.9 | GO:0071837 | HMG box domain binding(GO:0071837) |
| 0.9 | 4.5 | GO:0044736 | acid-sensing ion channel activity(GO:0044736) |
| 0.9 | 6.3 | GO:0017002 | activin-activated receptor activity(GO:0017002) |
| 0.9 | 12.9 | GO:0008140 | cAMP response element binding protein binding(GO:0008140) |
| 0.8 | 8.4 | GO:0022841 | potassium ion leak channel activity(GO:0022841) |
| 0.8 | 5.0 | GO:0051033 | nucleic acid transmembrane transporter activity(GO:0051032) RNA transmembrane transporter activity(GO:0051033) |
| 0.8 | 2.5 | GO:0008321 | Ral guanyl-nucleotide exchange factor activity(GO:0008321) |
| 0.8 | 2.4 | GO:0052810 | 1-phosphatidylinositol-5-kinase activity(GO:0052810) |
| 0.8 | 3.9 | GO:0005219 | ryanodine-sensitive calcium-release channel activity(GO:0005219) |
| 0.7 | 4.4 | GO:0042577 | lipid phosphatase activity(GO:0042577) |
| 0.7 | 2.2 | GO:0004711 | ribosomal protein S6 kinase activity(GO:0004711) |
| 0.7 | 2.2 | GO:0030158 | protein xylosyltransferase activity(GO:0030158) |
| 0.7 | 4.9 | GO:0050682 | AF-2 domain binding(GO:0050682) |
| 0.7 | 9.0 | GO:0022851 | GABA-gated chloride ion channel activity(GO:0022851) |
| 0.7 | 5.3 | GO:0097322 | 7SK snRNA binding(GO:0097322) |
| 0.6 | 2.5 | GO:0034481 | chondroitin sulfotransferase activity(GO:0034481) |
| 0.6 | 1.8 | GO:0004119 | cGMP-inhibited cyclic-nucleotide phosphodiesterase activity(GO:0004119) |
| 0.6 | 29.1 | GO:0030507 | spectrin binding(GO:0030507) |
| 0.5 | 4.4 | GO:0046920 | alpha-(1->3)-fucosyltransferase activity(GO:0046920) |
| 0.5 | 8.2 | GO:0097109 | neuroligin family protein binding(GO:0097109) |
| 0.5 | 8.1 | GO:0004691 | cAMP-dependent protein kinase activity(GO:0004691) |
| 0.5 | 6.0 | GO:0030306 | ADP-ribosylation factor binding(GO:0030306) |
| 0.5 | 2.4 | GO:1990430 | extracellular matrix protein binding(GO:1990430) |
| 0.5 | 5.1 | GO:0004332 | fructose-bisphosphate aldolase activity(GO:0004332) |
| 0.4 | 2.4 | GO:0005332 | gamma-aminobutyric acid:sodium symporter activity(GO:0005332) gamma-aminobutyric acid transmembrane transporter activity(GO:0015185) |
| 0.4 | 10.0 | GO:0051959 | dynein light intermediate chain binding(GO:0051959) |
| 0.4 | 2.5 | GO:0003828 | alpha-N-acetylneuraminate alpha-2,8-sialyltransferase activity(GO:0003828) |
| 0.3 | 7.3 | GO:0050998 | nitric-oxide synthase binding(GO:0050998) |
| 0.3 | 8.5 | GO:0005086 | ARF guanyl-nucleotide exchange factor activity(GO:0005086) |
| 0.3 | 1.9 | GO:0016802 | adenosylhomocysteinase activity(GO:0004013) trialkylsulfonium hydrolase activity(GO:0016802) |
| 0.3 | 2.2 | GO:0001515 | opioid peptide activity(GO:0001515) |
| 0.3 | 10.6 | GO:0001671 | ATPase activator activity(GO:0001671) |
| 0.3 | 1.5 | GO:0016933 | extracellular-glycine-gated ion channel activity(GO:0016933) extracellular-glycine-gated chloride channel activity(GO:0016934) |
| 0.3 | 0.9 | GO:0015189 | L-lysine transmembrane transporter activity(GO:0015189) |
| 0.3 | 5.0 | GO:0004089 | carbonate dehydratase activity(GO:0004089) |
| 0.3 | 1.1 | GO:0004740 | pyruvate dehydrogenase (acetyl-transferring) kinase activity(GO:0004740) |
| 0.3 | 32.7 | GO:0005070 | SH3/SH2 adaptor activity(GO:0005070) |
| 0.3 | 9.3 | GO:0030742 | GTP-dependent protein binding(GO:0030742) |
| 0.3 | 4.8 | GO:0004143 | diacylglycerol kinase activity(GO:0004143) |
| 0.3 | 6.1 | GO:0005161 | platelet-derived growth factor receptor binding(GO:0005161) |
| 0.3 | 7.8 | GO:0001965 | G-protein alpha-subunit binding(GO:0001965) |
| 0.2 | 2.4 | GO:0005168 | neurotrophin TRKA receptor binding(GO:0005168) |
| 0.2 | 12.7 | GO:0043621 | protein self-association(GO:0043621) |
| 0.2 | 3.9 | GO:0004861 | cyclin-dependent protein serine/threonine kinase inhibitor activity(GO:0004861) |
| 0.2 | 5.4 | GO:0046965 | retinoid X receptor binding(GO:0046965) |
| 0.2 | 6.6 | GO:0031210 | phosphatidylcholine binding(GO:0031210) |
| 0.2 | 7.7 | GO:0004115 | 3',5'-cyclic-AMP phosphodiesterase activity(GO:0004115) |
| 0.2 | 2.2 | GO:0042043 | neurexin family protein binding(GO:0042043) |
| 0.2 | 2.7 | GO:0097371 | MDM2/MDM4 family protein binding(GO:0097371) |
| 0.2 | 2.7 | GO:0030284 | estrogen receptor activity(GO:0030284) |
| 0.2 | 0.8 | GO:0015057 | thrombin receptor activity(GO:0015057) |
| 0.2 | 1.0 | GO:0005052 | peroxisome matrix targeting signal-1 binding(GO:0005052) |
| 0.2 | 2.5 | GO:0070700 | BMP receptor binding(GO:0070700) |
| 0.2 | 6.7 | GO:0004385 | guanylate kinase activity(GO:0004385) |
| 0.2 | 2.1 | GO:0019869 | chloride channel inhibitor activity(GO:0019869) |
| 0.2 | 5.9 | GO:0003950 | NAD+ ADP-ribosyltransferase activity(GO:0003950) |
| 0.2 | 0.7 | GO:0070915 | lysophosphatidic acid receptor activity(GO:0070915) |
| 0.2 | 3.3 | GO:0005248 | voltage-gated sodium channel activity(GO:0005248) voltage-gated ion channel activity involved in regulation of postsynaptic membrane potential(GO:1905030) |
| 0.2 | 2.6 | GO:0001222 | transcription corepressor binding(GO:0001222) |
| 0.2 | 3.5 | GO:0070001 | aspartic-type endopeptidase activity(GO:0004190) aspartic-type peptidase activity(GO:0070001) |
| 0.2 | 22.7 | GO:0005200 | structural constituent of cytoskeleton(GO:0005200) |
| 0.1 | 4.9 | GO:0030331 | estrogen receptor binding(GO:0030331) |
| 0.1 | 0.7 | GO:0070905 | serine binding(GO:0070905) |
| 0.1 | 2.4 | GO:0031005 | filamin binding(GO:0031005) |
| 0.1 | 6.6 | GO:0019894 | kinesin binding(GO:0019894) |
| 0.1 | 1.4 | GO:0051378 | amine binding(GO:0043176) serotonin binding(GO:0051378) |
| 0.1 | 1.0 | GO:0005391 | sodium:potassium-exchanging ATPase activity(GO:0005391) |
| 0.1 | 0.4 | GO:0004605 | phosphatidate cytidylyltransferase activity(GO:0004605) |
| 0.1 | 4.1 | GO:0004364 | glutathione transferase activity(GO:0004364) |
| 0.1 | 1.2 | GO:0070324 | thyroid hormone binding(GO:0070324) |
| 0.1 | 2.1 | GO:0005537 | mannose binding(GO:0005537) |
| 0.1 | 41.4 | GO:0030695 | GTPase regulator activity(GO:0030695) |
| 0.1 | 4.1 | GO:0005484 | SNAP receptor activity(GO:0005484) |
| 0.1 | 3.3 | GO:0097200 | cysteine-type endopeptidase activity involved in execution phase of apoptosis(GO:0097200) |
| 0.1 | 2.2 | GO:0005112 | Notch binding(GO:0005112) |
| 0.1 | 12.2 | GO:0004222 | metalloendopeptidase activity(GO:0004222) |
| 0.1 | 14.2 | GO:0004519 | endonuclease activity(GO:0004519) |
| 0.1 | 3.4 | GO:0001205 | transcriptional activator activity, RNA polymerase II distal enhancer sequence-specific binding(GO:0001205) |
| 0.1 | 1.9 | GO:0010857 | calcium-dependent protein serine/threonine kinase activity(GO:0009931) calcium-dependent protein kinase activity(GO:0010857) |
| 0.1 | 3.2 | GO:0005245 | voltage-gated calcium channel activity(GO:0005245) |
| 0.1 | 2.1 | GO:0035255 | ionotropic glutamate receptor binding(GO:0035255) |
| 0.1 | 0.4 | GO:0016286 | small conductance calcium-activated potassium channel activity(GO:0016286) |
| 0.1 | 2.5 | GO:0004602 | glutathione peroxidase activity(GO:0004602) |
| 0.1 | 0.6 | GO:0016015 | morphogen activity(GO:0016015) |
| 0.1 | 22.3 | GO:0001227 | transcriptional repressor activity, RNA polymerase II transcription regulatory region sequence-specific binding(GO:0001227) |
| 0.1 | 5.2 | GO:0003705 | transcription factor activity, RNA polymerase II distal enhancer sequence-specific binding(GO:0003705) |
| 0.1 | 1.2 | GO:1990841 | promoter-specific chromatin binding(GO:1990841) |
| 0.1 | 5.3 | GO:0017137 | Rab GTPase binding(GO:0017137) |
| 0.1 | 1.4 | GO:0004697 | protein kinase C activity(GO:0004697) |
| 0.1 | 2.1 | GO:0031624 | ubiquitin conjugating enzyme binding(GO:0031624) |
| 0.1 | 0.9 | GO:0051879 | Hsp90 protein binding(GO:0051879) |
| 0.1 | 1.9 | GO:0015301 | anion:anion antiporter activity(GO:0015301) |
| 0.1 | 2.1 | GO:0004198 | calcium-dependent cysteine-type endopeptidase activity(GO:0004198) |
| 0.1 | 0.7 | GO:0099604 | calcium-release channel activity(GO:0015278) ligand-gated calcium channel activity(GO:0099604) |
| 0.0 | 3.8 | GO:0005249 | voltage-gated potassium channel activity(GO:0005249) |
| 0.0 | 2.5 | GO:0004197 | cysteine-type endopeptidase activity(GO:0004197) |
| 0.0 | 5.7 | GO:0044325 | ion channel binding(GO:0044325) |
| 0.0 | 2.5 | GO:0015179 | L-amino acid transmembrane transporter activity(GO:0015179) |
| 0.0 | 0.5 | GO:0070016 | armadillo repeat domain binding(GO:0070016) |
| 0.0 | 4.6 | GO:0019888 | protein phosphatase regulator activity(GO:0019888) |
| 0.0 | 4.3 | GO:0017124 | SH3 domain binding(GO:0017124) |
| 0.0 | 0.1 | GO:0004915 | interleukin-6 receptor activity(GO:0004915) interleukin-6 binding(GO:0019981) |
| 0.0 | 0.4 | GO:0015279 | store-operated calcium channel activity(GO:0015279) |
| 0.0 | 0.3 | GO:0015232 | heme transporter activity(GO:0015232) |
| 0.0 | 0.7 | GO:0005523 | tropomyosin binding(GO:0005523) |
| 0.0 | 0.1 | GO:0036122 | BMP binding(GO:0036122) |
| 0.0 | 0.7 | GO:0008139 | nuclear localization sequence binding(GO:0008139) |
| 0.0 | 4.9 | GO:0008017 | microtubule binding(GO:0008017) |
| 0.0 | 0.3 | GO:0035198 | miRNA binding(GO:0035198) |
| 0.0 | 1.2 | GO:0005089 | Rho guanyl-nucleotide exchange factor activity(GO:0005089) |
| 0.0 | 0.2 | GO:0004875 | complement receptor activity(GO:0004875) |
| 0.0 | 0.9 | GO:0004843 | thiol-dependent ubiquitin-specific protease activity(GO:0004843) |
| 0.0 | 0.1 | GO:0008417 | fucosyltransferase activity(GO:0008417) |
Gene overrepresentation in C2:CP category:
| Log-likelihood per target | Total log-likelihood | Term | Description |
|---|---|---|---|
| 0.9 | 18.1 | PID S1P S1P4 PATHWAY | S1P4 pathway |
| 0.6 | 11.3 | PID P38 GAMMA DELTA PATHWAY | Signaling mediated by p38-gamma and p38-delta |
| 0.5 | 25.9 | SIG CD40PATHWAYMAP | Genes related to CD40 signaling |
| 0.5 | 18.5 | PID INSULIN GLUCOSE PATHWAY | Insulin-mediated glucose transport |
| 0.2 | 10.0 | PID PI3K PLC TRK PATHWAY | Trk receptor signaling mediated by PI3K and PLC-gamma |
| 0.2 | 4.6 | PID PS1 PATHWAY | Presenilin action in Notch and Wnt signaling |
| 0.2 | 5.1 | PID WNT SIGNALING PATHWAY | Wnt signaling network |
| 0.2 | 4.6 | PID NECTIN PATHWAY | Nectin adhesion pathway |
| 0.2 | 3.3 | PID HEDGEHOG 2PATHWAY | Signaling events mediated by the Hedgehog family |
| 0.2 | 11.1 | PID RAC1 REG PATHWAY | Regulation of RAC1 activity |
| 0.2 | 6.0 | PID LIS1 PATHWAY | Lissencephaly gene (LIS1) in neuronal migration and development |
| 0.2 | 6.3 | PID ALK1 PATHWAY | ALK1 signaling events |
| 0.1 | 2.4 | PID ARF6 DOWNSTREAM PATHWAY | Arf6 downstream pathway |
| 0.1 | 8.1 | PID INTEGRIN A4B1 PATHWAY | Alpha4 beta1 integrin signaling events |
| 0.1 | 2.7 | PID TCR JNK PATHWAY | JNK signaling in the CD4+ TCR pathway |
| 0.1 | 2.4 | PID INTEGRIN5 PATHWAY | Beta5 beta6 beta7 and beta8 integrin cell surface interactions |
| 0.1 | 2.3 | PID CIRCADIAN PATHWAY | Circadian rhythm pathway |
| 0.1 | 4.9 | PID ERA GENOMIC PATHWAY | Validated nuclear estrogen receptor alpha network |
| 0.1 | 4.8 | PID RAC1 PATHWAY | RAC1 signaling pathway |
| 0.1 | 0.6 | PID S1P S1P2 PATHWAY | S1P2 pathway |
| 0.1 | 1.4 | PID IGF1 PATHWAY | IGF1 pathway |
| 0.1 | 1.5 | PID WNT CANONICAL PATHWAY | Canonical Wnt signaling pathway |
| 0.1 | 3.7 | PID CD8 TCR PATHWAY | TCR signaling in naïve CD8+ T cells |
| 0.1 | 3.3 | SIG INSULIN RECEPTOR PATHWAY IN CARDIAC MYOCYTES | Genes related to the insulin receptor pathway |
| 0.1 | 4.8 | PID P73PATHWAY | p73 transcription factor network |
| 0.1 | 5.8 | PID CASPASE PATHWAY | Caspase cascade in apoptosis |
| 0.1 | 0.8 | PID MET PATHWAY | Signaling events mediated by Hepatocyte Growth Factor Receptor (c-Met) |
| 0.1 | 2.8 | PID HDAC CLASSI PATHWAY | Signaling events mediated by HDAC Class I |
| 0.1 | 3.1 | PID PDGFRB PATHWAY | PDGFR-beta signaling pathway |
| 0.1 | 4.8 | PID ERBB1 DOWNSTREAM PATHWAY | ErbB1 downstream signaling |
| 0.1 | 2.0 | PID RXR VDR PATHWAY | RXR and RAR heterodimerization with other nuclear receptor |
| 0.1 | 1.9 | PID ERBB1 INTERNALIZATION PATHWAY | Internalization of ErbB1 |
| 0.0 | 2.6 | PID PTP1B PATHWAY | Signaling events mediated by PTP1B |
| 0.0 | 0.4 | SA G2 AND M PHASES | Cdc25 activates the cdc2/cyclin B complex to induce the G2/M transition. |
| 0.0 | 3.2 | PID HNF3A PATHWAY | FOXA1 transcription factor network |
| 0.0 | 0.9 | PID KIT PATHWAY | Signaling events mediated by Stem cell factor receptor (c-Kit) |
| 0.0 | 1.7 | PID TELOMERASE PATHWAY | Regulation of Telomerase |
| 0.0 | 0.7 | PID LYSOPHOSPHOLIPID PATHWAY | LPA receptor mediated events |
| 0.0 | 4.8 | NABA ECM GLYCOPROTEINS | Genes encoding structural ECM glycoproteins |
| 0.0 | 0.8 | PID NFAT TFPATHWAY | Calcineurin-regulated NFAT-dependent transcription in lymphocytes |
| 0.0 | 1.0 | ST INTEGRIN SIGNALING PATHWAY | Integrin Signaling Pathway |
| 0.0 | 1.5 | PID CMYB PATHWAY | C-MYB transcription factor network |
| 0.0 | 0.1 | ST STAT3 PATHWAY | STAT3 Pathway |
Gene overrepresentation in C2:CP:REACTOME category:
| Log-likelihood per target | Total log-likelihood | Term | Description |
|---|---|---|---|
| 4.2 | 76.0 | REACTOME NOREPINEPHRINE NEUROTRANSMITTER RELEASE CYCLE | Genes involved in Norepinephrine Neurotransmitter Release Cycle |
| 1.2 | 8.4 | REACTOME TANDEM PORE DOMAIN POTASSIUM CHANNELS | Genes involved in Tandem pore domain potassium channels |
| 0.8 | 14.7 | REACTOME CLASS C 3 METABOTROPIC GLUTAMATE PHEROMONE RECEPTORS | Genes involved in Class C/3 (Metabotropic glutamate/pheromone receptors) |
| 0.7 | 24.0 | REACTOME INTERACTION BETWEEN L1 AND ANKYRINS | Genes involved in Interaction between L1 and Ankyrins |
| 0.5 | 16.1 | REACTOME INHIBITION OF INSULIN SECRETION BY ADRENALINE NORADRENALINE | Genes involved in Inhibition of Insulin Secretion by Adrenaline/Noradrenaline |
| 0.5 | 15.4 | REACTOME CASPASE MEDIATED CLEAVAGE OF CYTOSKELETAL PROTEINS | Genes involved in Caspase-mediated cleavage of cytoskeletal proteins |
| 0.4 | 17.2 | REACTOME RAP1 SIGNALLING | Genes involved in Rap1 signalling |
| 0.3 | 5.0 | REACTOME REVERSIBLE HYDRATION OF CARBON DIOXIDE | Genes involved in Reversible Hydration of Carbon Dioxide |
| 0.3 | 15.5 | REACTOME ION TRANSPORT BY P TYPE ATPASES | Genes involved in Ion transport by P-type ATPases |
| 0.2 | 2.5 | REACTOME CHONDROITIN SULFATE BIOSYNTHESIS | Genes involved in Chondroitin sulfate biosynthesis |
| 0.2 | 7.9 | REACTOME A TETRASACCHARIDE LINKER SEQUENCE IS REQUIRED FOR GAG SYNTHESIS | Genes involved in A tetrasaccharide linker sequence is required for GAG synthesis |
| 0.2 | 3.0 | REACTOME MRNA DECAY BY 5 TO 3 EXORIBONUCLEASE | Genes involved in mRNA Decay by 5' to 3' Exoribonuclease |
| 0.2 | 5.8 | REACTOME P38MAPK EVENTS | Genes involved in p38MAPK events |
| 0.2 | 6.1 | REACTOME GABA A RECEPTOR ACTIVATION | Genes involved in GABA A receptor activation |
| 0.2 | 2.4 | REACTOME ROLE OF SECOND MESSENGERS IN NETRIN1 SIGNALING | Genes involved in Role of second messengers in netrin-1 signaling |
| 0.2 | 1.5 | REACTOME ION CHANNEL TRANSPORT | Genes involved in Ion channel transport |
| 0.1 | 4.5 | REACTOME SIGNALING BY NODAL | Genes involved in Signaling by NODAL |
| 0.1 | 3.5 | REACTOME KINESINS | Genes involved in Kinesins |
| 0.1 | 2.3 | REACTOME BMAL1 CLOCK NPAS2 ACTIVATES CIRCADIAN EXPRESSION | Genes involved in BMAL1:CLOCK/NPAS2 Activates Circadian Expression |
| 0.1 | 6.4 | REACTOME SYNTHESIS OF PIPS AT THE PLASMA MEMBRANE | Genes involved in Synthesis of PIPs at the plasma membrane |
| 0.1 | 14.9 | REACTOME L1CAM INTERACTIONS | Genes involved in L1CAM interactions |
| 0.1 | 2.9 | REACTOME EGFR DOWNREGULATION | Genes involved in EGFR downregulation |
| 0.1 | 3.7 | REACTOME PHOSPHORYLATION OF CD3 AND TCR ZETA CHAINS | Genes involved in Phosphorylation of CD3 and TCR zeta chains |
| 0.1 | 3.8 | REACTOME ADHERENS JUNCTIONS INTERACTIONS | Genes involved in Adherens junctions interactions |
| 0.1 | 6.8 | REACTOME APOPTOTIC CLEAVAGE OF CELLULAR PROTEINS | Genes involved in Apoptotic cleavage of cellular proteins |
| 0.1 | 3.3 | REACTOME EFFECTS OF PIP2 HYDROLYSIS | Genes involved in Effects of PIP2 hydrolysis |
| 0.1 | 10.8 | REACTOME DESTABILIZATION OF MRNA BY AUF1 HNRNP D0 | Genes involved in Destabilization of mRNA by AUF1 (hnRNP D0) |
| 0.1 | 2.4 | REACTOME GABA SYNTHESIS RELEASE REUPTAKE AND DEGRADATION | Genes involved in GABA synthesis, release, reuptake and degradation |
| 0.1 | 8.7 | REACTOME CELL DEATH SIGNALLING VIA NRAGE NRIF AND NADE | Genes involved in Cell death signalling via NRAGE, NRIF and NADE |
| 0.1 | 2.4 | REACTOME CRMPS IN SEMA3A SIGNALING | Genes involved in CRMPs in Sema3A signaling |
| 0.1 | 4.3 | REACTOME DARPP 32 EVENTS | Genes involved in DARPP-32 events |
| 0.1 | 1.4 | REACTOME SEROTONIN RECEPTORS | Genes involved in Serotonin receptors |
| 0.1 | 2.5 | REACTOME N GLYCAN ANTENNAE ELONGATION | Genes involved in N-Glycan antennae elongation |
| 0.1 | 5.1 | REACTOME GLYCOLYSIS | Genes involved in Glycolysis |
| 0.1 | 2.9 | REACTOME LYSOSOME VESICLE BIOGENESIS | Genes involved in Lysosome Vesicle Biogenesis |
| 0.1 | 1.4 | REACTOME THROMBIN SIGNALLING THROUGH PROTEINASE ACTIVATED RECEPTORS PARS | Genes involved in Thrombin signalling through proteinase activated receptors (PARs) |
| 0.1 | 2.7 | REACTOME GENERATION OF SECOND MESSENGER MOLECULES | Genes involved in Generation of second messenger molecules |
| 0.1 | 3.3 | REACTOME AMINO ACID TRANSPORT ACROSS THE PLASMA MEMBRANE | Genes involved in Amino acid transport across the plasma membrane |
| 0.1 | 9.9 | REACTOME SIGNALING BY RHO GTPASES | Genes involved in Signaling by Rho GTPases |
| 0.1 | 3.0 | REACTOME TIGHT JUNCTION INTERACTIONS | Genes involved in Tight junction interactions |
| 0.1 | 1.9 | REACTOME DAG AND IP3 SIGNALING | Genes involved in DAG and IP3 signaling |
| 0.1 | 2.8 | REACTOME GAB1 SIGNALOSOME | Genes involved in GAB1 signalosome |
| 0.1 | 0.9 | REACTOME REGULATION OF KIT SIGNALING | Genes involved in Regulation of KIT signaling |
| 0.1 | 1.1 | REACTOME REGULATION OF PYRUVATE DEHYDROGENASE PDH COMPLEX | Genes involved in Regulation of pyruvate dehydrogenase (PDH) complex |
| 0.1 | 1.8 | REACTOME CGMP EFFECTS | Genes involved in cGMP effects |
| 0.0 | 0.4 | REACTOME P53 INDEPENDENT G1 S DNA DAMAGE CHECKPOINT | Genes involved in p53-Independent G1/S DNA damage checkpoint |
| 0.0 | 3.4 | REACTOME NUCLEAR RECEPTOR TRANSCRIPTION PATHWAY | Genes involved in Nuclear Receptor transcription pathway |
| 0.0 | 2.4 | REACTOME INTEGRIN CELL SURFACE INTERACTIONS | Genes involved in Integrin cell surface interactions |
| 0.0 | 3.1 | REACTOME G ALPHA S SIGNALLING EVENTS | Genes involved in G alpha (s) signalling events |
| 0.0 | 2.9 | REACTOME G ALPHA I SIGNALLING EVENTS | Genes involved in G alpha (i) signalling events |
| 0.0 | 0.6 | REACTOME CLASS B 2 SECRETIN FAMILY RECEPTORS | Genes involved in Class B/2 (Secretin family receptors) |
| 0.0 | 0.8 | REACTOME FACTORS INVOLVED IN MEGAKARYOCYTE DEVELOPMENT AND PLATELET PRODUCTION | Genes involved in Factors involved in megakaryocyte development and platelet production |
| 0.0 | 0.7 | REACTOME MHC CLASS II ANTIGEN PRESENTATION | Genes involved in MHC class II antigen presentation |