Project
GNF SymAtlas + NCI-60 cancer cell lines, comparison of cancers vs non-cancers, human (Su, 2004; Ross, 2000)
Navigation
Downloads
Results for GGCUCAG
Z-value: 1.36
Motif logo

miRNA associated with seed GGCUCAG
| Name | miRBASE accession |
|---|---|
|
hsa-miR-24-3p
|
MIMAT0000080 |
Activity profile of GGCUCAG motif
Sorted Z-values of GGCUCAG motif
| Promoter | Log-likelihood | Transcript | Gene | Gene Info |
|---|---|---|---|---|
| chr8_+_24772455 | 15.75 |
ENST00000433454.2
|
NEFM
|
neurofilament, medium polypeptide |
| chrX_+_56259316 | 12.82 |
ENST00000468660.1
|
KLF8
|
Kruppel-like factor 8 |
| chr5_-_149535421 | 11.85 |
ENST00000261799.4
|
PDGFRB
|
platelet-derived growth factor receptor, beta polypeptide |
| chrX_-_18372792 | 11.53 |
ENST00000251900.4
|
SCML2
|
sex comb on midleg-like 2 (Drosophila) |
| chr17_-_8055747 | 10.87 |
ENST00000317276.4
ENST00000581703.1 |
PER1
|
period circadian clock 1 |
| chr9_-_98079965 | 10.54 |
ENST00000289081.3
|
FANCC
|
Fanconi anemia, complementation group C |
| chr14_+_24583836 | 9.64 |
ENST00000559115.1
ENST00000558215.1 ENST00000557810.1 ENST00000561375.1 ENST00000446197.3 ENST00000559796.1 ENST00000560713.1 ENST00000560901.1 ENST00000559382.1 |
DCAF11
|
DDB1 and CUL4 associated factor 11 |
| chr17_-_7197881 | 8.87 |
ENST00000007699.5
|
YBX2
|
Y box binding protein 2 |
| chr15_+_75287861 | 8.32 |
ENST00000425597.3
ENST00000562327.1 ENST00000568018.1 ENST00000562212.1 ENST00000567920.1 ENST00000566872.1 ENST00000361900.6 ENST00000545456.1 |
SCAMP5
|
secretory carrier membrane protein 5 |
| chr9_+_37753795 | 8.03 |
ENST00000377753.2
ENST00000537911.1 ENST00000377754.2 ENST00000297994.3 |
TRMT10B
|
tRNA methyltransferase 10 homolog B (S. cerevisiae) |
| chr16_+_67927147 | 7.97 |
ENST00000291041.5
|
PSKH1
|
protein serine kinase H1 |
| chr16_+_58497567 | 7.88 |
ENST00000258187.5
|
NDRG4
|
NDRG family member 4 |
| chr11_-_22851367 | 7.87 |
ENST00000354193.4
|
SVIP
|
small VCP/p97-interacting protein |
| chr12_-_49504655 | 7.87 |
ENST00000551782.1
ENST00000267102.8 |
LMBR1L
|
limb development membrane protein 1-like |
| chr17_-_61777459 | 7.80 |
ENST00000578993.1
ENST00000583211.1 ENST00000259006.3 |
LIMD2
|
LIM domain containing 2 |
| chr17_+_19281034 | 7.70 |
ENST00000308406.5
ENST00000299612.7 |
MAPK7
|
mitogen-activated protein kinase 7 |
| chr1_+_156124162 | 7.63 |
ENST00000368282.1
|
SEMA4A
|
sema domain, immunoglobulin domain (Ig), transmembrane domain (TM) and short cytoplasmic domain, (semaphorin) 4A |
| chr14_-_77843390 | 7.55 |
ENST00000216468.7
|
TMED8
|
transmembrane emp24 protein transport domain containing 8 |
| chr11_-_59383617 | 7.35 |
ENST00000263847.1
|
OSBP
|
oxysterol binding protein |
| chr7_-_44365020 | 7.27 |
ENST00000395747.2
ENST00000347193.4 ENST00000346990.4 ENST00000258682.6 ENST00000353625.4 ENST00000421607.1 ENST00000424197.1 ENST00000502837.2 ENST00000350811.3 ENST00000395749.2 |
CAMK2B
|
calcium/calmodulin-dependent protein kinase II beta |
| chr16_+_66914264 | 7.21 |
ENST00000311765.2
ENST00000568869.1 ENST00000561704.1 ENST00000568398.1 ENST00000566776.1 |
PDP2
|
pyruvate dehyrogenase phosphatase catalytic subunit 2 |
| chr16_+_11762270 | 7.18 |
ENST00000329565.5
|
SNN
|
stannin |
| chr11_-_1593150 | 7.10 |
ENST00000397374.3
|
DUSP8
|
dual specificity phosphatase 8 |
| chr19_-_18632861 | 6.93 |
ENST00000262809.4
|
ELL
|
elongation factor RNA polymerase II |
| chr5_-_131826457 | 6.79 |
ENST00000437654.1
ENST00000245414.4 |
IRF1
|
interferon regulatory factor 1 |
| chr1_-_200992827 | 6.74 |
ENST00000332129.2
ENST00000422435.2 |
KIF21B
|
kinesin family member 21B |
| chr17_+_20059302 | 6.70 |
ENST00000395530.2
|
SPECC1
|
sperm antigen with calponin homology and coiled-coil domains 1 |
| chr7_+_138916231 | 6.67 |
ENST00000473989.3
ENST00000288561.8 |
UBN2
|
ubinuclein 2 |
| chr9_-_130829588 | 6.62 |
ENST00000373078.4
|
NAIF1
|
nuclear apoptosis inducing factor 1 |
| chrX_-_57937067 | 6.50 |
ENST00000358697.4
|
ZXDA
|
zinc finger, X-linked, duplicated A |
| chr1_-_207224307 | 6.44 |
ENST00000315927.4
|
YOD1
|
YOD1 deubiquitinase |
| chr6_-_44281043 | 6.40 |
ENST00000244571.4
|
AARS2
|
alanyl-tRNA synthetase 2, mitochondrial |
| chr2_-_175351744 | 6.39 |
ENST00000295500.4
ENST00000392552.2 ENST00000392551.2 |
GPR155
|
G protein-coupled receptor 155 |
| chr1_+_27561007 | 6.38 |
ENST00000319394.3
|
WDTC1
|
WD and tetratricopeptide repeats 1 |
| chr5_+_65018017 | 5.70 |
ENST00000380985.5
ENST00000502464.1 |
NLN
|
neurolysin (metallopeptidase M3 family) |
| chr3_+_52444651 | 5.63 |
ENST00000327906.3
|
PHF7
|
PHD finger protein 7 |
| chr3_+_49591881 | 5.62 |
ENST00000296452.4
|
BSN
|
bassoon presynaptic cytomatrix protein |
| chr1_+_210001309 | 5.61 |
ENST00000491415.2
|
DIEXF
|
digestive organ expansion factor homolog (zebrafish) |
| chr8_+_22102626 | 5.58 |
ENST00000519237.1
ENST00000397802.4 |
POLR3D
|
polymerase (RNA) III (DNA directed) polypeptide D, 44kDa |
| chr14_+_61788429 | 5.52 |
ENST00000332981.5
|
PRKCH
|
protein kinase C, eta |
| chr17_-_2206801 | 5.49 |
ENST00000544865.1
|
SMG6
|
SMG6 nonsense mediated mRNA decay factor |
| chrX_+_57618269 | 5.24 |
ENST00000374888.1
|
ZXDB
|
zinc finger, X-linked, duplicated B |
| chr19_+_41284121 | 5.19 |
ENST00000594800.1
ENST00000357052.2 ENST00000602173.1 |
RAB4B
|
RAB4B, member RAS oncogene family |
| chr17_+_72744791 | 5.16 |
ENST00000583369.1
ENST00000262613.5 |
SLC9A3R1
|
solute carrier family 9, subfamily A (NHE3, cation proton antiporter 3), member 3 regulator 1 |
| chr19_+_39616410 | 5.09 |
ENST00000602004.1
ENST00000599470.1 ENST00000321944.4 ENST00000593480.1 ENST00000358301.3 ENST00000593690.1 ENST00000599386.1 |
PAK4
|
p21 protein (Cdc42/Rac)-activated kinase 4 |
| chr17_-_78450398 | 5.05 |
ENST00000306773.4
|
NPTX1
|
neuronal pentraxin I |
| chr10_-_95360983 | 5.03 |
ENST00000371464.3
|
RBP4
|
retinol binding protein 4, plasma |
| chr14_+_102027688 | 5.02 |
ENST00000510508.4
ENST00000359323.3 |
DIO3
|
deiodinase, iodothyronine, type III |
| chr1_+_101702417 | 5.02 |
ENST00000305352.6
|
S1PR1
|
sphingosine-1-phosphate receptor 1 |
| chr10_+_102222798 | 4.98 |
ENST00000343737.5
|
WNT8B
|
wingless-type MMTV integration site family, member 8B |
| chr15_+_65134088 | 4.87 |
ENST00000323544.4
ENST00000437723.1 |
PLEKHO2
AC069368.3
|
pleckstrin homology domain containing, family O member 2 Uncharacterized protein |
| chr9_-_127269661 | 4.86 |
ENST00000373588.4
|
NR5A1
|
nuclear receptor subfamily 5, group A, member 1 |
| chr3_+_47324424 | 4.80 |
ENST00000437353.1
ENST00000232766.5 ENST00000455924.2 |
KLHL18
|
kelch-like family member 18 |
| chr9_-_72287191 | 4.61 |
ENST00000265381.4
|
APBA1
|
amyloid beta (A4) precursor protein-binding, family A, member 1 |
| chr1_-_203155868 | 4.54 |
ENST00000255409.3
|
CHI3L1
|
chitinase 3-like 1 (cartilage glycoprotein-39) |
| chr22_+_42196666 | 4.54 |
ENST00000402061.3
ENST00000255784.5 |
CCDC134
|
coiled-coil domain containing 134 |
| chr1_-_115212696 | 4.52 |
ENST00000393276.3
ENST00000393277.1 |
DENND2C
|
DENN/MADD domain containing 2C |
| chr2_-_217560248 | 4.51 |
ENST00000233813.4
|
IGFBP5
|
insulin-like growth factor binding protein 5 |
| chr5_-_140998616 | 4.51 |
ENST00000389054.3
ENST00000398562.2 ENST00000389057.5 ENST00000398566.3 ENST00000398557.4 ENST00000253811.6 |
DIAPH1
|
diaphanous-related formin 1 |
| chr17_+_34431212 | 4.51 |
ENST00000394495.1
|
CCL4
|
chemokine (C-C motif) ligand 4 |
| chr6_+_37137939 | 4.50 |
ENST00000373509.5
|
PIM1
|
pim-1 oncogene |
| chr5_+_137774706 | 4.50 |
ENST00000378339.2
ENST00000254901.5 ENST00000506158.1 |
REEP2
|
receptor accessory protein 2 |
| chr11_-_119252359 | 4.44 |
ENST00000455332.2
|
USP2
|
ubiquitin specific peptidase 2 |
| chr19_+_18794470 | 4.37 |
ENST00000321949.8
ENST00000338797.6 |
CRTC1
|
CREB regulated transcription coactivator 1 |
| chr11_-_61684962 | 4.34 |
ENST00000394836.2
|
RAB3IL1
|
RAB3A interacting protein (rabin3)-like 1 |
| chr1_-_236228403 | 4.29 |
ENST00000366595.3
|
NID1
|
nidogen 1 |
| chr2_-_239197201 | 4.27 |
ENST00000254658.3
|
PER2
|
period circadian clock 2 |
| chr14_-_100070363 | 4.25 |
ENST00000380243.4
|
CCDC85C
|
coiled-coil domain containing 85C |
| chr6_+_157802165 | 4.24 |
ENST00000414563.2
ENST00000359775.5 |
ZDHHC14
|
zinc finger, DHHC-type containing 14 |
| chr8_-_10588010 | 4.23 |
ENST00000304501.1
|
SOX7
|
SRY (sex determining region Y)-box 7 |
| chr9_-_127533519 | 4.18 |
ENST00000487099.2
ENST00000344523.4 ENST00000373584.3 |
NR6A1
|
nuclear receptor subfamily 6, group A, member 1 |
| chr3_+_38537763 | 4.10 |
ENST00000287675.5
ENST00000358249.2 ENST00000422077.2 |
EXOG
|
endo/exonuclease (5'-3'), endonuclease G-like |
| chr9_-_101471479 | 4.05 |
ENST00000259455.2
|
GABBR2
|
gamma-aminobutyric acid (GABA) B receptor, 2 |
| chr22_-_51066521 | 4.05 |
ENST00000395621.3
ENST00000395619.3 ENST00000356098.5 ENST00000216124.5 ENST00000453344.2 ENST00000547307.1 ENST00000547805.1 |
ARSA
|
arylsulfatase A |
| chr7_+_102004322 | 4.04 |
ENST00000496391.1
|
PRKRIP1
|
PRKR interacting protein 1 (IL11 inducible) |
| chr15_+_41851211 | 3.93 |
ENST00000263798.3
|
TYRO3
|
TYRO3 protein tyrosine kinase |
| chr17_-_39890893 | 3.91 |
ENST00000393939.2
ENST00000347901.4 ENST00000341193.5 ENST00000310778.5 |
HAP1
|
huntingtin-associated protein 1 |
| chr13_-_28545276 | 3.91 |
ENST00000381020.7
|
CDX2
|
caudal type homeobox 2 |
| chr8_-_134584152 | 3.86 |
ENST00000521180.1
ENST00000517668.1 ENST00000319914.5 |
ST3GAL1
|
ST3 beta-galactoside alpha-2,3-sialyltransferase 1 |
| chr4_-_17812309 | 3.78 |
ENST00000382247.1
ENST00000536863.1 |
DCAF16
|
DDB1 and CUL4 associated factor 16 |
| chr11_-_2906979 | 3.78 |
ENST00000380725.1
ENST00000313407.6 ENST00000430149.2 ENST00000440480.2 ENST00000414822.3 |
CDKN1C
|
cyclin-dependent kinase inhibitor 1C (p57, Kip2) |
| chr2_+_29204161 | 3.73 |
ENST00000379558.4
ENST00000403861.2 |
FAM179A
|
family with sequence similarity 179, member A |
| chr5_-_149492904 | 3.65 |
ENST00000286301.3
ENST00000511344.1 |
CSF1R
|
colony stimulating factor 1 receptor |
| chr7_+_77325738 | 3.64 |
ENST00000334955.8
|
RSBN1L
|
round spermatid basic protein 1-like |
| chr8_-_67579418 | 3.57 |
ENST00000310421.4
|
VCPIP1
|
valosin containing protein (p97)/p47 complex interacting protein 1 |
| chr20_-_33680588 | 3.55 |
ENST00000451813.2
ENST00000432634.2 |
TRPC4AP
|
transient receptor potential cation channel, subfamily C, member 4 associated protein |
| chr22_+_31742875 | 3.47 |
ENST00000504184.2
|
AC005003.1
|
CDNA FLJ20464 fis, clone KAT06158; HCG1777549; Uncharacterized protein |
| chr16_-_67840442 | 3.47 |
ENST00000536251.1
ENST00000448631.2 ENST00000602677.1 ENST00000411657.2 ENST00000425512.2 ENST00000317506.3 |
RANBP10
|
RAN binding protein 10 |
| chr11_-_6677018 | 3.43 |
ENST00000299441.3
|
DCHS1
|
dachsous cadherin-related 1 |
| chr10_-_74114714 | 3.39 |
ENST00000338820.3
ENST00000394903.2 ENST00000444643.2 |
DNAJB12
|
DnaJ (Hsp40) homolog, subfamily B, member 12 |
| chr2_+_113931513 | 3.36 |
ENST00000245796.6
ENST00000441564.3 |
PSD4
|
pleckstrin and Sec7 domain containing 4 |
| chr10_-_50323543 | 3.36 |
ENST00000332853.4
ENST00000298454.3 |
VSTM4
|
V-set and transmembrane domain containing 4 |
| chr2_-_69870835 | 3.32 |
ENST00000409085.4
ENST00000406297.3 |
AAK1
|
AP2 associated kinase 1 |
| chr17_-_9929581 | 3.30 |
ENST00000437099.2
ENST00000396115.2 |
GAS7
|
growth arrest-specific 7 |
| chr11_+_43380459 | 3.29 |
ENST00000299240.6
ENST00000039989.4 |
TTC17
|
tetratricopeptide repeat domain 17 |
| chr8_+_26240414 | 3.21 |
ENST00000380629.2
|
BNIP3L
|
BCL2/adenovirus E1B 19kDa interacting protein 3-like |
| chr11_-_117186946 | 3.20 |
ENST00000313005.6
ENST00000528053.1 |
BACE1
|
beta-site APP-cleaving enzyme 1 |
| chr10_-_81205373 | 3.20 |
ENST00000372336.3
|
ZCCHC24
|
zinc finger, CCHC domain containing 24 |
| chr15_+_42066632 | 3.18 |
ENST00000457542.2
ENST00000221214.6 ENST00000260357.7 ENST00000456763.2 |
MAPKBP1
|
mitogen-activated protein kinase binding protein 1 |
| chr15_-_34628951 | 3.15 |
ENST00000397707.2
ENST00000560611.1 |
SLC12A6
|
solute carrier family 12 (potassium/chloride transporter), member 6 |
| chrX_-_65858865 | 3.15 |
ENST00000374719.3
ENST00000450752.1 ENST00000451436.2 |
EDA2R
|
ectodysplasin A2 receptor |
| chr5_+_139493665 | 3.10 |
ENST00000331327.3
|
PURA
|
purine-rich element binding protein A |
| chr17_-_72889697 | 3.05 |
ENST00000310226.6
|
FADS6
|
fatty acid desaturase 6 |
| chr10_-_105615164 | 3.04 |
ENST00000355946.2
ENST00000369774.4 |
SH3PXD2A
|
SH3 and PX domains 2A |
| chr1_+_27114418 | 3.03 |
ENST00000078527.4
|
PIGV
|
phosphatidylinositol glycan anchor biosynthesis, class V |
| chr9_-_131534160 | 2.97 |
ENST00000291900.2
|
ZER1
|
zyg-11 related, cell cycle regulator |
| chr13_-_21476900 | 2.95 |
ENST00000400602.2
ENST00000255305.6 |
XPO4
|
exportin 4 |
| chr19_-_16682987 | 2.94 |
ENST00000431408.1
ENST00000436553.2 ENST00000595753.1 |
SLC35E1
|
solute carrier family 35, member E1 |
| chr20_-_48099182 | 2.94 |
ENST00000371741.4
|
KCNB1
|
potassium voltage-gated channel, Shab-related subfamily, member 1 |
| chrX_+_21857717 | 2.93 |
ENST00000379484.5
|
MBTPS2
|
membrane-bound transcription factor peptidase, site 2 |
| chr5_-_115910630 | 2.92 |
ENST00000343348.6
|
SEMA6A
|
sema domain, transmembrane domain (TM), and cytoplasmic domain, (semaphorin) 6A |
| chr12_-_49393092 | 2.85 |
ENST00000421952.2
|
DDN
|
dendrin |
| chr18_+_43914159 | 2.84 |
ENST00000588679.1
ENST00000269439.7 ENST00000543885.1 |
RNF165
|
ring finger protein 165 |
| chr17_-_27916621 | 2.83 |
ENST00000225394.3
|
GIT1
|
G protein-coupled receptor kinase interacting ArfGAP 1 |
| chr1_-_2145620 | 2.77 |
ENST00000545087.1
|
AL590822.1
|
Uncharacterized protein |
| chr2_-_109605663 | 2.76 |
ENST00000409271.1
ENST00000258443.2 ENST00000376651.1 |
EDAR
|
ectodysplasin A receptor |
| chr10_-_128077024 | 2.75 |
ENST00000368679.4
ENST00000368676.4 ENST00000448723.1 |
ADAM12
|
ADAM metallopeptidase domain 12 |
| chrX_+_107334895 | 2.74 |
ENST00000372232.3
ENST00000345734.3 ENST00000372254.3 |
ATG4A
|
autophagy related 4A, cysteine peptidase |
| chr17_-_79885576 | 2.73 |
ENST00000574686.1
ENST00000357736.4 |
MAFG
|
v-maf avian musculoaponeurotic fibrosarcoma oncogene homolog G |
| chr2_-_37193606 | 2.72 |
ENST00000379213.2
ENST00000263918.4 |
STRN
|
striatin, calmodulin binding protein |
| chr9_+_91933407 | 2.70 |
ENST00000375807.3
ENST00000339901.4 |
SECISBP2
|
SECIS binding protein 2 |
| chr6_+_37225540 | 2.69 |
ENST00000373491.3
|
TBC1D22B
|
TBC1 domain family, member 22B |
| chr22_-_19279201 | 2.65 |
ENST00000353891.5
ENST00000263200.10 ENST00000427926.1 ENST00000449918.1 |
CLTCL1
|
clathrin, heavy chain-like 1 |
| chr3_-_50396978 | 2.63 |
ENST00000266025.3
|
TMEM115
|
transmembrane protein 115 |
| chr3_-_126194707 | 2.61 |
ENST00000336332.5
ENST00000389709.3 |
ZXDC
|
ZXD family zinc finger C |
| chr12_+_74931551 | 2.60 |
ENST00000519948.2
|
ATXN7L3B
|
ataxin 7-like 3B |
| chr5_-_112630598 | 2.52 |
ENST00000302475.4
|
MCC
|
mutated in colorectal cancers |
| chr14_+_102829300 | 2.49 |
ENST00000359520.7
|
TECPR2
|
tectonin beta-propeller repeat containing 2 |
| chr11_-_62599505 | 2.48 |
ENST00000377897.4
ENST00000394690.1 ENST00000541317.1 ENST00000294179.3 |
STX5
|
syntaxin 5 |
| chr12_-_48152428 | 2.47 |
ENST00000449771.2
ENST00000395358.3 |
RAPGEF3
|
Rap guanine nucleotide exchange factor (GEF) 3 |
| chr2_-_113542063 | 2.46 |
ENST00000263339.3
|
IL1A
|
interleukin 1, alpha |
| chr9_+_102668915 | 2.45 |
ENST00000259400.6
ENST00000531035.1 ENST00000525640.1 ENST00000534052.1 ENST00000526607.1 |
STX17
|
syntaxin 17 |
| chr3_-_120068143 | 2.45 |
ENST00000295628.3
|
LRRC58
|
leucine rich repeat containing 58 |
| chr17_+_1958388 | 2.42 |
ENST00000399849.3
|
HIC1
|
hypermethylated in cancer 1 |
| chr15_+_91411810 | 2.42 |
ENST00000268171.3
|
FURIN
|
furin (paired basic amino acid cleaving enzyme) |
| chr3_-_178790057 | 2.42 |
ENST00000311417.2
|
ZMAT3
|
zinc finger, matrin-type 3 |
| chr7_+_31092076 | 2.40 |
ENST00000304166.4
|
ADCYAP1R1
|
adenylate cyclase activating polypeptide 1 (pituitary) receptor type I |
| chr22_-_37545972 | 2.35 |
ENST00000216223.5
|
IL2RB
|
interleukin 2 receptor, beta |
| chr17_+_60704762 | 2.34 |
ENST00000303375.5
|
MRC2
|
mannose receptor, C type 2 |
| chr7_-_44924939 | 2.29 |
ENST00000395699.2
|
PURB
|
purine-rich element binding protein B |
| chr1_+_55464600 | 2.28 |
ENST00000371265.4
|
BSND
|
Bartter syndrome, infantile, with sensorineural deafness (Barttin) |
| chr5_-_131347306 | 2.26 |
ENST00000296869.4
ENST00000379249.3 ENST00000379272.2 ENST00000379264.2 |
ACSL6
|
acyl-CoA synthetase long-chain family member 6 |
| chr8_+_23104130 | 2.26 |
ENST00000313219.7
ENST00000519984.1 |
CHMP7
|
charged multivesicular body protein 7 |
| chr10_+_102295616 | 2.19 |
ENST00000299163.6
|
HIF1AN
|
hypoxia inducible factor 1, alpha subunit inhibitor |
| chr2_+_111878483 | 2.18 |
ENST00000308659.8
ENST00000357757.2 ENST00000393253.2 ENST00000337565.5 ENST00000393256.3 |
BCL2L11
|
BCL2-like 11 (apoptosis facilitator) |
| chr12_-_53625958 | 2.17 |
ENST00000327550.3
ENST00000546717.1 ENST00000425354.2 ENST00000394426.1 |
RARG
|
retinoic acid receptor, gamma |
| chr19_+_34745442 | 2.13 |
ENST00000299505.6
ENST00000588470.1 ENST00000589583.1 ENST00000588338.2 |
KIAA0355
|
KIAA0355 |
| chr17_-_5372271 | 2.11 |
ENST00000225296.3
|
DHX33
|
DEAH (Asp-Glu-Ala-His) box polypeptide 33 |
| chr16_-_4292071 | 2.09 |
ENST00000399609.3
|
SRL
|
sarcalumenin |
| chr17_+_33307503 | 2.08 |
ENST00000378526.4
ENST00000585941.1 ENST00000262327.5 ENST00000592690.1 ENST00000585740.1 |
LIG3
|
ligase III, DNA, ATP-dependent |
| chr11_+_45868957 | 2.03 |
ENST00000443527.2
|
CRY2
|
cryptochrome 2 (photolyase-like) |
| chr2_-_70995307 | 2.01 |
ENST00000264436.4
ENST00000355733.3 ENST00000447731.2 ENST00000430656.1 ENST00000413157.2 |
ADD2
|
adducin 2 (beta) |
| chr13_+_98086445 | 2.00 |
ENST00000245304.4
|
RAP2A
|
RAP2A, member of RAS oncogene family |
| chr1_-_46598284 | 2.00 |
ENST00000423209.1
ENST00000262741.5 |
PIK3R3
|
phosphoinositide-3-kinase, regulatory subunit 3 (gamma) |
| chr2_+_102759199 | 1.98 |
ENST00000409288.1
ENST00000410023.1 |
IL1R1
|
interleukin 1 receptor, type I |
| chr10_-_99161033 | 1.97 |
ENST00000315563.6
ENST00000370992.4 ENST00000414986.1 |
RRP12
|
ribosomal RNA processing 12 homolog (S. cerevisiae) |
| chr2_+_206547215 | 1.94 |
ENST00000360409.3
ENST00000540178.1 ENST00000540841.1 ENST00000355117.4 ENST00000450507.1 ENST00000417189.1 |
NRP2
|
neuropilin 2 |
| chr22_+_38004473 | 1.89 |
ENST00000414350.3
ENST00000343632.4 |
GGA1
|
golgi-associated, gamma adaptin ear containing, ARF binding protein 1 |
| chr3_-_114790179 | 1.89 |
ENST00000462705.1
|
ZBTB20
|
zinc finger and BTB domain containing 20 |
| chr12_-_105630016 | 1.88 |
ENST00000258530.3
|
APPL2
|
adaptor protein, phosphotyrosine interaction, PH domain and leucine zipper containing 2 |
| chr7_-_17980091 | 1.84 |
ENST00000409389.1
ENST00000409604.1 ENST00000428135.3 |
SNX13
|
sorting nexin 13 |
| chr5_+_40679584 | 1.84 |
ENST00000302472.3
|
PTGER4
|
prostaglandin E receptor 4 (subtype EP4) |
| chr17_-_42345487 | 1.84 |
ENST00000262418.6
|
SLC4A1
|
solute carrier family 4 (anion exchanger), member 1 (Diego blood group) |
| chr1_-_161102421 | 1.83 |
ENST00000490843.2
ENST00000368006.3 ENST00000392188.1 ENST00000545495.1 |
DEDD
|
death effector domain containing |
| chr16_-_279405 | 1.82 |
ENST00000430864.1
ENST00000293872.8 ENST00000337351.4 ENST00000397783.1 |
LUC7L
|
LUC7-like (S. cerevisiae) |
| chr20_+_34700333 | 1.82 |
ENST00000441639.1
|
EPB41L1
|
erythrocyte membrane protein band 4.1-like 1 |
| chr20_+_1875110 | 1.80 |
ENST00000400068.3
|
SIRPA
|
signal-regulatory protein alpha |
| chr22_-_42466782 | 1.79 |
ENST00000396398.3
ENST00000403363.1 ENST00000402937.1 |
NAGA
|
N-acetylgalactosaminidase, alpha- |
| chr1_+_118148556 | 1.77 |
ENST00000369448.3
|
FAM46C
|
family with sequence similarity 46, member C |
| chr6_+_106546808 | 1.77 |
ENST00000369089.3
|
PRDM1
|
PR domain containing 1, with ZNF domain |
| chr12_+_124196865 | 1.75 |
ENST00000330342.3
|
ATP6V0A2
|
ATPase, H+ transporting, lysosomal V0 subunit a2 |
| chr18_+_63418068 | 1.67 |
ENST00000397968.2
|
CDH7
|
cadherin 7, type 2 |
| chr11_-_10590238 | 1.67 |
ENST00000256178.3
|
LYVE1
|
lymphatic vessel endothelial hyaluronan receptor 1 |
| chr1_-_151119087 | 1.65 |
ENST00000341697.3
ENST00000368914.3 |
SEMA6C
|
sema domain, transmembrane domain (TM), and cytoplasmic domain, (semaphorin) 6C |
| chr6_-_109762344 | 1.64 |
ENST00000521072.2
ENST00000424445.2 ENST00000440797.2 |
PPIL6
|
peptidylprolyl isomerase (cyclophilin)-like 6 |
| chr5_+_135468516 | 1.63 |
ENST00000507118.1
ENST00000511116.1 ENST00000545279.1 ENST00000545620.1 |
SMAD5
|
SMAD family member 5 |
| chr11_-_6624801 | 1.63 |
ENST00000534343.1
ENST00000254605.6 |
RRP8
|
ribosomal RNA processing 8, methyltransferase, homolog (yeast) |
| chr16_-_31147020 | 1.62 |
ENST00000568261.1
ENST00000567797.1 ENST00000317508.6 |
PRSS8
|
protease, serine, 8 |
| chr2_-_86564776 | 1.62 |
ENST00000165698.5
ENST00000541910.1 ENST00000535845.1 |
REEP1
|
receptor accessory protein 1 |
| chr10_+_76586348 | 1.61 |
ENST00000372724.1
ENST00000287239.4 ENST00000372714.1 |
KAT6B
|
K(lysine) acetyltransferase 6B |
| chr13_+_58206655 | 1.60 |
ENST00000377918.3
|
PCDH17
|
protocadherin 17 |
| chr3_+_88188254 | 1.60 |
ENST00000309495.5
|
ZNF654
|
zinc finger protein 654 |
| chr3_-_56502375 | 1.59 |
ENST00000288221.6
|
ERC2
|
ELKS/RAB6-interacting/CAST family member 2 |
| chr17_+_12692774 | 1.51 |
ENST00000379672.5
ENST00000340825.3 |
ARHGAP44
|
Rho GTPase activating protein 44 |
| chr6_-_90529418 | 1.50 |
ENST00000439638.1
ENST00000369393.3 ENST00000428876.1 |
MDN1
|
MDN1, midasin homolog (yeast) |
| chr2_-_182545603 | 1.49 |
ENST00000295108.3
|
NEUROD1
|
neuronal differentiation 1 |
| chr16_-_4166186 | 1.47 |
ENST00000294016.3
|
ADCY9
|
adenylate cyclase 9 |
| chr12_+_53774423 | 1.46 |
ENST00000426431.2
|
SP1
|
Sp1 transcription factor |
| chr4_+_1795012 | 1.45 |
ENST00000481110.2
ENST00000340107.4 ENST00000440486.2 ENST00000412135.2 |
FGFR3
|
fibroblast growth factor receptor 3 |
| chrX_-_100548045 | 1.44 |
ENST00000372907.3
ENST00000372905.2 |
TAF7L
|
TAF7-like RNA polymerase II, TATA box binding protein (TBP)-associated factor, 50kDa |
| chr14_-_77279153 | 1.44 |
ENST00000251089.2
|
ANGEL1
|
angel homolog 1 (Drosophila) |
| chr1_-_153919128 | 1.41 |
ENST00000361217.4
|
DENND4B
|
DENN/MADD domain containing 4B |
| chr11_-_108093329 | 1.40 |
ENST00000278612.8
|
NPAT
|
nuclear protein, ataxia-telangiectasia locus |
| chr19_+_45754505 | 1.37 |
ENST00000262891.4
ENST00000300843.4 |
MARK4
|
MAP/microtubule affinity-regulating kinase 4 |
| chr17_+_68165657 | 1.36 |
ENST00000243457.3
|
KCNJ2
|
potassium inwardly-rectifying channel, subfamily J, member 2 |
| chr12_-_123450986 | 1.36 |
ENST00000344275.7
ENST00000442833.2 ENST00000280560.8 ENST00000540285.1 ENST00000346530.5 |
ABCB9
|
ATP-binding cassette, sub-family B (MDR/TAP), member 9 |
| chr11_+_66025167 | 1.34 |
ENST00000394067.2
ENST00000316924.5 ENST00000421552.1 ENST00000394078.1 |
KLC2
|
kinesin light chain 2 |
| chr9_-_117692697 | 1.34 |
ENST00000223795.2
|
TNFSF8
|
tumor necrosis factor (ligand) superfamily, member 8 |
| chr4_+_55095264 | 1.33 |
ENST00000257290.5
|
PDGFRA
|
platelet-derived growth factor receptor, alpha polypeptide |
| chr21_+_45285050 | 1.31 |
ENST00000291572.8
|
AGPAT3
|
1-acylglycerol-3-phosphate O-acyltransferase 3 |
Network of associatons between targets according to the STRING database.

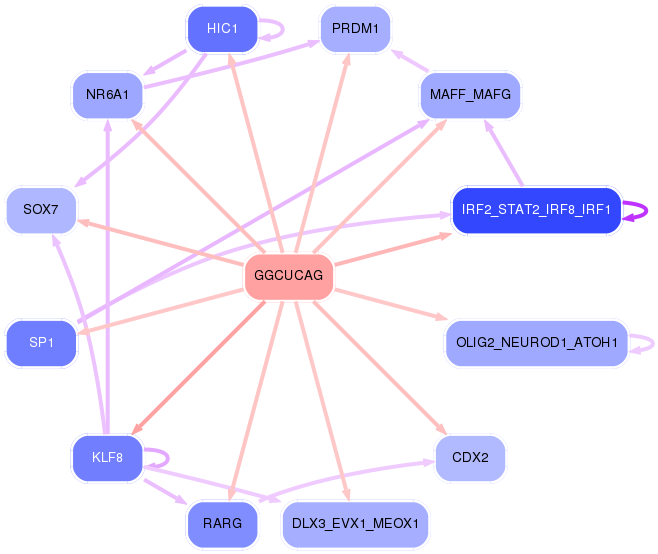
First level regulatory network of GGCUCAG
Gene Ontology Analysis
Gene overrepresentation in biological_process category:
| Log-likelihood per target | Total log-likelihood | Term | Description |
|---|---|---|---|
| 5.2 | 15.7 | GO:0033693 | neurofilament bundle assembly(GO:0033693) |
| 4.4 | 13.2 | GO:0072275 | metanephric glomerulus morphogenesis(GO:0072275) metanephric glomerulus vasculature morphogenesis(GO:0072276) metanephric glomerular capillary formation(GO:0072277) |
| 2.6 | 7.9 | GO:1903070 | negative regulation of ER-associated ubiquitin-dependent protein catabolic process(GO:1903070) |
| 2.2 | 8.9 | GO:0009386 | translational attenuation(GO:0009386) |
| 2.2 | 12.9 | GO:2000323 | negative regulation of glucocorticoid receptor signaling pathway(GO:2000323) |
| 2.1 | 6.4 | GO:1990168 | protein K33-linked deubiquitination(GO:1990168) |
| 2.1 | 6.4 | GO:0006419 | alanyl-tRNA aminoacylation(GO:0006419) |
| 2.0 | 8.0 | GO:0042796 | snRNA transcription from RNA polymerase III promoter(GO:0042796) |
| 1.9 | 5.7 | GO:1902809 | skeletal muscle fiber differentiation(GO:0098528) regulation of skeletal muscle fiber differentiation(GO:1902809) |
| 1.7 | 6.8 | GO:2000564 | CD8-positive, alpha-beta T cell proliferation(GO:0035740) regulation of CD8-positive, alpha-beta T cell proliferation(GO:2000564) |
| 1.7 | 10.2 | GO:0030820 | regulation of cyclic nucleotide catabolic process(GO:0030805) regulation of cAMP catabolic process(GO:0030820) regulation of purine nucleotide catabolic process(GO:0033121) |
| 1.7 | 5.0 | GO:0003241 | growth involved in heart morphogenesis(GO:0003241) |
| 1.6 | 6.3 | GO:0032899 | regulation of neurotrophin production(GO:0032899) |
| 1.5 | 4.5 | GO:1904204 | regulation of skeletal muscle hypertrophy(GO:1904204) |
| 1.5 | 4.5 | GO:0050916 | sensory perception of sweet taste(GO:0050916) |
| 1.5 | 4.4 | GO:1902630 | regulation of membrane hyperpolarization(GO:1902630) |
| 1.3 | 3.9 | GO:0014807 | regulation of somitogenesis(GO:0014807) |
| 1.3 | 5.2 | GO:0032416 | negative regulation of sodium:proton antiporter activity(GO:0032416) |
| 1.2 | 4.9 | GO:0007538 | primary sex determination(GO:0007538) |
| 1.1 | 3.4 | GO:0072137 | condensed mesenchymal cell proliferation(GO:0072137) |
| 1.1 | 2.2 | GO:0061428 | negative regulation of transcription from RNA polymerase II promoter in response to hypoxia(GO:0061428) |
| 1.1 | 2.2 | GO:1902263 | apoptotic process involved in embryonic digit morphogenesis(GO:1902263) |
| 1.0 | 5.0 | GO:0048807 | female genitalia morphogenesis(GO:0048807) |
| 0.9 | 2.7 | GO:0051697 | protein delipidation(GO:0051697) |
| 0.9 | 4.3 | GO:0051946 | regulation of amino acid uptake involved in synaptic transmission(GO:0051941) regulation of glutamate uptake involved in transmission of nerve impulse(GO:0051946) regulation of L-glutamate import(GO:1900920) |
| 0.8 | 3.2 | GO:1900425 | negative regulation of defense response to bacterium(GO:1900425) |
| 0.8 | 3.0 | GO:0072674 | multinuclear osteoclast differentiation(GO:0072674) osteoclast fusion(GO:0072675) |
| 0.8 | 4.5 | GO:2000503 | positive regulation of natural killer cell chemotaxis(GO:2000503) |
| 0.7 | 4.4 | GO:2000391 | positive regulation of neutrophil extravasation(GO:2000391) |
| 0.7 | 2.9 | GO:0010701 | positive regulation of norepinephrine secretion(GO:0010701) |
| 0.7 | 5.0 | GO:0046549 | retinal cone cell differentiation(GO:0042670) retinal cone cell development(GO:0046549) |
| 0.7 | 3.6 | GO:0035871 | protein K11-linked deubiquitination(GO:0035871) |
| 0.7 | 2.1 | GO:1901859 | negative regulation of mitochondrial DNA replication(GO:0090298) negative regulation of mitochondrial DNA metabolic process(GO:1901859) |
| 0.7 | 5.5 | GO:0050861 | positive regulation of B cell receptor signaling pathway(GO:0050861) |
| 0.7 | 0.7 | GO:0035408 | histone H3-T6 phosphorylation(GO:0035408) |
| 0.6 | 1.9 | GO:0097491 | sympathetic neuron projection extension(GO:0097490) sympathetic neuron projection guidance(GO:0097491) |
| 0.6 | 3.2 | GO:0042539 | hypotonic salinity response(GO:0042539) cellular hypotonic salinity response(GO:0071477) |
| 0.6 | 1.8 | GO:2000417 | negative regulation of eosinophil migration(GO:2000417) |
| 0.6 | 5.5 | GO:1904354 | negative regulation of telomere capping(GO:1904354) |
| 0.6 | 7.9 | GO:2001135 | regulation of endocytic recycling(GO:2001135) |
| 0.5 | 2.2 | GO:0070384 | Harderian gland development(GO:0070384) |
| 0.5 | 3.2 | GO:0035694 | mitochondrial protein catabolic process(GO:0035694) |
| 0.5 | 0.5 | GO:2000777 | positive regulation of proteasomal ubiquitin-dependent protein catabolic process involved in cellular response to hypoxia(GO:2000777) |
| 0.5 | 10.9 | GO:0097150 | neuronal stem cell population maintenance(GO:0097150) |
| 0.5 | 2.5 | GO:0016240 | autophagosome docking(GO:0016240) |
| 0.5 | 2.4 | GO:0038110 | interleukin-2-mediated signaling pathway(GO:0038110) |
| 0.5 | 7.3 | GO:0051823 | regulation of synapse structural plasticity(GO:0051823) |
| 0.5 | 4.5 | GO:2000138 | positive regulation of cell proliferation involved in heart morphogenesis(GO:2000138) |
| 0.4 | 5.0 | GO:0048263 | determination of dorsal identity(GO:0048263) |
| 0.4 | 1.2 | GO:0001923 | B-1 B cell differentiation(GO:0001923) |
| 0.4 | 4.5 | GO:0006030 | chitin metabolic process(GO:0006030) chitin catabolic process(GO:0006032) |
| 0.4 | 3.7 | GO:0038145 | macrophage colony-stimulating factor signaling pathway(GO:0038145) cell-cell junction maintenance(GO:0045217) |
| 0.4 | 7.2 | GO:0010510 | regulation of acetyl-CoA biosynthetic process from pyruvate(GO:0010510) |
| 0.4 | 1.6 | GO:2000807 | regulation of synaptic vesicle clustering(GO:2000807) |
| 0.4 | 0.8 | GO:0098917 | retrograde trans-synaptic signaling(GO:0098917) |
| 0.4 | 1.5 | GO:0035021 | negative regulation of Rac protein signal transduction(GO:0035021) |
| 0.4 | 1.5 | GO:0035881 | amacrine cell differentiation(GO:0035881) intestinal epithelial structure maintenance(GO:0060729) |
| 0.4 | 2.5 | GO:0048280 | vesicle fusion with Golgi apparatus(GO:0048280) |
| 0.4 | 1.8 | GO:0033078 | extrathymic T cell differentiation(GO:0033078) |
| 0.3 | 4.5 | GO:0035372 | protein localization to microtubule(GO:0035372) |
| 0.3 | 8.3 | GO:0045956 | positive regulation of calcium ion-dependent exocytosis(GO:0045956) |
| 0.3 | 1.4 | GO:0090076 | relaxation of skeletal muscle(GO:0090076) |
| 0.3 | 4.6 | GO:0014051 | gamma-aminobutyric acid secretion(GO:0014051) |
| 0.3 | 3.1 | GO:0006268 | DNA unwinding involved in DNA replication(GO:0006268) |
| 0.3 | 7.6 | GO:0071526 | semaphorin-plexin signaling pathway(GO:0071526) |
| 0.3 | 2.7 | GO:2000623 | regulation of nuclear-transcribed mRNA catabolic process, nonsense-mediated decay(GO:2000622) negative regulation of nuclear-transcribed mRNA catabolic process, nonsense-mediated decay(GO:2000623) |
| 0.3 | 8.0 | GO:0030488 | tRNA methylation(GO:0030488) |
| 0.3 | 4.4 | GO:0045475 | locomotor rhythm(GO:0045475) |
| 0.3 | 1.2 | GO:0001757 | somite specification(GO:0001757) sclerotome development(GO:0061056) |
| 0.3 | 2.9 | GO:2001224 | positive regulation of neuron migration(GO:2001224) |
| 0.3 | 2.9 | GO:0060385 | axonogenesis involved in innervation(GO:0060385) |
| 0.3 | 3.9 | GO:0070050 | neuron cellular homeostasis(GO:0070050) |
| 0.3 | 1.6 | GO:0001880 | Mullerian duct regression(GO:0001880) |
| 0.3 | 6.2 | GO:0044126 | regulation of growth of symbiont in host(GO:0044126) |
| 0.3 | 4.2 | GO:0018345 | protein palmitoylation(GO:0018345) |
| 0.3 | 1.0 | GO:0072660 | positive regulation of cell communication by electrical coupling(GO:0010650) maintenance of protein location in membrane(GO:0072658) maintenance of protein location in plasma membrane(GO:0072660) positive regulation of membrane depolarization during cardiac muscle cell action potential(GO:1900827) |
| 0.2 | 0.7 | GO:0009449 | gamma-aminobutyric acid biosynthetic process(GO:0009449) |
| 0.2 | 5.5 | GO:0045717 | negative regulation of fatty acid biosynthetic process(GO:0045717) |
| 0.2 | 1.5 | GO:0036166 | phenotypic switching(GO:0036166) regulation of phenotypic switching(GO:1900239) |
| 0.2 | 2.9 | GO:1990440 | positive regulation of transcription from RNA polymerase II promoter in response to endoplasmic reticulum stress(GO:1990440) |
| 0.2 | 3.4 | GO:0070389 | chaperone cofactor-dependent protein refolding(GO:0070389) |
| 0.2 | 1.4 | GO:0032483 | regulation of Rab protein signal transduction(GO:0032483) |
| 0.2 | 1.6 | GO:0046015 | regulation of transcription by glucose(GO:0046015) |
| 0.2 | 1.4 | GO:0035672 | oligopeptide transmembrane transport(GO:0035672) |
| 0.2 | 3.1 | GO:0010668 | ectodermal cell differentiation(GO:0010668) |
| 0.2 | 2.0 | GO:0045198 | establishment of epithelial cell apical/basal polarity(GO:0045198) |
| 0.2 | 2.3 | GO:1904903 | ESCRT complex disassembly(GO:1904896) ESCRT III complex disassembly(GO:1904903) |
| 0.2 | 0.7 | GO:1901165 | positive regulation of trophoblast cell migration(GO:1901165) |
| 0.2 | 1.1 | GO:0060414 | aorta smooth muscle tissue morphogenesis(GO:0060414) |
| 0.2 | 7.1 | GO:0000188 | inactivation of MAPK activity(GO:0000188) |
| 0.2 | 2.4 | GO:0043517 | positive regulation of DNA damage response, signal transduction by p53 class mediator(GO:0043517) |
| 0.2 | 0.7 | GO:0030644 | cellular chloride ion homeostasis(GO:0030644) |
| 0.2 | 0.7 | GO:0002408 | myeloid dendritic cell chemotaxis(GO:0002408) |
| 0.2 | 1.1 | GO:0061669 | spontaneous neurotransmitter secretion(GO:0061669) spontaneous synaptic transmission(GO:0098814) |
| 0.2 | 3.9 | GO:0060384 | innervation(GO:0060384) |
| 0.2 | 0.3 | GO:0048843 | negative regulation of axon extension involved in axon guidance(GO:0048843) |
| 0.2 | 3.0 | GO:0016254 | preassembly of GPI anchor in ER membrane(GO:0016254) |
| 0.1 | 3.9 | GO:0097503 | sialylation(GO:0097503) |
| 0.1 | 7.5 | GO:0032728 | positive regulation of interferon-beta production(GO:0032728) |
| 0.1 | 2.3 | GO:0032836 | glomerular basement membrane development(GO:0032836) |
| 0.1 | 1.7 | GO:0070070 | proton-transporting V-type ATPase complex assembly(GO:0070070) vacuolar proton-transporting V-type ATPase complex assembly(GO:0070072) |
| 0.1 | 4.1 | GO:0007214 | gamma-aminobutyric acid signaling pathway(GO:0007214) |
| 0.1 | 0.6 | GO:0060282 | positive regulation of oocyte development(GO:0060282) |
| 0.1 | 5.6 | GO:0000462 | maturation of SSU-rRNA from tricistronic rRNA transcript (SSU-rRNA, 5.8S rRNA, LSU-rRNA)(GO:0000462) |
| 0.1 | 3.3 | GO:2000369 | regulation of clathrin-mediated endocytosis(GO:2000369) |
| 0.1 | 3.1 | GO:0035338 | long-chain fatty-acyl-CoA biosynthetic process(GO:0035338) |
| 0.1 | 3.8 | GO:0060065 | uterus development(GO:0060065) |
| 0.1 | 0.4 | GO:0071934 | thiamine transport(GO:0015888) thiamine transmembrane transport(GO:0071934) |
| 0.1 | 1.2 | GO:0060766 | negative regulation of androgen receptor signaling pathway(GO:0060766) |
| 0.1 | 2.5 | GO:0032012 | regulation of ARF protein signal transduction(GO:0032012) |
| 0.1 | 0.6 | GO:1901911 | diadenosine polyphosphate catabolic process(GO:0015961) diphosphoinositol polyphosphate metabolic process(GO:0071543) diadenosine pentaphosphate metabolic process(GO:1901906) diadenosine pentaphosphate catabolic process(GO:1901907) diadenosine hexaphosphate metabolic process(GO:1901908) diadenosine hexaphosphate catabolic process(GO:1901909) adenosine 5'-(hexahydrogen pentaphosphate) metabolic process(GO:1901910) adenosine 5'-(hexahydrogen pentaphosphate) catabolic process(GO:1901911) |
| 0.1 | 0.6 | GO:0038092 | nodal signaling pathway(GO:0038092) |
| 0.1 | 1.2 | GO:0060605 | tube lumen cavitation(GO:0060605) salivary gland cavitation(GO:0060662) |
| 0.1 | 0.8 | GO:0035970 | peptidyl-threonine dephosphorylation(GO:0035970) |
| 0.1 | 0.5 | GO:0018125 | peptidyl-cysteine methylation(GO:0018125) |
| 0.1 | 1.6 | GO:0071786 | endoplasmic reticulum tubular network organization(GO:0071786) |
| 0.1 | 2.2 | GO:0046827 | positive regulation of protein export from nucleus(GO:0046827) |
| 0.1 | 1.3 | GO:0043374 | CD8-positive, alpha-beta T cell differentiation(GO:0043374) |
| 0.1 | 2.1 | GO:0035988 | chondrocyte proliferation(GO:0035988) |
| 0.1 | 2.7 | GO:0048268 | clathrin coat assembly(GO:0048268) |
| 0.1 | 6.6 | GO:1902108 | regulation of mitochondrial membrane permeability involved in apoptotic process(GO:1902108) |
| 0.1 | 0.9 | GO:0032464 | positive regulation of protein homooligomerization(GO:0032464) |
| 0.1 | 2.4 | GO:0060732 | positive regulation of inositol phosphate biosynthetic process(GO:0060732) |
| 0.1 | 0.3 | GO:1901491 | negative regulation of lymphangiogenesis(GO:1901491) |
| 0.1 | 1.3 | GO:0016024 | CDP-diacylglycerol biosynthetic process(GO:0016024) |
| 0.1 | 5.6 | GO:0035418 | protein localization to synapse(GO:0035418) |
| 0.1 | 4.2 | GO:0001706 | endoderm formation(GO:0001706) |
| 0.1 | 0.2 | GO:0060061 | Spemann organizer formation(GO:0060061) |
| 0.1 | 2.1 | GO:0045943 | positive regulation of transcription from RNA polymerase I promoter(GO:0045943) |
| 0.1 | 2.0 | GO:0050901 | leukocyte tethering or rolling(GO:0050901) |
| 0.1 | 0.8 | GO:0051597 | response to methylmercury(GO:0051597) |
| 0.1 | 8.0 | GO:0007368 | determination of left/right symmetry(GO:0007368) |
| 0.1 | 3.2 | GO:0050435 | beta-amyloid metabolic process(GO:0050435) |
| 0.1 | 2.0 | GO:2001275 | positive regulation of glucose import in response to insulin stimulus(GO:2001275) |
| 0.1 | 1.5 | GO:0071880 | adenylate cyclase-activating adrenergic receptor signaling pathway(GO:0071880) |
| 0.1 | 0.6 | GO:0036297 | interstrand cross-link repair(GO:0036297) |
| 0.1 | 0.9 | GO:0010739 | positive regulation of protein kinase A signaling(GO:0010739) |
| 0.1 | 1.2 | GO:0045109 | intermediate filament organization(GO:0045109) |
| 0.1 | 5.1 | GO:0060996 | dendritic spine development(GO:0060996) |
| 0.1 | 0.8 | GO:0033572 | transferrin transport(GO:0033572) |
| 0.1 | 1.7 | GO:0030214 | hyaluronan catabolic process(GO:0030214) |
| 0.1 | 0.6 | GO:0045176 | apical protein localization(GO:0045176) |
| 0.1 | 4.8 | GO:0030641 | regulation of cellular pH(GO:0030641) |
| 0.1 | 0.2 | GO:0003360 | brainstem development(GO:0003360) |
| 0.1 | 2.4 | GO:1903959 | regulation of anion transmembrane transport(GO:1903959) |
| 0.1 | 1.4 | GO:0001578 | microtubule bundle formation(GO:0001578) |
| 0.1 | 4.1 | GO:0090305 | nucleic acid phosphodiester bond hydrolysis(GO:0090305) |
| 0.1 | 1.1 | GO:1902236 | negative regulation of endoplasmic reticulum stress-induced intrinsic apoptotic signaling pathway(GO:1902236) |
| 0.1 | 5.6 | GO:0021987 | cerebral cortex development(GO:0021987) |
| 0.1 | 3.6 | GO:0032465 | regulation of cytokinesis(GO:0032465) |
| 0.1 | 1.8 | GO:0030866 | cortical actin cytoskeleton organization(GO:0030866) |
| 0.1 | 1.6 | GO:0010765 | positive regulation of sodium ion transport(GO:0010765) |
| 0.0 | 6.7 | GO:0007018 | microtubule-based movement(GO:0007018) |
| 0.0 | 1.7 | GO:0006376 | mRNA splice site selection(GO:0006376) |
| 0.0 | 2.7 | GO:0070830 | bicellular tight junction assembly(GO:0070830) |
| 0.0 | 2.6 | GO:0006890 | retrograde vesicle-mediated transport, Golgi to ER(GO:0006890) |
| 0.0 | 0.2 | GO:0044336 | canonical Wnt signaling pathway involved in negative regulation of apoptotic process(GO:0044336) |
| 0.0 | 1.9 | GO:1901998 | toxin transport(GO:1901998) |
| 0.0 | 1.4 | GO:0000083 | regulation of transcription involved in G1/S transition of mitotic cell cycle(GO:0000083) |
| 0.0 | 6.0 | GO:0044782 | cilium organization(GO:0044782) |
| 0.0 | 0.7 | GO:0090200 | positive regulation of release of cytochrome c from mitochondria(GO:0090200) |
| 0.0 | 0.2 | GO:0033274 | response to vitamin B2(GO:0033274) heterochromatin maintenance(GO:0070829) |
| 0.0 | 1.6 | GO:0000413 | protein peptidyl-prolyl isomerization(GO:0000413) |
| 0.0 | 2.6 | GO:0010633 | negative regulation of epithelial cell migration(GO:0010633) |
| 0.0 | 2.1 | GO:0010923 | negative regulation of phosphatase activity(GO:0010923) |
| 0.0 | 2.3 | GO:0030574 | collagen catabolic process(GO:0030574) |
| 0.0 | 1.1 | GO:0042994 | cytoplasmic sequestering of transcription factor(GO:0042994) |
| 0.0 | 1.3 | GO:0000027 | ribosomal large subunit assembly(GO:0000027) |
| 0.0 | 1.4 | GO:0051123 | RNA polymerase II transcriptional preinitiation complex assembly(GO:0051123) |
| 0.0 | 1.2 | GO:0030206 | chondroitin sulfate biosynthetic process(GO:0030206) |
| 0.0 | 0.6 | GO:2000785 | regulation of autophagosome assembly(GO:2000785) |
| 0.0 | 1.1 | GO:0007520 | myoblast fusion(GO:0007520) |
| 0.0 | 4.0 | GO:0003014 | renal system process(GO:0003014) |
| 0.0 | 0.3 | GO:0048251 | elastic fiber assembly(GO:0048251) |
| 0.0 | 1.0 | GO:1902475 | L-alpha-amino acid transmembrane transport(GO:1902475) |
| 0.0 | 1.8 | GO:0009311 | oligosaccharide metabolic process(GO:0009311) |
| 0.0 | 1.6 | GO:0043966 | histone H3 acetylation(GO:0043966) |
| 0.0 | 0.5 | GO:0014002 | astrocyte development(GO:0014002) |
| 0.0 | 0.4 | GO:0070193 | synaptonemal complex assembly(GO:0007130) synaptonemal complex organization(GO:0070193) |
| 0.0 | 3.1 | GO:0006633 | fatty acid biosynthetic process(GO:0006633) |
| 0.0 | 2.4 | GO:0030518 | intracellular steroid hormone receptor signaling pathway(GO:0030518) |
| 0.0 | 0.3 | GO:0000042 | protein targeting to Golgi(GO:0000042) |
| 0.0 | 0.4 | GO:0060612 | adipose tissue development(GO:0060612) |
| 0.0 | 1.7 | GO:0007156 | homophilic cell adhesion via plasma membrane adhesion molecules(GO:0007156) |
Gene overrepresentation in cellular_component category:
| Log-likelihood per target | Total log-likelihood | Term | Description |
|---|---|---|---|
| 1.6 | 11.2 | GO:0043240 | Fanconi anaemia nuclear complex(GO:0043240) |
| 1.4 | 5.5 | GO:0000333 | telomerase catalytic core complex(GO:0000333) |
| 1.4 | 4.1 | GO:0038039 | G-protein coupled receptor heterodimeric complex(GO:0038039) |
| 1.1 | 10.3 | GO:0097425 | smooth endoplasmic reticulum membrane(GO:0030868) smooth endoplasmic reticulum part(GO:0097425) |
| 1.0 | 15.7 | GO:0097418 | neurofibrillary tangle(GO:0097418) |
| 0.6 | 5.2 | GO:0032593 | insulin-responsive compartment(GO:0032593) |
| 0.6 | 1.9 | GO:0002116 | semaphorin receptor complex(GO:0002116) |
| 0.6 | 3.7 | GO:1990682 | CSF1-CSF1R complex(GO:1990682) |
| 0.6 | 3.0 | GO:0031501 | mannosyltransferase complex(GO:0031501) |
| 0.5 | 4.5 | GO:0042567 | insulin-like growth factor ternary complex(GO:0042567) |
| 0.4 | 1.3 | GO:0016938 | kinesin I complex(GO:0016938) |
| 0.4 | 3.0 | GO:0031462 | Cul2-RING ubiquitin ligase complex(GO:0031462) |
| 0.4 | 12.0 | GO:0080008 | Cul4-RING E3 ubiquitin ligase complex(GO:0080008) |
| 0.4 | 5.4 | GO:0005662 | DNA replication factor A complex(GO:0005662) |
| 0.3 | 1.6 | GO:0033553 | rDNA heterochromatin(GO:0033553) |
| 0.3 | 2.7 | GO:0071439 | clathrin complex(GO:0071439) |
| 0.3 | 2.9 | GO:0032591 | dendritic spine membrane(GO:0032591) |
| 0.3 | 8.0 | GO:0035327 | transcriptionally active chromatin(GO:0035327) |
| 0.3 | 5.2 | GO:0097225 | sperm midpiece(GO:0097225) |
| 0.2 | 12.8 | GO:0016235 | aggresome(GO:0016235) |
| 0.2 | 5.6 | GO:0005666 | DNA-directed RNA polymerase III complex(GO:0005666) |
| 0.2 | 3.2 | GO:0097431 | mitotic spindle pole(GO:0097431) |
| 0.2 | 1.7 | GO:0000220 | vacuolar proton-transporting V-type ATPase, V0 domain(GO:0000220) |
| 0.2 | 2.1 | GO:0033018 | sarcoplasmic reticulum lumen(GO:0033018) |
| 0.2 | 2.6 | GO:0017119 | Golgi transport complex(GO:0017119) |
| 0.2 | 9.1 | GO:0048786 | presynaptic active zone(GO:0048786) |
| 0.2 | 5.6 | GO:0032040 | small-subunit processome(GO:0032040) |
| 0.2 | 1.4 | GO:0097504 | Gemini of coiled bodies(GO:0097504) |
| 0.2 | 2.3 | GO:0000815 | ESCRT III complex(GO:0000815) |
| 0.2 | 1.6 | GO:0070775 | H3 histone acetyltransferase complex(GO:0070775) MOZ/MORF histone acetyltransferase complex(GO:0070776) |
| 0.2 | 2.0 | GO:0097136 | Bcl-2 family protein complex(GO:0097136) |
| 0.1 | 2.0 | GO:0008290 | F-actin capping protein complex(GO:0008290) |
| 0.1 | 6.1 | GO:0033017 | sarcoplasmic reticulum membrane(GO:0033017) |
| 0.1 | 2.9 | GO:0032809 | neuronal cell body membrane(GO:0032809) cell body membrane(GO:0044298) |
| 0.1 | 5.3 | GO:0005871 | kinesin complex(GO:0005871) |
| 0.1 | 7.5 | GO:0031519 | PcG protein complex(GO:0031519) |
| 0.1 | 7.0 | GO:0031201 | SNARE complex(GO:0031201) |
| 0.1 | 3.9 | GO:1904115 | axon cytoplasm(GO:1904115) |
| 0.1 | 0.8 | GO:0043196 | varicosity(GO:0043196) |
| 0.1 | 1.6 | GO:0071782 | endoplasmic reticulum tubular network(GO:0071782) |
| 0.1 | 1.9 | GO:0016581 | NuRD complex(GO:0016581) CHD-type complex(GO:0090545) |
| 0.1 | 5.0 | GO:0005881 | cytoplasmic microtubule(GO:0005881) |
| 0.1 | 2.0 | GO:0005942 | phosphatidylinositol 3-kinase complex(GO:0005942) |
| 0.1 | 2.4 | GO:0030140 | trans-Golgi network transport vesicle(GO:0030140) |
| 0.1 | 2.7 | GO:0000159 | protein phosphatase type 2A complex(GO:0000159) |
| 0.1 | 1.8 | GO:0071004 | U2-type prespliceosome(GO:0071004) |
| 0.1 | 1.0 | GO:0001673 | male germ cell nucleus(GO:0001673) |
| 0.1 | 4.8 | GO:0031463 | Cul3-RING ubiquitin ligase complex(GO:0031463) |
| 0.1 | 5.8 | GO:0017053 | transcriptional repressor complex(GO:0017053) |
| 0.1 | 6.3 | GO:0101003 | ficolin-1-rich granule membrane(GO:0101003) |
| 0.1 | 8.9 | GO:0016605 | PML body(GO:0016605) |
| 0.1 | 0.2 | GO:0097059 | CNTFR-CLCF1 complex(GO:0097059) |
| 0.1 | 1.6 | GO:0071141 | SMAD protein complex(GO:0071141) |
| 0.1 | 5.7 | GO:0005758 | mitochondrial intermembrane space(GO:0005758) |
| 0.1 | 10.0 | GO:0043202 | lysosomal lumen(GO:0043202) |
| 0.1 | 1.0 | GO:0043194 | axon initial segment(GO:0043194) |
| 0.1 | 3.5 | GO:0005798 | Golgi-associated vesicle(GO:0005798) |
| 0.1 | 1.4 | GO:0005790 | smooth endoplasmic reticulum(GO:0005790) |
| 0.1 | 1.7 | GO:0005801 | cis-Golgi network(GO:0005801) |
| 0.1 | 1.5 | GO:0008074 | guanylate cyclase complex, soluble(GO:0008074) |
| 0.1 | 11.5 | GO:0005741 | mitochondrial outer membrane(GO:0005741) |
| 0.1 | 7.9 | GO:0005795 | Golgi stack(GO:0005795) |
| 0.1 | 1.6 | GO:0046658 | anchored component of plasma membrane(GO:0046658) |
| 0.1 | 3.1 | GO:0043195 | terminal bouton(GO:0043195) |
| 0.0 | 5.7 | GO:0005913 | cell-cell adherens junction(GO:0005913) |
| 0.0 | 8.9 | GO:0090575 | RNA polymerase II transcription factor complex(GO:0090575) |
| 0.0 | 1.5 | GO:0030687 | preribosome, large subunit precursor(GO:0030687) |
| 0.0 | 4.6 | GO:0008021 | synaptic vesicle(GO:0008021) |
| 0.0 | 6.5 | GO:0030133 | transport vesicle(GO:0030133) |
| 0.0 | 2.4 | GO:0005791 | rough endoplasmic reticulum(GO:0005791) |
| 0.0 | 10.2 | GO:0016323 | basolateral plasma membrane(GO:0016323) |
| 0.0 | 0.6 | GO:0030057 | desmosome(GO:0030057) |
| 0.0 | 0.3 | GO:0034992 | microtubule organizing center attachment site(GO:0034992) LINC complex(GO:0034993) |
| 0.0 | 2.0 | GO:0035580 | specific granule lumen(GO:0035580) |
| 0.0 | 10.4 | GO:0016607 | nuclear speck(GO:0016607) |
| 0.0 | 6.2 | GO:0005667 | transcription factor complex(GO:0005667) |
| 0.0 | 7.1 | GO:0000785 | chromatin(GO:0000785) |
| 0.0 | 19.3 | GO:0005730 | nucleolus(GO:0005730) |
| 0.0 | 1.4 | GO:0036064 | ciliary basal body(GO:0036064) |
| 0.0 | 1.6 | GO:0030864 | cortical actin cytoskeleton(GO:0030864) |
| 0.0 | 1.0 | GO:0097610 | cleavage furrow(GO:0032154) cell surface furrow(GO:0097610) |
| 0.0 | 4.9 | GO:0009897 | external side of plasma membrane(GO:0009897) |
| 0.0 | 3.7 | GO:0016604 | nuclear body(GO:0016604) |
| 0.0 | 1.5 | GO:0043197 | dendritic spine(GO:0043197) |
| 0.0 | 0.2 | GO:0001518 | voltage-gated sodium channel complex(GO:0001518) |
| 0.0 | 0.7 | GO:0005796 | Golgi lumen(GO:0005796) |
| 0.0 | 0.1 | GO:0000177 | cytoplasmic exosome (RNase complex)(GO:0000177) |
| 0.0 | 3.7 | GO:0005813 | centrosome(GO:0005813) |
| 0.0 | 0.7 | GO:1902554 | serine/threonine protein kinase complex(GO:1902554) |
Gene overrepresentation in molecular_function category:
| Log-likelihood per target | Total log-likelihood | Term | Description |
|---|---|---|---|
| 4.4 | 13.2 | GO:0005017 | platelet-derived growth factor-activated receptor activity(GO:0005017) |
| 2.1 | 6.4 | GO:1904455 | ubiquitin-specific protease activity involved in negative regulation of ERAD pathway(GO:1904455) |
| 2.1 | 6.4 | GO:0004813 | alanine-tRNA ligase activity(GO:0004813) |
| 1.4 | 4.1 | GO:0004965 | G-protein coupled GABA receptor activity(GO:0004965) |
| 1.2 | 7.2 | GO:0004741 | [pyruvate dehydrogenase (lipoamide)] phosphatase activity(GO:0004741) |
| 1.1 | 5.5 | GO:0004699 | calcium-independent protein kinase C activity(GO:0004699) |
| 1.1 | 3.2 | GO:0008798 | beta-aspartyl-peptidase activity(GO:0008798) |
| 1.1 | 7.4 | GO:0008142 | oxysterol binding(GO:0008142) |
| 1.0 | 3.1 | GO:0032422 | purine-rich negative regulatory element binding(GO:0032422) |
| 0.9 | 5.6 | GO:0034511 | U3 snoRNA binding(GO:0034511) |
| 0.8 | 5.0 | GO:0004800 | thyroxine 5'-deiodinase activity(GO:0004800) |
| 0.8 | 3.0 | GO:0004376 | glycolipid mannosyltransferase activity(GO:0004376) |
| 0.7 | 4.3 | GO:0043237 | laminin-1 binding(GO:0043237) |
| 0.7 | 8.0 | GO:0016423 | tRNA (guanine) methyltransferase activity(GO:0016423) |
| 0.6 | 4.5 | GO:0031726 | CCR1 chemokine receptor binding(GO:0031726) |
| 0.6 | 2.4 | GO:0019976 | interleukin-2 receptor activity(GO:0004911) interleukin-2 binding(GO:0019976) |
| 0.6 | 3.9 | GO:0048403 | brain-derived neurotrophic factor binding(GO:0048403) |
| 0.5 | 2.0 | GO:0004909 | interleukin-1, Type I, activating receptor activity(GO:0004909) |
| 0.5 | 2.4 | GO:0004999 | vasoactive intestinal polypeptide receptor activity(GO:0004999) |
| 0.5 | 7.1 | GO:0017017 | MAP kinase tyrosine/serine/threonine phosphatase activity(GO:0017017) |
| 0.5 | 7.9 | GO:0038191 | neuropilin binding(GO:0038191) |
| 0.4 | 2.7 | GO:0035368 | selenocysteine insertion sequence binding(GO:0035368) |
| 0.4 | 5.2 | GO:0045159 | myosin II binding(GO:0045159) |
| 0.4 | 5.0 | GO:0038036 | sphingosine-1-phosphate receptor activity(GO:0038036) sphingolipid binding(GO:0046625) |
| 0.4 | 4.5 | GO:0008061 | chitinase activity(GO:0004568) chitin binding(GO:0008061) |
| 0.4 | 4.5 | GO:0031995 | insulin-like growth factor II binding(GO:0031995) |
| 0.4 | 1.2 | GO:0030158 | protein xylosyltransferase activity(GO:0030158) |
| 0.3 | 4.9 | GO:0004065 | arylsulfatase activity(GO:0004065) |
| 0.3 | 1.4 | GO:0035673 | oligopeptide transmembrane transporter activity(GO:0035673) |
| 0.3 | 5.0 | GO:0016918 | retinal binding(GO:0016918) |
| 0.3 | 4.5 | GO:0043024 | ribosomal small subunit binding(GO:0043024) |
| 0.3 | 2.2 | GO:0071532 | ankyrin repeat binding(GO:0071532) |
| 0.3 | 3.0 | GO:0016176 | superoxide-generating NADPH oxidase activator activity(GO:0016176) |
| 0.3 | 3.9 | GO:0003836 | beta-galactoside (CMP) alpha-2,3-sialyltransferase activity(GO:0003836) |
| 0.3 | 2.7 | GO:0032051 | clathrin light chain binding(GO:0032051) |
| 0.3 | 4.4 | GO:0008140 | cAMP response element binding protein binding(GO:0008140) |
| 0.3 | 3.2 | GO:0022820 | potassium:chloride symporter activity(GO:0015379) potassium ion symporter activity(GO:0022820) |
| 0.3 | 9.1 | GO:0070742 | C2H2 zinc finger domain binding(GO:0070742) |
| 0.3 | 4.2 | GO:0019706 | protein-cysteine S-palmitoyltransferase activity(GO:0019706) protein-cysteine S-acyltransferase activity(GO:0019707) |
| 0.3 | 3.9 | GO:0004716 | receptor signaling protein tyrosine kinase activity(GO:0004716) |
| 0.3 | 6.1 | GO:0004707 | MAP kinase activity(GO:0004707) |
| 0.3 | 2.9 | GO:0005049 | nuclear export signal receptor activity(GO:0005049) |
| 0.3 | 1.8 | GO:0050733 | RS domain binding(GO:0050733) |
| 0.2 | 1.2 | GO:0061665 | SUMO ligase activity(GO:0061665) |
| 0.2 | 5.6 | GO:0001056 | RNA polymerase III activity(GO:0001056) |
| 0.2 | 2.4 | GO:0048406 | nerve growth factor binding(GO:0048406) |
| 0.2 | 3.3 | GO:0035612 | AP-2 adaptor complex binding(GO:0035612) |
| 0.2 | 2.1 | GO:0000182 | rDNA binding(GO:0000182) |
| 0.2 | 1.8 | GO:0004957 | prostaglandin E receptor activity(GO:0004957) |
| 0.2 | 4.1 | GO:0008409 | 5'-3' exonuclease activity(GO:0008409) |
| 0.2 | 3.8 | GO:0004861 | cyclin-dependent protein serine/threonine kinase inhibitor activity(GO:0004861) |
| 0.2 | 0.7 | GO:0035403 | histone kinase activity (H3-T6 specific)(GO:0035403) |
| 0.2 | 1.1 | GO:0004687 | myosin light chain kinase activity(GO:0004687) |
| 0.2 | 2.1 | GO:0003910 | DNA ligase (ATP) activity(GO:0003910) |
| 0.2 | 12.4 | GO:0070888 | E-box binding(GO:0070888) |
| 0.2 | 5.5 | GO:0070034 | telomerase RNA binding(GO:0070034) |
| 0.2 | 0.6 | GO:0004119 | cGMP-inhibited cyclic-nucleotide phosphodiesterase activity(GO:0004119) |
| 0.2 | 10.3 | GO:0017112 | Rab guanyl-nucleotide exchange factor activity(GO:0017112) |
| 0.2 | 5.1 | GO:0098641 | cadherin binding involved in cell-cell adhesion(GO:0098641) |
| 0.2 | 0.4 | GO:0050692 | DBD domain binding(GO:0050692) |
| 0.2 | 0.7 | GO:0016361 | activin receptor activity, type I(GO:0016361) |
| 0.2 | 2.0 | GO:0046935 | 1-phosphatidylinositol-3-kinase regulator activity(GO:0046935) |
| 0.2 | 2.7 | GO:0070016 | armadillo repeat domain binding(GO:0070016) |
| 0.2 | 1.8 | GO:0015925 | galactosidase activity(GO:0015925) |
| 0.2 | 3.1 | GO:0102391 | decanoate--CoA ligase activity(GO:0102391) |
| 0.2 | 7.3 | GO:0004683 | calmodulin-dependent protein kinase activity(GO:0004683) |
| 0.1 | 1.5 | GO:0005007 | fibroblast growth factor-activated receptor activity(GO:0005007) |
| 0.1 | 2.6 | GO:0071837 | HMG box domain binding(GO:0071837) |
| 0.1 | 1.4 | GO:0086008 | voltage-gated potassium channel activity involved in cardiac muscle cell action potential repolarization(GO:0086008) |
| 0.1 | 2.0 | GO:0009881 | photoreceptor activity(GO:0009881) |
| 0.1 | 1.9 | GO:0030306 | ADP-ribosylation factor binding(GO:0030306) |
| 0.1 | 1.1 | GO:0001162 | RNA polymerase II intronic transcription regulatory region sequence-specific DNA binding(GO:0001162) |
| 0.1 | 7.9 | GO:0043621 | protein self-association(GO:0043621) |
| 0.1 | 0.4 | GO:0015234 | thiamine transmembrane transporter activity(GO:0015234) thiamine uptake transmembrane transporter activity(GO:0015403) |
| 0.1 | 2.5 | GO:0005149 | interleukin-1 receptor binding(GO:0005149) |
| 0.1 | 11.2 | GO:0004879 | RNA polymerase II transcription factor activity, ligand-activated sequence-specific DNA binding(GO:0004879) transcription factor activity, direct ligand regulated sequence-specific DNA binding(GO:0098531) |
| 0.1 | 1.6 | GO:0030618 | transforming growth factor beta receptor, pathway-specific cytoplasmic mediator activity(GO:0030618) |
| 0.1 | 0.6 | GO:0052841 | endopolyphosphatase activity(GO:0000298) diphosphoinositol-polyphosphate diphosphatase activity(GO:0008486) bis(5'-adenosyl)-hexaphosphatase activity(GO:0034431) bis(5'-adenosyl)-pentaphosphatase activity(GO:0034432) inositol diphosphate tetrakisphosphate diphosphatase activity(GO:0052840) inositol bisdiphosphate tetrakisphosphate diphosphatase activity(GO:0052841) inositol diphosphate pentakisphosphate diphosphatase activity(GO:0052842) inositol-1-diphosphate-2,3,4,5,6-pentakisphosphate diphosphatase activity(GO:0052843) inositol-3-diphosphate-1,2,4,5,6-pentakisphosphate diphosphatase activity(GO:0052844) inositol-5-diphosphate-1,2,3,4,6-pentakisphosphate diphosphatase activity(GO:0052845) inositol-1,5-bisdiphosphate-2,3,4,6-tetrakisphosphate 1-diphosphatase activity(GO:0052846) inositol-1,5-bisdiphosphate-2,3,4,6-tetrakisphosphate 5-diphosphatase activity(GO:0052847) inositol-3,5-bisdiphosphate-2,3,4,6-tetrakisphosphate 5-diphosphatase activity(GO:0052848) |
| 0.1 | 1.5 | GO:0052629 | phosphatidylinositol-3,5-bisphosphate 3-phosphatase activity(GO:0052629) |
| 0.1 | 2.9 | GO:0005251 | delayed rectifier potassium channel activity(GO:0005251) |
| 0.1 | 19.8 | GO:0005200 | structural constituent of cytoskeleton(GO:0005200) |
| 0.1 | 3.1 | GO:0005031 | tumor necrosis factor-activated receptor activity(GO:0005031) death receptor activity(GO:0005035) |
| 0.1 | 2.4 | GO:0005247 | voltage-gated chloride channel activity(GO:0005247) |
| 0.1 | 2.1 | GO:0043495 | protein anchor(GO:0043495) |
| 0.1 | 0.7 | GO:0004351 | glutamate decarboxylase activity(GO:0004351) |
| 0.1 | 8.0 | GO:0004843 | thiol-dependent ubiquitin-specific protease activity(GO:0004843) |
| 0.1 | 2.5 | GO:0005086 | ARF guanyl-nucleotide exchange factor activity(GO:0005086) |
| 0.1 | 11.2 | GO:0004222 | metalloendopeptidase activity(GO:0004222) |
| 0.1 | 2.7 | GO:0071889 | 14-3-3 protein binding(GO:0071889) |
| 0.1 | 6.7 | GO:0003777 | microtubule motor activity(GO:0003777) |
| 0.1 | 0.9 | GO:0030346 | protein phosphatase 2B binding(GO:0030346) |
| 0.1 | 2.0 | GO:0030507 | spectrin binding(GO:0030507) |
| 0.1 | 1.8 | GO:0032266 | phosphatidylinositol-3-phosphate binding(GO:0032266) |
| 0.1 | 2.2 | GO:0070840 | dynein complex binding(GO:0070840) |
| 0.1 | 2.5 | GO:0005109 | frizzled binding(GO:0005109) |
| 0.1 | 3.4 | GO:0030544 | Hsp70 protein binding(GO:0030544) |
| 0.1 | 0.7 | GO:0016494 | C-X-C chemokine receptor activity(GO:0016494) |
| 0.1 | 1.4 | GO:0043015 | gamma-tubulin binding(GO:0043015) |
| 0.1 | 15.2 | GO:0001227 | transcriptional repressor activity, RNA polymerase II transcription regulatory region sequence-specific binding(GO:0001227) |
| 0.1 | 10.3 | GO:0019902 | phosphatase binding(GO:0019902) |
| 0.1 | 1.7 | GO:0046961 | proton-transporting ATPase activity, rotational mechanism(GO:0046961) |
| 0.1 | 1.2 | GO:0050811 | GABA receptor binding(GO:0050811) |
| 0.1 | 2.7 | GO:0000976 | transcription regulatory region sequence-specific DNA binding(GO:0000976) |
| 0.1 | 1.3 | GO:0003841 | 1-acylglycerol-3-phosphate O-acyltransferase activity(GO:0003841) |
| 0.1 | 1.5 | GO:0004383 | guanylate cyclase activity(GO:0004383) |
| 0.1 | 0.7 | GO:0070700 | BMP receptor binding(GO:0070700) |
| 0.1 | 2.5 | GO:0030552 | cAMP binding(GO:0030552) |
| 0.1 | 1.7 | GO:0005540 | hyaluronic acid binding(GO:0005540) |
| 0.1 | 1.6 | GO:0017080 | sodium channel regulator activity(GO:0017080) |
| 0.0 | 1.4 | GO:0035035 | histone acetyltransferase binding(GO:0035035) |
| 0.0 | 0.7 | GO:0005123 | death receptor binding(GO:0005123) |
| 0.0 | 3.8 | GO:0003705 | transcription factor activity, RNA polymerase II distal enhancer sequence-specific binding(GO:0003705) |
| 0.0 | 4.1 | GO:0004860 | protein kinase inhibitor activity(GO:0004860) |
| 0.0 | 6.1 | GO:0044325 | ion channel binding(GO:0044325) |
| 0.0 | 0.6 | GO:0015280 | ligand-gated sodium channel activity(GO:0015280) |
| 0.0 | 3.1 | GO:0001540 | beta-amyloid binding(GO:0001540) |
| 0.0 | 0.2 | GO:0004489 | methylenetetrahydrofolate reductase (NAD(P)H) activity(GO:0004489) |
| 0.0 | 1.6 | GO:0003755 | peptidyl-prolyl cis-trans isomerase activity(GO:0003755) |
| 0.0 | 0.2 | GO:0004897 | ciliary neurotrophic factor receptor activity(GO:0004897) |
| 0.0 | 2.2 | GO:0002039 | p53 binding(GO:0002039) |
| 0.0 | 1.8 | GO:0035064 | methylated histone binding(GO:0035064) |
| 0.0 | 2.7 | GO:0004197 | cysteine-type endopeptidase activity(GO:0004197) |
| 0.0 | 0.8 | GO:0051019 | mitogen-activated protein kinase binding(GO:0051019) |
| 0.0 | 0.8 | GO:0004864 | protein phosphatase inhibitor activity(GO:0004864) |
| 0.0 | 0.3 | GO:0016641 | oxidoreductase activity, acting on the CH-NH2 group of donors, oxygen as acceptor(GO:0016641) |
| 0.0 | 1.3 | GO:0048365 | Rac GTPase binding(GO:0048365) |
| 0.0 | 1.8 | GO:0042826 | histone deacetylase binding(GO:0042826) |
| 0.0 | 0.5 | GO:0031489 | myosin V binding(GO:0031489) |
| 0.0 | 0.5 | GO:0017147 | Wnt-protein binding(GO:0017147) |
| 0.0 | 4.9 | GO:0000982 | transcription factor activity, RNA polymerase II core promoter proximal region sequence-specific binding(GO:0000982) |
| 0.0 | 0.7 | GO:0004842 | ubiquitin-protein transferase activity(GO:0004842) |
| 0.0 | 1.0 | GO:0015179 | L-amino acid transmembrane transporter activity(GO:0015179) |
| 0.0 | 11.3 | GO:0001071 | nucleic acid binding transcription factor activity(GO:0001071) transcription factor activity, sequence-specific DNA binding(GO:0003700) |
| 0.0 | 1.0 | GO:0003684 | damaged DNA binding(GO:0003684) |
| 0.0 | 1.8 | GO:0017124 | SH3 domain binding(GO:0017124) |
| 0.0 | 0.2 | GO:0005248 | voltage-gated sodium channel activity(GO:0005248) voltage-gated ion channel activity involved in regulation of postsynaptic membrane potential(GO:1905030) |
Gene overrepresentation in C2:CP category:
| Log-likelihood per target | Total log-likelihood | Term | Description |
|---|---|---|---|
| 0.7 | 17.2 | PID CIRCADIAN PATHWAY | Circadian rhythm pathway |
| 0.5 | 16.9 | PID S1P S1P1 PATHWAY | S1P1 pathway |
| 0.4 | 3.5 | PID MET PATHWAY | Signaling events mediated by Hepatocyte Growth Factor Receptor (c-Met) |
| 0.3 | 16.8 | ST JNK MAPK PATHWAY | JNK MAPK Pathway |
| 0.2 | 12.2 | PID FANCONI PATHWAY | Fanconi anemia pathway |
| 0.2 | 5.7 | PID P38 MKK3 6PATHWAY | p38 MAPK signaling pathway |
| 0.2 | 4.5 | PID IL5 PATHWAY | IL5-mediated signaling events |
| 0.2 | 4.5 | PID IL2 STAT5 PATHWAY | IL2 signaling events mediated by STAT5 |
| 0.1 | 4.3 | ST G ALPHA S PATHWAY | G alpha s Pathway |
| 0.1 | 2.2 | SA PROGRAMMED CELL DEATH | Programmed cell death, or apoptosis, eliminates damaged or unneeded cells. |
| 0.1 | 6.5 | PID IL6 7 PATHWAY | IL6-mediated signaling events |
| 0.1 | 1.5 | PID LPA4 PATHWAY | LPA4-mediated signaling events |
| 0.1 | 11.0 | PID TXA2PATHWAY | Thromboxane A2 receptor signaling |
| 0.1 | 2.7 | PID ER NONGENOMIC PATHWAY | Plasma membrane estrogen receptor signaling |
| 0.1 | 5.7 | PID TCPTP PATHWAY | Signaling events mediated by TCPTP |
| 0.1 | 6.5 | PID FGF PATHWAY | FGF signaling pathway |
| 0.1 | 5.6 | PID ECADHERIN STABILIZATION PATHWAY | Stabilization and expansion of the E-cadherin adherens junction |
| 0.1 | 2.8 | PID INTEGRIN A9B1 PATHWAY | Alpha9 beta1 integrin signaling events |
| 0.1 | 1.2 | PID RANBP2 PATHWAY | Sumoylation by RanBP2 regulates transcriptional repression |
| 0.1 | 1.6 | PID ALK2 PATHWAY | ALK2 signaling events |
| 0.1 | 1.3 | PID PDGFRA PATHWAY | PDGFR-alpha signaling pathway |
| 0.1 | 2.5 | PID IL1 PATHWAY | IL1-mediated signaling events |
| 0.1 | 2.2 | PID RETINOIC ACID PATHWAY | Retinoic acid receptors-mediated signaling |
| 0.1 | 10.1 | NABA ECM AFFILIATED | Genes encoding proteins affiliated structurally or functionally to extracellular matrix proteins |
| 0.1 | 3.4 | PID IL12 2PATHWAY | IL12-mediated signaling events |
| 0.1 | 1.3 | SA MMP CYTOKINE CONNECTION | Cytokines can induce activation of matrix metalloproteinases, which degrade extracellular matrix. |
| 0.0 | 2.2 | PID HIF1A PATHWAY | Hypoxic and oxygen homeostasis regulation of HIF-1-alpha |
| 0.0 | 5.6 | PID MYC ACTIV PATHWAY | Validated targets of C-MYC transcriptional activation |
| 0.0 | 8.4 | PID P53 DOWNSTREAM PATHWAY | Direct p53 effectors |
| 0.0 | 0.9 | PID ATF2 PATHWAY | ATF-2 transcription factor network |
| 0.0 | 0.9 | PID TCR CALCIUM PATHWAY | Calcium signaling in the CD4+ TCR pathway |
| 0.0 | 2.4 | PID HIF1 TFPATHWAY | HIF-1-alpha transcription factor network |
| 0.0 | 2.3 | PID AP1 PATHWAY | AP-1 transcription factor network |
| 0.0 | 1.1 | PID PI3K PLC TRK PATHWAY | Trk receptor signaling mediated by PI3K and PLC-gamma |
| 0.0 | 1.4 | PID LKB1 PATHWAY | LKB1 signaling events |
| 0.0 | 0.8 | PID NCADHERIN PATHWAY | N-cadherin signaling events |
| 0.0 | 1.3 | PID TELOMERASE PATHWAY | Regulation of Telomerase |
| 0.0 | 1.3 | ST FAS SIGNALING PATHWAY | Fas Signaling Pathway |
| 0.0 | 1.1 | SIG CHEMOTAXIS | Genes related to chemotaxis |
Gene overrepresentation in C2:CP:REACTOME category:
| Log-likelihood per target | Total log-likelihood | Term | Description |
|---|---|---|---|
| 0.5 | 7.7 | REACTOME ERKS ARE INACTIVATED | Genes involved in ERKs are inactivated |
| 0.5 | 10.9 | REACTOME OTHER SEMAPHORIN INTERACTIONS | Genes involved in Other semaphorin interactions |
| 0.4 | 7.2 | REACTOME REGULATION OF PYRUVATE DEHYDROGENASE PDH COMPLEX | Genes involved in Regulation of pyruvate dehydrogenase (PDH) complex |
| 0.4 | 11.2 | REACTOME FANCONI ANEMIA PATHWAY | Genes involved in Fanconi Anemia pathway |
| 0.4 | 4.9 | REACTOME THE ACTIVATION OF ARYLSULFATASES | Genes involved in The activation of arylsulfatases |
| 0.3 | 7.3 | REACTOME RAS ACTIVATION UOPN CA2 INFUX THROUGH NMDA RECEPTOR | Genes involved in Ras activation uopn Ca2+ infux through NMDA receptor |
| 0.3 | 17.2 | REACTOME BMAL1 CLOCK NPAS2 ACTIVATES CIRCADIAN EXPRESSION | Genes involved in BMAL1:CLOCK/NPAS2 Activates Circadian Expression |
| 0.3 | 6.4 | REACTOME MITOCHONDRIAL TRNA AMINOACYLATION | Genes involved in Mitochondrial tRNA aminoacylation |
| 0.2 | 5.6 | REACTOME RNA POL III CHAIN ELONGATION | Genes involved in RNA Polymerase III Chain Elongation |
| 0.2 | 4.1 | REACTOME CLASS C 3 METABOTROPIC GLUTAMATE PHEROMONE RECEPTORS | Genes involved in Class C/3 (Metabotropic glutamate/pheromone receptors) |
| 0.2 | 5.1 | REACTOME ACTIVATION OF RAC | Genes involved in Activation of Rac |
| 0.2 | 6.9 | REACTOME ELONGATION ARREST AND RECOVERY | Genes involved in Elongation arrest and recovery |
| 0.2 | 5.0 | REACTOME AMINE DERIVED HORMONES | Genes involved in Amine-derived hormones |
| 0.2 | 3.9 | REACTOME TERMINATION OF O GLYCAN BIOSYNTHESIS | Genes involved in Termination of O-glycan biosynthesis |
| 0.2 | 6.7 | REACTOME SPHINGOLIPID DE NOVO BIOSYNTHESIS | Genes involved in Sphingolipid de novo biosynthesis |
| 0.2 | 2.4 | REACTOME GAMMA CARBOXYLATION TRANSPORT AND AMINO TERMINAL CLEAVAGE OF PROTEINS | Genes involved in Gamma-carboxylation, transport, and amino-terminal cleavage of proteins |
| 0.2 | 6.8 | REACTOME TRAF6 MEDIATED IRF7 ACTIVATION | Genes involved in TRAF6 mediated IRF7 activation |
| 0.2 | 4.5 | REACTOME REGULATION OF INSULIN LIKE GROWTH FACTOR IGF ACTIVITY BY INSULIN LIKE GROWTH FACTOR BINDING PROTEINS IGFBPS | Genes involved in Regulation of Insulin-like Growth Factor (IGF) Activity by Insulin-like Growth Factor Binding Proteins (IGFBPs) |
| 0.2 | 2.9 | REACTOME ACTIVATION OF CHAPERONES BY ATF6 ALPHA | Genes involved in Activation of Chaperones by ATF6-alpha |
| 0.2 | 3.9 | REACTOME SYNTHESIS SECRETION AND INACTIVATION OF GLP1 | Genes involved in Synthesis, Secretion, and Inactivation of Glucagon-like Peptide-1 (GLP-1) |
| 0.2 | 1.8 | REACTOME PROSTANOID LIGAND RECEPTORS | Genes involved in Prostanoid ligand receptors |
| 0.1 | 2.7 | REACTOME GAP JUNCTION DEGRADATION | Genes involved in Gap junction degradation |
| 0.1 | 6.3 | REACTOME EFFECTS OF PIP2 HYDROLYSIS | Genes involved in Effects of PIP2 hydrolysis |
| 0.1 | 3.0 | REACTOME SYNTHESIS OF GLYCOSYLPHOSPHATIDYLINOSITOL GPI | Genes involved in Synthesis of glycosylphosphatidylinositol (GPI) |
| 0.1 | 11.2 | REACTOME NUCLEAR RECEPTOR TRANSCRIPTION PATHWAY | Genes involved in Nuclear Receptor transcription pathway |
| 0.1 | 1.5 | REACTOME ADENYLATE CYCLASE ACTIVATING PATHWAY | Genes involved in Adenylate cyclase activating pathway |
| 0.1 | 2.9 | REACTOME ACTIVATION OF BH3 ONLY PROTEINS | Genes involved in Activation of BH3-only proteins |
| 0.1 | 1.5 | REACTOME SIGNALING BY FGFR3 MUTANTS | Genes involved in Signaling by FGFR3 mutants |
| 0.1 | 2.3 | REACTOME SYNTHESIS OF VERY LONG CHAIN FATTY ACYL COAS | Genes involved in Synthesis of very long-chain fatty acyl-CoAs |
| 0.1 | 2.3 | REACTOME ENDOSOMAL SORTING COMPLEX REQUIRED FOR TRANSPORT ESCRT | Genes involved in Endosomal Sorting Complex Required For Transport (ESCRT) |
| 0.1 | 2.1 | REACTOME RESOLUTION OF AP SITES VIA THE SINGLE NUCLEOTIDE REPLACEMENT PATHWAY | Genes involved in Resolution of AP sites via the single-nucleotide replacement pathway |
| 0.1 | 2.0 | REACTOME IL 7 SIGNALING | Genes involved in Interleukin-7 signaling |
| 0.1 | 1.7 | REACTOME HYALURONAN UPTAKE AND DEGRADATION | Genes involved in Hyaluronan uptake and degradation |
| 0.1 | 5.2 | REACTOME CHEMOKINE RECEPTORS BIND CHEMOKINES | Genes involved in Chemokine receptors bind chemokines |
| 0.1 | 2.7 | REACTOME SIGNALING BY EGFR IN CANCER | Genes involved in Signaling by EGFR in Cancer |
| 0.1 | 4.4 | REACTOME IL1 SIGNALING | Genes involved in Interleukin-1 signaling |
| 0.1 | 1.4 | REACTOME INHIBITION OF VOLTAGE GATED CA2 CHANNELS VIA GBETA GAMMA SUBUNITS | Genes involved in Inhibition of voltage gated Ca2+ channels via Gbeta/gamma subunits |
| 0.1 | 3.4 | REACTOME TRAFFICKING OF AMPA RECEPTORS | Genes involved in Trafficking of AMPA receptors |
| 0.1 | 1.5 | REACTOME REGULATION OF GENE EXPRESSION IN BETA CELLS | Genes involved in Regulation of gene expression in beta cells |
| 0.1 | 1.8 | REACTOME SIGNAL REGULATORY PROTEIN SIRP FAMILY INTERACTIONS | Genes involved in Signal regulatory protein (SIRP) family interactions |
| 0.1 | 7.2 | REACTOME CLASS B 2 SECRETIN FAMILY RECEPTORS | Genes involved in Class B/2 (Secretin family receptors) |
| 0.1 | 2.2 | REACTOME REGULATION OF HYPOXIA INDUCIBLE FACTOR HIF BY OXYGEN | Genes involved in Regulation of Hypoxia-inducible Factor (HIF) by Oxygen |
| 0.1 | 1.7 | REACTOME INSULIN RECEPTOR RECYCLING | Genes involved in Insulin receptor recycling |
| 0.1 | 2.0 | REACTOME IL RECEPTOR SHC SIGNALING | Genes involved in Interleukin receptor SHC signaling |
| 0.1 | 2.9 | REACTOME VOLTAGE GATED POTASSIUM CHANNELS | Genes involved in Voltage gated Potassium channels |
| 0.1 | 1.6 | REACTOME SIGNALING BY BMP | Genes involved in Signaling by BMP |
| 0.1 | 1.7 | REACTOME ADHERENS JUNCTIONS INTERACTIONS | Genes involved in Adherens junctions interactions |
| 0.1 | 1.0 | REACTOME HOMOLOGOUS RECOMBINATION REPAIR OF REPLICATION INDEPENDENT DOUBLE STRAND BREAKS | Genes involved in Homologous recombination repair of replication-independent double-strand breaks |
| 0.1 | 6.0 | REACTOME TRANSPORT OF INORGANIC CATIONS ANIONS AND AMINO ACIDS OLIGOPEPTIDES | Genes involved in Transport of inorganic cations/anions and amino acids/oligopeptides |
| 0.1 | 2.0 | REACTOME SMAD2 SMAD3 SMAD4 HETEROTRIMER REGULATES TRANSCRIPTION | Genes involved in SMAD2/SMAD3:SMAD4 heterotrimer regulates transcription |
| 0.0 | 0.3 | REACTOME RETROGRADE NEUROTROPHIN SIGNALLING | Genes involved in Retrograde neurotrophin signalling |
| 0.0 | 1.5 | REACTOME SYNTHESIS OF PIPS AT THE PLASMA MEMBRANE | Genes involved in Synthesis of PIPs at the plasma membrane |
| 0.0 | 1.3 | REACTOME TRIGLYCERIDE BIOSYNTHESIS | Genes involved in Triglyceride Biosynthesis |
| 0.0 | 0.7 | REACTOME SIGNALING BY NODAL | Genes involved in Signaling by NODAL |
| 0.0 | 1.2 | REACTOME KERATAN SULFATE BIOSYNTHESIS | Genes involved in Keratan sulfate biosynthesis |
| 0.0 | 5.0 | REACTOME G ALPHA I SIGNALLING EVENTS | Genes involved in G alpha (i) signalling events |
| 0.0 | 1.0 | REACTOME INTERACTION BETWEEN L1 AND ANKYRINS | Genes involved in Interaction between L1 and Ankyrins |
| 0.0 | 2.3 | REACTOME CROSS PRESENTATION OF SOLUBLE EXOGENOUS ANTIGENS ENDOSOMES | Genes involved in Cross-presentation of soluble exogenous antigens (endosomes) |
| 0.0 | 5.5 | REACTOME NONSENSE MEDIATED DECAY ENHANCED BY THE EXON JUNCTION COMPLEX | Genes involved in Nonsense Mediated Decay Enhanced by the Exon Junction Complex |
| 0.0 | 0.7 | REACTOME EXTRINSIC PATHWAY FOR APOPTOSIS | Genes involved in Extrinsic Pathway for Apoptosis |
| 0.0 | 0.7 | REACTOME GABA SYNTHESIS RELEASE REUPTAKE AND DEGRADATION | Genes involved in GABA synthesis, release, reuptake and degradation |
| 0.0 | 3.1 | REACTOME FACTORS INVOLVED IN MEGAKARYOCYTE DEVELOPMENT AND PLATELET PRODUCTION | Genes involved in Factors involved in megakaryocyte development and platelet production |
| 0.0 | 0.7 | REACTOME DEGRADATION OF THE EXTRACELLULAR MATRIX | Genes involved in Degradation of the extracellular matrix |
| 0.0 | 1.1 | REACTOME SMOOTH MUSCLE CONTRACTION | Genes involved in Smooth Muscle Contraction |
| 0.0 | 0.6 | REACTOME CGMP EFFECTS | Genes involved in cGMP effects |
| 0.0 | 0.7 | REACTOME DOWNSTREAM SIGNAL TRANSDUCTION | Genes involved in Downstream signal transduction |