Project
GNF SymAtlas + NCI-60 cancer cell lines, comparison of cancers vs non-cancers, human (Su, 2004; Ross, 2000)
Navigation
Downloads
Results for GLI2
Z-value: 0.50
Motif logo

Transcription factors associated with GLI2
| Gene Symbol | Gene ID | Gene Info |
|---|---|---|
|
GLI2
|
ENSG00000074047.16 | GLI family zinc finger 2 |
Activity profile of GLI2 motif
Sorted Z-values of GLI2 motif
| Promoter | Log-likelihood | Transcript | Gene | Gene Info |
|---|---|---|---|---|
| chr20_+_35202909 | 21.28 |
ENST00000558530.1
ENST00000558028.1 ENST00000560025.1 |
TGIF2-C20orf24
TGIF2
|
TGIF2-C20orf24 readthrough TGFB-induced factor homeobox 2 |
| chr20_+_3776371 | 16.03 |
ENST00000245960.5
|
CDC25B
|
cell division cycle 25B |
| chr11_-_57103327 | 15.73 |
ENST00000529002.1
ENST00000278412.2 |
SSRP1
|
structure specific recognition protein 1 |
| chr16_+_67063036 | 15.28 |
ENST00000290858.6
ENST00000564034.1 |
CBFB
|
core-binding factor, beta subunit |
| chr16_+_67063142 | 14.74 |
ENST00000412916.2
|
CBFB
|
core-binding factor, beta subunit |
| chr18_+_12948000 | 14.03 |
ENST00000585730.1
ENST00000399892.2 ENST00000589446.1 ENST00000587761.1 |
SEH1L
|
SEH1-like (S. cerevisiae) |
| chr14_+_24605389 | 13.64 |
ENST00000382708.3
ENST00000561435.1 |
PSME1
|
proteasome (prosome, macropain) activator subunit 1 (PA28 alpha) |
| chr22_+_23247030 | 13.55 |
ENST00000390324.2
|
IGLJ3
|
immunoglobulin lambda joining 3 |
| chr1_-_32403370 | 13.39 |
ENST00000534796.1
|
PTP4A2
|
protein tyrosine phosphatase type IVA, member 2 |
| chr14_-_71107921 | 12.33 |
ENST00000553982.1
ENST00000500016.1 |
CTD-2540L5.5
CTD-2540L5.6
|
CTD-2540L5.5 CTD-2540L5.6 |
| chr19_-_2050852 | 12.25 |
ENST00000541165.1
ENST00000591601.1 |
MKNK2
|
MAP kinase interacting serine/threonine kinase 2 |
| chr3_-_49066811 | 12.11 |
ENST00000442157.1
ENST00000326739.4 |
IMPDH2
|
IMP (inosine 5'-monophosphate) dehydrogenase 2 |
| chr4_+_107236692 | 11.72 |
ENST00000510207.1
|
AIMP1
|
aminoacyl tRNA synthetase complex-interacting multifunctional protein 1 |
| chr21_-_46330545 | 11.64 |
ENST00000320216.6
ENST00000397852.1 |
ITGB2
|
integrin, beta 2 (complement component 3 receptor 3 and 4 subunit) |
| chr19_-_10464570 | 11.61 |
ENST00000529739.1
|
TYK2
|
tyrosine kinase 2 |
| chr17_-_79995553 | 11.61 |
ENST00000581584.1
ENST00000577712.1 ENST00000582900.1 ENST00000579155.1 ENST00000306869.2 |
DCXR
|
dicarbonyl/L-xylulose reductase |
| chr19_-_42806919 | 11.56 |
ENST00000595530.1
ENST00000538771.1 ENST00000601865.1 |
PAFAH1B3
|
platelet-activating factor acetylhydrolase 1b, catalytic subunit 3 (29kDa) |
| chr1_+_220267429 | 11.33 |
ENST00000366922.1
ENST00000302637.5 |
IARS2
|
isoleucyl-tRNA synthetase 2, mitochondrial |
| chr20_+_3776936 | 11.18 |
ENST00000439880.2
|
CDC25B
|
cell division cycle 25B |
| chr19_-_42806723 | 11.03 |
ENST00000262890.3
|
PAFAH1B3
|
platelet-activating factor acetylhydrolase 1b, catalytic subunit 3 (29kDa) |
| chr13_-_46756351 | 11.02 |
ENST00000323076.2
|
LCP1
|
lymphocyte cytosolic protein 1 (L-plastin) |
| chr10_-_120938303 | 10.89 |
ENST00000356951.3
ENST00000298510.2 |
PRDX3
|
peroxiredoxin 3 |
| chr21_-_40555393 | 10.83 |
ENST00000380900.2
|
PSMG1
|
proteasome (prosome, macropain) assembly chaperone 1 |
| chr17_+_1944790 | 10.77 |
ENST00000575162.1
|
DPH1
|
diphthamide biosynthesis 1 |
| chr1_+_26869597 | 10.68 |
ENST00000530003.1
|
RPS6KA1
|
ribosomal protein S6 kinase, 90kDa, polypeptide 1 |
| chr1_-_11115877 | 10.55 |
ENST00000490101.1
|
SRM
|
spermidine synthase |
| chr15_-_49447771 | 10.41 |
ENST00000558843.1
ENST00000542928.1 ENST00000561248.1 |
COPS2
|
COP9 signalosome subunit 2 |
| chr3_+_127317066 | 10.41 |
ENST00000265056.7
|
MCM2
|
minichromosome maintenance complex component 2 |
| chr14_-_55369525 | 10.40 |
ENST00000543643.2
ENST00000536224.2 ENST00000395514.1 ENST00000491895.2 |
GCH1
|
GTP cyclohydrolase 1 |
| chr12_-_122712038 | 9.85 |
ENST00000413918.1
ENST00000443649.3 |
DIABLO
|
diablo, IAP-binding mitochondrial protein |
| chr20_+_43514320 | 9.79 |
ENST00000372839.3
ENST00000428262.1 ENST00000445830.1 |
YWHAB
|
tyrosine 3-monooxygenase/tryptophan 5-monooxygenase activation protein, beta |
| chr12_-_48099754 | 9.49 |
ENST00000380650.4
|
RPAP3
|
RNA polymerase II associated protein 3 |
| chr20_-_32891151 | 9.48 |
ENST00000217426.2
|
AHCY
|
adenosylhomocysteinase |
| chr19_-_42806444 | 9.41 |
ENST00000594989.1
|
PAFAH1B3
|
platelet-activating factor acetylhydrolase 1b, catalytic subunit 3 (29kDa) |
| chrX_+_19373700 | 9.38 |
ENST00000379804.1
|
PDHA1
|
pyruvate dehydrogenase (lipoamide) alpha 1 |
| chr8_+_96145974 | 9.31 |
ENST00000315367.3
|
PLEKHF2
|
pleckstrin homology domain containing, family F (with FYVE domain) member 2 |
| chr14_-_24615805 | 9.27 |
ENST00000560410.1
|
PSME2
|
proteasome (prosome, macropain) activator subunit 2 (PA28 beta) |
| chr12_+_120933904 | 9.21 |
ENST00000550178.1
ENST00000550845.1 ENST00000549989.1 ENST00000552870.1 |
DYNLL1
|
dynein, light chain, LC8-type 1 |
| chr14_-_94856987 | 9.18 |
ENST00000449399.3
ENST00000404814.4 |
SERPINA1
|
serpin peptidase inhibitor, clade A (alpha-1 antiproteinase, antitrypsin), member 1 |
| chr11_-_34937858 | 9.15 |
ENST00000278359.5
|
APIP
|
APAF1 interacting protein |
| chr4_-_71705027 | 9.05 |
ENST00000545193.1
|
GRSF1
|
G-rich RNA sequence binding factor 1 |
| chr16_+_30075595 | 8.98 |
ENST00000563060.2
|
ALDOA
|
aldolase A, fructose-bisphosphate |
| chr16_+_30064444 | 8.81 |
ENST00000395248.1
ENST00000566897.1 ENST00000568435.1 |
ALDOA
|
aldolase A, fructose-bisphosphate |
| chr19_-_10450328 | 8.75 |
ENST00000160262.5
|
ICAM3
|
intercellular adhesion molecule 3 |
| chr8_-_145331153 | 8.75 |
ENST00000377412.4
|
KM-PA-2
|
KM-PA-2 protein; Uncharacterized protein |
| chr14_+_24605361 | 8.75 |
ENST00000206451.6
ENST00000559123.1 |
PSME1
|
proteasome (prosome, macropain) activator subunit 1 (PA28 alpha) |
| chr15_-_69113218 | 8.66 |
ENST00000560303.1
ENST00000465139.2 |
ANP32A
|
acidic (leucine-rich) nuclear phosphoprotein 32 family, member A |
| chr1_+_47799446 | 8.62 |
ENST00000371873.5
|
CMPK1
|
cytidine monophosphate (UMP-CMP) kinase 1, cytosolic |
| chr16_+_30075783 | 8.62 |
ENST00000412304.2
|
ALDOA
|
aldolase A, fructose-bisphosphate |
| chr1_+_154947148 | 8.38 |
ENST00000368436.1
ENST00000308987.5 |
CKS1B
|
CDC28 protein kinase regulatory subunit 1B |
| chr12_-_110883346 | 8.31 |
ENST00000547365.1
|
ARPC3
|
actin related protein 2/3 complex, subunit 3, 21kDa |
| chrX_+_12809463 | 8.29 |
ENST00000380663.3
ENST00000380668.5 ENST00000398491.2 ENST00000489404.1 |
PRPS2
|
phosphoribosyl pyrophosphate synthetase 2 |
| chr10_+_14880157 | 8.28 |
ENST00000378372.3
|
HSPA14
|
heat shock 70kDa protein 14 |
| chr19_-_10530784 | 8.19 |
ENST00000593124.1
|
CDC37
|
cell division cycle 37 |
| chr17_-_73149921 | 8.13 |
ENST00000481647.1
ENST00000470924.1 |
HN1
|
hematological and neurological expressed 1 |
| chr22_+_23248512 | 8.03 |
ENST00000390325.2
|
IGLC3
|
immunoglobulin lambda constant 3 (Kern-Oz+ marker) |
| chr21_-_40720995 | 7.99 |
ENST00000380749.5
|
HMGN1
|
high mobility group nucleosome binding domain 1 |
| chr12_-_48099773 | 7.95 |
ENST00000432584.3
ENST00000005386.3 |
RPAP3
|
RNA polymerase II associated protein 3 |
| chr14_-_94856951 | 7.93 |
ENST00000553327.1
ENST00000556955.1 ENST00000557118.1 ENST00000440909.1 |
SERPINA1
|
serpin peptidase inhibitor, clade A (alpha-1 antiproteinase, antitrypsin), member 1 |
| chr12_+_120933859 | 7.93 |
ENST00000242577.6
ENST00000548214.1 ENST00000392508.2 |
DYNLL1
|
dynein, light chain, LC8-type 1 |
| chr1_+_154947126 | 7.90 |
ENST00000368439.1
|
CKS1B
|
CDC28 protein kinase regulatory subunit 1B |
| chr14_-_94857004 | 7.87 |
ENST00000557492.1
ENST00000448921.1 ENST00000437397.1 ENST00000355814.4 ENST00000393088.4 |
SERPINA1
|
serpin peptidase inhibitor, clade A (alpha-1 antiproteinase, antitrypsin), member 1 |
| chr3_-_63849571 | 7.76 |
ENST00000295899.5
|
THOC7
|
THO complex 7 homolog (Drosophila) |
| chr5_-_89705537 | 7.76 |
ENST00000522864.1
ENST00000522083.1 ENST00000522565.1 ENST00000522842.1 ENST00000283122.3 |
CETN3
|
centrin, EF-hand protein, 3 |
| chr14_-_94854926 | 7.67 |
ENST00000402629.1
ENST00000556091.1 ENST00000554720.1 |
SERPINA1
|
serpin peptidase inhibitor, clade A (alpha-1 antiproteinase, antitrypsin), member 1 |
| chr21_-_40720974 | 7.66 |
ENST00000380748.1
|
HMGN1
|
high mobility group nucleosome binding domain 1 |
| chr11_-_34938039 | 7.52 |
ENST00000395787.3
|
APIP
|
APAF1 interacting protein |
| chr4_+_57843876 | 7.52 |
ENST00000450656.1
ENST00000381227.1 |
POLR2B
|
polymerase (RNA) II (DNA directed) polypeptide B, 140kDa |
| chr16_-_69368774 | 7.50 |
ENST00000562949.1
|
RP11-343C2.12
|
Conserved oligomeric Golgi complex subunit 8 |
| chr5_-_150284532 | 7.44 |
ENST00000394226.2
ENST00000446148.2 ENST00000274599.5 ENST00000418587.2 |
ZNF300
|
zinc finger protein 300 |
| chr1_+_165796753 | 7.38 |
ENST00000367879.4
|
UCK2
|
uridine-cytidine kinase 2 |
| chr12_+_7079944 | 7.38 |
ENST00000261406.6
|
EMG1
|
EMG1 N1-specific pseudouridine methyltransferase |
| chr3_+_184080387 | 7.37 |
ENST00000455712.1
|
POLR2H
|
polymerase (RNA) II (DNA directed) polypeptide H |
| chrX_-_107334790 | 7.34 |
ENST00000217958.3
|
PSMD10
|
proteasome (prosome, macropain) 26S subunit, non-ATPase, 10 |
| chr12_+_7055767 | 7.31 |
ENST00000447931.2
|
PTPN6
|
protein tyrosine phosphatase, non-receptor type 6 |
| chr16_-_11681023 | 7.16 |
ENST00000570904.1
ENST00000574701.1 |
LITAF
|
lipopolysaccharide-induced TNF factor |
| chr11_+_64009072 | 7.09 |
ENST00000535135.1
ENST00000394540.3 |
FKBP2
|
FK506 binding protein 2, 13kDa |
| chr16_+_30064411 | 7.07 |
ENST00000338110.5
|
ALDOA
|
aldolase A, fructose-bisphosphate |
| chr19_+_572543 | 7.06 |
ENST00000333511.3
ENST00000573216.1 ENST00000353555.4 |
BSG
|
basigin (Ok blood group) |
| chr19_+_17858509 | 7.05 |
ENST00000594202.1
ENST00000252771.7 ENST00000389133.4 |
FCHO1
|
FCH domain only 1 |
| chr16_-_11681316 | 7.01 |
ENST00000571688.1
|
LITAF
|
lipopolysaccharide-induced TNF factor |
| chrX_-_107334750 | 7.01 |
ENST00000340200.5
ENST00000372296.1 ENST00000372295.1 ENST00000361815.5 |
PSMD10
|
proteasome (prosome, macropain) 26S subunit, non-ATPase, 10 |
| chr1_-_40042416 | 7.00 |
ENST00000372857.3
ENST00000372856.3 ENST00000531243.2 ENST00000451091.2 |
PABPC4
|
poly(A) binding protein, cytoplasmic 4 (inducible form) |
| chr19_-_55791058 | 6.98 |
ENST00000587959.1
ENST00000585927.1 ENST00000587922.1 ENST00000585698.1 |
HSPBP1
|
HSPA (heat shock 70kDa) binding protein, cytoplasmic cochaperone 1 |
| chr5_-_150284351 | 6.98 |
ENST00000427179.1
|
ZNF300
|
zinc finger protein 300 |
| chr1_+_6105974 | 6.97 |
ENST00000378083.3
|
KCNAB2
|
potassium voltage-gated channel, shaker-related subfamily, beta member 2 |
| chr20_+_43514315 | 6.89 |
ENST00000353703.4
|
YWHAB
|
tyrosine 3-monooxygenase/tryptophan 5-monooxygenase activation protein, beta |
| chr16_+_67063262 | 6.87 |
ENST00000565389.1
|
CBFB
|
core-binding factor, beta subunit |
| chr2_-_225434538 | 6.83 |
ENST00000409096.1
|
CUL3
|
cullin 3 |
| chr17_+_76164639 | 6.80 |
ENST00000225777.3
ENST00000585591.1 ENST00000589711.1 ENST00000588282.1 ENST00000589168.1 |
SYNGR2
|
synaptogyrin 2 |
| chr19_+_50180409 | 6.79 |
ENST00000391851.4
|
PRMT1
|
protein arginine methyltransferase 1 |
| chr6_-_53213780 | 6.77 |
ENST00000304434.6
ENST00000370918.4 |
ELOVL5
|
ELOVL fatty acid elongase 5 |
| chr3_+_184081213 | 6.75 |
ENST00000429568.1
|
POLR2H
|
polymerase (RNA) II (DNA directed) polypeptide H |
| chr15_-_59225758 | 6.70 |
ENST00000558486.1
ENST00000560682.1 ENST00000249736.7 ENST00000559880.1 ENST00000536328.1 |
SLTM
|
SAFB-like, transcription modulator |
| chr15_+_52311398 | 6.70 |
ENST00000261845.5
|
MAPK6
|
mitogen-activated protein kinase 6 |
| chr3_+_184081175 | 6.68 |
ENST00000452961.1
ENST00000296223.3 |
POLR2H
|
polymerase (RNA) II (DNA directed) polypeptide H |
| chr11_+_65819802 | 6.57 |
ENST00000528302.1
ENST00000322535.6 ENST00000524627.1 ENST00000533595.1 ENST00000530322.1 |
SF3B2
|
splicing factor 3b, subunit 2, 145kDa |
| chr17_-_61920280 | 6.55 |
ENST00000448276.2
ENST00000577990.1 |
SMARCD2
|
SWI/SNF related, matrix associated, actin dependent regulator of chromatin, subfamily d, member 2 |
| chr1_-_153522562 | 6.54 |
ENST00000368714.1
|
S100A4
|
S100 calcium binding protein A4 |
| chrX_-_152989531 | 6.49 |
ENST00000458587.2
ENST00000416815.1 |
BCAP31
|
B-cell receptor-associated protein 31 |
| chr4_-_7069760 | 6.49 |
ENST00000264954.4
|
GRPEL1
|
GrpE-like 1, mitochondrial (E. coli) |
| chr20_-_62710832 | 6.45 |
ENST00000395042.1
|
RGS19
|
regulator of G-protein signaling 19 |
| chr5_+_154238042 | 6.43 |
ENST00000519211.1
ENST00000522458.1 ENST00000519903.1 ENST00000521450.1 ENST00000403027.2 |
CNOT8
|
CCR4-NOT transcription complex, subunit 8 |
| chr11_+_124609823 | 6.40 |
ENST00000412681.2
|
NRGN
|
neurogranin (protein kinase C substrate, RC3) |
| chr19_-_59066327 | 6.34 |
ENST00000596708.1
ENST00000601220.1 ENST00000597848.1 |
CHMP2A
|
charged multivesicular body protein 2A |
| chr16_+_2521500 | 6.33 |
ENST00000293973.1
|
NTN3
|
netrin 3 |
| chr22_+_23243156 | 6.22 |
ENST00000390323.2
|
IGLC2
|
immunoglobulin lambda constant 2 (Kern-Oz- marker) |
| chr19_+_48828582 | 6.15 |
ENST00000270221.6
ENST00000596315.1 |
EMP3
|
epithelial membrane protein 3 |
| chr19_+_47105309 | 6.14 |
ENST00000599839.1
ENST00000596362.1 |
CALM3
|
calmodulin 3 (phosphorylase kinase, delta) |
| chr4_+_107236722 | 6.11 |
ENST00000442366.1
|
AIMP1
|
aminoacyl tRNA synthetase complex-interacting multifunctional protein 1 |
| chr16_+_22308717 | 6.10 |
ENST00000299853.5
ENST00000564209.1 ENST00000565358.1 ENST00000418581.2 ENST00000564883.1 ENST00000359210.4 ENST00000563024.1 |
POLR3E
|
polymerase (RNA) III (DNA directed) polypeptide E (80kD) |
| chr12_-_2986107 | 6.10 |
ENST00000359843.3
ENST00000342628.2 ENST00000361953.3 |
FOXM1
|
forkhead box M1 |
| chr5_+_154238149 | 6.08 |
ENST00000519430.1
ENST00000520671.1 ENST00000521583.1 ENST00000518028.1 ENST00000519404.1 ENST00000519394.1 ENST00000518775.1 |
CNOT8
|
CCR4-NOT transcription complex, subunit 8 |
| chr3_-_107809816 | 6.04 |
ENST00000361309.5
ENST00000355354.7 |
CD47
|
CD47 molecule |
| chr17_+_41158742 | 6.02 |
ENST00000415816.2
ENST00000438323.2 |
IFI35
|
interferon-induced protein 35 |
| chr22_-_19419205 | 6.02 |
ENST00000340170.4
ENST00000263208.5 |
HIRA
|
histone cell cycle regulator |
| chr8_+_74888417 | 5.99 |
ENST00000517439.1
ENST00000312184.5 |
TMEM70
|
transmembrane protein 70 |
| chr4_+_107236847 | 5.97 |
ENST00000358008.3
|
AIMP1
|
aminoacyl tRNA synthetase complex-interacting multifunctional protein 1 |
| chr8_-_145642267 | 5.97 |
ENST00000301305.3
|
SLC39A4
|
solute carrier family 39 (zinc transporter), member 4 |
| chr17_-_79827808 | 5.97 |
ENST00000580685.1
|
ARHGDIA
|
Rho GDP dissociation inhibitor (GDI) alpha |
| chrX_+_23682379 | 5.97 |
ENST00000379349.1
|
PRDX4
|
peroxiredoxin 4 |
| chr12_-_109125285 | 5.96 |
ENST00000552871.1
ENST00000261401.3 |
CORO1C
|
coronin, actin binding protein, 1C |
| chrX_+_70503433 | 5.95 |
ENST00000276079.8
ENST00000373856.3 ENST00000373841.1 ENST00000420903.1 |
NONO
|
non-POU domain containing, octamer-binding |
| chrY_+_2709527 | 5.95 |
ENST00000250784.8
|
RPS4Y1
|
ribosomal protein S4, Y-linked 1 |
| chr11_+_34460447 | 5.92 |
ENST00000241052.4
|
CAT
|
catalase |
| chr11_+_16760161 | 5.90 |
ENST00000524439.1
ENST00000422258.2 ENST00000528634.1 ENST00000525684.1 |
C11orf58
|
chromosome 11 open reading frame 58 |
| chr6_+_33172407 | 5.89 |
ENST00000374662.3
|
HSD17B8
|
hydroxysteroid (17-beta) dehydrogenase 8 |
| chr11_+_34938119 | 5.86 |
ENST00000227868.4
ENST00000430469.2 ENST00000533262.1 |
PDHX
|
pyruvate dehydrogenase complex, component X |
| chr1_+_64059332 | 5.82 |
ENST00000540265.1
|
PGM1
|
phosphoglucomutase 1 |
| chr13_+_115000521 | 5.78 |
ENST00000252457.5
ENST00000375308.1 |
CDC16
|
cell division cycle 16 |
| chr16_+_88872176 | 5.78 |
ENST00000569140.1
|
CDT1
|
chromatin licensing and DNA replication factor 1 |
| chr12_-_110888103 | 5.76 |
ENST00000426440.1
ENST00000228825.7 |
ARPC3
|
actin related protein 2/3 complex, subunit 3, 21kDa |
| chr12_+_51632638 | 5.75 |
ENST00000549732.2
|
DAZAP2
|
DAZ associated protein 2 |
| chr1_+_64058939 | 5.69 |
ENST00000371084.3
|
PGM1
|
phosphoglucomutase 1 |
| chr10_-_43904235 | 5.68 |
ENST00000356053.3
|
HNRNPF
|
heterogeneous nuclear ribonucleoprotein F |
| chr22_+_23241661 | 5.67 |
ENST00000390322.2
|
IGLJ2
|
immunoglobulin lambda joining 2 |
| chr3_+_179280668 | 5.64 |
ENST00000429709.2
ENST00000450518.2 ENST00000392662.1 ENST00000490364.1 |
ACTL6A
|
actin-like 6A |
| chr10_+_120863587 | 5.63 |
ENST00000535029.1
ENST00000361432.2 ENST00000544016.1 |
FAM45A
|
family with sequence similarity 45, member A |
| chr11_+_68451943 | 5.59 |
ENST00000265643.3
|
GAL
|
galanin/GMAP prepropeptide |
| chr3_+_184081137 | 5.57 |
ENST00000443489.1
|
POLR2H
|
polymerase (RNA) II (DNA directed) polypeptide H |
| chr19_+_17858547 | 5.57 |
ENST00000600676.1
ENST00000600209.1 ENST00000596309.1 ENST00000598539.1 ENST00000597474.1 ENST00000593385.1 ENST00000598067.1 ENST00000593833.1 |
FCHO1
|
FCH domain only 1 |
| chr19_+_50180507 | 5.55 |
ENST00000454376.2
ENST00000524771.1 |
PRMT1
|
protein arginine methyltransferase 1 |
| chr19_-_10305752 | 5.48 |
ENST00000540357.1
ENST00000359526.4 ENST00000340748.4 |
DNMT1
|
DNA (cytosine-5-)-methyltransferase 1 |
| chrX_+_24072833 | 5.47 |
ENST00000253039.4
|
EIF2S3
|
eukaryotic translation initiation factor 2, subunit 3 gamma, 52kDa |
| chr3_-_58419537 | 5.46 |
ENST00000474765.1
ENST00000485460.1 ENST00000302746.6 ENST00000383714.4 |
PDHB
|
pyruvate dehydrogenase (lipoamide) beta |
| chr2_-_136875712 | 5.41 |
ENST00000241393.3
|
CXCR4
|
chemokine (C-X-C motif) receptor 4 |
| chr2_-_96874553 | 5.35 |
ENST00000337288.5
ENST00000443962.1 |
STARD7
|
StAR-related lipid transfer (START) domain containing 7 |
| chr19_+_48824711 | 5.34 |
ENST00000599704.1
|
EMP3
|
epithelial membrane protein 3 |
| chr17_+_30677136 | 5.34 |
ENST00000394670.4
ENST00000321233.6 ENST00000394673.2 ENST00000341711.6 ENST00000579634.1 ENST00000580759.1 ENST00000342555.6 ENST00000577908.1 ENST00000394679.5 ENST00000582165.1 |
ZNF207
|
zinc finger protein 207 |
| chr4_+_107237660 | 5.33 |
ENST00000394701.4
|
AIMP1
|
aminoacyl tRNA synthetase complex-interacting multifunctional protein 1 |
| chr15_-_49447835 | 5.32 |
ENST00000388901.5
ENST00000299259.6 |
COPS2
|
COP9 signalosome subunit 2 |
| chr6_-_133084580 | 5.32 |
ENST00000525270.1
ENST00000530536.1 ENST00000524919.1 |
VNN2
|
vanin 2 |
| chr12_+_51633061 | 5.30 |
ENST00000551313.1
|
DAZAP2
|
DAZ associated protein 2 |
| chr19_-_59070239 | 5.30 |
ENST00000595957.1
ENST00000253023.3 |
UBE2M
|
ubiquitin-conjugating enzyme E2M |
| chr22_-_50964849 | 5.26 |
ENST00000543927.1
ENST00000423348.1 |
SCO2
|
SCO2 cytochrome c oxidase assembly protein |
| chr12_-_120687948 | 5.25 |
ENST00000458477.2
|
PXN
|
paxillin |
| chrX_-_152989798 | 5.25 |
ENST00000441714.1
ENST00000442093.1 ENST00000429550.1 ENST00000345046.6 |
BCAP31
|
B-cell receptor-associated protein 31 |
| chr14_-_60632162 | 5.25 |
ENST00000557185.1
|
DHRS7
|
dehydrogenase/reductase (SDR family) member 7 |
| chr1_-_19811132 | 5.23 |
ENST00000433834.1
|
CAPZB
|
capping protein (actin filament) muscle Z-line, beta |
| chr12_-_125348448 | 5.21 |
ENST00000339570.5
|
SCARB1
|
scavenger receptor class B, member 1 |
| chr14_-_105262055 | 5.21 |
ENST00000349310.3
|
AKT1
|
v-akt murine thymoma viral oncogene homolog 1 |
| chr22_+_39378375 | 5.20 |
ENST00000402182.3
ENST00000333467.3 |
APOBEC3B
|
apolipoprotein B mRNA editing enzyme, catalytic polypeptide-like 3B |
| chr14_-_24615523 | 5.20 |
ENST00000559056.1
|
PSME2
|
proteasome (prosome, macropain) activator subunit 2 (PA28 beta) |
| chr2_+_48010312 | 5.19 |
ENST00000540021.1
|
MSH6
|
mutS homolog 6 |
| chr17_-_73761222 | 5.16 |
ENST00000437911.1
ENST00000225614.2 |
GALK1
|
galactokinase 1 |
| chr7_-_55606346 | 5.14 |
ENST00000545390.1
|
VOPP1
|
vesicular, overexpressed in cancer, prosurvival protein 1 |
| chr19_-_59066452 | 5.13 |
ENST00000312547.2
|
CHMP2A
|
charged multivesicular body protein 2A |
| chr6_+_44214824 | 5.13 |
ENST00000371646.5
ENST00000353801.3 |
HSP90AB1
|
heat shock protein 90kDa alpha (cytosolic), class B member 1 |
| chr11_-_6640585 | 5.09 |
ENST00000533371.1
ENST00000528657.1 ENST00000436873.2 ENST00000299427.6 |
TPP1
|
tripeptidyl peptidase I |
| chr22_+_41258250 | 5.09 |
ENST00000544094.1
|
XPNPEP3
|
X-prolyl aminopeptidase (aminopeptidase P) 3, putative |
| chrX_+_23685653 | 5.09 |
ENST00000379331.3
|
PRDX4
|
peroxiredoxin 4 |
| chr22_+_39378346 | 5.04 |
ENST00000407298.3
|
APOBEC3B
|
apolipoprotein B mRNA editing enzyme, catalytic polypeptide-like 3B |
| chr16_-_3767551 | 5.01 |
ENST00000246957.5
|
TRAP1
|
TNF receptor-associated protein 1 |
| chr14_-_106209368 | 5.00 |
ENST00000390548.2
ENST00000390549.2 ENST00000390542.2 |
IGHG1
|
immunoglobulin heavy constant gamma 1 (G1m marker) |
| chr12_+_72148614 | 5.00 |
ENST00000261263.3
|
RAB21
|
RAB21, member RAS oncogene family |
| chr19_-_55791431 | 4.99 |
ENST00000593263.1
ENST00000376343.3 |
HSPBP1
|
HSPA (heat shock 70kDa) binding protein, cytoplasmic cochaperone 1 |
| chr3_-_72496035 | 4.97 |
ENST00000477973.2
|
RYBP
|
RING1 and YY1 binding protein |
| chr2_-_197041193 | 4.95 |
ENST00000409228.1
|
STK17B
|
serine/threonine kinase 17b |
| chr6_-_16761678 | 4.94 |
ENST00000244769.4
ENST00000436367.1 |
ATXN1
|
ataxin 1 |
| chr5_+_154237778 | 4.93 |
ENST00000523698.1
ENST00000517876.1 ENST00000520472.1 |
CNOT8
|
CCR4-NOT transcription complex, subunit 8 |
| chr12_+_53689309 | 4.89 |
ENST00000351500.3
ENST00000550846.1 ENST00000334478.4 ENST00000549759.1 |
PFDN5
|
prefoldin subunit 5 |
| chr3_-_25824872 | 4.87 |
ENST00000308710.5
|
NGLY1
|
N-glycanase 1 |
| chr11_-_414948 | 4.83 |
ENST00000530494.1
ENST00000528209.1 ENST00000431843.2 ENST00000528058.1 |
SIGIRR
|
single immunoglobulin and toll-interleukin 1 receptor (TIR) domain |
| chr19_-_55791540 | 4.82 |
ENST00000433386.2
|
HSPBP1
|
HSPA (heat shock 70kDa) binding protein, cytoplasmic cochaperone 1 |
| chr2_+_48010221 | 4.81 |
ENST00000234420.5
|
MSH6
|
mutS homolog 6 |
| chr14_+_50359773 | 4.81 |
ENST00000298316.5
|
ARF6
|
ADP-ribosylation factor 6 |
| chr5_-_150460914 | 4.76 |
ENST00000389378.2
|
TNIP1
|
TNFAIP3 interacting protein 1 |
| chrX_+_64887512 | 4.76 |
ENST00000360270.5
|
MSN
|
moesin |
| chr14_-_105262016 | 4.73 |
ENST00000407796.2
|
AKT1
|
v-akt murine thymoma viral oncogene homolog 1 |
| chr20_+_62327996 | 4.68 |
ENST00000369996.1
|
TNFRSF6B
|
tumor necrosis factor receptor superfamily, member 6b, decoy |
| chr7_-_6098770 | 4.66 |
ENST00000536084.1
ENST00000446699.1 ENST00000199389.6 |
EIF2AK1
|
eukaryotic translation initiation factor 2-alpha kinase 1 |
| chr10_-_99258135 | 4.63 |
ENST00000327238.10
ENST00000327277.7 ENST00000355839.6 ENST00000437002.1 ENST00000422685.1 |
MMS19
|
MMS19 nucleotide excision repair homolog (S. cerevisiae) |
| chr16_-_28506840 | 4.62 |
ENST00000569430.1
|
CLN3
|
ceroid-lipofuscinosis, neuronal 3 |
| chr21_-_33984456 | 4.61 |
ENST00000431216.1
ENST00000553001.1 ENST00000440966.1 |
AP000275.65
C21orf59
|
Uncharacterized protein chromosome 21 open reading frame 59 |
| chr19_-_51512804 | 4.58 |
ENST00000594211.1
ENST00000376832.4 |
KLK9
|
kallikrein-related peptidase 9 |
| chr19_+_23299777 | 4.56 |
ENST00000597761.2
|
ZNF730
|
zinc finger protein 730 |
| chr5_+_154238096 | 4.54 |
ENST00000517568.1
ENST00000524105.1 ENST00000285896.6 |
CNOT8
|
CCR4-NOT transcription complex, subunit 8 |
| chr19_-_2051223 | 4.54 |
ENST00000309340.7
ENST00000589534.1 ENST00000250896.3 ENST00000589509.1 |
MKNK2
|
MAP kinase interacting serine/threonine kinase 2 |
| chr12_+_53645870 | 4.52 |
ENST00000329548.4
|
MFSD5
|
major facilitator superfamily domain containing 5 |
| chr20_+_30639991 | 4.51 |
ENST00000534862.1
ENST00000538448.1 ENST00000375862.2 |
HCK
|
hemopoietic cell kinase |
Network of associatons between targets according to the STRING database.

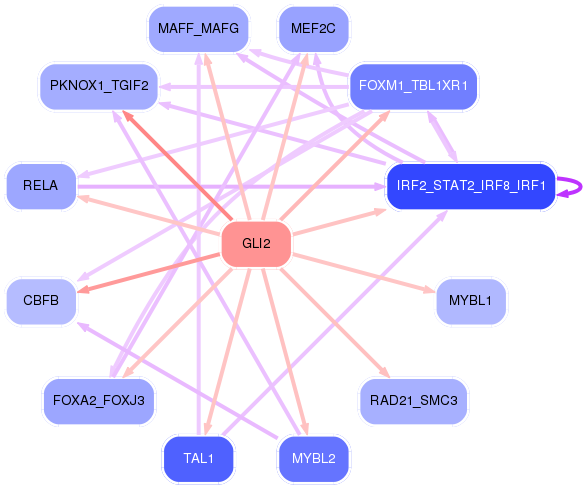
First level regulatory network of GLI2
Gene Ontology Analysis
Gene overrepresentation in biological_process category:
| Log-likelihood per target | Total log-likelihood | Term | Description |
|---|---|---|---|
| 3.8 | 11.5 | GO:1903722 | regulation of centriole elongation(GO:1903722) |
| 3.8 | 11.3 | GO:0006428 | isoleucyl-tRNA aminoacylation(GO:0006428) |
| 3.6 | 10.9 | GO:0018171 | peptidyl-cysteine oxidation(GO:0018171) |
| 3.5 | 10.4 | GO:0051066 | dihydrobiopterin metabolic process(GO:0051066) |
| 2.9 | 11.6 | GO:0005997 | xylulose metabolic process(GO:0005997) |
| 2.9 | 14.4 | GO:0070682 | proteasome regulatory particle assembly(GO:0070682) |
| 2.8 | 8.3 | GO:0051083 | 'de novo' cotranslational protein folding(GO:0051083) |
| 2.7 | 27.2 | GO:0007144 | female meiosis I(GO:0007144) |
| 2.7 | 13.3 | GO:2000255 | negative regulation of male germ cell proliferation(GO:2000255) |
| 2.6 | 7.8 | GO:0015920 | lipopolysaccharide transport(GO:0015920) |
| 2.5 | 15.0 | GO:0006177 | GMP biosynthetic process(GO:0006177) |
| 2.5 | 9.9 | GO:1903719 | regulation of I-kappaB phosphorylation(GO:1903719) positive regulation of I-kappaB phosphorylation(GO:1903721) |
| 2.4 | 7.3 | GO:0033277 | abortive mitotic cell cycle(GO:0033277) |
| 2.4 | 17.0 | GO:0046984 | regulation of hemoglobin biosynthetic process(GO:0046984) |
| 2.4 | 16.7 | GO:0070269 | pyroptosis(GO:0070269) |
| 2.4 | 9.5 | GO:0002439 | chronic inflammatory response to antigenic stimulus(GO:0002439) |
| 2.4 | 9.5 | GO:0010900 | negative regulation of phosphatidylcholine catabolic process(GO:0010900) |
| 2.4 | 2.4 | GO:1902739 | interferon-alpha secretion(GO:0072642) regulation of interferon-alpha secretion(GO:1902739) positive regulation of interferon-alpha secretion(GO:1902741) |
| 2.3 | 11.7 | GO:1904154 | positive regulation of retrograde protein transport, ER to cytosol(GO:1904154) |
| 2.3 | 7.0 | GO:0044209 | AMP salvage(GO:0044209) |
| 2.3 | 20.7 | GO:0061732 | mitochondrial acetyl-CoA biosynthetic process from pyruvate(GO:0061732) |
| 2.0 | 6.0 | GO:0043461 | proton-transporting ATP synthase complex assembly(GO:0043461) proton-transporting ATP synthase complex biogenesis(GO:0070272) |
| 2.0 | 7.8 | GO:1903660 | negative regulation of complement-dependent cytotoxicity(GO:1903660) |
| 1.9 | 5.8 | GO:0017186 | peptidyl-pyroglutamic acid biosynthetic process, using glutaminyl-peptide cyclotransferase(GO:0017186) |
| 1.9 | 5.8 | GO:1902595 | regulation of DNA replication origin binding(GO:1902595) |
| 1.9 | 33.7 | GO:0030388 | fructose 1,6-bisphosphate metabolic process(GO:0030388) |
| 1.9 | 5.6 | GO:0051795 | cortisol secretion(GO:0043400) regulation of cortisol secretion(GO:0051462) positive regulation of catagen(GO:0051795) |
| 1.8 | 7.4 | GO:0009224 | CMP salvage(GO:0006238) CMP biosynthetic process(GO:0009224) CMP metabolic process(GO:0046035) |
| 1.8 | 9.0 | GO:1905098 | negative regulation of guanyl-nucleotide exchange factor activity(GO:1905098) |
| 1.7 | 5.2 | GO:0006059 | hexitol metabolic process(GO:0006059) |
| 1.7 | 6.8 | GO:0001831 | trophectodermal cellular morphogenesis(GO:0001831) |
| 1.7 | 8.3 | GO:0006015 | 5-phosphoribose 1-diphosphate biosynthetic process(GO:0006015) 5-phosphoribose 1-diphosphate metabolic process(GO:0046391) |
| 1.6 | 4.8 | GO:0085032 | modulation of signal transduction in other organism(GO:0044501) modulation by symbiont of host signal transduction pathway(GO:0052027) modulation of signal transduction in other organism involved in symbiotic interaction(GO:0052250) modulation by symbiont of host I-kappaB kinase/NF-kappaB cascade(GO:0085032) |
| 1.6 | 4.8 | GO:0002522 | leukocyte migration involved in immune response(GO:0002522) |
| 1.6 | 17.1 | GO:2000582 | positive regulation of microtubule motor activity(GO:2000576) regulation of ATP-dependent microtubule motor activity, plus-end-directed(GO:2000580) positive regulation of ATP-dependent microtubule motor activity, plus-end-directed(GO:2000582) |
| 1.5 | 10.7 | GO:2000491 | positive regulation of hepatic stellate cell activation(GO:2000491) |
| 1.5 | 10.6 | GO:0008295 | spermidine biosynthetic process(GO:0008295) |
| 1.5 | 4.5 | GO:0010621 | negative regulation of transcription by transcription factor localization(GO:0010621) gall bladder development(GO:0061010) |
| 1.5 | 5.9 | GO:1903377 | negative regulation of oxidative stress-induced neuron intrinsic apoptotic signaling pathway(GO:1903377) |
| 1.5 | 5.9 | GO:0033591 | response to L-ascorbic acid(GO:0033591) |
| 1.4 | 8.6 | GO:0046940 | nucleoside monophosphate phosphorylation(GO:0046940) |
| 1.4 | 10.0 | GO:0000710 | meiotic mismatch repair(GO:0000710) |
| 1.4 | 4.2 | GO:0002581 | negative regulation of antigen processing and presentation of peptide or polysaccharide antigen via MHC class II(GO:0002581) |
| 1.4 | 8.2 | GO:0032511 | late endosome to vacuole transport via multivesicular body sorting pathway(GO:0032511) |
| 1.4 | 5.5 | GO:0010216 | maintenance of DNA methylation(GO:0010216) |
| 1.4 | 4.1 | GO:0006478 | peptidyl-tyrosine sulfation(GO:0006478) |
| 1.3 | 10.8 | GO:0017182 | peptidyl-diphthamide metabolic process(GO:0017182) peptidyl-diphthamide biosynthetic process from peptidyl-histidine(GO:0017183) |
| 1.3 | 7.8 | GO:0034626 | fatty acid elongation, saturated fatty acid(GO:0019367) fatty acid elongation, unsaturated fatty acid(GO:0019368) fatty acid elongation, monounsaturated fatty acid(GO:0034625) fatty acid elongation, polyunsaturated fatty acid(GO:0034626) |
| 1.3 | 41.8 | GO:0050855 | regulation of B cell receptor signaling pathway(GO:0050855) |
| 1.3 | 7.6 | GO:2000825 | positive regulation of androgen receptor activity(GO:2000825) |
| 1.3 | 5.0 | GO:0009386 | translational attenuation(GO:0009386) |
| 1.2 | 3.6 | GO:1903925 | signal transduction involved in intra-S DNA damage checkpoint(GO:0072428) response to bisphenol A(GO:1903925) cellular response to bisphenol A(GO:1903926) |
| 1.2 | 10.8 | GO:0045716 | positive regulation of low-density lipoprotein particle receptor biosynthetic process(GO:0045716) |
| 1.2 | 1.2 | GO:0061740 | protein targeting to lysosome involved in chaperone-mediated autophagy(GO:0061740) |
| 1.2 | 4.6 | GO:0035752 | lysosomal lumen pH elevation(GO:0035752) |
| 1.1 | 18.0 | GO:0000338 | protein deneddylation(GO:0000338) |
| 1.1 | 4.4 | GO:0046952 | ketone body catabolic process(GO:0046952) |
| 1.0 | 5.2 | GO:0051490 | negative regulation of filopodium assembly(GO:0051490) |
| 1.0 | 10.4 | GO:0006268 | DNA unwinding involved in DNA replication(GO:0006268) |
| 1.0 | 5.2 | GO:0002442 | serotonin production involved in inflammatory response(GO:0002351) serotonin secretion involved in inflammatory response(GO:0002442) serotonin secretion by platelet(GO:0002554) |
| 1.0 | 2.1 | GO:0032079 | positive regulation of endodeoxyribonuclease activity(GO:0032079) |
| 1.0 | 3.1 | GO:0006404 | RNA import into nucleus(GO:0006404) |
| 1.0 | 7.1 | GO:0045079 | negative regulation of chemokine biosynthetic process(GO:0045079) |
| 1.0 | 4.0 | GO:0030174 | regulation of DNA-dependent DNA replication initiation(GO:0030174) |
| 1.0 | 10.8 | GO:0043248 | proteasome assembly(GO:0043248) |
| 1.0 | 17.6 | GO:0038092 | nodal signaling pathway(GO:0038092) |
| 1.0 | 9.8 | GO:2000643 | positive regulation of early endosome to late endosome transport(GO:2000643) |
| 1.0 | 3.9 | GO:1903826 | arginine transmembrane transport(GO:1903826) |
| 1.0 | 2.9 | GO:0034124 | regulation of MyD88-dependent toll-like receptor signaling pathway(GO:0034124) |
| 0.9 | 2.8 | GO:0006550 | isoleucine catabolic process(GO:0006550) |
| 0.9 | 5.7 | GO:0006540 | glutamate decarboxylation to succinate(GO:0006540) gamma-aminobutyric acid catabolic process(GO:0009450) |
| 0.9 | 16.0 | GO:0032786 | positive regulation of DNA-templated transcription, elongation(GO:0032786) |
| 0.9 | 7.4 | GO:0070475 | rRNA base methylation(GO:0070475) |
| 0.9 | 18.8 | GO:0071243 | cellular response to arsenic-containing substance(GO:0071243) |
| 0.9 | 4.5 | GO:0033489 | cholesterol biosynthetic process via desmosterol(GO:0033489) cholesterol biosynthetic process via lathosterol(GO:0033490) |
| 0.9 | 12.5 | GO:0051315 | attachment of mitotic spindle microtubules to kinetochore(GO:0051315) |
| 0.9 | 2.6 | GO:1902499 | positive regulation of protein autoubiquitination(GO:1902499) |
| 0.9 | 7.0 | GO:0070995 | NADPH oxidation(GO:0070995) |
| 0.9 | 5.2 | GO:0044789 | modulation by host of viral release from host cell(GO:0044789) positive regulation by host of viral release from host cell(GO:0044791) |
| 0.9 | 2.6 | GO:0060018 | astrocyte fate commitment(GO:0060018) |
| 0.8 | 6.6 | GO:1904469 | positive regulation of tumor necrosis factor secretion(GO:1904469) |
| 0.8 | 11.2 | GO:0010528 | regulation of transposition(GO:0010528) negative regulation of transposition(GO:0010529) |
| 0.8 | 3.2 | GO:0036228 | protein targeting to nuclear inner membrane(GO:0036228) |
| 0.8 | 2.4 | GO:1904751 | positive regulation of protein localization to nucleolus(GO:1904751) |
| 0.8 | 4.7 | GO:0035965 | cardiolipin acyl-chain remodeling(GO:0035965) |
| 0.8 | 5.4 | GO:0060154 | response to cycloheximide(GO:0046898) cellular process regulating host cell cycle in response to virus(GO:0060154) |
| 0.8 | 5.4 | GO:0019064 | fusion of virus membrane with host plasma membrane(GO:0019064) membrane fusion involved in viral entry into host cell(GO:0039663) multi-organism membrane fusion(GO:0044800) |
| 0.8 | 36.8 | GO:0006370 | 7-methylguanosine mRNA capping(GO:0006370) |
| 0.8 | 7.7 | GO:0046784 | viral mRNA export from host cell nucleus(GO:0046784) |
| 0.8 | 9.2 | GO:0019388 | galactose catabolic process(GO:0019388) |
| 0.7 | 11.7 | GO:0008635 | activation of cysteine-type endopeptidase activity involved in apoptotic process by cytochrome c(GO:0008635) |
| 0.7 | 4.4 | GO:0060011 | Sertoli cell proliferation(GO:0060011) |
| 0.7 | 2.1 | GO:0000379 | tRNA-type intron splice site recognition and cleavage(GO:0000379) |
| 0.7 | 6.3 | GO:0090073 | positive regulation of protein homodimerization activity(GO:0090073) |
| 0.7 | 3.5 | GO:1900262 | regulation of DNA-directed DNA polymerase activity(GO:1900262) positive regulation of DNA-directed DNA polymerase activity(GO:1900264) |
| 0.7 | 11.0 | GO:0051639 | actin filament network formation(GO:0051639) |
| 0.7 | 22.8 | GO:0061014 | positive regulation of mRNA catabolic process(GO:0061014) |
| 0.7 | 31.4 | GO:0001937 | negative regulation of endothelial cell proliferation(GO:0001937) |
| 0.7 | 4.6 | GO:0000160 | phosphorelay signal transduction system(GO:0000160) |
| 0.7 | 1.3 | GO:0033594 | response to hydroxyisoflavone(GO:0033594) |
| 0.6 | 11.6 | GO:0002523 | leukocyte migration involved in inflammatory response(GO:0002523) |
| 0.6 | 1.9 | GO:0010752 | regulation of cGMP-mediated signaling(GO:0010752) |
| 0.6 | 1.9 | GO:1905205 | positive regulation of connective tissue replacement(GO:1905205) |
| 0.6 | 2.5 | GO:0035546 | gamma-delta T cell activation involved in immune response(GO:0002290) interferon-beta secretion(GO:0035546) regulation of interferon-beta secretion(GO:0035547) negative regulation of interferon-beta secretion(GO:0035548) type I interferon secretion(GO:0072641) regulation of gamma-delta T cell activation involved in immune response(GO:2001191) positive regulation of gamma-delta T cell activation involved in immune response(GO:2001193) |
| 0.6 | 2.5 | GO:2000563 | positive regulation of CD4-positive, alpha-beta T cell proliferation(GO:2000563) |
| 0.6 | 1.9 | GO:0002625 | regulation of T cell antigen processing and presentation(GO:0002625) |
| 0.6 | 12.3 | GO:0016254 | preassembly of GPI anchor in ER membrane(GO:0016254) |
| 0.6 | 6.1 | GO:2000781 | positive regulation of double-strand break repair(GO:2000781) |
| 0.6 | 4.2 | GO:0033600 | negative regulation of mammary gland epithelial cell proliferation(GO:0033600) |
| 0.6 | 1.8 | GO:0006121 | mitochondrial electron transport, succinate to ubiquinone(GO:0006121) |
| 0.6 | 3.0 | GO:1990034 | calcium ion export from cell(GO:1990034) |
| 0.6 | 6.0 | GO:0071578 | zinc II ion transmembrane import(GO:0071578) |
| 0.6 | 2.4 | GO:1900186 | negative regulation of clathrin-mediated endocytosis(GO:1900186) |
| 0.6 | 7.1 | GO:0046689 | response to mercury ion(GO:0046689) |
| 0.6 | 19.3 | GO:0042347 | negative regulation of NF-kappaB import into nucleus(GO:0042347) |
| 0.6 | 1.7 | GO:0098968 | neurotransmitter receptor transport postsynaptic membrane to endosome(GO:0098968) |
| 0.6 | 9.2 | GO:0006516 | glycoprotein catabolic process(GO:0006516) |
| 0.6 | 4.0 | GO:0015755 | fructose transport(GO:0015755) fructose import(GO:0032445) carbohydrate import into cell(GO:0097319) carbohydrate import across plasma membrane(GO:0098704) fructose import across plasma membrane(GO:1990539) |
| 0.6 | 1.7 | GO:0044537 | regulation of circulating fibrinogen levels(GO:0044537) |
| 0.5 | 3.8 | GO:0009146 | purine nucleoside triphosphate catabolic process(GO:0009146) |
| 0.5 | 5.3 | GO:0015939 | pantothenate metabolic process(GO:0015939) |
| 0.5 | 52.6 | GO:0051436 | negative regulation of ubiquitin-protein ligase activity involved in mitotic cell cycle(GO:0051436) |
| 0.5 | 5.5 | GO:1902969 | mitotic DNA replication(GO:1902969) |
| 0.5 | 2.0 | GO:1902527 | positive regulation of protein monoubiquitination(GO:1902527) |
| 0.5 | 4.9 | GO:0044387 | negative regulation of protein kinase activity by regulation of protein phosphorylation(GO:0044387) |
| 0.5 | 1.9 | GO:0014038 | regulation of Schwann cell differentiation(GO:0014038) positive regulation of Schwann cell differentiation(GO:0014040) |
| 0.5 | 16.3 | GO:0045737 | positive regulation of cyclin-dependent protein serine/threonine kinase activity(GO:0045737) |
| 0.4 | 18.3 | GO:0060338 | regulation of type I interferon-mediated signaling pathway(GO:0060338) |
| 0.4 | 18.2 | GO:0051220 | cytoplasmic sequestering of protein(GO:0051220) |
| 0.4 | 3.0 | GO:0061052 | negative regulation of cell growth involved in cardiac muscle cell development(GO:0061052) |
| 0.4 | 6.5 | GO:0030150 | protein import into mitochondrial matrix(GO:0030150) |
| 0.4 | 1.7 | GO:0032815 | negative regulation of natural killer cell activation(GO:0032815) |
| 0.4 | 29.7 | GO:0006953 | acute-phase response(GO:0006953) |
| 0.4 | 2.6 | GO:0007296 | vitellogenesis(GO:0007296) regulation of pro-B cell differentiation(GO:2000973) |
| 0.4 | 2.9 | GO:0021840 | directional guidance of interneurons involved in migration from the subpallium to the cortex(GO:0021840) chemorepulsion involved in interneuron migration from the subpallium to the cortex(GO:0021842) |
| 0.4 | 5.0 | GO:2000271 | positive regulation of fibroblast apoptotic process(GO:2000271) |
| 0.4 | 2.1 | GO:2000574 | regulation of microtubule motor activity(GO:2000574) |
| 0.4 | 1.6 | GO:1900535 | medium-chain fatty-acyl-CoA catabolic process(GO:0036114) long-chain fatty-acyl-CoA catabolic process(GO:0036116) palmitic acid metabolic process(GO:1900533) palmitic acid biosynthetic process(GO:1900535) |
| 0.4 | 2.9 | GO:0035898 | parathyroid hormone secretion(GO:0035898) post-embryonic body morphogenesis(GO:0040032) regulation of parathyroid hormone secretion(GO:2000828) |
| 0.4 | 12.6 | GO:0048268 | clathrin coat assembly(GO:0048268) |
| 0.4 | 11.2 | GO:0000470 | maturation of LSU-rRNA(GO:0000470) |
| 0.4 | 3.6 | GO:0034244 | negative regulation of transcription elongation from RNA polymerase II promoter(GO:0034244) |
| 0.4 | 1.9 | GO:0044860 | protein localization to plasma membrane raft(GO:0044860) |
| 0.4 | 6.0 | GO:0008228 | opsonization(GO:0008228) |
| 0.4 | 3.7 | GO:0015781 | pyrimidine nucleotide-sugar transport(GO:0015781) |
| 0.4 | 7.5 | GO:0031935 | regulation of chromatin silencing(GO:0031935) |
| 0.4 | 1.5 | GO:0051958 | methotrexate transport(GO:0051958) reduced folate transmembrane transport(GO:0098838) |
| 0.4 | 1.5 | GO:0044821 | meiotic telomere tethering at nuclear periphery(GO:0044821) meiotic attachment of telomere to nuclear envelope(GO:0070197) chromosome attachment to the nuclear envelope(GO:0097240) |
| 0.4 | 1.8 | GO:0097029 | mature conventional dendritic cell differentiation(GO:0097029) |
| 0.4 | 1.1 | GO:0006423 | cysteinyl-tRNA aminoacylation(GO:0006423) |
| 0.4 | 1.8 | GO:0070495 | regulation of thrombin receptor signaling pathway(GO:0070494) negative regulation of thrombin receptor signaling pathway(GO:0070495) |
| 0.4 | 5.5 | GO:0006703 | estrogen biosynthetic process(GO:0006703) |
| 0.4 | 1.1 | GO:0006490 | dolichol-linked oligosaccharide biosynthetic process(GO:0006488) oligosaccharide-lipid intermediate biosynthetic process(GO:0006490) |
| 0.4 | 1.1 | GO:0006419 | alanyl-tRNA aminoacylation(GO:0006419) |
| 0.4 | 1.8 | GO:2001268 | negative regulation of cysteine-type endopeptidase activity involved in apoptotic signaling pathway(GO:2001268) |
| 0.4 | 5.3 | GO:0006878 | cellular copper ion homeostasis(GO:0006878) |
| 0.3 | 2.1 | GO:0019372 | lipoxygenase pathway(GO:0019372) |
| 0.3 | 8.9 | GO:0009235 | cobalamin metabolic process(GO:0009235) |
| 0.3 | 4.4 | GO:0000212 | meiotic spindle organization(GO:0000212) |
| 0.3 | 5.1 | GO:0035020 | regulation of Rac protein signal transduction(GO:0035020) |
| 0.3 | 14.1 | GO:0034314 | Arp2/3 complex-mediated actin nucleation(GO:0034314) |
| 0.3 | 2.3 | GO:0019509 | L-methionine biosynthetic process from methylthioadenosine(GO:0019509) |
| 0.3 | 4.0 | GO:0048172 | regulation of short-term neuronal synaptic plasticity(GO:0048172) |
| 0.3 | 4.0 | GO:0006089 | lactate metabolic process(GO:0006089) |
| 0.3 | 5.3 | GO:0045116 | protein neddylation(GO:0045116) |
| 0.3 | 2.6 | GO:1903608 | protein localization to cytoplasmic stress granule(GO:1903608) |
| 0.3 | 14.0 | GO:0006378 | mRNA polyadenylation(GO:0006378) |
| 0.3 | 2.2 | GO:1902659 | regulation of glucose mediated signaling pathway(GO:1902659) |
| 0.3 | 28.0 | GO:0032436 | positive regulation of proteasomal ubiquitin-dependent protein catabolic process(GO:0032436) |
| 0.3 | 0.9 | GO:1990869 | beta selection(GO:0043366) response to chemokine(GO:1990868) cellular response to chemokine(GO:1990869) |
| 0.3 | 5.3 | GO:0007172 | signal complex assembly(GO:0007172) |
| 0.3 | 3.4 | GO:0070986 | left/right axis specification(GO:0070986) |
| 0.3 | 0.9 | GO:0002949 | tRNA threonylcarbamoyladenosine modification(GO:0002949) |
| 0.3 | 23.3 | GO:0043044 | ATP-dependent chromatin remodeling(GO:0043044) |
| 0.3 | 2.6 | GO:0048386 | positive regulation of retinoic acid receptor signaling pathway(GO:0048386) |
| 0.3 | 1.2 | GO:0046683 | response to organophosphorus(GO:0046683) |
| 0.3 | 0.8 | GO:1901624 | negative regulation of lymphocyte chemotaxis(GO:1901624) |
| 0.3 | 1.6 | GO:0006012 | galactose metabolic process(GO:0006012) |
| 0.3 | 1.9 | GO:1903337 | positive regulation of vacuolar transport(GO:1903337) positive regulation of endocytic recycling(GO:2001137) |
| 0.3 | 0.8 | GO:0060535 | trachea cartilage morphogenesis(GO:0060535) renal inner medulla development(GO:0072053) renal outer medulla development(GO:0072054) |
| 0.3 | 5.2 | GO:0030252 | growth hormone secretion(GO:0030252) |
| 0.3 | 1.0 | GO:0044240 | multicellular organism lipid catabolic process(GO:0044240) |
| 0.3 | 1.3 | GO:1903361 | protein localization to basolateral plasma membrane(GO:1903361) |
| 0.2 | 2.7 | GO:0035269 | protein O-linked mannosylation(GO:0035269) |
| 0.2 | 2.4 | GO:0000028 | ribosomal small subunit assembly(GO:0000028) |
| 0.2 | 10.6 | GO:0000413 | protein peptidyl-prolyl isomerization(GO:0000413) |
| 0.2 | 0.9 | GO:1904627 | response to phorbol 13-acetate 12-myristate(GO:1904627) cellular response to phorbol 13-acetate 12-myristate(GO:1904628) |
| 0.2 | 0.7 | GO:1901143 | insulin catabolic process(GO:1901143) |
| 0.2 | 1.1 | GO:0034971 | regulation of growth plate cartilage chondrocyte proliferation(GO:0003420) histone H3-R17 methylation(GO:0034971) |
| 0.2 | 0.7 | GO:0090219 | negative regulation of lipid kinase activity(GO:0090219) |
| 0.2 | 1.5 | GO:0050862 | positive regulation of T cell receptor signaling pathway(GO:0050862) |
| 0.2 | 1.9 | GO:0005984 | disaccharide metabolic process(GO:0005984) |
| 0.2 | 1.9 | GO:0038003 | opioid receptor signaling pathway(GO:0038003) |
| 0.2 | 2.3 | GO:1900028 | negative regulation of ruffle assembly(GO:1900028) |
| 0.2 | 4.7 | GO:0071294 | cellular response to zinc ion(GO:0071294) |
| 0.2 | 3.0 | GO:0072321 | chaperone-mediated protein transport(GO:0072321) |
| 0.2 | 5.8 | GO:0048025 | negative regulation of mRNA splicing, via spliceosome(GO:0048025) |
| 0.2 | 0.8 | GO:0006808 | regulation of nitrogen utilization(GO:0006808) nitrogen utilization(GO:0019740) negative regulation of cellular pH reduction(GO:0032848) CD8-positive, alpha-beta T cell lineage commitment(GO:0043375) negative regulation of retinal cell programmed cell death(GO:0046671) |
| 0.2 | 3.6 | GO:0035518 | histone H2A monoubiquitination(GO:0035518) |
| 0.2 | 0.9 | GO:0045647 | negative regulation of erythrocyte differentiation(GO:0045647) |
| 0.2 | 2.4 | GO:0006449 | regulation of translational termination(GO:0006449) |
| 0.2 | 0.7 | GO:0071802 | negative regulation of podosome assembly(GO:0071802) |
| 0.2 | 24.1 | GO:0006614 | SRP-dependent cotranslational protein targeting to membrane(GO:0006614) |
| 0.2 | 2.5 | GO:0009312 | oligosaccharide biosynthetic process(GO:0009312) |
| 0.2 | 4.0 | GO:0046339 | diacylglycerol metabolic process(GO:0046339) |
| 0.2 | 2.1 | GO:0006048 | UDP-N-acetylglucosamine biosynthetic process(GO:0006048) |
| 0.2 | 0.2 | GO:1902896 | terminal web assembly(GO:1902896) |
| 0.2 | 7.5 | GO:0045839 | negative regulation of mitotic nuclear division(GO:0045839) |
| 0.2 | 1.4 | GO:1901673 | regulation of mitotic spindle assembly(GO:1901673) |
| 0.2 | 3.1 | GO:0090110 | cargo loading into COPII-coated vesicle(GO:0090110) |
| 0.2 | 2.5 | GO:0036109 | alpha-linolenic acid metabolic process(GO:0036109) |
| 0.1 | 3.0 | GO:0032060 | bleb assembly(GO:0032060) |
| 0.1 | 2.6 | GO:0030277 | maintenance of gastrointestinal epithelium(GO:0030277) |
| 0.1 | 2.2 | GO:0007191 | adenylate cyclase-activating dopamine receptor signaling pathway(GO:0007191) |
| 0.1 | 8.3 | GO:0071349 | interleukin-12-mediated signaling pathway(GO:0035722) cellular response to interleukin-12(GO:0071349) |
| 0.1 | 1.0 | GO:0048664 | neuron fate determination(GO:0048664) |
| 0.1 | 4.6 | GO:0071526 | semaphorin-plexin signaling pathway(GO:0071526) |
| 0.1 | 6.7 | GO:0060999 | positive regulation of dendritic spine development(GO:0060999) |
| 0.1 | 2.2 | GO:2000311 | regulation of alpha-amino-3-hydroxy-5-methyl-4-isoxazole propionate selective glutamate receptor activity(GO:2000311) |
| 0.1 | 3.9 | GO:0034453 | microtubule anchoring(GO:0034453) |
| 0.1 | 6.8 | GO:0006383 | transcription from RNA polymerase III promoter(GO:0006383) |
| 0.1 | 0.8 | GO:0030578 | PML body organization(GO:0030578) |
| 0.1 | 1.4 | GO:1904714 | regulation of chaperone-mediated autophagy(GO:1904714) |
| 0.1 | 5.3 | GO:0006656 | phosphatidylcholine biosynthetic process(GO:0006656) |
| 0.1 | 1.5 | GO:0070307 | lens fiber cell development(GO:0070307) |
| 0.1 | 1.0 | GO:0035542 | regulation of SNARE complex assembly(GO:0035542) |
| 0.1 | 1.7 | GO:0015937 | coenzyme A biosynthetic process(GO:0015937) |
| 0.1 | 8.7 | GO:0002223 | stimulatory C-type lectin receptor signaling pathway(GO:0002223) |
| 0.1 | 13.4 | GO:0035335 | peptidyl-tyrosine dephosphorylation(GO:0035335) |
| 0.1 | 1.1 | GO:0034724 | DNA replication-independent nucleosome assembly(GO:0006336) DNA replication-independent nucleosome organization(GO:0034724) |
| 0.1 | 5.1 | GO:0050885 | neuromuscular process controlling balance(GO:0050885) |
| 0.1 | 1.6 | GO:0051014 | actin filament severing(GO:0051014) |
| 0.1 | 1.3 | GO:0050930 | induction of positive chemotaxis(GO:0050930) |
| 0.1 | 1.1 | GO:0003376 | sphingosine-1-phosphate signaling pathway(GO:0003376) sphingolipid mediated signaling pathway(GO:0090520) |
| 0.1 | 0.3 | GO:0042045 | epithelial fluid transport(GO:0042045) |
| 0.1 | 0.6 | GO:0007256 | activation of JNKK activity(GO:0007256) |
| 0.1 | 5.8 | GO:0006120 | mitochondrial electron transport, NADH to ubiquinone(GO:0006120) |
| 0.1 | 2.7 | GO:0032469 | endoplasmic reticulum calcium ion homeostasis(GO:0032469) |
| 0.1 | 0.7 | GO:0015074 | DNA integration(GO:0015074) |
| 0.1 | 1.3 | GO:0070389 | chaperone cofactor-dependent protein refolding(GO:0070389) |
| 0.1 | 1.3 | GO:0007498 | mesoderm development(GO:0007498) |
| 0.1 | 0.3 | GO:0090298 | late nucleophagy(GO:0044805) cellular response to morphine(GO:0071315) cellular response to isoquinoline alkaloid(GO:0071317) negative regulation of mitochondrial DNA replication(GO:0090298) negative regulation of mitochondrial DNA metabolic process(GO:1901859) single-organism membrane invagination(GO:1902534) |
| 0.1 | 1.1 | GO:0043517 | positive regulation of DNA damage response, signal transduction by p53 class mediator(GO:0043517) |
| 0.1 | 6.6 | GO:0006695 | cholesterol biosynthetic process(GO:0006695) |
| 0.1 | 1.5 | GO:1902894 | negative regulation of pri-miRNA transcription from RNA polymerase II promoter(GO:1902894) |
| 0.1 | 1.8 | GO:0019216 | regulation of lipid metabolic process(GO:0019216) |
| 0.1 | 1.7 | GO:0032012 | regulation of ARF protein signal transduction(GO:0032012) |
| 0.1 | 5.5 | GO:0007062 | sister chromatid cohesion(GO:0007062) |
| 0.1 | 1.1 | GO:1900273 | positive regulation of long-term synaptic potentiation(GO:1900273) |
| 0.1 | 0.6 | GO:0071550 | death-inducing signaling complex assembly(GO:0071550) |
| 0.1 | 1.9 | GO:1902547 | regulation of vascular endothelial growth factor signaling pathway(GO:1900746) regulation of cellular response to vascular endothelial growth factor stimulus(GO:1902547) |
| 0.1 | 2.8 | GO:0032508 | DNA duplex unwinding(GO:0032508) |
| 0.1 | 2.6 | GO:1903959 | regulation of anion transmembrane transport(GO:1903959) |
| 0.1 | 0.4 | GO:0048846 | axon extension involved in axon guidance(GO:0048846) neuron projection extension involved in neuron projection guidance(GO:1902284) |
| 0.1 | 3.6 | GO:0001895 | retina homeostasis(GO:0001895) |
| 0.1 | 0.8 | GO:0061001 | regulation of dendritic spine morphogenesis(GO:0061001) |
| 0.1 | 0.6 | GO:0071431 | tRNA export from nucleus(GO:0006409) tRNA transport(GO:0051031) tRNA-containing ribonucleoprotein complex export from nucleus(GO:0071431) |
| 0.1 | 3.3 | GO:0045071 | negative regulation of viral genome replication(GO:0045071) |
| 0.1 | 1.8 | GO:0031581 | hemidesmosome assembly(GO:0031581) |
| 0.1 | 2.4 | GO:0043525 | positive regulation of neuron apoptotic process(GO:0043525) |
| 0.1 | 2.3 | GO:0006739 | NADP metabolic process(GO:0006739) |
| 0.1 | 4.0 | GO:0006910 | phagocytosis, recognition(GO:0006910) |
| 0.1 | 3.4 | GO:0050684 | regulation of mRNA processing(GO:0050684) |
| 0.1 | 0.5 | GO:0031297 | replication fork processing(GO:0031297) |
| 0.1 | 0.9 | GO:0032098 | regulation of appetite(GO:0032098) |
| 0.0 | 0.6 | GO:0031146 | SCF-dependent proteasomal ubiquitin-dependent protein catabolic process(GO:0031146) |
| 0.0 | 0.6 | GO:0070584 | mitochondrion morphogenesis(GO:0070584) |
| 0.0 | 1.6 | GO:0048286 | lung alveolus development(GO:0048286) |
| 0.0 | 1.8 | GO:0031397 | negative regulation of protein ubiquitination(GO:0031397) |
| 0.0 | 5.2 | GO:1901796 | regulation of signal transduction by p53 class mediator(GO:1901796) |
| 0.0 | 9.8 | GO:0016042 | lipid catabolic process(GO:0016042) |
| 0.0 | 0.9 | GO:0033198 | response to ATP(GO:0033198) |
| 0.0 | 2.6 | GO:0055088 | lipid homeostasis(GO:0055088) |
| 0.0 | 0.5 | GO:0010867 | positive regulation of triglyceride biosynthetic process(GO:0010867) |
| 0.0 | 0.4 | GO:0019800 | peptide cross-linking via chondroitin 4-sulfate glycosaminoglycan(GO:0019800) |
| 0.0 | 0.2 | GO:0072383 | plus-end-directed vesicle transport along microtubule(GO:0072383) |
| 0.0 | 0.3 | GO:0050909 | sensory perception of taste(GO:0050909) |
| 0.0 | 0.5 | GO:0003094 | glomerular filtration(GO:0003094) |
| 0.0 | 3.3 | GO:0038095 | Fc-epsilon receptor signaling pathway(GO:0038095) |
| 0.0 | 0.8 | GO:0038083 | peptidyl-tyrosine autophosphorylation(GO:0038083) |
| 0.0 | 0.9 | GO:0051932 | synaptic transmission, GABAergic(GO:0051932) |
| 0.0 | 1.5 | GO:0000245 | spliceosomal complex assembly(GO:0000245) |
| 0.0 | 3.2 | GO:0001837 | epithelial to mesenchymal transition(GO:0001837) |
| 0.0 | 0.7 | GO:0050714 | positive regulation of protein secretion(GO:0050714) |
| 0.0 | 0.4 | GO:0051272 | positive regulation of cellular component movement(GO:0051272) |
| 0.0 | 1.4 | GO:0042035 | regulation of cytokine biosynthetic process(GO:0042035) |
| 0.0 | 2.7 | GO:0006413 | translational initiation(GO:0006413) |
| 0.0 | 0.2 | GO:0006505 | GPI anchor metabolic process(GO:0006505) GPI anchor biosynthetic process(GO:0006506) |
| 0.0 | 0.2 | GO:1902230 | negative regulation of intrinsic apoptotic signaling pathway in response to DNA damage(GO:1902230) |
| 0.0 | 0.9 | GO:0061337 | cardiac conduction(GO:0061337) |
| 0.0 | 9.7 | GO:0006396 | RNA processing(GO:0006396) |
| 0.0 | 1.5 | GO:0006414 | translational elongation(GO:0006414) |
| 0.0 | 0.2 | GO:0007171 | activation of transmembrane receptor protein tyrosine kinase activity(GO:0007171) |
| 0.0 | 0.2 | GO:0018298 | protein-chromophore linkage(GO:0018298) |
| 0.0 | 0.1 | GO:0007175 | negative regulation of epidermal growth factor-activated receptor activity(GO:0007175) |
| 0.0 | 0.0 | GO:0043490 | malate-aspartate shuttle(GO:0043490) |
| 0.0 | 0.1 | GO:0086024 | adrenergic receptor signaling pathway involved in positive regulation of heart rate(GO:0086024) |
Gene overrepresentation in cellular_component category:
| Log-likelihood per target | Total log-likelihood | Term | Description |
|---|---|---|---|
| 6.1 | 36.9 | GO:0008537 | proteasome activator complex(GO:0008537) |
| 5.8 | 29.1 | GO:0017102 | methionyl glutamyl tRNA synthetase complex(GO:0017102) |
| 3.0 | 17.8 | GO:0098560 | cytoplasmic side of late endosome membrane(GO:0098560) |
| 2.6 | 7.8 | GO:0097447 | dendritic tree(GO:0097447) |
| 2.5 | 10.0 | GO:0032301 | MutSalpha complex(GO:0032301) |
| 2.3 | 11.6 | GO:0034688 | integrin alphaM-beta2 complex(GO:0034688) |
| 2.2 | 22.0 | GO:0030015 | CCR4-NOT core complex(GO:0030015) |
| 2.1 | 8.3 | GO:0002189 | ribose phosphate diphosphokinase complex(GO:0002189) |
| 2.1 | 20.7 | GO:0045254 | pyruvate dehydrogenase complex(GO:0045254) |
| 2.0 | 14.0 | GO:0061700 | GATOR2 complex(GO:0061700) |
| 2.0 | 11.7 | GO:0005784 | Sec61 translocon complex(GO:0005784) translocon complex(GO:0071256) |
| 2.0 | 7.8 | GO:0034751 | aryl hydrocarbon receptor complex(GO:0034751) |
| 1.8 | 18.4 | GO:0000506 | glycosylphosphatidylinositol-N-acetylglucosaminyltransferase (GPI-GnT) complex(GO:0000506) |
| 1.8 | 5.5 | GO:0005850 | eukaryotic translation initiation factor 2 complex(GO:0005850) |
| 1.7 | 17.4 | GO:0097255 | R2TP complex(GO:0097255) |
| 1.7 | 7.0 | GO:1990031 | pinceau fiber(GO:1990031) |
| 1.7 | 5.0 | GO:0010009 | cytoplasmic side of endosome membrane(GO:0010009) cytoplasmic side of early endosome membrane(GO:0098559) |
| 1.6 | 6.5 | GO:0001405 | presequence translocase-associated import motor(GO:0001405) |
| 1.5 | 26.4 | GO:0005736 | DNA-directed RNA polymerase I complex(GO:0005736) |
| 1.4 | 4.2 | GO:0031262 | Ndc80 complex(GO:0031262) |
| 1.2 | 11.2 | GO:0005827 | polar microtubule(GO:0005827) |
| 1.2 | 3.7 | GO:0034991 | nuclear meiotic cohesin complex(GO:0034991) |
| 1.1 | 3.3 | GO:0031523 | Myb complex(GO:0031523) |
| 1.1 | 7.7 | GO:0000347 | THO complex(GO:0000347) THO complex part of transcription export complex(GO:0000445) |
| 1.0 | 13.3 | GO:0008385 | IkappaB kinase complex(GO:0008385) |
| 0.9 | 2.8 | GO:0031372 | UBC13-MMS2 complex(GO:0031372) |
| 0.9 | 5.5 | GO:0031390 | Ctf18 RFC-like complex(GO:0031390) |
| 0.9 | 11.5 | GO:0000815 | ESCRT III complex(GO:0000815) |
| 0.9 | 7.9 | GO:0016600 | flotillin complex(GO:0016600) |
| 0.8 | 4.9 | GO:0071817 | MMXD complex(GO:0071817) |
| 0.8 | 10.4 | GO:0005664 | origin recognition complex(GO:0000808) nuclear origin of replication recognition complex(GO:0005664) MCM complex(GO:0042555) |
| 0.8 | 8.5 | GO:0005666 | DNA-directed RNA polymerase III complex(GO:0005666) |
| 0.8 | 9.8 | GO:0097136 | Bcl-2 family protein complex(GO:0097136) |
| 0.8 | 14.4 | GO:0008540 | proteasome regulatory particle, base subcomplex(GO:0008540) |
| 0.8 | 37.7 | GO:0008180 | COP9 signalosome(GO:0008180) |
| 0.7 | 5.2 | GO:0071203 | WASH complex(GO:0071203) |
| 0.7 | 5.9 | GO:0042382 | paraspeckles(GO:0042382) |
| 0.7 | 14.1 | GO:0005885 | Arp2/3 protein complex(GO:0005885) |
| 0.7 | 3.6 | GO:0032021 | NELF complex(GO:0032021) |
| 0.7 | 62.7 | GO:1904724 | tertiary granule lumen(GO:1904724) |
| 0.7 | 4.9 | GO:0016272 | prefoldin complex(GO:0016272) |
| 0.7 | 12.3 | GO:0034709 | methylosome(GO:0034709) |
| 0.6 | 5.8 | GO:0061574 | ASAP complex(GO:0061574) |
| 0.6 | 3.9 | GO:0070545 | PeBoW complex(GO:0070545) |
| 0.6 | 3.2 | GO:0030688 | preribosome, small subunit precursor(GO:0030688) |
| 0.6 | 1.9 | GO:0071159 | NF-kappaB complex(GO:0071159) |
| 0.6 | 7.0 | GO:0010494 | cytoplasmic stress granule(GO:0010494) |
| 0.6 | 8.9 | GO:0042405 | nuclear inclusion body(GO:0042405) |
| 0.6 | 1.7 | GO:0034750 | Scrib-APC-beta-catenin complex(GO:0034750) |
| 0.6 | 10.0 | GO:0012510 | trans-Golgi network transport vesicle membrane(GO:0012510) |
| 0.6 | 11.0 | GO:0001891 | phagocytic cup(GO:0001891) |
| 0.5 | 2.1 | GO:0000214 | tRNA-intron endonuclease complex(GO:0000214) |
| 0.5 | 14.3 | GO:0005680 | anaphase-promoting complex(GO:0005680) |
| 0.5 | 1.8 | GO:0045257 | mitochondrial respiratory chain complex II, succinate dehydrogenase complex (ubiquinone)(GO:0005749) succinate dehydrogenase complex (ubiquinone)(GO:0045257) respiratory chain complex II(GO:0045273) succinate dehydrogenase complex(GO:0045281) fumarate reductase complex(GO:0045283) |
| 0.4 | 4.0 | GO:0005638 | lamin filament(GO:0005638) |
| 0.4 | 6.6 | GO:0005686 | U2 snRNP(GO:0005686) |
| 0.4 | 66.6 | GO:0101002 | ficolin-1-rich granule(GO:0101002) ficolin-1-rich granule lumen(GO:1904813) |
| 0.4 | 10.6 | GO:0016514 | SWI/SNF complex(GO:0016514) |
| 0.4 | 7.5 | GO:0005665 | DNA-directed RNA polymerase II, core complex(GO:0005665) |
| 0.4 | 20.9 | GO:0042645 | nucleoid(GO:0009295) mitochondrial nucleoid(GO:0042645) |
| 0.4 | 2.6 | GO:0097165 | nuclear stress granule(GO:0097165) |
| 0.4 | 1.9 | GO:0020018 | ciliary pocket(GO:0020016) ciliary pocket membrane(GO:0020018) |
| 0.4 | 3.0 | GO:0042719 | mitochondrial intermembrane space protein transporter complex(GO:0042719) |
| 0.4 | 8.8 | GO:0042627 | chylomicron(GO:0042627) |
| 0.3 | 3.1 | GO:0030868 | smooth endoplasmic reticulum membrane(GO:0030868) smooth endoplasmic reticulum part(GO:0097425) |
| 0.3 | 4.8 | GO:0090543 | Flemming body(GO:0090543) |
| 0.3 | 3.4 | GO:0030126 | COPI vesicle coat(GO:0030126) |
| 0.3 | 2.4 | GO:0045171 | intercellular bridge(GO:0045171) |
| 0.3 | 3.2 | GO:0044613 | nuclear pore central transport channel(GO:0044613) |
| 0.3 | 2.1 | GO:0000813 | ESCRT I complex(GO:0000813) |
| 0.3 | 4.8 | GO:0001931 | uropod(GO:0001931) cell trailing edge(GO:0031254) |
| 0.3 | 3.5 | GO:0008250 | oligosaccharyltransferase complex(GO:0008250) |
| 0.3 | 2.6 | GO:0097470 | ribbon synapse(GO:0097470) |
| 0.3 | 6.7 | GO:0032156 | septin cytoskeleton(GO:0032156) |
| 0.3 | 1.2 | GO:0031166 | integral component of vacuolar membrane(GO:0031166) |
| 0.3 | 16.6 | GO:0000307 | cyclin-dependent protein kinase holoenzyme complex(GO:0000307) |
| 0.3 | 2.0 | GO:0019815 | B cell receptor complex(GO:0019815) |
| 0.3 | 7.1 | GO:0002080 | acrosomal membrane(GO:0002080) |
| 0.3 | 5.9 | GO:0031528 | microvillus membrane(GO:0031528) |
| 0.3 | 1.5 | GO:0005682 | U5 snRNP(GO:0005682) |
| 0.2 | 3.0 | GO:0035631 | CD40 receptor complex(GO:0035631) |
| 0.2 | 4.7 | GO:0005639 | integral component of nuclear inner membrane(GO:0005639) intrinsic component of nuclear inner membrane(GO:0031229) nuclear membrane part(GO:0044453) |
| 0.2 | 8.2 | GO:0005640 | nuclear outer membrane(GO:0005640) |
| 0.2 | 17.7 | GO:0022627 | cytosolic small ribosomal subunit(GO:0022627) |
| 0.2 | 4.4 | GO:0098576 | lumenal side of membrane(GO:0098576) |
| 0.2 | 4.2 | GO:0005862 | muscle thin filament tropomyosin(GO:0005862) |
| 0.2 | 1.3 | GO:0097025 | MPP7-DLG1-LIN7 complex(GO:0097025) |
| 0.2 | 1.9 | GO:0005955 | calcineurin complex(GO:0005955) |
| 0.2 | 26.8 | GO:0016605 | PML body(GO:0016605) |
| 0.2 | 32.6 | GO:0042470 | melanosome(GO:0042470) pigment granule(GO:0048770) |
| 0.2 | 5.5 | GO:0005721 | pericentric heterochromatin(GO:0005721) |
| 0.2 | 4.2 | GO:0042613 | MHC class II protein complex(GO:0042613) |
| 0.2 | 5.9 | GO:0035580 | specific granule lumen(GO:0035580) |
| 0.2 | 1.5 | GO:0071144 | SMAD2-SMAD3 protein complex(GO:0071144) |
| 0.2 | 1.9 | GO:0016602 | CCAAT-binding factor complex(GO:0016602) |
| 0.2 | 0.5 | GO:0071595 | Nem1-Spo7 phosphatase complex(GO:0071595) |
| 0.2 | 23.1 | GO:0005903 | brush border(GO:0005903) |
| 0.2 | 4.9 | GO:0032040 | small-subunit processome(GO:0032040) |
| 0.2 | 3.4 | GO:0030992 | intraciliary transport particle B(GO:0030992) |
| 0.2 | 5.2 | GO:0005844 | polysome(GO:0005844) |
| 0.2 | 3.0 | GO:0071437 | invadopodium(GO:0071437) |
| 0.1 | 1.9 | GO:0017146 | NMDA selective glutamate receptor complex(GO:0017146) |
| 0.1 | 15.6 | GO:0022625 | cytosolic large ribosomal subunit(GO:0022625) |
| 0.1 | 1.3 | GO:0002199 | zona pellucida receptor complex(GO:0002199) |
| 0.1 | 4.3 | GO:0033017 | sarcoplasmic reticulum membrane(GO:0033017) |
| 0.1 | 2.1 | GO:0031616 | spindle pole centrosome(GO:0031616) |
| 0.1 | 12.5 | GO:0071013 | catalytic step 2 spliceosome(GO:0071013) |
| 0.1 | 0.7 | GO:0031597 | cytosolic proteasome complex(GO:0031597) |
| 0.1 | 9.7 | GO:0031594 | neuromuscular junction(GO:0031594) |
| 0.1 | 8.3 | GO:0005905 | clathrin-coated pit(GO:0005905) |
| 0.1 | 2.0 | GO:0030127 | COPII vesicle coat(GO:0030127) |
| 0.1 | 16.9 | GO:0031234 | extrinsic component of cytoplasmic side of plasma membrane(GO:0031234) |
| 0.1 | 4.5 | GO:0032993 | protein-DNA complex(GO:0032993) |
| 0.1 | 5.8 | GO:0005747 | mitochondrial respiratory chain complex I(GO:0005747) NADH dehydrogenase complex(GO:0030964) respiratory chain complex I(GO:0045271) |
| 0.1 | 10.5 | GO:0005840 | ribosome(GO:0005840) |
| 0.1 | 2.8 | GO:0090545 | NuRD complex(GO:0016581) CHD-type complex(GO:0090545) |
| 0.1 | 9.7 | GO:0035579 | specific granule membrane(GO:0035579) |
| 0.1 | 5.4 | GO:0055038 | recycling endosome membrane(GO:0055038) |
| 0.1 | 1.5 | GO:0070971 | endoplasmic reticulum exit site(GO:0070971) |
| 0.1 | 5.4 | GO:0005811 | lipid particle(GO:0005811) |
| 0.1 | 0.7 | GO:0033588 | Elongator holoenzyme complex(GO:0033588) |
| 0.1 | 4.0 | GO:0019814 | immunoglobulin complex(GO:0019814) immunoglobulin complex, circulating(GO:0042571) |
| 0.1 | 1.9 | GO:0046658 | anchored component of plasma membrane(GO:0046658) |
| 0.1 | 6.7 | GO:0000777 | condensed chromosome kinetochore(GO:0000777) |
| 0.1 | 9.3 | GO:0072562 | blood microparticle(GO:0072562) |
| 0.1 | 0.8 | GO:0046930 | pore complex(GO:0046930) |
| 0.1 | 3.1 | GO:0000502 | proteasome complex(GO:0000502) |
| 0.1 | 3.6 | GO:0032592 | integral component of mitochondrial membrane(GO:0032592) |
| 0.1 | 3.8 | GO:0000775 | chromosome, centromeric region(GO:0000775) |
| 0.1 | 0.4 | GO:0005610 | laminin-5 complex(GO:0005610) |
| 0.1 | 2.9 | GO:0001725 | stress fiber(GO:0001725) contractile actin filament bundle(GO:0097517) |
| 0.1 | 2.6 | GO:0000118 | histone deacetylase complex(GO:0000118) |
| 0.0 | 0.8 | GO:0000178 | exosome (RNase complex)(GO:0000178) |
| 0.0 | 16.1 | GO:0005759 | mitochondrial matrix(GO:0005759) |
| 0.0 | 3.9 | GO:0000932 | cytoplasmic mRNA processing body(GO:0000932) |
| 0.0 | 2.1 | GO:0031463 | Cul3-RING ubiquitin ligase complex(GO:0031463) |
| 0.0 | 0.1 | GO:0030891 | VCB complex(GO:0030891) |
| 0.0 | 2.1 | GO:0009898 | cytoplasmic side of plasma membrane(GO:0009898) |
| 0.0 | 0.3 | GO:0031464 | Cul4A-RING E3 ubiquitin ligase complex(GO:0031464) |
| 0.0 | 3.4 | GO:0005793 | endoplasmic reticulum-Golgi intermediate compartment(GO:0005793) |
| 0.0 | 0.9 | GO:0000791 | euchromatin(GO:0000791) |
| 0.0 | 3.0 | GO:0005681 | spliceosomal complex(GO:0005681) |
| 0.0 | 1.5 | GO:0031201 | SNARE complex(GO:0031201) |
| 0.0 | 0.5 | GO:0009925 | basal plasma membrane(GO:0009925) |
| 0.0 | 0.9 | GO:0035577 | azurophil granule membrane(GO:0035577) |
| 0.0 | 1.8 | GO:0005643 | nuclear pore(GO:0005643) |
| 0.0 | 0.7 | GO:0002102 | podosome(GO:0002102) |
| 0.0 | 7.2 | GO:0005769 | early endosome(GO:0005769) |
| 0.0 | 0.6 | GO:0031264 | death-inducing signaling complex(GO:0031264) |
| 0.0 | 1.9 | GO:0016363 | nuclear matrix(GO:0016363) |
| 0.0 | 3.5 | GO:0030027 | lamellipodium(GO:0030027) |
| 0.0 | 47.8 | GO:0005654 | nucleoplasm(GO:0005654) |
| 0.0 | 1.3 | GO:0005882 | intermediate filament(GO:0005882) |
| 0.0 | 0.2 | GO:0033270 | paranode region of axon(GO:0033270) |
| 0.0 | 1.3 | GO:0031225 | anchored component of membrane(GO:0031225) |
| 0.0 | 0.3 | GO:0019005 | SCF ubiquitin ligase complex(GO:0019005) |
| 0.0 | 0.2 | GO:0097381 | photoreceptor disc membrane(GO:0097381) |
Gene overrepresentation in molecular_function category:
| Log-likelihood per target | Total log-likelihood | Term | Description |
|---|---|---|---|
| 6.4 | 32.0 | GO:0047179 | platelet-activating factor acetyltransferase activity(GO:0047179) |
| 5.3 | 36.9 | GO:0061133 | endopeptidase activator activity(GO:0061133) |
| 3.8 | 11.3 | GO:0004822 | isoleucine-tRNA ligase activity(GO:0004822) |
| 3.7 | 15.0 | GO:0003938 | IMP dehydrogenase activity(GO:0003938) |
| 3.7 | 14.8 | GO:0004739 | pyruvate dehydrogenase (acetyl-transferring) activity(GO:0004739) |
| 3.5 | 10.6 | GO:0004766 | spermidine synthase activity(GO:0004766) |
| 3.3 | 13.4 | GO:0004727 | prenylated protein tyrosine phosphatase activity(GO:0004727) |
| 3.0 | 33.5 | GO:0004332 | fructose-bisphosphate aldolase activity(GO:0004332) |
| 3.0 | 24.2 | GO:0008379 | thioredoxin peroxidase activity(GO:0008379) |
| 2.6 | 7.8 | GO:0032551 | pyrimidine nucleoside binding(GO:0001884) UTP binding(GO:0002134) sulfonylurea receptor binding(GO:0017098) pyrimidine ribonucleoside binding(GO:0032551) |
| 2.5 | 10.0 | GO:0032143 | single thymine insertion binding(GO:0032143) |
| 2.4 | 16.7 | GO:0050815 | phosphoserine binding(GO:0050815) |
| 2.3 | 7.0 | GO:0017130 | poly(C) RNA binding(GO:0017130) |
| 2.3 | 16.3 | GO:0061575 | cyclin-dependent protein serine/threonine kinase activator activity(GO:0061575) |
| 2.3 | 16.0 | GO:0004849 | uridine kinase activity(GO:0004849) |
| 2.1 | 8.3 | GO:0034186 | apolipoprotein A-I binding(GO:0034186) |
| 2.1 | 12.3 | GO:0044020 | histone methyltransferase activity (H4-R3 specific)(GO:0044020) |
| 2.0 | 10.2 | GO:0047844 | deoxycytidine deaminase activity(GO:0047844) |
| 1.9 | 5.8 | GO:0016603 | glutaminyl-peptide cyclotransferase activity(GO:0016603) |
| 1.8 | 18.4 | GO:0017176 | phosphatidylinositol N-acetylglucosaminyltransferase activity(GO:0017176) |
| 1.7 | 10.4 | GO:0019238 | cyclohydrolase activity(GO:0019238) |
| 1.7 | 6.8 | GO:0031208 | POZ domain binding(GO:0031208) |
| 1.7 | 6.8 | GO:0004335 | galactokinase activity(GO:0004335) |
| 1.7 | 11.6 | GO:0030369 | ICAM-3 receptor activity(GO:0030369) |
| 1.6 | 33.9 | GO:0001055 | RNA polymerase II activity(GO:0001055) |
| 1.6 | 9.5 | GO:0016802 | adenosylhomocysteinase activity(GO:0004013) trialkylsulfonium hydrolase activity(GO:0016802) |
| 1.6 | 4.7 | GO:0004694 | eukaryotic translation initiation factor 2alpha kinase activity(GO:0004694) |
| 1.5 | 9.2 | GO:0004614 | phosphoglucomutase activity(GO:0004614) |
| 1.5 | 5.9 | GO:0004738 | pyruvate dehydrogenase activity(GO:0004738) pyruvate dehydrogenase [NAD(P)+] activity(GO:0034603) pyruvate dehydrogenase (NAD+) activity(GO:0034604) |
| 1.5 | 4.4 | GO:0003858 | 3-hydroxybutyrate dehydrogenase activity(GO:0003858) |
| 1.4 | 5.6 | GO:0004966 | galanin receptor activity(GO:0004966) |
| 1.4 | 8.3 | GO:0004749 | ribose phosphate diphosphokinase activity(GO:0004749) |
| 1.4 | 4.1 | GO:0008476 | protein-tyrosine sulfotransferase activity(GO:0008476) |
| 1.3 | 7.8 | GO:0102338 | fatty acid elongase activity(GO:0009922) 3-oxo-arachidoyl-CoA synthase activity(GO:0102336) 3-oxo-cerotoyl-CoA synthase activity(GO:0102337) 3-oxo-lignoceronyl-CoA synthase activity(GO:0102338) |
| 1.3 | 15.2 | GO:0005131 | growth hormone receptor binding(GO:0005131) |
| 1.3 | 3.8 | GO:0035529 | NADH pyrophosphatase activity(GO:0035529) |
| 1.2 | 8.7 | GO:0004457 | lactate dehydrogenase activity(GO:0004457) L-lactate dehydrogenase activity(GO:0004459) |
| 1.2 | 22.0 | GO:0004535 | poly(A)-specific ribonuclease activity(GO:0004535) |
| 1.2 | 9.5 | GO:0060228 | phosphatidylcholine-sterol O-acyltransferase activator activity(GO:0060228) |
| 1.2 | 5.9 | GO:0070404 | NADH binding(GO:0070404) |
| 1.1 | 1.1 | GO:0004813 | alanine-tRNA ligase activity(GO:0004813) |
| 1.1 | 5.3 | GO:0017159 | pantetheine hydrolase activity(GO:0017159) |
| 1.0 | 4.9 | GO:0034046 | poly(G) binding(GO:0034046) |
| 1.0 | 3.9 | GO:0015181 | arginine transmembrane transporter activity(GO:0015181) |
| 1.0 | 17.1 | GO:0045505 | dynein intermediate chain binding(GO:0045505) |
| 0.9 | 4.7 | GO:0016509 | long-chain-3-hydroxyacyl-CoA dehydrogenase activity(GO:0016509) |
| 0.9 | 3.7 | GO:0036033 | mediator complex binding(GO:0036033) |
| 0.9 | 5.5 | GO:0003886 | DNA (cytosine-5-)-methyltransferase activity(GO:0003886) |
| 0.9 | 16.8 | GO:0009931 | calcium-dependent protein serine/threonine kinase activity(GO:0009931) |
| 0.9 | 5.3 | GO:0070739 | protein-glutamic acid ligase activity(GO:0070739) |
| 0.9 | 1.8 | GO:0008469 | histone-arginine N-methyltransferase activity(GO:0008469) protein-arginine omega-N asymmetric methyltransferase activity(GO:0035242) |
| 0.8 | 5.1 | GO:0008240 | tripeptidyl-peptidase activity(GO:0008240) |
| 0.8 | 5.9 | GO:0004046 | aminoacylase activity(GO:0004046) |
| 0.8 | 12.6 | GO:0035612 | AP-2 adaptor complex binding(GO:0035612) |
| 0.8 | 2.5 | GO:0016401 | palmitoyl-CoA oxidase activity(GO:0016401) |
| 0.7 | 12.5 | GO:0003688 | DNA replication origin binding(GO:0003688) |
| 0.7 | 32.7 | GO:0050699 | WW domain binding(GO:0050699) |
| 0.7 | 2.1 | GO:0000213 | tRNA-intron endonuclease activity(GO:0000213) |
| 0.7 | 5.6 | GO:0004873 | asialoglycoprotein receptor activity(GO:0004873) |
| 0.7 | 7.0 | GO:0019206 | nucleoside kinase activity(GO:0019206) |
| 0.7 | 4.2 | GO:0003998 | acylphosphatase activity(GO:0003998) |
| 0.7 | 2.1 | GO:0102007 | lactonohydrolase activity(GO:0046573) acyl-L-homoserine-lactone lactonohydrolase activity(GO:0102007) |
| 0.7 | 2.6 | GO:0030197 | extracellular matrix constituent, lubricant activity(GO:0030197) |
| 0.7 | 7.8 | GO:0000774 | adenyl-nucleotide exchange factor activity(GO:0000774) |
| 0.6 | 30.5 | GO:0000049 | tRNA binding(GO:0000049) |
| 0.6 | 1.9 | GO:0043423 | 3-phosphoinositide-dependent protein kinase binding(GO:0043423) |
| 0.6 | 2.5 | GO:0030107 | HLA-A specific inhibitory MHC class I receptor activity(GO:0030107) |
| 0.6 | 6.0 | GO:0070053 | thrombospondin receptor activity(GO:0070053) |
| 0.6 | 1.8 | GO:0008177 | succinate dehydrogenase (ubiquinone) activity(GO:0008177) |
| 0.6 | 6.0 | GO:0005094 | Rho GDP-dissociation inhibitor activity(GO:0005094) |
| 0.6 | 2.4 | GO:0008384 | IkappaB kinase activity(GO:0008384) |
| 0.6 | 27.8 | GO:0031492 | nucleosomal DNA binding(GO:0031492) |
| 0.6 | 4.0 | GO:0005353 | fructose transmembrane transporter activity(GO:0005353) |
| 0.6 | 6.2 | GO:0051434 | BH3 domain binding(GO:0051434) |
| 0.6 | 2.3 | GO:0003960 | NADPH:quinone reductase activity(GO:0003960) |
| 0.6 | 1.7 | GO:0000253 | 3-keto sterol reductase activity(GO:0000253) |
| 0.5 | 16.4 | GO:0042288 | MHC class I protein binding(GO:0042288) |
| 0.5 | 10.8 | GO:0070628 | proteasome binding(GO:0070628) |
| 0.5 | 0.5 | GO:0097371 | MDM2/MDM4 family protein binding(GO:0097371) |
| 0.5 | 2.6 | GO:0008174 | mRNA methyltransferase activity(GO:0008174) |
| 0.5 | 9.0 | GO:0030235 | nitric-oxide synthase regulator activity(GO:0030235) |
| 0.5 | 5.6 | GO:0001135 | transcription factor activity, RNA polymerase II transcription factor recruiting(GO:0001135) |
| 0.5 | 6.1 | GO:0001056 | RNA polymerase III activity(GO:0001056) |
| 0.5 | 11.5 | GO:0031210 | phosphatidylcholine binding(GO:0031210) |
| 0.5 | 1.5 | GO:0033149 | FFAT motif binding(GO:0033149) |
| 0.5 | 3.5 | GO:0003689 | DNA clamp loader activity(GO:0003689) protein-DNA loading ATPase activity(GO:0033170) |
| 0.5 | 7.4 | GO:0008649 | rRNA methyltransferase activity(GO:0008649) |
| 0.5 | 4.4 | GO:0051400 | BH domain binding(GO:0051400) |
| 0.5 | 2.4 | GO:0043023 | ribosomal large subunit binding(GO:0043023) |
| 0.5 | 2.8 | GO:0052655 | branched-chain-amino-acid transaminase activity(GO:0004084) L-leucine transaminase activity(GO:0052654) L-valine transaminase activity(GO:0052655) L-isoleucine transaminase activity(GO:0052656) |
| 0.5 | 3.7 | GO:0015165 | pyrimidine nucleotide-sugar transmembrane transporter activity(GO:0015165) |
| 0.5 | 5.4 | GO:0032027 | myosin light chain binding(GO:0032027) |
| 0.4 | 1.3 | GO:0003854 | 3-beta-hydroxy-delta5-steroid dehydrogenase activity(GO:0003854) |
| 0.4 | 2.7 | GO:0004169 | dolichyl-phosphate-mannose-protein mannosyltransferase activity(GO:0004169) |
| 0.4 | 2.6 | GO:0008266 | poly(U) RNA binding(GO:0008266) |
| 0.4 | 2.4 | GO:0008079 | translation release factor activity(GO:0003747) translation termination factor activity(GO:0008079) |
| 0.4 | 1.1 | GO:0035500 | MH2 domain binding(GO:0035500) |
| 0.4 | 2.6 | GO:0030267 | hydroxypyruvate reductase activity(GO:0016618) glyoxylate reductase (NADP) activity(GO:0030267) |
| 0.4 | 3.3 | GO:0015288 | porin activity(GO:0015288) |
| 0.4 | 1.5 | GO:0008518 | reduced folate carrier activity(GO:0008518) methotrexate transporter activity(GO:0015350) |
| 0.4 | 2.9 | GO:0005176 | ErbB-2 class receptor binding(GO:0005176) |
| 0.4 | 10.6 | GO:0005528 | macrolide binding(GO:0005527) FK506 binding(GO:0005528) |
| 0.4 | 1.8 | GO:0060961 | phospholipase D inhibitor activity(GO:0060961) |
| 0.4 | 3.5 | GO:0004579 | dolichyl-diphosphooligosaccharide-protein glycotransferase activity(GO:0004579) |
| 0.3 | 5.8 | GO:0043274 | phospholipase binding(GO:0043274) |
| 0.3 | 3.1 | GO:1990381 | ubiquitin-specific protease binding(GO:1990381) |
| 0.3 | 3.3 | GO:0001730 | 2'-5'-oligoadenylate synthetase activity(GO:0001730) |
| 0.3 | 2.2 | GO:0001165 | RNA polymerase I upstream control element sequence-specific DNA binding(GO:0001165) |
| 0.3 | 4.8 | GO:0031996 | thioesterase binding(GO:0031996) |
| 0.3 | 0.9 | GO:0098770 | FBXO family protein binding(GO:0098770) |
| 0.3 | 0.9 | GO:0051022 | GDP-dissociation inhibitor binding(GO:0051021) Rho GDP-dissociation inhibitor binding(GO:0051022) |
| 0.3 | 1.8 | GO:0003857 | 3-hydroxyacyl-CoA dehydrogenase activity(GO:0003857) |
| 0.3 | 4.2 | GO:0032395 | MHC class II receptor activity(GO:0032395) |
| 0.3 | 5.4 | GO:0004707 | MAP kinase activity(GO:0004707) |
| 0.3 | 18.7 | GO:0016836 | hydro-lyase activity(GO:0016836) |
| 0.3 | 3.3 | GO:0035381 | extracellular ATP-gated cation channel activity(GO:0004931) ATP-gated ion channel activity(GO:0035381) |
| 0.3 | 18.0 | GO:0001784 | phosphotyrosine binding(GO:0001784) |
| 0.3 | 1.2 | GO:0004803 | transposase activity(GO:0004803) |
| 0.3 | 10.2 | GO:0017025 | TBP-class protein binding(GO:0017025) |
| 0.3 | 1.5 | GO:0031962 | mineralocorticoid receptor binding(GO:0031962) |
| 0.3 | 1.2 | GO:0015250 | water channel activity(GO:0015250) |
| 0.3 | 6.3 | GO:0031491 | nucleosome binding(GO:0031491) |
| 0.3 | 2.0 | GO:0050321 | tau-protein kinase activity(GO:0050321) |
| 0.3 | 1.9 | GO:0071532 | ankyrin repeat binding(GO:0071532) |
| 0.3 | 17.4 | GO:0016655 | oxidoreductase activity, acting on NAD(P)H, quinone or similar compound as acceptor(GO:0016655) |
| 0.3 | 28.4 | GO:0004867 | serine-type endopeptidase inhibitor activity(GO:0004867) |
| 0.3 | 9.0 | GO:0043027 | cysteine-type endopeptidase inhibitor activity involved in apoptotic process(GO:0043027) |
| 0.2 | 1.7 | GO:0004652 | polynucleotide adenylyltransferase activity(GO:0004652) |
| 0.2 | 2.4 | GO:0003910 | DNA ligase (ATP) activity(GO:0003910) |
| 0.2 | 2.1 | GO:0019706 | protein-cysteine S-palmitoyltransferase activity(GO:0019706) protein-cysteine S-acyltransferase activity(GO:0019707) |
| 0.2 | 4.0 | GO:0004143 | diacylglycerol kinase activity(GO:0004143) |
| 0.2 | 0.9 | GO:0005412 | glucose:sodium symporter activity(GO:0005412) |
| 0.2 | 27.2 | GO:0004725 | protein tyrosine phosphatase activity(GO:0004725) |
| 0.2 | 1.1 | GO:0070402 | NADPH binding(GO:0070402) |
| 0.2 | 10.1 | GO:0005547 | phosphatidylinositol-3,4,5-trisphosphate binding(GO:0005547) |
| 0.2 | 5.4 | GO:0051019 | mitogen-activated protein kinase binding(GO:0051019) |
| 0.2 | 1.7 | GO:0046703 | natural killer cell lectin-like receptor binding(GO:0046703) |
| 0.2 | 2.1 | GO:0070569 | uridylyltransferase activity(GO:0070569) |
| 0.2 | 5.7 | GO:0008143 | poly(A) binding(GO:0008143) |
| 0.2 | 1.0 | GO:0004771 | sterol esterase activity(GO:0004771) |
| 0.2 | 4.2 | GO:0030331 | estrogen receptor binding(GO:0030331) |
| 0.2 | 2.4 | GO:0008494 | translation activator activity(GO:0008494) |
| 0.2 | 2.8 | GO:0048027 | mRNA 5'-UTR binding(GO:0048027) |
| 0.2 | 3.6 | GO:0017166 | vinculin binding(GO:0017166) |
| 0.2 | 1.9 | GO:0033192 | calmodulin-dependent protein phosphatase activity(GO:0033192) |
| 0.2 | 4.5 | GO:0016628 | oxidoreductase activity, acting on the CH-CH group of donors, NAD or NADP as acceptor(GO:0016628) |
| 0.2 | 7.0 | GO:0004003 | ATP-dependent DNA helicase activity(GO:0004003) |
| 0.2 | 3.0 | GO:0031698 | beta-2 adrenergic receptor binding(GO:0031698) |
| 0.2 | 4.3 | GO:0004033 | aldo-keto reductase (NADP) activity(GO:0004033) |
| 0.2 | 0.7 | GO:0043559 | insulin binding(GO:0043559) |
| 0.2 | 39.5 | GO:0051015 | actin filament binding(GO:0051015) |
| 0.2 | 3.3 | GO:0005385 | zinc ion transmembrane transporter activity(GO:0005385) |
| 0.2 | 4.6 | GO:0030159 | receptor signaling complex scaffold activity(GO:0030159) |
| 0.2 | 1.6 | GO:0036042 | long-chain fatty acyl-CoA binding(GO:0036042) |
| 0.2 | 3.1 | GO:0000339 | RNA cap binding(GO:0000339) |
| 0.2 | 4.3 | GO:0015631 | tubulin binding(GO:0015631) |
| 0.2 | 4.3 | GO:0015269 | calcium-activated potassium channel activity(GO:0015269) |
| 0.2 | 2.2 | GO:0003680 | AT DNA binding(GO:0003680) |
| 0.2 | 19.5 | GO:0051082 | unfolded protein binding(GO:0051082) |
| 0.2 | 2.9 | GO:0097602 | cullin family protein binding(GO:0097602) |
| 0.1 | 0.6 | GO:0004706 | JUN kinase kinase kinase activity(GO:0004706) |
| 0.1 | 1.8 | GO:0098847 | sequence-specific single stranded DNA binding(GO:0098847) |
| 0.1 | 1.9 | GO:0004985 | opioid receptor activity(GO:0004985) |
| 0.1 | 31.3 | GO:0003735 | structural constituent of ribosome(GO:0003735) |
| 0.1 | 2.4 | GO:0034062 | DNA-directed RNA polymerase activity(GO:0003899) RNA polymerase activity(GO:0034062) |
| 0.1 | 10.4 | GO:0000980 | RNA polymerase II distal enhancer sequence-specific DNA binding(GO:0000980) |
| 0.1 | 3.3 | GO:0005388 | calcium-transporting ATPase activity(GO:0005388) |
| 0.1 | 7.8 | GO:0003727 | single-stranded RNA binding(GO:0003727) |
| 0.1 | 6.9 | GO:0008028 | monocarboxylic acid transmembrane transporter activity(GO:0008028) |
| 0.1 | 1.3 | GO:0097016 | L27 domain binding(GO:0097016) |
| 0.1 | 1.9 | GO:0008349 | MAP kinase kinase kinase kinase activity(GO:0008349) |
| 0.1 | 0.6 | GO:0070513 | death domain binding(GO:0070513) |
| 0.1 | 1.1 | GO:0038036 | sphingosine-1-phosphate receptor activity(GO:0038036) |
| 0.1 | 5.1 | GO:0030145 | manganese ion binding(GO:0030145) |
| 0.1 | 1.5 | GO:0070182 | DNA polymerase binding(GO:0070182) |
| 0.1 | 1.5 | GO:0005212 | structural constituent of eye lens(GO:0005212) |
| 0.1 | 5.5 | GO:0003730 | mRNA 3'-UTR binding(GO:0003730) |
| 0.1 | 2.6 | GO:0001103 | RNA polymerase II repressing transcription factor binding(GO:0001103) |
| 0.1 | 4.8 | GO:0003725 | double-stranded RNA binding(GO:0003725) |
| 0.1 | 0.7 | GO:0030274 | LIM domain binding(GO:0030274) |
| 0.1 | 1.6 | GO:0042609 | CD4 receptor binding(GO:0042609) |
| 0.1 | 4.0 | GO:0034987 | immunoglobulin receptor binding(GO:0034987) |
| 0.1 | 1.5 | GO:0003746 | translation elongation factor activity(GO:0003746) |
| 0.1 | 25.2 | GO:0003713 | transcription coactivator activity(GO:0003713) |
| 0.1 | 0.8 | GO:0004645 | phosphorylase activity(GO:0004645) |
| 0.1 | 0.2 | GO:0051377 | mannose-ethanolamine phosphotransferase activity(GO:0051377) |
| 0.1 | 1.7 | GO:0005086 | ARF guanyl-nucleotide exchange factor activity(GO:0005086) |
| 0.1 | 3.2 | GO:0003743 | translation initiation factor activity(GO:0003743) |
| 0.1 | 1.8 | GO:0005518 | collagen binding(GO:0005518) |
| 0.1 | 2.8 | GO:0061631 | ubiquitin conjugating enzyme activity(GO:0061631) |
| 0.1 | 4.2 | GO:0008289 | lipid binding(GO:0008289) |
| 0.1 | 7.6 | GO:0003729 | mRNA binding(GO:0003729) poly(A) RNA binding(GO:0044822) |
| 0.1 | 1.8 | GO:0005035 | tumor necrosis factor-activated receptor activity(GO:0005031) death receptor activity(GO:0005035) |
| 0.1 | 3.1 | GO:0004693 | cyclin-dependent protein serine/threonine kinase activity(GO:0004693) |
| 0.1 | 1.5 | GO:0030506 | ankyrin binding(GO:0030506) |
| 0.1 | 1.3 | GO:0017056 | structural constituent of nuclear pore(GO:0017056) |
| 0.1 | 1.7 | GO:0004385 | guanylate kinase activity(GO:0004385) |
| 0.0 | 2.5 | GO:0004715 | non-membrane spanning protein tyrosine kinase activity(GO:0004715) |
| 0.0 | 16.6 | GO:0001228 | transcriptional activator activity, RNA polymerase II transcription regulatory region sequence-specific binding(GO:0001228) |
| 0.0 | 0.7 | GO:0043548 | phosphatidylinositol 3-kinase binding(GO:0043548) |
| 0.0 | 2.7 | GO:0048365 | Rac GTPase binding(GO:0048365) |
| 0.0 | 7.1 | GO:0003823 | antigen binding(GO:0003823) |
| 0.0 | 0.3 | GO:0004839 | ubiquitin activating enzyme activity(GO:0004839) |
| 0.0 | 2.2 | GO:0005544 | calcium-dependent phospholipid binding(GO:0005544) |
| 0.0 | 6.0 | GO:0042393 | histone binding(GO:0042393) |
| 0.0 | 0.2 | GO:0030297 | transmembrane receptor protein tyrosine kinase activator activity(GO:0030297) |
| 0.0 | 1.0 | GO:0016814 | hydrolase activity, acting on carbon-nitrogen (but not peptide) bonds, in cyclic amidines(GO:0016814) |
| 0.0 | 1.5 | GO:0016811 | hydrolase activity, acting on carbon-nitrogen (but not peptide) bonds, in linear amides(GO:0016811) |
| 0.0 | 0.5 | GO:0016857 | racemase and epimerase activity, acting on carbohydrates and derivatives(GO:0016857) |
| 0.0 | 2.5 | GO:0004252 | serine-type endopeptidase activity(GO:0004252) |
| 0.0 | 1.5 | GO:0031490 | chromatin DNA binding(GO:0031490) |
| 0.0 | 1.0 | GO:0043015 | gamma-tubulin binding(GO:0043015) |
| 0.0 | 0.8 | GO:0046875 | ephrin receptor binding(GO:0046875) |
| 0.0 | 0.8 | GO:0035035 | histone acetyltransferase binding(GO:0035035) |
| 0.0 | 0.8 | GO:0005024 | transforming growth factor beta-activated receptor activity(GO:0005024) |
| 0.0 | 0.9 | GO:0003887 | DNA-directed DNA polymerase activity(GO:0003887) |
| 0.0 | 0.3 | GO:0042043 | neurexin family protein binding(GO:0042043) |
| 0.0 | 0.9 | GO:0097200 | cysteine-type endopeptidase activity involved in execution phase of apoptosis(GO:0097200) |
| 0.0 | 1.5 | GO:0005484 | SNAP receptor activity(GO:0005484) |
| 0.0 | 0.4 | GO:0005328 | neurotransmitter:sodium symporter activity(GO:0005328) |
| 0.0 | 0.3 | GO:0051879 | Hsp90 protein binding(GO:0051879) |
| 0.0 | 3.7 | GO:0017124 | SH3 domain binding(GO:0017124) |
| 0.0 | 1.7 | GO:0048306 | calcium-dependent protein binding(GO:0048306) |
| 0.0 | 0.3 | GO:0004017 | adenylate kinase activity(GO:0004017) |
| 0.0 | 0.3 | GO:0015280 | ligand-gated sodium channel activity(GO:0015280) |
| 0.0 | 0.9 | GO:0005184 | neuropeptide hormone activity(GO:0005184) |
| 0.0 | 2.3 | GO:0004386 | helicase activity(GO:0004386) |
| 0.0 | 0.4 | GO:0017154 | semaphorin receptor activity(GO:0017154) |
| 0.0 | 2.1 | GO:0043130 | ubiquitin binding(GO:0043130) |
| 0.0 | 0.8 | GO:0005109 | frizzled binding(GO:0005109) |
| 0.0 | 1.7 | GO:0019003 | GDP binding(GO:0019003) |
| 0.0 | 0.7 | GO:0003785 | actin monomer binding(GO:0003785) |
| 0.0 | 0.1 | GO:0052629 | phosphatidylinositol-3,5-bisphosphate 5-phosphatase activity(GO:0043813) phosphatidylinositol-3,5-bisphosphate 3-phosphatase activity(GO:0052629) |
| 0.0 | 0.2 | GO:0008020 | G-protein coupled photoreceptor activity(GO:0008020) |
| 0.0 | 0.3 | GO:0050811 | GABA receptor binding(GO:0050811) |
| 0.0 | 0.5 | GO:0019903 | protein phosphatase binding(GO:0019903) |
| 0.0 | 0.5 | GO:0016620 | oxidoreductase activity, acting on the aldehyde or oxo group of donors, NAD or NADP as acceptor(GO:0016620) |
| 0.0 | 0.7 | GO:0016831 | carboxy-lyase activity(GO:0016831) |
| 0.0 | 1.4 | GO:0004553 | hydrolase activity, hydrolyzing O-glycosyl compounds(GO:0004553) |
| 0.0 | 0.2 | GO:0071889 | 14-3-3 protein binding(GO:0071889) |
| 0.0 | 2.8 | GO:0003682 | chromatin binding(GO:0003682) |
| 0.0 | 1.1 | GO:0005200 | structural constituent of cytoskeleton(GO:0005200) |
| 0.0 | 1.2 | GO:0008565 | protein transporter activity(GO:0008565) |
Gene overrepresentation in C2:CP category:
| Log-likelihood per target | Total log-likelihood | Term | Description |
|---|---|---|---|
| 1.9 | 27.2 | SA G2 AND M PHASES | Cdc25 activates the cdc2/cyclin B complex to induce the G2/M transition. |
| 1.5 | 15.2 | ST IL 13 PATHWAY | Interleukin 13 (IL-13) Pathway |
| 0.7 | 32.9 | PID LIS1 PATHWAY | Lissencephaly gene (LIS1) in neuronal migration and development |
| 0.7 | 79.5 | PID HIF1 TFPATHWAY | HIF-1-alpha transcription factor network |
| 0.6 | 2.5 | ST PHOSPHOINOSITIDE 3 KINASE PATHWAY | PI3K Pathway |
| 0.6 | 53.1 | PID ATF2 PATHWAY | ATF-2 transcription factor network |
| 0.6 | 30.0 | ST ERK1 ERK2 MAPK PATHWAY | ERK1/ERK2 MAPK Pathway |
| 0.6 | 33.2 | PID ATR PATHWAY | ATR signaling pathway |
| 0.5 | 25.8 | PID FOXM1 PATHWAY | FOXM1 transcription factor network |
| 0.5 | 13.4 | PID PRL SIGNALING EVENTS PATHWAY | Signaling events mediated by PRL |
| 0.5 | 32.7 | PID HNF3A PATHWAY | FOXA1 transcription factor network |
| 0.5 | 8.5 | PID P38 GAMMA DELTA PATHWAY | Signaling mediated by p38-gamma and p38-delta |
| 0.4 | 25.6 | PID TAP63 PATHWAY | Validated transcriptional targets of TAp63 isoforms |
| 0.4 | 1.1 | PID S1P S1P4 PATHWAY | S1P4 pathway |
| 0.3 | 5.9 | PID CIRCADIAN PATHWAY | Circadian rhythm pathway |
| 0.3 | 23.9 | PID RAC1 PATHWAY | RAC1 signaling pathway |
| 0.3 | 8.4 | PID P38 ALPHA BETA PATHWAY | Regulation of p38-alpha and p38-beta |
| 0.2 | 16.2 | PID ERA GENOMIC PATHWAY | Validated nuclear estrogen receptor alpha network |
| 0.2 | 3.9 | PID NFKAPPAB ATYPICAL PATHWAY | Atypical NF-kappaB pathway |
| 0.2 | 7.3 | PID EPO PATHWAY | EPO signaling pathway |
| 0.2 | 6.0 | PID INTEGRIN3 PATHWAY | Beta3 integrin cell surface interactions |
| 0.2 | 11.2 | PID INTEGRIN A4B1 PATHWAY | Alpha4 beta1 integrin signaling events |
| 0.2 | 16.5 | ST FAS SIGNALING PATHWAY | Fas Signaling Pathway |
| 0.2 | 10.2 | PID E2F PATHWAY | E2F transcription factor network |
| 0.2 | 5.0 | PID AURORA A PATHWAY | Aurora A signaling |
| 0.2 | 17.2 | PID SMAD2 3NUCLEAR PATHWAY | Regulation of nuclear SMAD2/3 signaling |
| 0.2 | 8.2 | PID ILK PATHWAY | Integrin-linked kinase signaling |
| 0.2 | 14.5 | PID MYC ACTIV PATHWAY | Validated targets of C-MYC transcriptional activation |
| 0.2 | 5.2 | PID FOXO PATHWAY | FoxO family signaling |
| 0.1 | 2.5 | PID TCR JNK PATHWAY | JNK signaling in the CD4+ TCR pathway |
| 0.1 | 6.1 | PID HNF3B PATHWAY | FOXA2 and FOXA3 transcription factor networks |
| 0.1 | 2.2 | PID LPA4 PATHWAY | LPA4-mediated signaling events |
| 0.1 | 7.1 | PID SYNDECAN 1 PATHWAY | Syndecan-1-mediated signaling events |
| 0.1 | 15.9 | PID P53 DOWNSTREAM PATHWAY | Direct p53 effectors |
| 0.1 | 2.4 | PID IL6 7 PATHWAY | IL6-mediated signaling events |
| 0.1 | 6.7 | PID RB 1PATHWAY | Regulation of retinoblastoma protein |
| 0.1 | 2.9 | PID ERBB NETWORK PATHWAY | ErbB receptor signaling network |
| 0.1 | 0.7 | PID REELIN PATHWAY | Reelin signaling pathway |
| 0.1 | 6.2 | PID CMYB PATHWAY | C-MYB transcription factor network |
| 0.1 | 3.4 | PID INTEGRIN2 PATHWAY | Beta2 integrin cell surface interactions |
| 0.1 | 4.0 | PID P73PATHWAY | p73 transcription factor network |
| 0.1 | 2.0 | PID ALK1 PATHWAY | ALK1 signaling events |
| 0.1 | 4.6 | PID CASPASE PATHWAY | Caspase cascade in apoptosis |
| 0.1 | 2.8 | PID VEGFR1 2 PATHWAY | Signaling events mediated by VEGFR1 and VEGFR2 |
| 0.1 | 1.2 | PID ER NONGENOMIC PATHWAY | Plasma membrane estrogen receptor signaling |
| 0.1 | 2.0 | PID ARF6 PATHWAY | Arf6 signaling events |
| 0.0 | 1.0 | NABA BASEMENT MEMBRANES | Genes encoding structural components of basement membranes |
| 0.0 | 0.8 | PID WNT SIGNALING PATHWAY | Wnt signaling network |
| 0.0 | 0.9 | PID BCR 5PATHWAY | BCR signaling pathway |
| 0.0 | 0.3 | ST DIFFERENTIATION PATHWAY IN PC12 CELLS | Differentiation Pathway in PC12 Cells; this is a specific case of PAC1 Receptor Pathway. |
| 0.0 | 0.6 | PID P53 REGULATION PATHWAY | p53 pathway |
| 0.0 | 1.5 | PID PDGFRB PATHWAY | PDGFR-beta signaling pathway |
| 0.0 | 0.9 | PID TCR PATHWAY | TCR signaling in naïve CD4+ T cells |
| 0.0 | 0.9 | PID HDAC CLASSI PATHWAY | Signaling events mediated by HDAC Class I |
| 0.0 | 0.6 | WNT SIGNALING | Genes related to Wnt-mediated signal transduction |
Gene overrepresentation in C2:CP:REACTOME category:
| Log-likelihood per target | Total log-likelihood | Term | Description |
|---|---|---|---|
| 1.8 | 44.5 | REACTOME ACTIVATION OF BH3 ONLY PROTEINS | Genes involved in Activation of BH3-only proteins |
| 1.4 | 33.9 | REACTOME VIRAL MESSENGER RNA SYNTHESIS | Genes involved in Viral Messenger RNA Synthesis |
| 1.2 | 29.6 | REACTOME METABOLISM OF POLYAMINES | Genes involved in Metabolism of polyamines |
| 1.1 | 5.4 | REACTOME BINDING AND ENTRY OF HIV VIRION | Genes involved in Binding and entry of HIV virion |
| 1.0 | 28.8 | REACTOME PYRUVATE METABOLISM | Genes involved in Pyruvate metabolism |
| 1.0 | 27.2 | REACTOME CYCLIN A B1 ASSOCIATED EVENTS DURING G2 M TRANSITION | Genes involved in Cyclin A/B1 associated events during G2/M transition |
| 0.9 | 15.0 | REACTOME PURINE RIBONUCLEOSIDE MONOPHOSPHATE BIOSYNTHESIS | Genes involved in Purine ribonucleoside monophosphate biosynthesis |
| 0.8 | 15.2 | REACTOME IL 6 SIGNALING | Genes involved in Interleukin-6 signaling |
| 0.8 | 30.2 | REACTOME CYTOSOLIC TRNA AMINOACYLATION | Genes involved in Cytosolic tRNA aminoacylation |
| 0.8 | 16.5 | REACTOME TETRAHYDROBIOPTERIN BH4 SYNTHESIS RECYCLING SALVAGE AND REGULATION | Genes involved in Tetrahydrobiopterin (BH4) synthesis, recycling, salvage and regulation |
| 0.8 | 15.7 | REACTOME ELONGATION ARREST AND RECOVERY | Genes involved in Elongation arrest and recovery |
| 0.8 | 67.6 | REACTOME SCFSKP2 MEDIATED DEGRADATION OF P27 P21 | Genes involved in SCF(Skp2)-mediated degradation of p27/p21 |
| 0.7 | 16.2 | REACTOME ORC1 REMOVAL FROM CHROMATIN | Genes involved in Orc1 removal from chromatin |
| 0.7 | 14.3 | REACTOME PHOSPHORYLATION OF THE APC C | Genes involved in Phosphorylation of the APC/C |
| 0.6 | 11.3 | REACTOME TRNA AMINOACYLATION | Genes involved in tRNA Aminoacylation |
| 0.6 | 21.4 | REACTOME DEADENYLATION OF MRNA | Genes involved in Deadenylation of mRNA |
| 0.6 | 17.2 | REACTOME INTRINSIC PATHWAY FOR APOPTOSIS | Genes involved in Intrinsic Pathway for Apoptosis |
| 0.6 | 28.8 | REACTOME GLYCOLYSIS | Genes involved in Glycolysis |
| 0.5 | 12.5 | REACTOME SYNTHESIS OF GLYCOSYLPHOSPHATIDYLINOSITOL GPI | Genes involved in Synthesis of glycosylphosphatidylinositol (GPI) |
| 0.5 | 10.3 | REACTOME ALPHA LINOLENIC ACID ALA METABOLISM | Genes involved in alpha-linolenic acid (ALA) metabolism |
| 0.5 | 5.9 | REACTOME PURINE CATABOLISM | Genes involved in Purine catabolism |
| 0.5 | 22.7 | REACTOME DOWNREGULATION OF SMAD2 3 SMAD4 TRANSCRIPTIONAL ACTIVITY | Genes involved in Downregulation of SMAD2/3:SMAD4 transcriptional activity |
| 0.5 | 6.1 | REACTOME RNA POL III CHAIN ELONGATION | Genes involved in RNA Polymerase III Chain Elongation |
| 0.5 | 3.3 | REACTOME G0 AND EARLY G1 | Genes involved in G0 and Early G1 |
| 0.5 | 7.6 | REACTOME REGULATION OF IFNG SIGNALING | Genes involved in Regulation of IFNG signaling |
| 0.4 | 15.9 | REACTOME NEP NS2 INTERACTS WITH THE CELLULAR EXPORT MACHINERY | Genes involved in NEP/NS2 Interacts with the Cellular Export Machinery |
| 0.4 | 7.8 | REACTOME THE NLRP3 INFLAMMASOME | Genes involved in The NLRP3 inflammasome |
| 0.4 | 10.6 | REACTOME REGULATION OF SIGNALING BY CBL | Genes involved in Regulation of signaling by CBL |
| 0.4 | 3.6 | REACTOME P53 INDEPENDENT G1 S DNA DAMAGE CHECKPOINT | Genes involved in p53-Independent G1/S DNA damage checkpoint |
| 0.4 | 4.4 | REACTOME RECRUITMENT OF NUMA TO MITOTIC CENTROSOMES | Genes involved in Recruitment of NuMA to mitotic centrosomes |
| 0.4 | 10.8 | REACTOME SIGNALING BY CONSTITUTIVELY ACTIVE EGFR | Genes involved in Signaling by constitutively active EGFR |
| 0.4 | 11.5 | REACTOME ERK MAPK TARGETS | Genes involved in ERK/MAPK targets |
| 0.4 | 6.5 | REACTOME MITOCHONDRIAL FATTY ACID BETA OXIDATION | Genes involved in Mitochondrial Fatty Acid Beta-Oxidation |
| 0.4 | 7.5 | REACTOME ENDOSOMAL SORTING COMPLEX REQUIRED FOR TRANSPORT ESCRT | Genes involved in Endosomal Sorting Complex Required For Transport (ESCRT) |
| 0.3 | 7.0 | REACTOME GLYCOGEN BREAKDOWN GLYCOGENOLYSIS | Genes involved in Glycogen breakdown (glycogenolysis) |
| 0.3 | 8.3 | REACTOME HDL MEDIATED LIPID TRANSPORT | Genes involved in HDL-mediated lipid transport |
| 0.3 | 7.0 | REACTOME PURINE SALVAGE | Genes involved in Purine salvage |
| 0.3 | 7.9 | REACTOME SIGNAL REGULATORY PROTEIN SIRP FAMILY INTERACTIONS | Genes involved in Signal regulatory protein (SIRP) family interactions |
| 0.3 | 5.9 | REACTOME LAGGING STRAND SYNTHESIS | Genes involved in Lagging Strand Synthesis |
| 0.3 | 21.3 | REACTOME FORMATION OF THE TERNARY COMPLEX AND SUBSEQUENTLY THE 43S COMPLEX | Genes involved in Formation of the ternary complex, and subsequently, the 43S complex |
| 0.3 | 8.9 | REACTOME SYNTHESIS AND INTERCONVERSION OF NUCLEOTIDE DI AND TRIPHOSPHATES | Genes involved in Synthesis and interconversion of nucleotide di- and triphosphates |
| 0.3 | 1.9 | REACTOME NFKB IS ACTIVATED AND SIGNALS SURVIVAL | Genes involved in NF-kB is activated and signals survival |
| 0.3 | 3.3 | REACTOME ELEVATION OF CYTOSOLIC CA2 LEVELS | Genes involved in Elevation of cytosolic Ca2+ levels |
| 0.3 | 27.7 | REACTOME INFLUENZA VIRAL RNA TRANSCRIPTION AND REPLICATION | Genes involved in Influenza Viral RNA Transcription and Replication |
| 0.3 | 7.4 | REACTOME PYRIMIDINE METABOLISM | Genes involved in Pyrimidine metabolism |
| 0.3 | 3.0 | REACTOME DSCAM INTERACTIONS | Genes involved in DSCAM interactions |
| 0.2 | 18.2 | REACTOME APOPTOTIC CLEAVAGE OF CELLULAR PROTEINS | Genes involved in Apoptotic cleavage of cellular proteins |
| 0.2 | 4.0 | REACTOME HOMOLOGOUS RECOMBINATION REPAIR OF REPLICATION INDEPENDENT DOUBLE STRAND BREAKS | Genes involved in Homologous recombination repair of replication-independent double-strand breaks |
| 0.2 | 8.1 | REACTOME MRNA SPLICING MINOR PATHWAY | Genes involved in mRNA Splicing - Minor Pathway |
| 0.2 | 1.4 | REACTOME PEPTIDE CHAIN ELONGATION | Genes involved in Peptide chain elongation |
| 0.2 | 5.8 | REACTOME TRANSPORT OF MATURE TRANSCRIPT TO CYTOPLASM | Genes involved in Transport of Mature Transcript to Cytoplasm |
| 0.2 | 2.9 | REACTOME VITAMIN B5 PANTOTHENATE METABOLISM | Genes involved in Vitamin B5 (pantothenate) metabolism |
| 0.2 | 9.5 | REACTOME REGULATION OF MRNA STABILITY BY PROTEINS THAT BIND AU RICH ELEMENTS | Genes involved in Regulation of mRNA Stability by Proteins that Bind AU-rich Elements |
| 0.2 | 3.3 | REACTOME ZINC TRANSPORTERS | Genes involved in Zinc transporters |
| 0.2 | 3.0 | REACTOME GAMMA CARBOXYLATION TRANSPORT AND AMINO TERMINAL CLEAVAGE OF PROTEINS | Genes involved in Gamma-carboxylation, transport, and amino-terminal cleavage of proteins |
| 0.2 | 2.4 | REACTOME IRAK1 RECRUITS IKK COMPLEX | Genes involved in IRAK1 recruits IKK complex |
| 0.2 | 18.4 | REACTOME INTEGRIN CELL SURFACE INTERACTIONS | Genes involved in Integrin cell surface interactions |
| 0.2 | 24.0 | REACTOME RESPONSE TO ELEVATED PLATELET CYTOSOLIC CA2 | Genes involved in Response to elevated platelet cytosolic Ca2+ |
| 0.2 | 5.8 | REACTOME CHOLESTEROL BIOSYNTHESIS | Genes involved in Cholesterol biosynthesis |
| 0.2 | 2.2 | REACTOME ADENYLATE CYCLASE ACTIVATING PATHWAY | Genes involved in Adenylate cyclase activating pathway |
| 0.2 | 5.3 | REACTOME SULFUR AMINO ACID METABOLISM | Genes involved in Sulfur amino acid metabolism |
| 0.2 | 2.9 | REACTOME SHC1 EVENTS IN ERBB4 SIGNALING | Genes involved in SHC1 events in ERBB4 signaling |
| 0.2 | 6.7 | REACTOME GENERATION OF SECOND MESSENGER MOLECULES | Genes involved in Generation of second messenger molecules |
| 0.2 | 2.2 | REACTOME DCC MEDIATED ATTRACTIVE SIGNALING | Genes involved in DCC mediated attractive signaling |
| 0.1 | 4.8 | REACTOME RECYCLING PATHWAY OF L1 | Genes involved in Recycling pathway of L1 |
| 0.1 | 1.6 | REACTOME DIGESTION OF DIETARY CARBOHYDRATE | Genes involved in Digestion of dietary carbohydrate |
| 0.1 | 1.7 | REACTOME MRNA 3 END PROCESSING | Genes involved in mRNA 3'-end processing |
| 0.1 | 4.7 | REACTOME PREFOLDIN MEDIATED TRANSFER OF SUBSTRATE TO CCT TRIC | Genes involved in Prefoldin mediated transfer of substrate to CCT/TriC |
| 0.1 | 3.1 | REACTOME ANTIGEN PRESENTATION FOLDING ASSEMBLY AND PEPTIDE LOADING OF CLASS I MHC | Genes involved in Antigen Presentation: Folding, assembly and peptide loading of class I MHC |
| 0.1 | 6.2 | REACTOME INTERFERON GAMMA SIGNALING | Genes involved in Interferon gamma signaling |
| 0.1 | 2.5 | REACTOME RNA POL I TRANSCRIPTION TERMINATION | Genes involved in RNA Polymerase I Transcription Termination |
| 0.1 | 7.1 | REACTOME MYD88 MAL CASCADE INITIATED ON PLASMA MEMBRANE | Genes involved in MyD88:Mal cascade initiated on plasma membrane |
| 0.1 | 7.2 | REACTOME ACTIVATION OF CHAPERONE GENES BY XBP1S | Genes involved in Activation of Chaperone Genes by XBP1(S) |
| 0.1 | 2.8 | REACTOME BRANCHED CHAIN AMINO ACID CATABOLISM | Genes involved in Branched-chain amino acid catabolism |
| 0.1 | 16.5 | REACTOME ANTIGEN PROCESSING UBIQUITINATION PROTEASOME DEGRADATION | Genes involved in Antigen processing: Ubiquitination & Proteasome degradation |
| 0.1 | 3.4 | REACTOME DEGRADATION OF THE EXTRACELLULAR MATRIX | Genes involved in Degradation of the extracellular matrix |
| 0.1 | 3.4 | REACTOME MYOGENESIS | Genes involved in Myogenesis |
| 0.1 | 7.6 | REACTOME RESPIRATORY ELECTRON TRANSPORT | Genes involved in Respiratory electron transport |
| 0.1 | 5.4 | REACTOME MRNA SPLICING | Genes involved in mRNA Splicing |
| 0.1 | 6.4 | REACTOME MITOTIC PROMETAPHASE | Genes involved in Mitotic Prometaphase |
| 0.1 | 3.7 | REACTOME TRANSPORT OF VITAMINS NUCLEOSIDES AND RELATED MOLECULES | Genes involved in Transport of vitamins, nucleosides, and related molecules |
| 0.1 | 4.8 | REACTOME DEPOSITION OF NEW CENPA CONTAINING NUCLEOSOMES AT THE CENTROMERE | Genes involved in Deposition of New CENPA-containing Nucleosomes at the Centromere |
| 0.1 | 2.1 | REACTOME METABOLISM OF PORPHYRINS | Genes involved in Metabolism of porphyrins |
| 0.1 | 3.1 | REACTOME AMINO ACID TRANSPORT ACROSS THE PLASMA MEMBRANE | Genes involved in Amino acid transport across the plasma membrane |
| 0.1 | 3.9 | REACTOME TRANSLATION | Genes involved in Translation |
| 0.1 | 1.5 | REACTOME PROTEOLYTIC CLEAVAGE OF SNARE COMPLEX PROTEINS | Genes involved in Proteolytic cleavage of SNARE complex proteins |
| 0.1 | 1.7 | REACTOME GABA SYNTHESIS RELEASE REUPTAKE AND DEGRADATION | Genes involved in GABA synthesis, release, reuptake and degradation |
| 0.1 | 0.8 | REACTOME ASSOCIATION OF TRIC CCT WITH TARGET PROTEINS DURING BIOSYNTHESIS | Genes involved in Association of TriC/CCT with target proteins during biosynthesis |
| 0.0 | 1.3 | REACTOME REGULATION OF COMPLEMENT CASCADE | Genes involved in Regulation of Complement cascade |
| 0.0 | 0.8 | REACTOME METABOLISM OF NON CODING RNA | Genes involved in Metabolism of non-coding RNA |
| 0.0 | 2.6 | REACTOME SMOOTH MUSCLE CONTRACTION | Genes involved in Smooth Muscle Contraction |
| 0.0 | 2.0 | REACTOME DARPP 32 EVENTS | Genes involved in DARPP-32 events |
| 0.0 | 1.8 | REACTOME AMYLOIDS | Genes involved in Amyloids |
| 0.0 | 2.5 | REACTOME MHC CLASS II ANTIGEN PRESENTATION | Genes involved in MHC class II antigen presentation |
| 0.0 | 0.9 | REACTOME FACILITATIVE NA INDEPENDENT GLUCOSE TRANSPORTERS | Genes involved in Facilitative Na+-independent glucose transporters |
| 0.0 | 1.1 | REACTOME G1 PHASE | Genes involved in G1 Phase |
| 0.0 | 1.2 | REACTOME SPHINGOLIPID DE NOVO BIOSYNTHESIS | Genes involved in Sphingolipid de novo biosynthesis |
| 0.0 | 0.6 | REACTOME TGF BETA RECEPTOR SIGNALING IN EMT EPITHELIAL TO MESENCHYMAL TRANSITION | Genes involved in TGF-beta receptor signaling in EMT (epithelial to mesenchymal transition) |
| 0.0 | 2.7 | REACTOME DIABETES PATHWAYS | Genes involved in Diabetes pathways |
| 0.0 | 6.8 | REACTOME METABOLISM OF CARBOHYDRATES | Genes involved in Metabolism of carbohydrates |
| 0.0 | 1.4 | REACTOME VOLTAGE GATED POTASSIUM CHANNELS | Genes involved in Voltage gated Potassium channels |
| 0.0 | 0.6 | REACTOME EXTRINSIC PATHWAY FOR APOPTOSIS | Genes involved in Extrinsic Pathway for Apoptosis |
| 0.0 | 1.5 | REACTOME RECRUITMENT OF MITOTIC CENTROSOME PROTEINS AND COMPLEXES | Genes involved in Recruitment of mitotic centrosome proteins and complexes |
| 0.0 | 0.3 | REACTOME PLATELET CALCIUM HOMEOSTASIS | Genes involved in Platelet calcium homeostasis |
| 0.0 | 0.2 | REACTOME OPSINS | Genes involved in Opsins |
| 0.0 | 0.2 | REACTOME TIE2 SIGNALING | Genes involved in Tie2 Signaling |
| 0.0 | 0.3 | REACTOME IL RECEPTOR SHC SIGNALING | Genes involved in Interleukin receptor SHC signaling |
| 0.0 | 0.5 | REACTOME METABOLISM OF VITAMINS AND COFACTORS | Genes involved in Metabolism of vitamins and cofactors |