Project
GNF SymAtlas + NCI-60 cancer cell lines, comparison of cancers vs non-cancers, human (Su, 2004; Ross, 2000)
Navigation
Downloads
Results for GLIS1
Z-value: 0.94
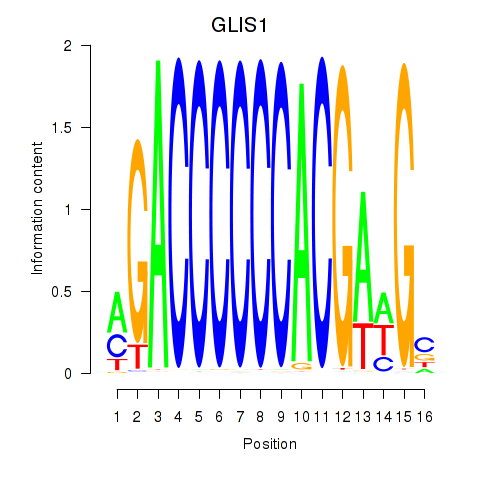
Motif logo
Transcription factors associated with GLIS1
| Gene Symbol | Gene ID | Gene Info |
|---|---|---|
|
GLIS1
|
ENSG00000174332.3 | GLIS family zinc finger 1 |
Activity profile of GLIS1 motif
Sorted Z-values of GLIS1 motif
| Promoter | Log-likelihood | Transcript | Gene | Gene Info |
|---|---|---|---|---|
| chr4_+_190992087 | 5.14 |
ENST00000553598.1
|
DUX4L7
|
double homeobox 4 like 7 |
| chr19_-_49828438 | 4.14 |
ENST00000454748.3
ENST00000598828.1 ENST00000335875.4 |
SLC6A16
|
solute carrier family 6, member 16 |
| chr4_+_191008560 | 3.64 |
ENST00000554690.1
|
DUX4L3
|
double homeobox 4 like 3 |
| chr4_+_190995380 | 3.43 |
ENST00000555191.1
|
DUX4L6
|
double homeobox 4 like 6 |
| chr4_+_191001979 | 3.16 |
ENST00000538692.1
|
DUX4L4
|
double homeobox 4 like 4 |
| chr4_+_191005267 | 3.10 |
ENST00000556625.1
|
DUX4
|
double homeobox 4 |
| chr4_+_191011860 | 3.10 |
ENST00000440426.1
|
DUX4L2
|
double homeobox 4 like 2 |
| chr4_+_190998673 | 3.02 |
ENST00000554668.1
|
DUX4L5
|
double homeobox 4 like 5 |
| chr19_+_40697514 | 2.05 |
ENST00000253055.3
|
MAP3K10
|
mitogen-activated protein kinase kinase kinase 10 |
| chr11_+_66886717 | 1.88 |
ENST00000398645.2
|
KDM2A
|
lysine (K)-specific demethylase 2A |
| chr11_+_68671310 | 1.72 |
ENST00000255078.3
ENST00000539224.1 |
IGHMBP2
|
immunoglobulin mu binding protein 2 |
| chr18_+_11751466 | 1.28 |
ENST00000535121.1
|
GNAL
|
guanine nucleotide binding protein (G protein), alpha activating activity polypeptide, olfactory type |
| chr16_+_58059470 | 0.60 |
ENST00000219271.3
|
MMP15
|
matrix metallopeptidase 15 (membrane-inserted) |
Network of associatons between targets according to the STRING database.

Gene Ontology Analysis
Gene overrepresentation in biological_process category:
| Log-likelihood per target | Total log-likelihood | Term | Description |
|---|---|---|---|
| 0.8 | 3.1 | GO:0070317 | negative regulation of G0 to G1 transition(GO:0070317) |
| 0.3 | 2.1 | GO:0007256 | activation of JNKK activity(GO:0007256) |
| 0.2 | 1.9 | GO:0070544 | histone H3-K36 demethylation(GO:0070544) |
| 0.1 | 4.1 | GO:0003333 | amino acid transmembrane transport(GO:0003333) |
| 0.0 | 0.5 | GO:0007191 | adenylate cyclase-activating dopamine receptor signaling pathway(GO:0007191) |
| 0.0 | 1.7 | GO:0032508 | DNA duplex unwinding(GO:0032508) |
| 0.0 | 0.6 | GO:0035987 | endodermal cell differentiation(GO:0035987) |
Gene overrepresentation in cellular_component category:
| Log-likelihood per target | Total log-likelihood | Term | Description |
|---|---|---|---|
| 0.2 | 1.7 | GO:0032797 | SMN complex(GO:0032797) |
Gene overrepresentation in molecular_function category:
| Log-likelihood per target | Total log-likelihood | Term | Description |
|---|---|---|---|
| 0.5 | 2.1 | GO:0004706 | JUN kinase kinase kinase activity(GO:0004706) |
| 0.3 | 1.7 | GO:0043141 | ATP-dependent 5'-3' DNA helicase activity(GO:0043141) |
| 0.2 | 1.9 | GO:0051864 | histone demethylase activity (H3-K36 specific)(GO:0051864) |
| 0.2 | 4.1 | GO:0005328 | neurotransmitter:sodium symporter activity(GO:0005328) |
| 0.0 | 0.6 | GO:0070006 | metalloaminopeptidase activity(GO:0070006) |
| 0.0 | 0.5 | GO:0031683 | G-protein beta/gamma-subunit complex binding(GO:0031683) |
Gene overrepresentation in C2:CP category:
| Log-likelihood per target | Total log-likelihood | Term | Description |
|---|---|---|---|
| 0.1 | 2.1 | PID P38 MKK3 6PATHWAY | p38 MAPK signaling pathway |
| 0.0 | 0.5 | PID LPA4 PATHWAY | LPA4-mediated signaling events |
Gene overrepresentation in C2:CP:REACTOME category:
| Log-likelihood per target | Total log-likelihood | Term | Description |
|---|---|---|---|
| 0.0 | 0.5 | REACTOME ADENYLATE CYCLASE ACTIVATING PATHWAY | Genes involved in Adenylate cyclase activating pathway |
| 0.0 | 0.6 | REACTOME DEGRADATION OF THE EXTRACELLULAR MATRIX | Genes involved in Degradation of the extracellular matrix |