Project
GNF SymAtlas + NCI-60 cancer cell lines, comparison of cancers vs non-cancers, human (Su, 2004; Ross, 2000)
Navigation
Downloads
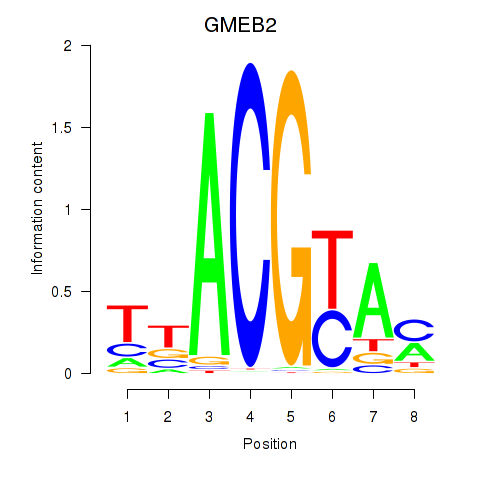
Results for GMEB2
Z-value: 1.40
Motif logo
Transcription factors associated with GMEB2
| Gene Symbol | Gene ID | Gene Info |
|---|---|---|
|
GMEB2
|
ENSG00000101216.6 | glucocorticoid modulatory element binding protein 2 |
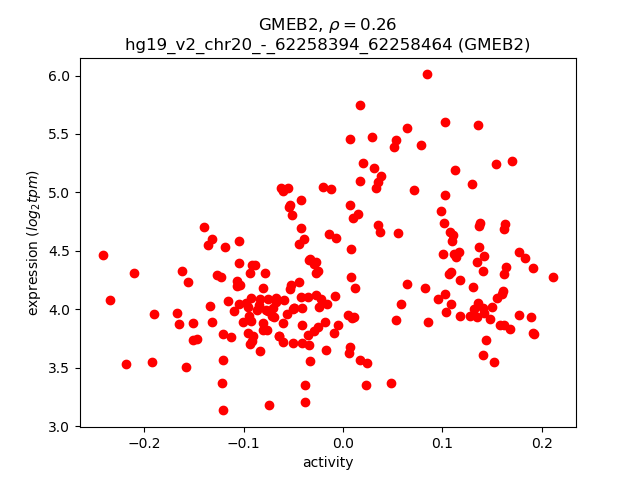
Activity-expression correlation:
| Gene | Promoter | Pearson corr. coef. | P-value | Plot |
|---|---|---|---|---|
| GMEB2 | hg19_v2_chr20_-_62258394_62258464 | 0.26 | 1.1e-04 | Click! |
Activity profile of GMEB2 motif
Sorted Z-values of GMEB2 motif
| Promoter | Log-likelihood | Transcript | Gene | Gene Info |
|---|---|---|---|---|
| chr15_+_78833071 | 84.57 |
ENST00000559365.1
|
PSMA4
|
proteasome (prosome, macropain) subunit, alpha type, 4 |
| chr3_-_195808980 | 77.86 |
ENST00000360110.4
|
TFRC
|
transferrin receptor |
| chrX_-_149106653 | 75.35 |
ENST00000462691.1
ENST00000370404.1 ENST00000483447.1 ENST00000370409.3 |
CXorf40B
|
chromosome X open reading frame 40B |
| chr15_+_78832747 | 73.45 |
ENST00000560217.1
ENST00000044462.7 ENST00000559082.1 ENST00000559948.1 ENST00000413382.2 ENST00000559146.1 ENST00000558281.1 |
PSMA4
|
proteasome (prosome, macropain) subunit, alpha type, 4 |
| chr8_-_80942139 | 67.33 |
ENST00000521434.1
ENST00000519120.1 ENST00000520946.1 |
MRPS28
|
mitochondrial ribosomal protein S28 |
| chr5_-_68665084 | 65.86 |
ENST00000509462.1
|
TAF9
|
TAF9 RNA polymerase II, TATA box binding protein (TBP)-associated factor, 32kDa |
| chr15_+_78833105 | 62.68 |
ENST00000558341.1
ENST00000559437.1 |
PSMA4
|
proteasome (prosome, macropain) subunit, alpha type, 4 |
| chr7_+_26240776 | 61.93 |
ENST00000337620.4
|
CBX3
|
chromobox homolog 3 |
| chr5_-_68665296 | 60.13 |
ENST00000512152.1
ENST00000503245.1 ENST00000512561.1 ENST00000380822.4 |
TAF9
|
TAF9 RNA polymerase II, TATA box binding protein (TBP)-associated factor, 32kDa |
| chr8_-_80942061 | 59.71 |
ENST00000519386.1
|
MRPS28
|
mitochondrial ribosomal protein S28 |
| chr8_-_80942467 | 59.02 |
ENST00000518271.1
ENST00000276585.4 ENST00000521605.1 |
MRPS28
|
mitochondrial ribosomal protein S28 |
| chr11_-_65667884 | 55.55 |
ENST00000448083.2
ENST00000531493.1 ENST00000532401.1 |
FOSL1
|
FOS-like antigen 1 |
| chr11_-_65667997 | 55.46 |
ENST00000312562.2
ENST00000534222.1 |
FOSL1
|
FOS-like antigen 1 |
| chr7_+_66386204 | 54.21 |
ENST00000341567.4
ENST00000607045.1 |
TMEM248
|
transmembrane protein 248 |
| chr13_+_48611665 | 52.61 |
ENST00000258662.2
|
NUDT15
|
nudix (nucleoside diphosphate linked moiety X)-type motif 15 |
| chr5_-_68665469 | 52.05 |
ENST00000217893.5
|
TAF9
|
TAF9 RNA polymerase II, TATA box binding protein (TBP)-associated factor, 32kDa |
| chr14_-_21737551 | 50.78 |
ENST00000554891.1
ENST00000555883.1 ENST00000553753.1 ENST00000555914.1 ENST00000557336.1 ENST00000555215.1 ENST00000556628.1 ENST00000555137.1 ENST00000556226.1 ENST00000555309.1 ENST00000556142.1 ENST00000554969.1 ENST00000554455.1 ENST00000556513.1 ENST00000557201.1 ENST00000420743.2 ENST00000557768.1 ENST00000553300.1 ENST00000554383.1 ENST00000554539.1 |
HNRNPC
|
heterogeneous nuclear ribonucleoprotein C (C1/C2) |
| chr17_-_61850894 | 50.32 |
ENST00000403162.3
ENST00000582252.1 ENST00000225726.5 |
CCDC47
|
coiled-coil domain containing 47 |
| chr15_+_66797455 | 49.74 |
ENST00000446801.2
|
ZWILCH
|
zwilch kinetochore protein |
| chr1_+_42921761 | 49.28 |
ENST00000372562.1
|
PPCS
|
phosphopantothenoylcysteine synthetase |
| chr15_+_40453204 | 48.88 |
ENST00000287598.6
ENST00000412359.3 |
BUB1B
|
BUB1 mitotic checkpoint serine/threonine kinase B |
| chr5_+_162887556 | 48.58 |
ENST00000393915.4
ENST00000432118.2 ENST00000358715.3 |
HMMR
|
hyaluronan-mediated motility receptor (RHAMM) |
| chr2_+_187350883 | 47.70 |
ENST00000337859.6
|
ZC3H15
|
zinc finger CCCH-type containing 15 |
| chr12_-_50419177 | 46.72 |
ENST00000454520.2
ENST00000546595.1 ENST00000548824.1 ENST00000549777.1 ENST00000546723.1 ENST00000427314.2 ENST00000552157.1 ENST00000552310.1 ENST00000548644.1 ENST00000312377.5 ENST00000546786.1 ENST00000550149.1 ENST00000546764.1 ENST00000552004.1 ENST00000548320.1 ENST00000547905.1 ENST00000550651.1 ENST00000551145.1 ENST00000434422.1 ENST00000552921.1 |
RACGAP1
|
Rac GTPase activating protein 1 |
| chrX_+_48433326 | 46.40 |
ENST00000376755.1
|
RBM3
|
RNA binding motif (RNP1, RRM) protein 3 |
| chr2_+_216176761 | 46.36 |
ENST00000540518.1
ENST00000435675.1 |
ATIC
|
5-aminoimidazole-4-carboxamide ribonucleotide formyltransferase/IMP cyclohydrolase |
| chr11_+_4116005 | 46.08 |
ENST00000300738.5
|
RRM1
|
ribonucleotide reductase M1 |
| chr11_-_14665163 | 45.54 |
ENST00000418988.2
|
PSMA1
|
proteasome (prosome, macropain) subunit, alpha type, 1 |
| chr2_+_187350973 | 45.37 |
ENST00000544130.1
|
ZC3H15
|
zinc finger CCCH-type containing 15 |
| chr16_-_46655538 | 44.93 |
ENST00000303383.3
|
SHCBP1
|
SHC SH2-domain binding protein 1 |
| chr15_+_66797627 | 44.28 |
ENST00000565627.1
ENST00000564179.1 |
ZWILCH
|
zwilch kinetochore protein |
| chr1_-_229644034 | 44.23 |
ENST00000366678.3
ENST00000261396.3 ENST00000537506.1 |
NUP133
|
nucleoporin 133kDa |
| chr14_-_21737610 | 42.94 |
ENST00000320084.7
ENST00000449098.1 ENST00000336053.6 |
HNRNPC
|
heterogeneous nuclear ribonucleoprotein C (C1/C2) |
| chrX_+_133594168 | 42.41 |
ENST00000298556.7
|
HPRT1
|
hypoxanthine phosphoribosyltransferase 1 |
| chrX_+_48755202 | 42.21 |
ENST00000447146.2
ENST00000376548.5 ENST00000247140.4 |
PQBP1
|
polyglutamine binding protein 1 |
| chr2_-_55496174 | 42.05 |
ENST00000417363.1
ENST00000412530.1 ENST00000394600.3 ENST00000366137.2 ENST00000420637.1 |
MTIF2
|
mitochondrial translational initiation factor 2 |
| chr20_+_31407692 | 41.98 |
ENST00000375571.5
|
MAPRE1
|
microtubule-associated protein, RP/EB family, member 1 |
| chr16_-_20911641 | 41.90 |
ENST00000564349.1
ENST00000324344.4 |
ERI2
DCUN1D3
|
ERI1 exoribonuclease family member 2 DCN1, defective in cullin neddylation 1, domain containing 3 |
| chr11_-_14541872 | 41.78 |
ENST00000419365.2
ENST00000530457.1 ENST00000532256.1 ENST00000533068.1 |
PSMA1
|
proteasome (prosome, macropain) subunit, alpha type, 1 |
| chr5_-_176943917 | 41.62 |
ENST00000330503.7
|
DDX41
|
DEAD (Asp-Glu-Ala-Asp) box polypeptide 41 |
| chrX_+_148622138 | 41.24 |
ENST00000450602.2
ENST00000441248.1 |
CXorf40A
|
chromosome X open reading frame 40A |
| chr1_-_220220000 | 40.29 |
ENST00000366923.3
|
EPRS
|
glutamyl-prolyl-tRNA synthetase |
| chr3_-_49066811 | 40.04 |
ENST00000442157.1
ENST00000326739.4 |
IMPDH2
|
IMP (inosine 5'-monophosphate) dehydrogenase 2 |
| chr1_-_161087802 | 39.33 |
ENST00000368010.3
|
PFDN2
|
prefoldin subunit 2 |
| chr20_-_5107180 | 39.19 |
ENST00000379160.3
|
PCNA
|
proliferating cell nuclear antigen |
| chr18_+_2571510 | 39.11 |
ENST00000261597.4
ENST00000575515.1 |
NDC80
|
NDC80 kinetochore complex component |
| chr17_+_66511540 | 38.97 |
ENST00000588188.2
|
PRKAR1A
|
protein kinase, cAMP-dependent, regulatory, type I, alpha |
| chr20_-_49575058 | 38.73 |
ENST00000371584.4
ENST00000371583.5 ENST00000413082.1 |
DPM1
|
dolichyl-phosphate mannosyltransferase polypeptide 1, catalytic subunit |
| chr2_-_198299726 | 38.68 |
ENST00000409915.4
ENST00000487698.1 ENST00000414963.2 ENST00000335508.6 |
SF3B1
|
splicing factor 3b, subunit 1, 155kDa |
| chr12_+_7079944 | 38.50 |
ENST00000261406.6
|
EMG1
|
EMG1 N1-specific pseudouridine methyltransferase |
| chr8_-_117778494 | 38.08 |
ENST00000276682.4
|
EIF3H
|
eukaryotic translation initiation factor 3, subunit H |
| chr1_-_8939265 | 37.87 |
ENST00000489867.1
|
ENO1
|
enolase 1, (alpha) |
| chr7_-_26240357 | 37.71 |
ENST00000354667.4
ENST00000356674.7 |
HNRNPA2B1
|
heterogeneous nuclear ribonucleoprotein A2/B1 |
| chr15_+_52311398 | 37.65 |
ENST00000261845.5
|
MAPK6
|
mitogen-activated protein kinase 6 |
| chr19_-_1095330 | 37.62 |
ENST00000586746.1
|
POLR2E
|
polymerase (RNA) II (DNA directed) polypeptide E, 25kDa |
| chr2_-_86422095 | 37.59 |
ENST00000254636.5
|
IMMT
|
inner membrane protein, mitochondrial |
| chr5_+_44809027 | 37.47 |
ENST00000507110.1
|
MRPS30
|
mitochondrial ribosomal protein S30 |
| chr4_-_69215467 | 37.44 |
ENST00000579690.1
|
YTHDC1
|
YTH domain containing 1 |
| chrX_+_13707235 | 37.42 |
ENST00000464506.1
|
RAB9A
|
RAB9A, member RAS oncogene family |
| chr2_-_153573887 | 37.33 |
ENST00000493468.2
ENST00000545856.1 |
PRPF40A
|
PRP40 pre-mRNA processing factor 40 homolog A (S. cerevisiae) |
| chr1_-_87379785 | 37.32 |
ENST00000401030.3
ENST00000370554.1 |
SEP15
|
Homo sapiens 15 kDa selenoprotein (SEP15), transcript variant 2, mRNA. |
| chr20_-_57617831 | 36.24 |
ENST00000371033.5
ENST00000355937.4 |
SLMO2
|
slowmo homolog 2 (Drosophila) |
| chr13_+_28195988 | 36.01 |
ENST00000399697.3
ENST00000399696.1 |
POLR1D
|
polymerase (RNA) I polypeptide D, 16kDa |
| chr22_+_42017280 | 35.84 |
ENST00000402580.3
ENST00000428575.2 ENST00000359308.4 |
XRCC6
|
X-ray repair complementing defective repair in Chinese hamster cells 6 |
| chr11_+_74660278 | 35.83 |
ENST00000263672.6
ENST00000530257.1 ENST00000526361.1 ENST00000532972.1 |
SPCS2
|
signal peptidase complex subunit 2 homolog (S. cerevisiae) |
| chr8_+_55047763 | 35.77 |
ENST00000260102.4
ENST00000519831.1 |
MRPL15
|
mitochondrial ribosomal protein L15 |
| chr2_+_118572226 | 35.69 |
ENST00000263239.2
|
DDX18
|
DEAD (Asp-Glu-Ala-Asp) box polypeptide 18 |
| chr15_-_23034322 | 35.59 |
ENST00000539711.2
ENST00000560039.1 ENST00000398013.3 ENST00000337451.3 ENST00000359727.4 ENST00000398014.2 |
NIPA2
|
non imprinted in Prader-Willi/Angelman syndrome 2 |
| chr6_-_109703600 | 35.50 |
ENST00000512821.1
|
CD164
|
CD164 molecule, sialomucin |
| chr5_-_68665815 | 35.34 |
ENST00000380818.3
ENST00000328663.4 |
TAF9
|
TAF9 RNA polymerase II, TATA box binding protein (TBP)-associated factor, 32kDa |
| chrX_+_21958674 | 35.17 |
ENST00000404933.2
|
SMS
|
spermine synthase |
| chrX_-_118986911 | 35.14 |
ENST00000276201.2
ENST00000345865.2 |
UPF3B
|
UPF3 regulator of nonsense transcripts homolog B (yeast) |
| chr22_-_36924944 | 34.74 |
ENST00000405442.1
ENST00000402116.1 |
EIF3D
|
eukaryotic translation initiation factor 3, subunit D |
| chr2_-_38978492 | 34.46 |
ENST00000409276.1
ENST00000446327.2 ENST00000313117.6 |
SRSF7
|
serine/arginine-rich splicing factor 7 |
| chr2_-_55496344 | 34.44 |
ENST00000403721.1
ENST00000263629.4 |
MTIF2
|
mitochondrial translational initiation factor 2 |
| chr14_+_52456327 | 34.41 |
ENST00000556760.1
|
C14orf166
|
chromosome 14 open reading frame 166 |
| chr2_-_153574480 | 34.02 |
ENST00000410080.1
|
PRPF40A
|
PRP40 pre-mRNA processing factor 40 homolog A (S. cerevisiae) |
| chrX_+_23682379 | 33.94 |
ENST00000379349.1
|
PRDX4
|
peroxiredoxin 4 |
| chr17_+_56769924 | 33.94 |
ENST00000461271.1
ENST00000583539.1 ENST00000337432.4 ENST00000421782.2 |
RAD51C
|
RAD51 paralog C |
| chr1_-_246670519 | 33.01 |
ENST00000388985.4
ENST00000490107.1 |
SMYD3
|
SET and MYND domain containing 3 |
| chr11_+_60609537 | 32.99 |
ENST00000227520.5
|
CCDC86
|
coiled-coil domain containing 86 |
| chr15_+_59397298 | 32.76 |
ENST00000559622.1
|
CCNB2
|
cyclin B2 |
| chrX_-_109561294 | 32.54 |
ENST00000372059.2
ENST00000262844.5 |
AMMECR1
|
Alport syndrome, mental retardation, midface hypoplasia and elliptocytosis chromosomal region gene 1 |
| chr5_-_133340326 | 32.46 |
ENST00000425992.1
ENST00000395044.3 ENST00000395047.2 |
VDAC1
|
voltage-dependent anion channel 1 |
| chr4_-_69215699 | 31.58 |
ENST00000510746.1
ENST00000344157.4 ENST00000355665.3 |
YTHDC1
|
YTH domain containing 1 |
| chr7_+_120590803 | 31.38 |
ENST00000315870.5
ENST00000339121.5 ENST00000445699.1 |
ING3
|
inhibitor of growth family, member 3 |
| chr21_-_46238034 | 31.20 |
ENST00000332859.6
|
SUMO3
|
small ubiquitin-like modifier 3 |
| chrX_-_135962876 | 31.18 |
ENST00000431446.3
ENST00000570135.1 ENST00000320676.7 ENST00000562646.1 |
RBMX
|
RNA binding motif protein, X-linked |
| chr9_+_110045537 | 30.92 |
ENST00000358015.3
|
RAD23B
|
RAD23 homolog B (S. cerevisiae) |
| chr10_-_97416400 | 30.91 |
ENST00000371224.2
ENST00000371221.3 |
ALDH18A1
|
aldehyde dehydrogenase 18 family, member A1 |
| chr1_-_19536744 | 30.84 |
ENST00000375267.2
ENST00000375217.2 ENST00000375226.2 ENST00000375254.3 |
UBR4
|
ubiquitin protein ligase E3 component n-recognin 4 |
| chr1_-_89357179 | 30.70 |
ENST00000448623.1
ENST00000418217.1 ENST00000370500.5 |
GTF2B
|
general transcription factor IIB |
| chr9_-_95056010 | 30.70 |
ENST00000443024.2
|
IARS
|
isoleucyl-tRNA synthetase |
| chr22_-_36925186 | 30.46 |
ENST00000541106.1
ENST00000455547.1 ENST00000432675.1 |
EIF3D
|
eukaryotic translation initiation factor 3, subunit D |
| chr19_-_40336969 | 29.96 |
ENST00000599134.1
ENST00000597634.1 ENST00000598417.1 ENST00000601274.1 ENST00000594309.1 ENST00000221801.3 |
FBL
|
fibrillarin |
| chrX_+_148622513 | 29.95 |
ENST00000393985.3
ENST00000423421.1 ENST00000423540.2 ENST00000434353.2 ENST00000514208.1 |
CXorf40A
|
chromosome X open reading frame 40A |
| chr10_+_60145155 | 29.95 |
ENST00000373895.3
|
TFAM
|
transcription factor A, mitochondrial |
| chr22_-_42343117 | 29.93 |
ENST00000407253.3
ENST00000215980.5 |
CENPM
|
centromere protein M |
| chr22_+_42017459 | 29.89 |
ENST00000405878.1
|
XRCC6
|
X-ray repair complementing defective repair in Chinese hamster cells 6 |
| chrX_+_48755183 | 29.70 |
ENST00000376563.1
ENST00000376566.4 |
PQBP1
|
polyglutamine binding protein 1 |
| chr12_-_120884175 | 29.48 |
ENST00000546954.1
|
TRIAP1
|
TP53 regulated inhibitor of apoptosis 1 |
| chr12_-_102513843 | 29.40 |
ENST00000551744.2
ENST00000552283.1 |
NUP37
|
nucleoporin 37kDa |
| chr9_+_116037922 | 29.38 |
ENST00000374198.4
|
PRPF4
|
pre-mRNA processing factor 4 |
| chrX_+_153991025 | 29.18 |
ENST00000369550.5
|
DKC1
|
dyskeratosis congenita 1, dyskerin |
| chr22_+_24951436 | 28.93 |
ENST00000215829.3
|
SNRPD3
|
small nuclear ribonucleoprotein D3 polypeptide 18kDa |
| chr19_-_18433875 | 28.86 |
ENST00000252816.6
|
LSM4
|
LSM4 homolog, U6 small nuclear RNA associated (S. cerevisiae) |
| chr16_+_31044413 | 28.82 |
ENST00000394998.1
|
STX4
|
syntaxin 4 |
| chr22_-_42342692 | 28.77 |
ENST00000404067.1
ENST00000402338.1 |
CENPM
|
centromere protein M |
| chr6_-_79944336 | 28.56 |
ENST00000344726.5
ENST00000275036.7 |
HMGN3
|
high mobility group nucleosomal binding domain 3 |
| chr4_+_17616253 | 28.51 |
ENST00000237380.7
|
MED28
|
mediator complex subunit 28 |
| chr11_-_102323740 | 28.03 |
ENST00000398136.2
|
TMEM123
|
transmembrane protein 123 |
| chr17_-_40169429 | 28.02 |
ENST00000316603.7
ENST00000588641.1 |
DNAJC7
|
DnaJ (Hsp40) homolog, subfamily C, member 7 |
| chr3_+_184081213 | 27.82 |
ENST00000429568.1
|
POLR2H
|
polymerase (RNA) II (DNA directed) polypeptide H |
| chr3_+_184081175 | 27.79 |
ENST00000452961.1
ENST00000296223.3 |
POLR2H
|
polymerase (RNA) II (DNA directed) polypeptide H |
| chr21_-_30445886 | 27.60 |
ENST00000431234.1
ENST00000540844.1 ENST00000286788.4 |
CCT8
|
chaperonin containing TCP1, subunit 8 (theta) |
| chr7_+_116139744 | 27.46 |
ENST00000343213.2
|
CAV2
|
caveolin 2 |
| chr1_-_200589859 | 27.42 |
ENST00000367350.4
|
KIF14
|
kinesin family member 14 |
| chr1_-_193075180 | 27.36 |
ENST00000367440.3
|
GLRX2
|
glutaredoxin 2 |
| chr11_+_4116054 | 27.15 |
ENST00000423050.2
|
RRM1
|
ribonucleotide reductase M1 |
| chr14_-_23058063 | 26.93 |
ENST00000538631.1
ENST00000543337.1 ENST00000250498.4 |
DAD1
|
defender against cell death 1 |
| chr21_-_46237883 | 26.87 |
ENST00000397893.3
|
SUMO3
|
small ubiquitin-like modifier 3 |
| chr12_+_104359576 | 26.84 |
ENST00000392872.3
ENST00000436021.2 |
TDG
|
thymine-DNA glycosylase |
| chr3_+_184080790 | 26.82 |
ENST00000430783.1
|
POLR2H
|
polymerase (RNA) II (DNA directed) polypeptide H |
| chr17_+_49337881 | 26.77 |
ENST00000225298.7
|
UTP18
|
UTP18 small subunit (SSU) processome component homolog (yeast) |
| chr3_-_146262488 | 26.68 |
ENST00000487389.1
|
PLSCR1
|
phospholipid scramblase 1 |
| chr6_-_75994536 | 26.65 |
ENST00000475111.2
ENST00000230461.6 |
TMEM30A
|
transmembrane protein 30A |
| chr3_-_146262365 | 26.55 |
ENST00000448787.2
|
PLSCR1
|
phospholipid scramblase 1 |
| chr1_+_153606532 | 26.54 |
ENST00000403433.1
|
CHTOP
|
chromatin target of PRMT1 |
| chr17_-_47785504 | 26.43 |
ENST00000514907.1
ENST00000503334.1 ENST00000508520.1 |
SLC35B1
|
solute carrier family 35, member B1 |
| chr10_+_70883908 | 26.32 |
ENST00000263559.6
ENST00000395098.1 ENST00000546041.1 ENST00000541711.1 |
VPS26A
|
vacuolar protein sorting 26 homolog A (S. pombe) |
| chr4_+_113558612 | 26.09 |
ENST00000505034.1
ENST00000324052.6 |
LARP7
|
La ribonucleoprotein domain family, member 7 |
| chr22_-_39096661 | 26.08 |
ENST00000216039.5
|
JOSD1
|
Josephin domain containing 1 |
| chr17_+_61905058 | 26.00 |
ENST00000375812.4
ENST00000581882.1 |
PSMC5
|
proteasome (prosome, macropain) 26S subunit, ATPase, 5 |
| chr7_-_97501706 | 25.99 |
ENST00000455086.1
ENST00000453600.1 |
ASNS
|
asparagine synthetase (glutamine-hydrolyzing) |
| chr2_-_70520539 | 25.97 |
ENST00000482975.2
ENST00000438261.1 |
SNRPG
|
small nuclear ribonucleoprotein polypeptide G |
| chr11_+_112097069 | 25.77 |
ENST00000280362.3
ENST00000525803.1 |
PTS
|
6-pyruvoyltetrahydropterin synthase |
| chr12_+_27863706 | 25.74 |
ENST00000081029.3
ENST00000538315.1 ENST00000542791.1 |
MRPS35
|
mitochondrial ribosomal protein S35 |
| chr12_+_120933904 | 25.73 |
ENST00000550178.1
ENST00000550845.1 ENST00000549989.1 ENST00000552870.1 |
DYNLL1
|
dynein, light chain, LC8-type 1 |
| chr1_-_155904187 | 25.61 |
ENST00000368321.3
ENST00000368320.3 |
KIAA0907
|
KIAA0907 |
| chr1_-_155881156 | 25.53 |
ENST00000539040.1
ENST00000368323.3 |
RIT1
|
Ras-like without CAAX 1 |
| chr15_+_59397275 | 25.46 |
ENST00000288207.2
|
CCNB2
|
cyclin B2 |
| chr3_-_185542817 | 25.42 |
ENST00000382199.2
|
IGF2BP2
|
insulin-like growth factor 2 mRNA binding protein 2 |
| chr22_+_42017123 | 25.31 |
ENST00000360079.3
|
XRCC6
|
X-ray repair complementing defective repair in Chinese hamster cells 6 |
| chr20_+_56964253 | 25.28 |
ENST00000395802.3
|
VAPB
|
VAMP (vesicle-associated membrane protein)-associated protein B and C |
| chr17_-_40169161 | 25.20 |
ENST00000589586.2
ENST00000426588.3 ENST00000589576.1 |
DNAJC7
|
DnaJ (Hsp40) homolog, subfamily C, member 7 |
| chr2_-_132249955 | 25.03 |
ENST00000309451.6
|
MZT2A
|
mitotic spindle organizing protein 2A |
| chr3_-_69129501 | 24.99 |
ENST00000540295.1
ENST00000415609.2 ENST00000361055.4 ENST00000349511.4 |
UBA3
|
ubiquitin-like modifier activating enzyme 3 |
| chr1_+_46016703 | 24.96 |
ENST00000481885.1
ENST00000351829.4 ENST00000471651.1 |
AKR1A1
|
aldo-keto reductase family 1, member A1 (aldehyde reductase) |
| chr11_+_47600562 | 24.91 |
ENST00000263774.4
ENST00000529276.1 ENST00000528192.1 ENST00000530295.1 ENST00000534208.1 ENST00000534716.2 |
NDUFS3
|
NADH dehydrogenase (ubiquinone) Fe-S protein 3, 30kDa (NADH-coenzyme Q reductase) |
| chr3_+_184081137 | 24.88 |
ENST00000443489.1
|
POLR2H
|
polymerase (RNA) II (DNA directed) polypeptide H |
| chr10_+_60144782 | 24.81 |
ENST00000487519.1
|
TFAM
|
transcription factor A, mitochondrial |
| chr1_+_42922173 | 24.38 |
ENST00000455780.1
ENST00000372560.3 ENST00000372561.3 ENST00000372556.3 |
PPCS
|
phosphopantothenoylcysteine synthetase |
| chr17_+_15902694 | 24.30 |
ENST00000261647.5
ENST00000486880.2 |
TTC19
|
tetratricopeptide repeat domain 19 |
| chr1_-_115124257 | 24.20 |
ENST00000369541.3
|
BCAS2
|
breast carcinoma amplified sequence 2 |
| chr15_+_49170083 | 24.09 |
ENST00000530028.2
|
EID1
|
EP300 interacting inhibitor of differentiation 1 |
| chr1_+_65613340 | 24.07 |
ENST00000546702.1
|
AK4
|
adenylate kinase 4 |
| chr19_-_18433910 | 24.03 |
ENST00000594828.3
ENST00000593829.1 |
LSM4
|
LSM4 homolog, U6 small nuclear RNA associated (S. cerevisiae) |
| chr2_+_201754135 | 23.93 |
ENST00000409357.1
ENST00000409129.2 |
NIF3L1
|
NIF3 NGG1 interacting factor 3-like 1 (S. cerevisiae) |
| chr1_-_156308018 | 23.91 |
ENST00000496684.2
ENST00000368259.2 ENST00000368261.3 ENST00000472765.2 ENST00000533194.1 ENST00000478640.2 |
CCT3
|
chaperonin containing TCP1, subunit 3 (gamma) |
| chr3_-_146262428 | 23.73 |
ENST00000486631.1
|
PLSCR1
|
phospholipid scramblase 1 |
| chr1_-_87380002 | 23.53 |
ENST00000331835.5
|
SEP15
|
Homo sapiens 15 kDa selenoprotein (SEP15), transcript variant 2, mRNA. |
| chr4_+_113558272 | 23.45 |
ENST00000509061.1
ENST00000508577.1 ENST00000513553.1 |
LARP7
|
La ribonucleoprotein domain family, member 7 |
| chr20_-_49575081 | 23.37 |
ENST00000371588.5
ENST00000371582.4 |
DPM1
|
dolichyl-phosphate mannosyltransferase polypeptide 1, catalytic subunit |
| chr19_+_17416457 | 23.34 |
ENST00000252602.1
|
MRPL34
|
mitochondrial ribosomal protein L34 |
| chr14_-_54908043 | 23.23 |
ENST00000556113.1
ENST00000553660.1 ENST00000395573.4 ENST00000557690.1 ENST00000216416.4 |
CNIH1
|
cornichon family AMPA receptor auxiliary protein 1 |
| chr19_+_5681153 | 23.22 |
ENST00000579559.1
ENST00000577222.1 |
HSD11B1L
RPL36
|
hydroxysteroid (11-beta) dehydrogenase 1-like ribosomal protein L36 |
| chr10_-_5931794 | 23.15 |
ENST00000380092.4
ENST00000380094.5 ENST00000191063.8 |
ANKRD16
|
ankyrin repeat domain 16 |
| chr17_-_47022140 | 23.06 |
ENST00000290330.3
|
SNF8
|
SNF8, ESCRT-II complex subunit |
| chr14_-_20020272 | 22.92 |
ENST00000551509.1
|
POTEM
|
POTE ankyrin domain family, member M |
| chr14_+_93260569 | 22.85 |
ENST00000163416.2
|
GOLGA5
|
golgin A5 |
| chr8_-_124408652 | 22.74 |
ENST00000287394.5
|
ATAD2
|
ATPase family, AAA domain containing 2 |
| chr2_-_70520832 | 22.73 |
ENST00000454893.1
ENST00000272348.2 |
SNRPG
|
small nuclear ribonucleoprotein polypeptide G |
| chr1_+_45241109 | 22.67 |
ENST00000396651.3
|
RPS8
|
ribosomal protein S8 |
| chr21_-_46237959 | 22.58 |
ENST00000397898.3
ENST00000411651.2 |
SUMO3
|
small ubiquitin-like modifier 3 |
| chr12_-_92539614 | 22.48 |
ENST00000256015.3
|
BTG1
|
B-cell translocation gene 1, anti-proliferative |
| chr5_+_138940742 | 22.38 |
ENST00000398733.3
ENST00000253815.2 ENST00000505007.1 |
UBE2D2
|
ubiquitin-conjugating enzyme E2D 2 |
| chr10_+_22610124 | 22.32 |
ENST00000376663.3
|
BMI1
|
BMI1 polycomb ring finger oncogene |
| chr12_+_120933859 | 22.16 |
ENST00000242577.6
ENST00000548214.1 ENST00000392508.2 |
DYNLL1
|
dynein, light chain, LC8-type 1 |
| chr1_-_235292250 | 22.10 |
ENST00000366607.4
|
TOMM20
|
translocase of outer mitochondrial membrane 20 homolog (yeast) |
| chr15_-_65281775 | 22.02 |
ENST00000433215.2
ENST00000558415.1 ENST00000557795.1 |
SPG21
|
spastic paraplegia 21 (autosomal recessive, Mast syndrome) |
| chr9_-_127177703 | 21.99 |
ENST00000259457.3
ENST00000536392.1 ENST00000441097.1 |
PSMB7
|
proteasome (prosome, macropain) subunit, beta type, 7 |
| chr22_+_20105259 | 21.73 |
ENST00000416427.1
ENST00000421656.1 ENST00000423859.1 ENST00000418705.2 |
RANBP1
|
RAN binding protein 1 |
| chr19_+_36235964 | 21.65 |
ENST00000587708.2
|
PSENEN
|
presenilin enhancer gamma secretase subunit |
| chr17_-_40169659 | 21.63 |
ENST00000457167.4
|
DNAJC7
|
DnaJ (Hsp40) homolog, subfamily C, member 7 |
| chr5_-_86708670 | 21.47 |
ENST00000504878.1
|
CCNH
|
cyclin H |
| chr9_+_106856831 | 21.45 |
ENST00000303219.8
ENST00000374787.3 |
SMC2
|
structural maintenance of chromosomes 2 |
| chrX_+_70503037 | 21.41 |
ENST00000535149.1
|
NONO
|
non-POU domain containing, octamer-binding |
| chr22_-_24316648 | 21.40 |
ENST00000403754.3
ENST00000430101.2 ENST00000398344.4 |
DDT
|
D-dopachrome tautomerase |
| chr11_-_77850629 | 21.32 |
ENST00000376156.3
ENST00000525870.1 ENST00000530454.1 ENST00000525755.1 ENST00000527099.1 ENST00000525761.1 ENST00000299626.5 |
ALG8
|
ALG8, alpha-1,3-glucosyltransferase |
| chr1_+_93297582 | 21.30 |
ENST00000370321.3
|
RPL5
|
ribosomal protein L5 |
| chr19_-_2427863 | 21.21 |
ENST00000215570.3
|
TIMM13
|
translocase of inner mitochondrial membrane 13 homolog (yeast) |
| chr8_+_22224811 | 21.19 |
ENST00000381237.1
|
SLC39A14
|
solute carrier family 39 (zinc transporter), member 14 |
| chr2_-_86790593 | 21.14 |
ENST00000263856.4
ENST00000409225.2 |
CHMP3
|
charged multivesicular body protein 3 |
| chr3_-_196669298 | 21.14 |
ENST00000411704.1
ENST00000452404.2 |
NCBP2
|
nuclear cap binding protein subunit 2, 20kDa |
| chr3_-_185655795 | 21.12 |
ENST00000342294.4
ENST00000382191.4 ENST00000453386.2 |
TRA2B
|
transformer 2 beta homolog (Drosophila) |
| chr2_-_174830430 | 21.03 |
ENST00000310015.6
ENST00000455789.2 |
SP3
|
Sp3 transcription factor |
| chrX_-_48755030 | 20.91 |
ENST00000490755.2
ENST00000465150.2 ENST00000495490.2 |
TIMM17B
|
translocase of inner mitochondrial membrane 17 homolog B (yeast) |
| chr2_-_86422523 | 20.89 |
ENST00000442664.2
ENST00000409051.2 ENST00000449247.2 |
IMMT
|
inner membrane protein, mitochondrial |
| chr2_+_178077477 | 20.87 |
ENST00000411529.2
ENST00000435711.1 |
HNRNPA3
|
heterogeneous nuclear ribonucleoprotein A3 |
| chr7_+_102988082 | 20.78 |
ENST00000292644.3
ENST00000544811.1 |
PSMC2
|
proteasome (prosome, macropain) 26S subunit, ATPase, 2 |
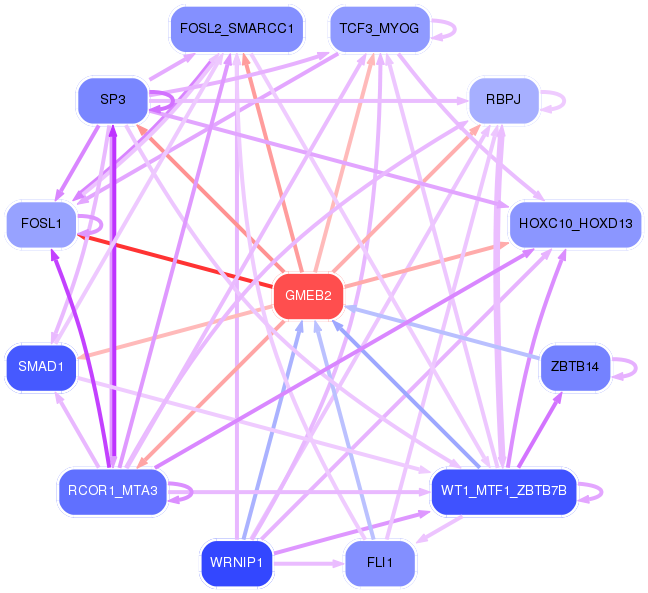
Network of associatons between targets according to the STRING database.

First level regulatory network of GMEB2
Gene Ontology Analysis
Gene overrepresentation in biological_process category:
| Log-likelihood per target | Total log-likelihood | Term | Description |
|---|---|---|---|
| 24.2 | 72.7 | GO:0046098 | guanine metabolic process(GO:0046098) |
| 21.7 | 65.2 | GO:0001732 | formation of cytoplasmic translation initiation complex(GO:0001732) |
| 17.4 | 104.3 | GO:0007296 | vitellogenesis(GO:0007296) |
| 17.3 | 69.1 | GO:0006391 | transcription initiation from mitochondrial promoter(GO:0006391) |
| 16.4 | 213.4 | GO:0000492 | box C/D snoRNP assembly(GO:0000492) |
| 15.6 | 46.7 | GO:1902568 | positive regulation of eosinophil degranulation(GO:0043311) positive regulation of eosinophil activation(GO:1902568) |
| 15.2 | 91.0 | GO:0071475 | cellular hyperosmotic salinity response(GO:0071475) |
| 14.5 | 116.1 | GO:0006659 | phosphatidylserine biosynthetic process(GO:0006659) |
| 14.0 | 42.0 | GO:1903031 | regulation of microtubule plus-end binding(GO:1903031) positive regulation of microtubule plus-end binding(GO:1903033) |
| 13.2 | 52.6 | GO:0006203 | dGTP catabolic process(GO:0006203) |
| 12.8 | 51.2 | GO:0046833 | snRNA export from nucleus(GO:0006408) positive regulation of RNA export from nucleus(GO:0046833) |
| 12.4 | 62.1 | GO:0019348 | dolichol metabolic process(GO:0019348) |
| 12.2 | 73.1 | GO:0031126 | snoRNA 3'-end processing(GO:0031126) |
| 11.7 | 35.2 | GO:0051083 | 'de novo' cotranslational protein folding(GO:0051083) |
| 11.7 | 35.2 | GO:0006597 | spermine biosynthetic process(GO:0006597) |
| 11.7 | 46.7 | GO:0000915 | assembly of actomyosin apparatus involved in cytokinesis(GO:0000912) actomyosin contractile ring assembly(GO:0000915) actomyosin contractile ring organization(GO:0044837) |
| 11.6 | 46.4 | GO:0046452 | dihydrofolate metabolic process(GO:0046452) |
| 11.1 | 55.3 | GO:0051177 | meiotic sister chromatid cohesion(GO:0051177) |
| 11.1 | 44.2 | GO:0051664 | nuclear pore distribution(GO:0031081) nuclear pore localization(GO:0051664) |
| 10.3 | 41.3 | GO:0044806 | G-quadruplex DNA unwinding(GO:0044806) |
| 10.3 | 30.8 | GO:0044205 | 'de novo' UMP biosynthetic process(GO:0044205) |
| 10.2 | 30.7 | GO:0006428 | isoleucyl-tRNA aminoacylation(GO:0006428) |
| 10.2 | 40.8 | GO:1902544 | oxidative DNA demethylation(GO:0035511) regulation of DNA N-glycosylase activity(GO:1902544) |
| 10.0 | 40.1 | GO:1903772 | regulation of viral budding via host ESCRT complex(GO:1903772) |
| 9.8 | 39.2 | GO:1902990 | leading strand elongation(GO:0006272) mitotic telomere maintenance via semi-conservative replication(GO:1902990) |
| 9.6 | 38.5 | GO:2000435 | regulation of protein neddylation(GO:2000434) negative regulation of protein neddylation(GO:2000435) |
| 9.6 | 76.5 | GO:0032790 | ribosome disassembly(GO:0032790) |
| 8.8 | 35.3 | GO:0035927 | RNA import into mitochondrion(GO:0035927) |
| 8.8 | 26.4 | GO:0072334 | UDP-galactose transport(GO:0015785) UDP-galactose transmembrane transport(GO:0072334) |
| 8.3 | 25.0 | GO:0007113 | endomitotic cell cycle(GO:0007113) |
| 8.3 | 25.0 | GO:0019853 | L-ascorbic acid biosynthetic process(GO:0019853) |
| 7.6 | 22.9 | GO:0009183 | purine deoxyribonucleoside diphosphate biosynthetic process(GO:0009183) dGDP metabolic process(GO:0046066) |
| 7.4 | 22.3 | GO:0061470 | T follicular helper cell differentiation(GO:0061470) |
| 7.3 | 29.4 | GO:0019747 | regulation of isoprenoid metabolic process(GO:0019747) |
| 6.8 | 33.9 | GO:2000255 | regulation of male germ cell proliferation(GO:2000254) negative regulation of male germ cell proliferation(GO:2000255) |
| 6.7 | 40.0 | GO:0006177 | GMP biosynthetic process(GO:0006177) |
| 6.6 | 19.8 | GO:0042822 | pyridoxal phosphate metabolic process(GO:0042822) pyridoxal phosphate biosynthetic process(GO:0042823) |
| 6.5 | 26.0 | GO:0070981 | L-asparagine biosynthetic process(GO:0070981) L-asparagine metabolic process(GO:0070982) |
| 6.5 | 19.4 | GO:0046166 | glyceraldehyde-3-phosphate biosynthetic process(GO:0046166) |
| 6.2 | 37.3 | GO:0046121 | deoxyribonucleoside catabolic process(GO:0046121) |
| 6.2 | 43.3 | GO:0046604 | positive regulation of mitotic centrosome separation(GO:0046604) |
| 6.1 | 30.3 | GO:1903377 | negative regulation of oxidative stress-induced neuron intrinsic apoptotic signaling pathway(GO:1903377) |
| 5.7 | 11.5 | GO:0034971 | histone H3-R17 methylation(GO:0034971) |
| 5.7 | 45.5 | GO:0010032 | meiotic chromosome condensation(GO:0010032) |
| 5.6 | 16.8 | GO:1901355 | response to rapamycin(GO:1901355) |
| 5.5 | 44.3 | GO:0015693 | magnesium ion transport(GO:0015693) |
| 5.5 | 60.9 | GO:0045116 | protein neddylation(GO:0045116) |
| 5.5 | 27.4 | GO:0032487 | regulation of Rap protein signal transduction(GO:0032487) |
| 5.5 | 21.8 | GO:0045875 | negative regulation of sister chromatid cohesion(GO:0045875) |
| 5.5 | 27.3 | GO:0006436 | tryptophanyl-tRNA aminoacylation(GO:0006436) |
| 5.4 | 54.4 | GO:1903297 | regulation of hypoxia-induced intrinsic apoptotic signaling pathway(GO:1903297) negative regulation of hypoxia-induced intrinsic apoptotic signaling pathway(GO:1903298) |
| 5.4 | 27.0 | GO:0099590 | neurotransmitter receptor internalization(GO:0099590) |
| 5.3 | 74.9 | GO:0070389 | chaperone cofactor-dependent protein refolding(GO:0070389) |
| 5.3 | 37.4 | GO:0052405 | negative regulation by host of symbiont molecular function(GO:0052405) |
| 5.3 | 21.1 | GO:0021796 | cerebral cortex regionalization(GO:0021796) |
| 5.3 | 15.8 | GO:1900195 | spindle assembly involved in female meiosis I(GO:0007057) positive regulation of oocyte maturation(GO:1900195) |
| 5.2 | 15.6 | GO:0006267 | pre-replicative complex assembly involved in nuclear cell cycle DNA replication(GO:0006267) pre-replicative complex assembly(GO:0036388) pre-replicative complex assembly involved in cell cycle DNA replication(GO:1902299) |
| 5.2 | 30.9 | GO:0006561 | proline biosynthetic process(GO:0006561) L-proline biosynthetic process(GO:0055129) |
| 5.1 | 41.1 | GO:0034551 | respiratory chain complex III assembly(GO:0017062) mitochondrial respiratory chain complex III assembly(GO:0034551) mitochondrial respiratory chain complex III biogenesis(GO:0097033) |
| 5.1 | 30.7 | GO:1904798 | positive regulation of core promoter binding(GO:1904798) |
| 4.9 | 34.3 | GO:1904044 | response to oxygen-glucose deprivation(GO:0090649) cellular response to oxygen-glucose deprivation(GO:0090650) response to aldosterone(GO:1904044) |
| 4.9 | 29.3 | GO:0046940 | nucleoside monophosphate phosphorylation(GO:0046940) |
| 4.9 | 43.8 | GO:0090267 | positive regulation of mitotic cell cycle spindle assembly checkpoint(GO:0090267) |
| 4.8 | 38.5 | GO:0070475 | rRNA base methylation(GO:0070475) |
| 4.8 | 344.3 | GO:0070126 | mitochondrial translational elongation(GO:0070125) mitochondrial translational termination(GO:0070126) |
| 4.8 | 14.3 | GO:0006421 | asparaginyl-tRNA aminoacylation(GO:0006421) |
| 4.7 | 46.9 | GO:0051096 | positive regulation of helicase activity(GO:0051096) |
| 4.6 | 50.3 | GO:0006983 | ER overload response(GO:0006983) |
| 4.6 | 13.7 | GO:0043060 | meiotic metaphase I plate congression(GO:0043060) meiotic spindle midzone assembly(GO:0051257) meiotic metaphase plate congression(GO:0051311) |
| 4.4 | 8.8 | GO:0002101 | tRNA wobble cytosine modification(GO:0002101) |
| 4.4 | 13.1 | GO:0006286 | base-excision repair, base-free sugar-phosphate removal(GO:0006286) |
| 4.4 | 47.9 | GO:2000576 | positive regulation of microtubule motor activity(GO:2000576) regulation of ATP-dependent microtubule motor activity, plus-end-directed(GO:2000580) positive regulation of ATP-dependent microtubule motor activity, plus-end-directed(GO:2000582) |
| 4.3 | 446.6 | GO:0006521 | regulation of cellular amino acid metabolic process(GO:0006521) |
| 4.3 | 17.2 | GO:2001270 | regulation of cysteine-type endopeptidase activity involved in execution phase of apoptosis(GO:2001270) negative regulation of cysteine-type endopeptidase activity involved in execution phase of apoptosis(GO:2001271) |
| 4.1 | 77.9 | GO:0046852 | positive regulation of bone resorption(GO:0045780) positive regulation of bone remodeling(GO:0046852) |
| 4.0 | 16.1 | GO:1903553 | positive regulation of extracellular exosome assembly(GO:1903553) |
| 4.0 | 20.0 | GO:0042256 | mature ribosome assembly(GO:0042256) |
| 4.0 | 51.5 | GO:1904871 | regulation of protein localization to Cajal body(GO:1904869) positive regulation of protein localization to Cajal body(GO:1904871) |
| 3.9 | 27.5 | GO:0075509 | receptor-mediated endocytosis of virus by host cell(GO:0019065) positive regulation of dopamine receptor signaling pathway(GO:0060161) endocytosis involved in viral entry into host cell(GO:0075509) |
| 3.9 | 27.4 | GO:0042262 | DNA protection(GO:0042262) |
| 3.9 | 46.5 | GO:1901407 | regulation of phosphorylation of RNA polymerase II C-terminal domain(GO:1901407) |
| 3.9 | 73.2 | GO:0009263 | deoxyribonucleotide biosynthetic process(GO:0009263) |
| 3.8 | 11.5 | GO:0033140 | negative regulation of peptidyl-serine phosphorylation of STAT protein(GO:0033140) |
| 3.7 | 11.2 | GO:1905068 | arterial endothelial cell fate commitment(GO:0060844) blood vessel lumenization(GO:0072554) positive regulation of ephrin receptor signaling pathway(GO:1901189) positive regulation of canonical Wnt signaling pathway involved in cardiac muscle cell fate commitment(GO:1901297) positive regulation of canonical Wnt signaling pathway involved in heart development(GO:1905068) |
| 3.7 | 11.2 | GO:0002901 | mature B cell apoptotic process(GO:0002901) regulation of mature B cell apoptotic process(GO:0002905) negative regulation of mature B cell apoptotic process(GO:0002906) |
| 3.7 | 29.5 | GO:2001140 | regulation of phospholipid transport(GO:2001138) positive regulation of phospholipid transport(GO:2001140) |
| 3.7 | 25.8 | GO:0046146 | tetrahydrobiopterin biosynthetic process(GO:0006729) tetrahydrobiopterin metabolic process(GO:0046146) |
| 3.6 | 3.6 | GO:0000965 | mitochondrial RNA 3'-end processing(GO:0000965) |
| 3.6 | 32.0 | GO:0045039 | protein import into mitochondrial inner membrane(GO:0045039) |
| 3.5 | 73.7 | GO:0015937 | coenzyme A biosynthetic process(GO:0015937) |
| 3.5 | 21.0 | GO:0060136 | embryonic process involved in female pregnancy(GO:0060136) |
| 3.5 | 13.9 | GO:0006382 | adenosine to inosine editing(GO:0006382) |
| 3.5 | 17.3 | GO:0070127 | tRNA aminoacylation for mitochondrial protein translation(GO:0070127) |
| 3.5 | 13.8 | GO:0000350 | generation of catalytic spliceosome for second transesterification step(GO:0000350) |
| 3.4 | 17.2 | GO:1900262 | regulation of DNA-directed DNA polymerase activity(GO:1900262) positive regulation of DNA-directed DNA polymerase activity(GO:1900264) |
| 3.4 | 85.9 | GO:0070935 | 3'-UTR-mediated mRNA stabilization(GO:0070935) |
| 3.4 | 27.1 | GO:0006987 | activation of signaling protein activity involved in unfolded protein response(GO:0006987) |
| 3.3 | 16.6 | GO:0009052 | pentose-phosphate shunt, non-oxidative branch(GO:0009052) |
| 3.3 | 145.0 | GO:0006363 | termination of RNA polymerase I transcription(GO:0006363) |
| 3.2 | 39.0 | GO:0045835 | negative regulation of meiotic nuclear division(GO:0045835) |
| 3.2 | 19.5 | GO:0000727 | double-strand break repair via break-induced replication(GO:0000727) |
| 3.2 | 12.8 | GO:0006850 | mitochondrial pyruvate transport(GO:0006850) mitochondrial pyruvate transmembrane transport(GO:1902361) |
| 3.2 | 15.9 | GO:0061084 | regulation of protein refolding(GO:0061083) negative regulation of protein refolding(GO:0061084) |
| 3.1 | 150.3 | GO:0000387 | spliceosomal snRNP assembly(GO:0000387) |
| 3.1 | 15.3 | GO:1902896 | terminal web assembly(GO:1902896) |
| 3.0 | 12.2 | GO:0072683 | T cell extravasation(GO:0072683) |
| 3.0 | 15.1 | GO:0016476 | regulation of embryonic cell shape(GO:0016476) |
| 2.9 | 14.7 | GO:0030047 | actin modification(GO:0030047) |
| 2.9 | 8.7 | GO:0085032 | modulation of signal transduction in other organism(GO:0044501) modulation by symbiont of host signal transduction pathway(GO:0052027) modulation of signal transduction in other organism involved in symbiotic interaction(GO:0052250) modulation by symbiont of host I-kappaB kinase/NF-kappaB cascade(GO:0085032) |
| 2.9 | 8.6 | GO:0016074 | snoRNA metabolic process(GO:0016074) |
| 2.9 | 34.4 | GO:0006388 | tRNA splicing, via endonucleolytic cleavage and ligation(GO:0006388) |
| 2.8 | 70.4 | GO:0048025 | negative regulation of mRNA splicing, via spliceosome(GO:0048025) |
| 2.8 | 8.3 | GO:0019626 | short-chain fatty acid catabolic process(GO:0019626) |
| 2.7 | 16.5 | GO:0030174 | regulation of DNA-dependent DNA replication initiation(GO:0030174) |
| 2.7 | 10.9 | GO:1900042 | positive regulation of interleukin-2 secretion(GO:1900042) |
| 2.6 | 21.1 | GO:0032510 | endosome to lysosome transport via multivesicular body sorting pathway(GO:0032510) |
| 2.6 | 41.6 | GO:0035458 | cellular response to interferon-beta(GO:0035458) |
| 2.6 | 7.8 | GO:0003420 | regulation of growth plate cartilage chondrocyte proliferation(GO:0003420) nitrate catabolic process(GO:0043602) nitric oxide catabolic process(GO:0046210) |
| 2.6 | 18.0 | GO:0007076 | mitotic chromosome condensation(GO:0007076) |
| 2.6 | 61.6 | GO:0043968 | histone H2A acetylation(GO:0043968) |
| 2.5 | 17.8 | GO:2000643 | positive regulation of early endosome to late endosome transport(GO:2000643) |
| 2.5 | 72.0 | GO:0034080 | CENP-A containing nucleosome assembly(GO:0034080) CENP-A containing chromatin organization(GO:0061641) |
| 2.5 | 29.8 | GO:1900028 | negative regulation of ruffle assembly(GO:1900028) |
| 2.5 | 14.8 | GO:0019367 | fatty acid elongation, saturated fatty acid(GO:0019367) fatty acid elongation, unsaturated fatty acid(GO:0019368) fatty acid elongation, monounsaturated fatty acid(GO:0034625) fatty acid elongation, polyunsaturated fatty acid(GO:0034626) |
| 2.4 | 26.7 | GO:0070863 | positive regulation of protein exit from endoplasmic reticulum(GO:0070863) |
| 2.3 | 14.1 | GO:0090646 | mitochondrial tRNA processing(GO:0090646) |
| 2.3 | 11.7 | GO:0090400 | stress-induced premature senescence(GO:0090400) |
| 2.3 | 11.7 | GO:0006620 | posttranslational protein targeting to membrane(GO:0006620) |
| 2.3 | 94.5 | GO:0070911 | global genome nucleotide-excision repair(GO:0070911) |
| 2.3 | 20.7 | GO:0006268 | DNA unwinding involved in DNA replication(GO:0006268) |
| 2.3 | 22.7 | GO:0031936 | negative regulation of chromatin silencing(GO:0031936) |
| 2.2 | 58.5 | GO:0051560 | mitochondrial calcium ion homeostasis(GO:0051560) |
| 2.2 | 6.6 | GO:0000012 | single strand break repair(GO:0000012) |
| 2.1 | 21.2 | GO:0071578 | zinc II ion transmembrane import(GO:0071578) |
| 2.1 | 8.3 | GO:1902474 | positive regulation of protein localization to synapse(GO:1902474) |
| 2.1 | 55.4 | GO:0006376 | mRNA splice site selection(GO:0006376) |
| 2.0 | 26.5 | GO:0005981 | regulation of glycogen catabolic process(GO:0005981) |
| 2.0 | 28.5 | GO:0051151 | negative regulation of smooth muscle cell differentiation(GO:0051151) |
| 2.0 | 16.2 | GO:2000074 | regulation of type B pancreatic cell development(GO:2000074) |
| 2.0 | 8.1 | GO:0098501 | polynucleotide dephosphorylation(GO:0098501) |
| 2.0 | 28.1 | GO:0000154 | rRNA modification(GO:0000154) |
| 2.0 | 28.0 | GO:0045793 | positive regulation of cell size(GO:0045793) |
| 2.0 | 3.9 | GO:0072289 | metanephric nephron tubule formation(GO:0072289) |
| 2.0 | 15.7 | GO:0060744 | thelarche(GO:0042695) mammary gland branching involved in thelarche(GO:0060744) |
| 2.0 | 52.8 | GO:0045737 | positive regulation of cyclin-dependent protein serine/threonine kinase activity(GO:0045737) |
| 1.9 | 9.6 | GO:0030035 | microspike assembly(GO:0030035) |
| 1.9 | 13.4 | GO:0070900 | mitochondrial tRNA modification(GO:0070900) mitochondrial RNA modification(GO:1900864) |
| 1.9 | 9.5 | GO:0061732 | mitochondrial acetyl-CoA biosynthetic process from pyruvate(GO:0061732) |
| 1.9 | 11.3 | GO:0090074 | negative regulation of protein homodimerization activity(GO:0090074) |
| 1.9 | 22.3 | GO:0007379 | segment specification(GO:0007379) |
| 1.9 | 7.4 | GO:0006050 | mannosamine metabolic process(GO:0006050) N-acetylmannosamine metabolic process(GO:0006051) |
| 1.8 | 16.5 | GO:0010917 | negative regulation of mitochondrial membrane potential(GO:0010917) |
| 1.8 | 12.6 | GO:0046784 | viral mRNA export from host cell nucleus(GO:0046784) |
| 1.8 | 8.9 | GO:0038026 | reelin-mediated signaling pathway(GO:0038026) |
| 1.7 | 22.5 | GO:2000271 | positive regulation of fibroblast apoptotic process(GO:2000271) |
| 1.7 | 18.8 | GO:0006379 | mRNA cleavage(GO:0006379) |
| 1.7 | 6.8 | GO:0072717 | cellular response to actinomycin D(GO:0072717) |
| 1.7 | 6.7 | GO:0033617 | mitochondrial respiratory chain complex IV assembly(GO:0033617) mitochondrial respiratory chain complex IV biogenesis(GO:0097034) |
| 1.7 | 6.7 | GO:0002326 | B cell lineage commitment(GO:0002326) |
| 1.6 | 8.2 | GO:0072307 | metanephric nephron tubule epithelial cell differentiation(GO:0072257) regulation of metanephric nephron tubule epithelial cell differentiation(GO:0072307) positive regulation of stem cell population maintenance(GO:1902459) |
| 1.6 | 13.1 | GO:2000270 | negative regulation of fibroblast apoptotic process(GO:2000270) |
| 1.6 | 250.4 | GO:0045047 | protein targeting to ER(GO:0045047) |
| 1.6 | 6.5 | GO:0002051 | osteoblast fate commitment(GO:0002051) |
| 1.6 | 32.5 | GO:0016254 | preassembly of GPI anchor in ER membrane(GO:0016254) |
| 1.6 | 63.3 | GO:0043029 | T cell homeostasis(GO:0043029) |
| 1.6 | 24.3 | GO:0060213 | regulation of nuclear-transcribed mRNA poly(A) tail shortening(GO:0060211) positive regulation of nuclear-transcribed mRNA poly(A) tail shortening(GO:0060213) |
| 1.6 | 8.1 | GO:0001895 | retina homeostasis(GO:0001895) |
| 1.6 | 11.2 | GO:0033353 | S-adenosylmethionine cycle(GO:0033353) |
| 1.6 | 6.3 | GO:1903748 | negative regulation of establishment of protein localization to mitochondrion(GO:1903748) |
| 1.6 | 14.2 | GO:0070933 | histone H4 deacetylation(GO:0070933) |
| 1.6 | 10.9 | GO:0031915 | positive regulation of synaptic plasticity(GO:0031915) |
| 1.5 | 16.8 | GO:0030043 | actin filament fragmentation(GO:0030043) |
| 1.5 | 42.8 | GO:0030214 | hyaluronan catabolic process(GO:0030214) |
| 1.5 | 12.2 | GO:0016926 | protein desumoylation(GO:0016926) |
| 1.5 | 21.3 | GO:0006488 | dolichol-linked oligosaccharide biosynthetic process(GO:0006488) |
| 1.5 | 87.5 | GO:0000380 | alternative mRNA splicing, via spliceosome(GO:0000380) |
| 1.5 | 38.7 | GO:0000245 | spliceosomal complex assembly(GO:0000245) |
| 1.5 | 14.7 | GO:0002480 | antigen processing and presentation of exogenous peptide antigen via MHC class I, TAP-independent(GO:0002480) |
| 1.4 | 15.4 | GO:0007008 | outer mitochondrial membrane organization(GO:0007008) |
| 1.4 | 5.6 | GO:0090206 | negative regulation of cholesterol biosynthetic process(GO:0045541) negative regulation of cholesterol metabolic process(GO:0090206) |
| 1.4 | 11.0 | GO:0070973 | protein localization to endoplasmic reticulum exit site(GO:0070973) |
| 1.4 | 20.3 | GO:0034975 | protein folding in endoplasmic reticulum(GO:0034975) |
| 1.3 | 14.6 | GO:0031584 | activation of phospholipase D activity(GO:0031584) |
| 1.3 | 9.1 | GO:0045329 | carnitine biosynthetic process(GO:0045329) |
| 1.3 | 24.5 | GO:0043486 | histone exchange(GO:0043486) |
| 1.3 | 3.9 | GO:0033341 | regulation of collagen binding(GO:0033341) |
| 1.3 | 16.6 | GO:0048227 | plasma membrane to endosome transport(GO:0048227) |
| 1.2 | 6.2 | GO:1904977 | lymphatic endothelial cell migration(GO:1904977) |
| 1.2 | 8.7 | GO:0006284 | base-excision repair(GO:0006284) |
| 1.2 | 12.2 | GO:1903265 | positive regulation of tumor necrosis factor-mediated signaling pathway(GO:1903265) |
| 1.2 | 21.6 | GO:0031293 | Notch receptor processing(GO:0007220) membrane protein intracellular domain proteolysis(GO:0031293) |
| 1.2 | 7.2 | GO:0097428 | protein maturation by iron-sulfur cluster transfer(GO:0097428) |
| 1.2 | 66.1 | GO:0007157 | heterophilic cell-cell adhesion via plasma membrane cell adhesion molecules(GO:0007157) |
| 1.1 | 12.6 | GO:0045722 | positive regulation of gluconeogenesis(GO:0045722) |
| 1.1 | 236.3 | GO:0000398 | RNA splicing, via transesterification reactions with bulged adenosine as nucleophile(GO:0000377) mRNA splicing, via spliceosome(GO:0000398) |
| 1.1 | 7.9 | GO:0060300 | regulation of cytokine activity(GO:0060300) |
| 1.1 | 19.1 | GO:0006995 | cellular response to nitrogen starvation(GO:0006995) cellular response to nitrogen levels(GO:0043562) |
| 1.1 | 15.5 | GO:0036295 | cellular response to increased oxygen levels(GO:0036295) |
| 1.1 | 4.4 | GO:0033314 | mitotic DNA replication checkpoint(GO:0033314) |
| 1.1 | 14.0 | GO:0033234 | negative regulation of protein sumoylation(GO:0033234) |
| 1.1 | 34.3 | GO:0014904 | myotube cell development(GO:0014904) |
| 1.0 | 3.1 | GO:0042450 | arginine biosynthetic process via ornithine(GO:0042450) |
| 1.0 | 104.9 | GO:0007062 | sister chromatid cohesion(GO:0007062) |
| 1.0 | 8.1 | GO:0090073 | positive regulation of protein homodimerization activity(GO:0090073) |
| 1.0 | 6.0 | GO:0071763 | nuclear membrane organization(GO:0071763) |
| 1.0 | 13.9 | GO:0001682 | tRNA 5'-leader removal(GO:0001682) |
| 1.0 | 4.9 | GO:0035672 | oligopeptide transmembrane transport(GO:0035672) |
| 1.0 | 3.8 | GO:1903438 | regulation of cytokinetic process(GO:0032954) regulation of mitotic cytokinetic process(GO:1903436) positive regulation of mitotic cytokinetic process(GO:1903438) positive regulation of mitotic cytokinesis(GO:1903490) |
| 0.9 | 15.1 | GO:0031163 | iron-sulfur cluster assembly(GO:0016226) metallo-sulfur cluster assembly(GO:0031163) |
| 0.9 | 7.6 | GO:0033211 | adiponectin-activated signaling pathway(GO:0033211) negative regulation of NIK/NF-kappaB signaling(GO:1901223) |
| 0.9 | 15.0 | GO:0032836 | glomerular basement membrane development(GO:0032836) |
| 0.9 | 17.7 | GO:0006337 | nucleosome disassembly(GO:0006337) |
| 0.9 | 10.0 | GO:1902254 | negative regulation of intrinsic apoptotic signaling pathway by p53 class mediator(GO:1902254) |
| 0.9 | 5.3 | GO:0002943 | tRNA dihydrouridine synthesis(GO:0002943) |
| 0.9 | 55.2 | GO:0006120 | mitochondrial electron transport, NADH to ubiquinone(GO:0006120) |
| 0.9 | 28.0 | GO:0042776 | mitochondrial ATP synthesis coupled proton transport(GO:0042776) |
| 0.9 | 7.8 | GO:0006122 | mitochondrial electron transport, ubiquinol to cytochrome c(GO:0006122) |
| 0.9 | 71.5 | GO:0008543 | fibroblast growth factor receptor signaling pathway(GO:0008543) |
| 0.8 | 38.4 | GO:0071392 | cellular response to estradiol stimulus(GO:0071392) |
| 0.8 | 9.2 | GO:2000210 | positive regulation of anoikis(GO:2000210) |
| 0.8 | 13.2 | GO:0018345 | protein palmitoylation(GO:0018345) |
| 0.8 | 15.5 | GO:0090005 | negative regulation of establishment of protein localization to plasma membrane(GO:0090005) |
| 0.8 | 17.7 | GO:0032508 | DNA duplex unwinding(GO:0032508) |
| 0.8 | 34.2 | GO:0006418 | tRNA aminoacylation for protein translation(GO:0006418) |
| 0.8 | 16.1 | GO:0009303 | rRNA transcription(GO:0009303) |
| 0.8 | 8.3 | GO:2000786 | positive regulation of autophagosome assembly(GO:2000786) |
| 0.8 | 24.8 | GO:0000301 | retrograde transport, vesicle recycling within Golgi(GO:0000301) |
| 0.7 | 14.2 | GO:0000289 | nuclear-transcribed mRNA poly(A) tail shortening(GO:0000289) |
| 0.7 | 4.4 | GO:0035803 | egg coat formation(GO:0035803) |
| 0.7 | 2.9 | GO:1905123 | regulation of endosome organization(GO:1904978) regulation of glucosylceramidase activity(GO:1905123) |
| 0.7 | 1.4 | GO:0043038 | amino acid activation(GO:0043038) tRNA aminoacylation(GO:0043039) |
| 0.7 | 37.7 | GO:0060999 | positive regulation of dendritic spine development(GO:0060999) |
| 0.7 | 2.8 | GO:2000035 | regulation of stem cell division(GO:2000035) |
| 0.7 | 22.8 | GO:0006582 | melanin metabolic process(GO:0006582) melanin biosynthetic process(GO:0042438) |
| 0.7 | 31.9 | GO:1903959 | regulation of anion transmembrane transport(GO:1903959) |
| 0.7 | 3.4 | GO:0032929 | negative regulation of superoxide anion generation(GO:0032929) |
| 0.7 | 28.5 | GO:0001824 | blastocyst development(GO:0001824) |
| 0.7 | 52.1 | GO:0006446 | regulation of translational initiation(GO:0006446) |
| 0.6 | 14.9 | GO:0002181 | cytoplasmic translation(GO:0002181) |
| 0.6 | 3.2 | GO:1902237 | positive regulation of endoplasmic reticulum stress-induced intrinsic apoptotic signaling pathway(GO:1902237) |
| 0.6 | 19.0 | GO:0051301 | cell division(GO:0051301) |
| 0.6 | 19.0 | GO:0042059 | negative regulation of epidermal growth factor receptor signaling pathway(GO:0042059) |
| 0.6 | 55.6 | GO:0006338 | chromatin remodeling(GO:0006338) |
| 0.6 | 12.8 | GO:0032780 | negative regulation of ATPase activity(GO:0032780) |
| 0.6 | 13.2 | GO:0046339 | diacylglycerol metabolic process(GO:0046339) |
| 0.6 | 4.1 | GO:0035860 | glial cell-derived neurotrophic factor receptor signaling pathway(GO:0035860) |
| 0.6 | 19.9 | GO:0050873 | brown fat cell differentiation(GO:0050873) |
| 0.6 | 4.6 | GO:0015816 | glycine transport(GO:0015816) |
| 0.6 | 39.0 | GO:0045727 | positive regulation of translation(GO:0045727) |
| 0.6 | 4.0 | GO:1904263 | positive regulation of TORC1 signaling(GO:1904263) |
| 0.6 | 11.8 | GO:0060334 | regulation of interferon-gamma-mediated signaling pathway(GO:0060334) |
| 0.5 | 24.1 | GO:0035065 | regulation of histone acetylation(GO:0035065) |
| 0.5 | 8.0 | GO:0032060 | bleb assembly(GO:0032060) |
| 0.5 | 4.1 | GO:0018401 | peptidyl-proline hydroxylation to 4-hydroxy-L-proline(GO:0018401) |
| 0.5 | 6.6 | GO:0000470 | maturation of LSU-rRNA(GO:0000470) |
| 0.5 | 1.5 | GO:0046654 | tetrahydrofolate biosynthetic process(GO:0046654) |
| 0.5 | 22.4 | GO:0035666 | TRIF-dependent toll-like receptor signaling pathway(GO:0035666) |
| 0.5 | 8.2 | GO:2000251 | positive regulation of actin cytoskeleton reorganization(GO:2000251) |
| 0.5 | 28.6 | GO:0061178 | regulation of insulin secretion involved in cellular response to glucose stimulus(GO:0061178) |
| 0.5 | 5.6 | GO:0097296 | activation of cysteine-type endopeptidase activity involved in apoptotic signaling pathway(GO:0097296) |
| 0.5 | 3.2 | GO:0007598 | blood coagulation, extrinsic pathway(GO:0007598) |
| 0.5 | 4.6 | GO:1900037 | regulation of cellular response to hypoxia(GO:1900037) |
| 0.5 | 6.8 | GO:0002227 | innate immune response in mucosa(GO:0002227) |
| 0.4 | 4.4 | GO:0061099 | negative regulation of protein tyrosine kinase activity(GO:0061099) |
| 0.4 | 4.3 | GO:0002091 | negative regulation of receptor internalization(GO:0002091) |
| 0.4 | 5.5 | GO:0006782 | protoporphyrinogen IX biosynthetic process(GO:0006782) |
| 0.4 | 9.3 | GO:0070723 | response to cholesterol(GO:0070723) |
| 0.4 | 18.8 | GO:0043171 | peptide catabolic process(GO:0043171) |
| 0.4 | 4.1 | GO:0051865 | protein autoubiquitination(GO:0051865) |
| 0.4 | 9.7 | GO:0046850 | regulation of bone remodeling(GO:0046850) |
| 0.4 | 25.4 | GO:0042035 | regulation of cytokine biosynthetic process(GO:0042035) |
| 0.4 | 7.2 | GO:1903206 | negative regulation of hydrogen peroxide-induced cell death(GO:1903206) |
| 0.4 | 7.9 | GO:0048745 | smooth muscle tissue development(GO:0048745) |
| 0.3 | 5.9 | GO:0006123 | mitochondrial electron transport, cytochrome c to oxygen(GO:0006123) |
| 0.3 | 5.1 | GO:0006703 | estrogen biosynthetic process(GO:0006703) |
| 0.3 | 0.7 | GO:0038169 | somatostatin receptor signaling pathway(GO:0038169) somatostatin signaling pathway(GO:0038170) |
| 0.3 | 6.2 | GO:1990126 | retrograde transport, endosome to plasma membrane(GO:1990126) |
| 0.3 | 6.3 | GO:0007265 | Ras protein signal transduction(GO:0007265) |
| 0.3 | 11.0 | GO:0006893 | Golgi to plasma membrane transport(GO:0006893) |
| 0.3 | 2.7 | GO:0032264 | IMP salvage(GO:0032264) |
| 0.3 | 1.5 | GO:0050428 | purine ribonucleoside bisphosphate biosynthetic process(GO:0034036) 3'-phosphoadenosine 5'-phosphosulfate biosynthetic process(GO:0050428) |
| 0.3 | 5.6 | GO:0016558 | protein import into peroxisome matrix(GO:0016558) |
| 0.3 | 1.8 | GO:0044351 | macropinocytosis(GO:0044351) |
| 0.3 | 0.9 | GO:0042796 | snRNA transcription from RNA polymerase III promoter(GO:0042796) |
| 0.2 | 0.9 | GO:0070459 | prolactin secretion(GO:0070459) |
| 0.2 | 7.8 | GO:0000188 | inactivation of MAPK activity(GO:0000188) |
| 0.2 | 1.0 | GO:0043651 | linoleic acid metabolic process(GO:0043651) |
| 0.2 | 6.5 | GO:0030206 | chondroitin sulfate biosynthetic process(GO:0030206) |
| 0.2 | 11.2 | GO:0038083 | peptidyl-tyrosine autophosphorylation(GO:0038083) |
| 0.2 | 1.0 | GO:0045591 | positive regulation of regulatory T cell differentiation(GO:0045591) |
| 0.2 | 0.5 | GO:0045212 | negative regulation of synaptic transmission, cholinergic(GO:0032223) neurotransmitter receptor biosynthetic process(GO:0045212) |
| 0.2 | 4.0 | GO:1900006 | positive regulation of dendrite development(GO:1900006) |
| 0.2 | 3.0 | GO:0048511 | rhythmic process(GO:0048511) |
| 0.2 | 32.3 | GO:0006888 | ER to Golgi vesicle-mediated transport(GO:0006888) |
| 0.1 | 3.6 | GO:0009954 | proximal/distal pattern formation(GO:0009954) |
| 0.1 | 1.1 | GO:0042789 | mRNA transcription from RNA polymerase II promoter(GO:0042789) |
| 0.1 | 2.2 | GO:1904886 | beta-catenin destruction complex disassembly(GO:1904886) |
| 0.1 | 9.8 | GO:0050817 | blood coagulation(GO:0007596) coagulation(GO:0050817) |
| 0.1 | 0.4 | GO:0006287 | base-excision repair, gap-filling(GO:0006287) |
| 0.1 | 0.7 | GO:0006540 | glutamate decarboxylation to succinate(GO:0006540) gamma-aminobutyric acid catabolic process(GO:0009450) |
| 0.1 | 6.4 | GO:0016266 | O-glycan processing(GO:0016266) |
| 0.1 | 7.8 | GO:0006110 | regulation of glycolytic process(GO:0006110) |
| 0.1 | 0.7 | GO:0035437 | protein retention in ER lumen(GO:0006621) maintenance of protein localization in endoplasmic reticulum(GO:0035437) |
| 0.1 | 1.4 | GO:0033141 | regulation of peptidyl-serine phosphorylation of STAT protein(GO:0033139) positive regulation of peptidyl-serine phosphorylation of STAT protein(GO:0033141) |
| 0.1 | 2.2 | GO:0032463 | negative regulation of protein homooligomerization(GO:0032463) |
| 0.1 | 0.4 | GO:0018022 | peptidyl-lysine methylation(GO:0018022) |
| 0.1 | 7.0 | GO:0006261 | DNA-dependent DNA replication(GO:0006261) |
| 0.1 | 0.1 | GO:0070914 | UV-damage excision repair(GO:0070914) |
| 0.1 | 0.7 | GO:0051775 | response to redox state(GO:0051775) |
| 0.1 | 7.9 | GO:0035335 | peptidyl-tyrosine dephosphorylation(GO:0035335) |
| 0.1 | 10.1 | GO:0002433 | immune response-regulating cell surface receptor signaling pathway involved in phagocytosis(GO:0002433) Fc-gamma receptor signaling pathway involved in phagocytosis(GO:0038096) |
| 0.1 | 5.8 | GO:1900046 | regulation of blood coagulation(GO:0030193) regulation of hemostasis(GO:1900046) |
| 0.1 | 6.0 | GO:0006911 | phagocytosis, engulfment(GO:0006911) |
| 0.1 | 3.2 | GO:0007498 | mesoderm development(GO:0007498) |
| 0.1 | 1.4 | GO:0000462 | maturation of SSU-rRNA from tricistronic rRNA transcript (SSU-rRNA, 5.8S rRNA, LSU-rRNA)(GO:0000462) |
| 0.1 | 0.4 | GO:0097031 | NADH dehydrogenase complex assembly(GO:0010257) mitochondrial respiratory chain complex I assembly(GO:0032981) mitochondrial respiratory chain complex I biogenesis(GO:0097031) |
| 0.1 | 2.3 | GO:0051495 | positive regulation of cytoskeleton organization(GO:0051495) |
| 0.0 | 0.4 | GO:0031290 | retinal ganglion cell axon guidance(GO:0031290) |
| 0.0 | 1.3 | GO:0015949 | nucleobase-containing small molecule interconversion(GO:0015949) |
| 0.0 | 1.3 | GO:2000300 | regulation of synaptic vesicle exocytosis(GO:2000300) |
| 0.0 | 1.7 | GO:0008283 | cell proliferation(GO:0008283) |
| 0.0 | 0.8 | GO:0071377 | cellular response to glucagon stimulus(GO:0071377) |
| 0.0 | 1.7 | GO:0019827 | stem cell population maintenance(GO:0019827) maintenance of cell number(GO:0098727) |
| 0.0 | 0.4 | GO:0036297 | interstrand cross-link repair(GO:0036297) |
| 0.0 | 0.3 | GO:0030204 | chondroitin sulfate metabolic process(GO:0030204) |
| 0.0 | 0.4 | GO:0070979 | protein K11-linked ubiquitination(GO:0070979) |
Gene overrepresentation in cellular_component category:
| Log-likelihood per target | Total log-likelihood | Term | Description |
|---|---|---|---|
| 26.7 | 213.4 | GO:0070761 | pre-snoRNP complex(GO:0070761) |
| 25.7 | 308.0 | GO:0019773 | proteasome core complex, alpha-subunit complex(GO:0019773) |
| 23.5 | 94.0 | GO:1990423 | RZZ complex(GO:1990423) |
| 20.7 | 62.1 | GO:0033185 | dolichol-phosphate-mannose synthase complex(GO:0033185) |
| 18.3 | 73.2 | GO:0005971 | ribonucleoside-diphosphate reductase complex(GO:0005971) |
| 18.2 | 91.0 | GO:0043564 | Ku70:Ku80 complex(GO:0043564) |
| 18.0 | 71.9 | GO:0071598 | neuronal ribonucleoprotein granule(GO:0071598) |
| 13.1 | 39.2 | GO:0070557 | PCNA-p21 complex(GO:0070557) |
| 13.0 | 39.1 | GO:0031262 | Ndc80 complex(GO:0031262) |
| 12.8 | 51.2 | GO:0005846 | nuclear cap binding complex(GO:0005846) |
| 11.7 | 47.0 | GO:0032777 | Piccolo NuA4 histone acetyltransferase complex(GO:0032777) |
| 11.5 | 103.3 | GO:0071541 | eukaryotic translation initiation factor 3 complex, eIF3m(GO:0071541) |
| 10.0 | 30.0 | GO:0031428 | box C/D snoRNP complex(GO:0031428) |
| 9.7 | 77.6 | GO:0005683 | U7 snRNP(GO:0005683) |
| 9.3 | 46.7 | GO:0097149 | centralspindlin complex(GO:0097149) |
| 8.8 | 238.5 | GO:0000314 | organellar small ribosomal subunit(GO:0000314) mitochondrial small ribosomal subunit(GO:0005763) |
| 8.8 | 26.3 | GO:0030906 | retromer, cargo-selective complex(GO:0030906) |
| 8.5 | 93.1 | GO:0000940 | condensed chromosome outer kinetochore(GO:0000940) |
| 8.4 | 58.5 | GO:0061617 | MICOS complex(GO:0061617) |
| 8.3 | 149.2 | GO:0005736 | DNA-directed RNA polymerase I complex(GO:0005736) |
| 7.9 | 23.8 | GO:0031372 | UBC13-MMS2 complex(GO:0031372) |
| 7.3 | 29.4 | GO:0071001 | U4/U6 snRNP(GO:0071001) |
| 7.2 | 35.9 | GO:0044530 | supraspliceosomal complex(GO:0044530) |
| 7.0 | 42.0 | GO:0030981 | cortical microtubule cytoskeleton(GO:0030981) |
| 6.5 | 129.9 | GO:0071004 | U2-type prespliceosome(GO:0071004) |
| 6.4 | 44.5 | GO:0097452 | GAIT complex(GO:0097452) |
| 6.3 | 19.0 | GO:0043224 | nuclear SCF ubiquitin ligase complex(GO:0043224) |
| 6.3 | 37.9 | GO:0000015 | phosphopyruvate hydratase complex(GO:0000015) |
| 6.3 | 37.8 | GO:0072588 | box H/ACA snoRNP complex(GO:0031429) box H/ACA RNP complex(GO:0072588) box H/ACA scaRNP complex(GO:0072589) box H/ACA telomerase RNP complex(GO:0090661) |
| 5.8 | 46.7 | GO:0000322 | storage vacuole(GO:0000322) |
| 5.7 | 33.9 | GO:0033063 | DNA recombinase mediator complex(GO:0033061) Rad51B-Rad51C-Rad51D-XRCC2 complex(GO:0033063) |
| 5.6 | 39.3 | GO:0016272 | prefoldin complex(GO:0016272) |
| 5.5 | 16.5 | GO:0097124 | Y chromosome(GO:0000806) cyclin A2-CDK2 complex(GO:0097124) cyclin E1-CDK2 complex(GO:0097134) |
| 5.4 | 70.0 | GO:1990712 | HFE-transferrin receptor complex(GO:1990712) |
| 5.4 | 21.5 | GO:0070985 | TFIIK complex(GO:0070985) |
| 5.4 | 10.7 | GO:0000808 | origin recognition complex(GO:0000808) nuclear origin of replication recognition complex(GO:0005664) |
| 5.3 | 63.5 | GO:0031595 | nuclear proteasome complex(GO:0031595) |
| 5.3 | 52.9 | GO:0005688 | U6 snRNP(GO:0005688) |
| 5.2 | 26.1 | GO:0034388 | Pwp2p-containing subcomplex of 90S preribosome(GO:0034388) |
| 5.2 | 15.6 | GO:0036387 | nuclear pre-replicative complex(GO:0005656) pre-replicative complex(GO:0036387) |
| 5.0 | 59.5 | GO:0000346 | transcription export complex(GO:0000346) |
| 4.9 | 19.8 | GO:0001405 | presequence translocase-associated import motor(GO:0001405) |
| 4.9 | 34.4 | GO:0072669 | tRNA-splicing ligase complex(GO:0072669) |
| 4.8 | 66.7 | GO:0031618 | nuclear pericentric heterochromatin(GO:0031618) |
| 4.7 | 75.1 | GO:0019774 | proteasome core complex, beta-subunit complex(GO:0019774) |
| 4.6 | 32.0 | GO:0005787 | signal peptidase complex(GO:0005787) |
| 4.6 | 13.7 | GO:0005715 | late recombination nodule(GO:0005715) |
| 4.5 | 40.8 | GO:0000796 | condensin complex(GO:0000796) |
| 4.0 | 32.0 | GO:0042719 | mitochondrial intermembrane space protein transporter complex(GO:0042719) |
| 4.0 | 51.5 | GO:0002199 | zona pellucida receptor complex(GO:0002199) |
| 3.8 | 15.3 | GO:1990357 | terminal web(GO:1990357) |
| 3.7 | 74.8 | GO:0031588 | nucleotide-activated protein kinase complex(GO:0031588) |
| 3.5 | 17.7 | GO:0071010 | prespliceosome(GO:0071010) |
| 3.5 | 20.9 | GO:0031390 | Ctf18 RFC-like complex(GO:0031390) |
| 3.4 | 80.9 | GO:0005697 | telomerase holoenzyme complex(GO:0005697) |
| 3.2 | 9.6 | GO:0044393 | microspike(GO:0044393) |
| 3.2 | 22.1 | GO:0005742 | mitochondrial outer membrane translocase complex(GO:0005742) |
| 3.1 | 15.4 | GO:0009368 | endopeptidase Clp complex(GO:0009368) |
| 3.0 | 12.1 | GO:0019907 | cyclin-dependent protein kinase activating kinase holoenzyme complex(GO:0019907) |
| 3.0 | 68.7 | GO:0032156 | septin cytoskeleton(GO:0032156) |
| 3.0 | 35.7 | GO:0008250 | oligosaccharyltransferase complex(GO:0008250) |
| 2.9 | 31.8 | GO:0045275 | mitochondrial respiratory chain complex III(GO:0005750) respiratory chain complex III(GO:0045275) |
| 2.9 | 37.2 | GO:0042555 | MCM complex(GO:0042555) |
| 2.8 | 14.1 | GO:0030678 | mitochondrial ribonuclease P complex(GO:0030678) |
| 2.8 | 30.7 | GO:0097550 | transcriptional preinitiation complex(GO:0097550) |
| 2.8 | 25.0 | GO:0000931 | gamma-tubulin large complex(GO:0000931) gamma-tubulin ring complex(GO:0008274) |
| 2.7 | 21.4 | GO:0042382 | paraspeckles(GO:0042382) |
| 2.7 | 45.2 | GO:1990124 | messenger ribonucleoprotein complex(GO:1990124) |
| 2.6 | 26.5 | GO:0072357 | glycogen granule(GO:0042587) PTW/PP1 phosphatase complex(GO:0072357) |
| 2.6 | 61.2 | GO:0036452 | ESCRT complex(GO:0036452) |
| 2.5 | 7.6 | GO:0071012 | catalytic step 1 spliceosome(GO:0071012) |
| 2.5 | 15.1 | GO:0071817 | MMXD complex(GO:0071817) |
| 2.5 | 10.0 | GO:0055087 | Ski complex(GO:0055087) |
| 2.5 | 34.8 | GO:0000974 | Prp19 complex(GO:0000974) |
| 2.3 | 11.7 | GO:0031205 | endoplasmic reticulum Sec complex(GO:0031205) |
| 2.3 | 13.8 | GO:0071014 | post-mRNA release spliceosomal complex(GO:0071014) |
| 2.3 | 330.5 | GO:0015934 | large ribosomal subunit(GO:0015934) |
| 2.3 | 29.4 | GO:0031080 | nuclear pore outer ring(GO:0031080) |
| 2.3 | 20.3 | GO:0072546 | ER membrane protein complex(GO:0072546) |
| 2.2 | 11.2 | GO:0002193 | MAML1-RBP-Jkappa- ICN1 complex(GO:0002193) |
| 2.2 | 17.8 | GO:0098559 | cytoplasmic side of early endosome membrane(GO:0098559) |
| 2.2 | 13.3 | GO:0044614 | nuclear pore cytoplasmic filaments(GO:0044614) |
| 2.2 | 47.9 | GO:0035145 | exon-exon junction complex(GO:0035145) |
| 2.1 | 15.0 | GO:0031298 | replication fork protection complex(GO:0031298) |
| 2.0 | 12.2 | GO:0072557 | IPAF inflammasome complex(GO:0072557) |
| 2.0 | 105.1 | GO:0042645 | nucleoid(GO:0009295) mitochondrial nucleoid(GO:0042645) |
| 2.0 | 20.0 | GO:0000506 | glycosylphosphatidylinositol-N-acetylglucosaminyltransferase (GPI-GnT) complex(GO:0000506) |
| 2.0 | 13.9 | GO:0000172 | ribonuclease MRP complex(GO:0000172) |
| 2.0 | 21.6 | GO:0070765 | gamma-secretase complex(GO:0070765) |
| 1.9 | 16.7 | GO:0033588 | Elongator holoenzyme complex(GO:0033588) |
| 1.8 | 31.3 | GO:0000109 | nucleotide-excision repair complex(GO:0000109) |
| 1.8 | 14.7 | GO:0042612 | MHC class I protein complex(GO:0042612) |
| 1.8 | 15.8 | GO:0072687 | meiotic spindle(GO:0072687) |
| 1.7 | 26.9 | GO:0005852 | eukaryotic translation initiation factor 3 complex(GO:0005852) |
| 1.6 | 8.2 | GO:0071148 | TEAD-1-YAP complex(GO:0071148) |
| 1.6 | 22.3 | GO:0035102 | PRC1 complex(GO:0035102) |
| 1.6 | 10.9 | GO:0070554 | synaptobrevin 2-SNAP-25-syntaxin-3-complexin complex(GO:0070554) |
| 1.6 | 10.9 | GO:0032437 | cuticular plate(GO:0032437) |
| 1.6 | 28.0 | GO:0000276 | mitochondrial proton-transporting ATP synthase complex, coupling factor F(o)(GO:0000276) |
| 1.5 | 28.6 | GO:0017101 | aminoacyl-tRNA synthetase multienzyme complex(GO:0017101) |
| 1.5 | 161.9 | GO:0000776 | kinetochore(GO:0000776) |
| 1.5 | 4.4 | GO:0005686 | U2 snRNP(GO:0005686) |
| 1.4 | 14.2 | GO:0030015 | CCR4-NOT core complex(GO:0030015) |
| 1.4 | 27.0 | GO:0036020 | endolysosome membrane(GO:0036020) |
| 1.4 | 24.0 | GO:0000812 | Swr1 complex(GO:0000812) |
| 1.4 | 53.0 | GO:0005790 | smooth endoplasmic reticulum(GO:0005790) |
| 1.4 | 17.7 | GO:0001741 | XY body(GO:0001741) |
| 1.3 | 13.9 | GO:0000176 | nuclear exosome (RNase complex)(GO:0000176) |
| 1.2 | 8.1 | GO:0033018 | sarcoplasmic reticulum lumen(GO:0033018) |
| 1.1 | 43.5 | GO:0030173 | integral component of Golgi membrane(GO:0030173) |
| 1.1 | 87.3 | GO:0005758 | mitochondrial intermembrane space(GO:0005758) |
| 1.1 | 27.2 | GO:0070971 | endoplasmic reticulum exit site(GO:0070971) |
| 1.0 | 75.4 | GO:0071013 | catalytic step 2 spliceosome(GO:0071013) |
| 1.0 | 11.9 | GO:0017119 | Golgi transport complex(GO:0017119) |
| 1.0 | 55.7 | GO:0005747 | mitochondrial respiratory chain complex I(GO:0005747) NADH dehydrogenase complex(GO:0030964) respiratory chain complex I(GO:0045271) |
| 0.9 | 5.3 | GO:0002177 | manchette(GO:0002177) dynactin complex(GO:0005869) |
| 0.9 | 27.2 | GO:0030687 | preribosome, large subunit precursor(GO:0030687) |
| 0.8 | 9.7 | GO:0010008 | vacuolar membrane(GO:0005774) endosome membrane(GO:0010008) |
| 0.8 | 7.2 | GO:0097413 | Lewy body(GO:0097413) |
| 0.8 | 28.5 | GO:0016592 | mediator complex(GO:0016592) |
| 0.8 | 33.9 | GO:0005840 | ribosome(GO:0005840) |
| 0.7 | 22.0 | GO:0030140 | trans-Golgi network transport vesicle(GO:0030140) |
| 0.7 | 16.9 | GO:0070822 | Sin3-type complex(GO:0070822) |
| 0.7 | 5.6 | GO:0016593 | Cdc73/Paf1 complex(GO:0016593) |
| 0.7 | 49.6 | GO:0005681 | spliceosomal complex(GO:0005681) |
| 0.7 | 5.5 | GO:0097443 | sorting endosome(GO:0097443) |
| 0.7 | 48.7 | GO:0022627 | cytosolic small ribosomal subunit(GO:0022627) |
| 0.7 | 68.9 | GO:0035578 | azurophil granule lumen(GO:0035578) |
| 0.7 | 26.5 | GO:0000307 | cyclin-dependent protein kinase holoenzyme complex(GO:0000307) |
| 0.7 | 45.1 | GO:0072686 | mitotic spindle(GO:0072686) |
| 0.7 | 4.0 | GO:1990130 | EGO complex(GO:0034448) Iml1 complex(GO:1990130) Gtr1-Gtr2 GTPase complex(GO:1990131) |
| 0.6 | 15.5 | GO:0016471 | vacuolar proton-transporting V-type ATPase complex(GO:0016471) |
| 0.6 | 68.4 | GO:0042734 | presynaptic membrane(GO:0042734) |
| 0.6 | 11.2 | GO:0097342 | ripoptosome(GO:0097342) |
| 0.6 | 37.4 | GO:0030670 | phagocytic vesicle membrane(GO:0030670) |
| 0.6 | 25.3 | GO:0005876 | spindle microtubule(GO:0005876) |
| 0.6 | 4.8 | GO:0016363 | nuclear matrix(GO:0016363) |
| 0.6 | 6.6 | GO:0030127 | COPII vesicle coat(GO:0030127) |
| 0.5 | 5.9 | GO:0005751 | mitochondrial respiratory chain complex IV(GO:0005751) |
| 0.5 | 19.2 | GO:0005871 | kinesin complex(GO:0005871) |
| 0.5 | 35.1 | GO:0005766 | primary lysosome(GO:0005766) azurophil granule(GO:0042582) |
| 0.5 | 14.7 | GO:0030660 | Golgi-associated vesicle membrane(GO:0030660) |
| 0.5 | 1.0 | GO:0002079 | inner acrosomal membrane(GO:0002079) |
| 0.5 | 23.9 | GO:0012507 | ER to Golgi transport vesicle membrane(GO:0012507) |
| 0.5 | 7.0 | GO:0016281 | eukaryotic translation initiation factor 4F complex(GO:0016281) |
| 0.5 | 24.1 | GO:0043195 | terminal bouton(GO:0043195) |
| 0.4 | 22.9 | GO:0005801 | cis-Golgi network(GO:0005801) |
| 0.4 | 41.4 | GO:0000932 | cytoplasmic mRNA processing body(GO:0000932) |
| 0.4 | 27.8 | GO:0101003 | ficolin-1-rich granule membrane(GO:0101003) |
| 0.4 | 26.1 | GO:0005791 | rough endoplasmic reticulum(GO:0005791) |
| 0.3 | 19.6 | GO:0000151 | ubiquitin ligase complex(GO:0000151) |
| 0.3 | 0.6 | GO:0070381 | endosome to plasma membrane transport vesicle(GO:0070381) |
| 0.3 | 33.3 | GO:0016605 | PML body(GO:0016605) |
| 0.3 | 19.8 | GO:0035580 | specific granule lumen(GO:0035580) |
| 0.2 | 3.2 | GO:0097433 | dense body(GO:0097433) |
| 0.2 | 3.5 | GO:0032433 | filopodium tip(GO:0032433) |
| 0.2 | 81.0 | GO:0098857 | membrane raft(GO:0045121) membrane microdomain(GO:0098857) |
| 0.2 | 4.3 | GO:0005844 | polysome(GO:0005844) |
| 0.2 | 49.4 | GO:0034774 | secretory granule lumen(GO:0034774) |
| 0.2 | 10.1 | GO:0005637 | nuclear inner membrane(GO:0005637) |
| 0.2 | 6.6 | GO:0045171 | intercellular bridge(GO:0045171) |
| 0.2 | 33.4 | GO:0098852 | lysosomal membrane(GO:0005765) lytic vacuole membrane(GO:0098852) |
| 0.2 | 40.9 | GO:0005730 | nucleolus(GO:0005730) |
| 0.1 | 2.9 | GO:0030669 | clathrin-coated endocytic vesicle membrane(GO:0030669) |
| 0.1 | 13.6 | GO:0030496 | midbody(GO:0030496) |
| 0.1 | 5.1 | GO:0031594 | neuromuscular junction(GO:0031594) |
| 0.1 | 7.8 | GO:0030175 | filopodium(GO:0030175) |
| 0.1 | 2.5 | GO:0016581 | NuRD complex(GO:0016581) CHD-type complex(GO:0090545) |
| 0.1 | 6.5 | GO:0032580 | Golgi cisterna membrane(GO:0032580) |
| 0.1 | 27.2 | GO:0009897 | external side of plasma membrane(GO:0009897) |
| 0.1 | 7.5 | GO:0030176 | integral component of endoplasmic reticulum membrane(GO:0030176) |
| 0.1 | 1.6 | GO:0031306 | intrinsic component of mitochondrial outer membrane(GO:0031306) |
| 0.1 | 6.9 | GO:0001725 | stress fiber(GO:0001725) contractile actin filament bundle(GO:0097517) |
| 0.1 | 2.2 | GO:0016327 | apicolateral plasma membrane(GO:0016327) |
| 0.1 | 6.8 | GO:0030425 | dendrite(GO:0030425) |
| 0.1 | 5.1 | GO:0044309 | dendritic spine(GO:0043197) neuron spine(GO:0044309) |
| 0.1 | 0.6 | GO:0005666 | DNA-directed RNA polymerase III complex(GO:0005666) |
| 0.1 | 0.4 | GO:0043240 | Fanconi anaemia nuclear complex(GO:0043240) |
| 0.0 | 0.8 | GO:0048786 | presynaptic active zone(GO:0048786) |
| 0.0 | 17.4 | GO:0009986 | cell surface(GO:0009986) |
| 0.0 | 0.5 | GO:0043083 | synaptic cleft(GO:0043083) |
| 0.0 | 7.3 | GO:0005769 | early endosome(GO:0005769) |
| 0.0 | 52.9 | GO:0070062 | extracellular exosome(GO:0070062) |
| 0.0 | 5.4 | GO:0005635 | nuclear envelope(GO:0005635) |
| 0.0 | 0.4 | GO:0005680 | anaphase-promoting complex(GO:0005680) |
Gene overrepresentation in molecular_function category:
| Log-likelihood per target | Total log-likelihood | Term | Description |
|---|---|---|---|
| 26.0 | 77.9 | GO:0015091 | ferric iron transmembrane transporter activity(GO:0015091) trivalent inorganic cation transmembrane transporter activity(GO:0072510) |
| 20.7 | 62.1 | GO:0004582 | dolichyl-phosphate beta-D-mannosyltransferase activity(GO:0004582) |
| 18.3 | 73.2 | GO:0004748 | ribonucleoside-diphosphate reductase activity, thioredoxin disulfide as acceptor(GO:0004748) oxidoreductase activity, acting on CH or CH2 groups, disulfide as acceptor(GO:0016728) ribonucleoside-diphosphate reductase activity(GO:0061731) |
| 17.5 | 52.6 | GO:0035539 | 8-oxo-7,8-dihydroguanosine triphosphate pyrophosphatase activity(GO:0008413) NADH pyrophosphatase activity(GO:0035529) 8-oxo-7,8-dihydrodeoxyguanosine triphosphate pyrophosphatase activity(GO:0035539) |
| 15.4 | 200.4 | GO:1990247 | N6-methyladenosine-containing RNA binding(GO:1990247) |
| 13.6 | 40.8 | GO:0043739 | G/U mismatch-specific uracil-DNA glycosylase activity(GO:0043739) |
| 12.9 | 181.3 | GO:0001075 | transcription factor activity, RNA polymerase II core promoter sequence-specific binding involved in preinitiation complex assembly(GO:0001075) |
| 12.8 | 383.1 | GO:0070003 | threonine-type endopeptidase activity(GO:0004298) threonine-type peptidase activity(GO:0070003) |
| 12.4 | 37.3 | GO:0004139 | deoxyribose-phosphate aldolase activity(GO:0004139) |
| 11.7 | 46.7 | GO:0016230 | sphingomyelin phosphodiesterase activator activity(GO:0016230) |
| 11.0 | 54.8 | GO:0070363 | mitochondrial light strand promoter sense binding(GO:0070363) |
| 10.2 | 30.7 | GO:0004822 | isoleucine-tRNA ligase activity(GO:0004822) |
| 10.1 | 30.3 | GO:0061752 | telomeric repeat-containing RNA binding(GO:0061752) |
| 10.0 | 40.0 | GO:0003938 | IMP dehydrogenase activity(GO:0003938) |
| 9.8 | 39.2 | GO:0030337 | DNA polymerase processivity factor activity(GO:0030337) |
| 9.6 | 28.9 | GO:0071209 | U7 snRNA binding(GO:0071209) |
| 9.1 | 91.0 | GO:0051575 | 5'-deoxyribose-5-phosphate lyase activity(GO:0051575) |
| 9.1 | 27.2 | GO:0033149 | FFAT motif binding(GO:0033149) |
| 9.0 | 99.4 | GO:0017128 | phospholipid scramblase activity(GO:0017128) |
| 8.8 | 26.4 | GO:0005459 | UDP-galactose transmembrane transporter activity(GO:0005459) |
| 8.6 | 25.8 | GO:0016838 | carbon-oxygen lyase activity, acting on phosphates(GO:0016838) |
| 8.3 | 149.2 | GO:0001054 | RNA polymerase I activity(GO:0001054) |
| 7.7 | 30.9 | GO:0016774 | phosphotransferase activity, carboxyl group as acceptor(GO:0016774) |
| 7.7 | 46.4 | GO:0019238 | cyclohydrolase activity(GO:0019238) |
| 7.3 | 29.3 | GO:0046899 | nucleoside triphosphate adenylate kinase activity(GO:0046899) |
| 7.1 | 21.3 | GO:0000033 | alpha-1,3-mannosyltransferase activity(GO:0000033) |
| 6.9 | 61.9 | GO:1990226 | histone methyltransferase binding(GO:1990226) |
| 6.8 | 54.7 | GO:0015450 | P-P-bond-hydrolysis-driven protein transmembrane transporter activity(GO:0015450) |
| 6.7 | 80.7 | GO:0031386 | protein tag(GO:0031386) |
| 6.5 | 91.6 | GO:0043024 | ribosomal small subunit binding(GO:0043024) |
| 6.4 | 19.3 | GO:0031177 | acyl binding(GO:0000035) phosphopantetheine binding(GO:0031177) |
| 6.4 | 51.2 | GO:0000340 | RNA 7-methylguanosine cap binding(GO:0000340) |
| 6.3 | 37.9 | GO:0004634 | phosphopyruvate hydratase activity(GO:0004634) |
| 6.3 | 37.8 | GO:0034513 | box H/ACA snoRNA binding(GO:0034513) |
| 5.9 | 17.7 | GO:0030627 | pre-mRNA 5'-splice site binding(GO:0030627) |
| 5.9 | 35.2 | GO:0061649 | ubiquitinated histone binding(GO:0061649) |
| 5.8 | 64.2 | GO:0008097 | 5S rRNA binding(GO:0008097) |
| 5.8 | 63.5 | GO:0036402 | proteasome-activating ATPase activity(GO:0036402) |
| 5.7 | 91.5 | GO:0008649 | rRNA methyltransferase activity(GO:0008649) |
| 5.7 | 33.9 | GO:0008821 | crossover junction endodeoxyribonuclease activity(GO:0008821) |
| 5.5 | 44.0 | GO:0019788 | NEDD8 transferase activity(GO:0019788) |
| 5.5 | 27.4 | GO:0030614 | oxidoreductase activity, acting on phosphorus or arsenic in donors(GO:0030613) oxidoreductase activity, acting on phosphorus or arsenic in donors, disulfide as acceptor(GO:0030614) |
| 5.5 | 27.3 | GO:0004830 | tryptophan-tRNA ligase activity(GO:0004830) |
| 5.4 | 32.6 | GO:0004167 | dopachrome isomerase activity(GO:0004167) |
| 5.4 | 16.1 | GO:0005137 | interleukin-5 receptor binding(GO:0005137) |
| 5.2 | 26.0 | GO:0004066 | asparagine synthase (glutamine-hydrolyzing) activity(GO:0004066) |
| 4.9 | 14.7 | GO:0032427 | GBD domain binding(GO:0032427) |
| 4.7 | 65.2 | GO:0000339 | RNA cap binding(GO:0000339) |
| 4.7 | 37.2 | GO:0004652 | polynucleotide adenylyltransferase activity(GO:0004652) |
| 4.6 | 82.4 | GO:0017070 | U6 snRNA binding(GO:0017070) |
| 4.5 | 13.6 | GO:0035500 | MH2 domain binding(GO:0035500) |
| 4.5 | 22.3 | GO:0071535 | RING-like zinc finger domain binding(GO:0071535) |
| 4.4 | 26.5 | GO:0017018 | myosin phosphatase activity(GO:0017018) |
| 4.3 | 13.0 | GO:0004088 | carbamoyl-phosphate synthase (ammonia) activity(GO:0004087) carbamoyl-phosphate synthase (glutamine-hydrolyzing) activity(GO:0004088) |
| 4.2 | 33.9 | GO:0008379 | thioredoxin peroxidase activity(GO:0008379) |
| 4.0 | 15.9 | GO:1990446 | U1 snRNP binding(GO:1990446) |
| 3.7 | 74.8 | GO:0008603 | cAMP-dependent protein kinase regulator activity(GO:0008603) |
| 3.7 | 33.0 | GO:0001162 | RNA polymerase II intronic transcription regulatory region sequence-specific DNA binding(GO:0001162) |
| 3.6 | 32.5 | GO:0015288 | porin activity(GO:0015288) |
| 3.6 | 35.7 | GO:0004579 | dolichyl-diphosphooligosaccharide-protein glycotransferase activity(GO:0004579) |
| 3.5 | 24.6 | GO:0016681 | ubiquinol-cytochrome-c reductase activity(GO:0008121) oxidoreductase activity, acting on diphenols and related substances as donors, cytochrome as acceptor(GO:0016681) |
| 3.5 | 20.9 | GO:0051032 | nucleic acid transmembrane transporter activity(GO:0051032) RNA transmembrane transporter activity(GO:0051033) |
| 3.5 | 13.9 | GO:0003726 | double-stranded RNA adenosine deaminase activity(GO:0003726) |
| 3.5 | 24.3 | GO:0033170 | DNA clamp loader activity(GO:0003689) protein-DNA loading ATPase activity(GO:0033170) |
| 3.5 | 13.8 | GO:0042809 | vitamin D receptor binding(GO:0042809) |
| 3.4 | 109.2 | GO:0070064 | proline-rich region binding(GO:0070064) |
| 3.4 | 10.1 | GO:0008309 | double-stranded DNA exodeoxyribonuclease activity(GO:0008309) |
| 3.3 | 52.3 | GO:0035613 | RNA stem-loop binding(GO:0035613) |
| 3.3 | 36.0 | GO:0016861 | intramolecular oxidoreductase activity, interconverting aldoses and ketoses(GO:0016861) |
| 3.3 | 13.1 | GO:0004165 | dodecenoyl-CoA delta-isomerase activity(GO:0004165) |
| 3.3 | 16.3 | GO:0016427 | tRNA (cytosine) methyltransferase activity(GO:0016427) |
| 3.0 | 21.2 | GO:0015093 | ferrous iron transmembrane transporter activity(GO:0015093) |
| 3.0 | 50.8 | GO:0003688 | DNA replication origin binding(GO:0003688) |
| 3.0 | 35.6 | GO:0015095 | magnesium ion transmembrane transporter activity(GO:0015095) |
| 2.8 | 11.4 | GO:0004307 | ethanolaminephosphotransferase activity(GO:0004307) |
| 2.8 | 8.3 | GO:0016309 | 1-phosphatidylinositol-5-phosphate 4-kinase activity(GO:0016309) |
| 2.8 | 25.0 | GO:0004032 | alditol:NADP+ 1-oxidoreductase activity(GO:0004032) |
| 2.8 | 16.6 | GO:0060698 | endoribonuclease inhibitor activity(GO:0060698) |
| 2.7 | 8.1 | GO:0098519 | nucleotide phosphatase activity, acting on free nucleotides(GO:0098519) |
| 2.6 | 41.9 | GO:0097602 | cullin family protein binding(GO:0097602) |
| 2.6 | 10.4 | GO:0030292 | protein tyrosine kinase inhibitor activity(GO:0030292) |
| 2.6 | 26.1 | GO:0000774 | adenyl-nucleotide exchange factor activity(GO:0000774) |
| 2.6 | 46.8 | GO:0045505 | dynein intermediate chain binding(GO:0045505) |
| 2.6 | 7.8 | GO:0008941 | nitric oxide dioxygenase activity(GO:0008941) oxidoreductase activity, acting on paired donors, with incorporation or reduction of molecular oxygen, NAD(P)H as one donor, and incorporation of two atoms of oxygen into one donor(GO:0016708) iron-cytochrome-c reductase activity(GO:0047726) |
| 2.6 | 15.5 | GO:0008553 | hydrogen-exporting ATPase activity, phosphorylative mechanism(GO:0008553) |
| 2.5 | 7.4 | GO:0045127 | N-acetylglucosamine kinase activity(GO:0045127) |
| 2.5 | 14.8 | GO:0009922 | fatty acid elongase activity(GO:0009922) 3-oxo-arachidoyl-CoA synthase activity(GO:0102336) 3-oxo-cerotoyl-CoA synthase activity(GO:0102337) 3-oxo-lignoceronyl-CoA synthase activity(GO:0102338) |
| 2.5 | 90.8 | GO:0044183 | protein binding involved in protein folding(GO:0044183) |
| 2.4 | 80.8 | GO:0001671 | ATPase activator activity(GO:0001671) |
| 2.4 | 19.1 | GO:0016846 | carbon-sulfur lyase activity(GO:0016846) |
| 2.4 | 9.5 | GO:0004739 | pyruvate dehydrogenase (acetyl-transferring) activity(GO:0004739) |
| 2.3 | 34.3 | GO:0016174 | NAD(P)H oxidase activity(GO:0016174) |
| 2.2 | 44.9 | GO:0016881 | acid-amino acid ligase activity(GO:0016881) |
| 2.2 | 8.9 | GO:0016532 | superoxide dismutase copper chaperone activity(GO:0016532) small protein activating enzyme binding(GO:0044388) |
| 2.2 | 8.9 | GO:0038025 | reelin receptor activity(GO:0038025) |
| 2.2 | 6.7 | GO:0070644 | vitamin D response element binding(GO:0070644) |
| 2.2 | 84.1 | GO:0005487 | nucleocytoplasmic transporter activity(GO:0005487) |
| 2.2 | 59.0 | GO:0000993 | RNA polymerase II core binding(GO:0000993) |
| 2.2 | 6.5 | GO:0050510 | N-acetylgalactosaminyl-proteoglycan 3-beta-glucuronosyltransferase activity(GO:0050510) |
| 2.0 | 20.0 | GO:0017176 | phosphatidylinositol N-acetylglucosaminyltransferase activity(GO:0017176) |
| 2.0 | 21.5 | GO:0008353 | RNA polymerase II carboxy-terminal domain kinase activity(GO:0008353) |
| 1.9 | 54.2 | GO:0043021 | ribonucleoprotein complex binding(GO:0043021) |
| 1.9 | 11.2 | GO:0016802 | adenosylhomocysteinase activity(GO:0004013) trialkylsulfonium hydrolase activity(GO:0016802) |
| 1.7 | 28.0 | GO:0004526 | ribonuclease P activity(GO:0004526) |
| 1.7 | 371.0 | GO:0003735 | structural constituent of ribosome(GO:0003735) |
| 1.7 | 37.7 | GO:0004707 | MAP kinase activity(GO:0004707) |
| 1.7 | 13.7 | GO:0032137 | guanine/thymine mispair binding(GO:0032137) |
| 1.7 | 5.1 | GO:0000253 | 3-keto sterol reductase activity(GO:0000253) |
| 1.7 | 22.0 | GO:0042609 | CD4 receptor binding(GO:0042609) |
| 1.7 | 48.6 | GO:0005540 | hyaluronic acid binding(GO:0005540) |
| 1.7 | 6.6 | GO:0070259 | tyrosyl-DNA phosphodiesterase activity(GO:0070259) |
| 1.6 | 4.9 | GO:0015235 | cobalamin transporter activity(GO:0015235) |
| 1.6 | 45.4 | GO:0070717 | poly-purine tract binding(GO:0070717) |
| 1.6 | 12.8 | GO:0050833 | pyruvate transmembrane transporter activity(GO:0050833) |
| 1.6 | 42.0 | GO:0051010 | microtubule plus-end binding(GO:0051010) |
| 1.5 | 17.0 | GO:0046790 | virion binding(GO:0046790) |
| 1.5 | 12.2 | GO:0016929 | SUMO-specific protease activity(GO:0016929) |
| 1.5 | 89.1 | GO:0004693 | cyclin-dependent protein serine/threonine kinase activity(GO:0004693) |
| 1.5 | 43.6 | GO:0070182 | DNA polymerase binding(GO:0070182) |
| 1.4 | 11.3 | GO:0048273 | mitogen-activated protein kinase p38 binding(GO:0048273) |
| 1.4 | 11.2 | GO:0000150 | recombinase activity(GO:0000150) |
| 1.4 | 59.3 | GO:0046966 | thyroid hormone receptor binding(GO:0046966) |
| 1.4 | 12.2 | GO:0035877 | death effector domain binding(GO:0035877) |
| 1.3 | 13.2 | GO:0036042 | long-chain fatty acyl-CoA binding(GO:0036042) |
| 1.3 | 11.5 | GO:0035242 | protein-arginine omega-N asymmetric methyltransferase activity(GO:0035242) |
| 1.2 | 27.0 | GO:0098748 | clathrin adaptor activity(GO:0035615) endocytic adaptor activity(GO:0098748) |
| 1.2 | 31.3 | GO:0008574 | ATP-dependent microtubule motor activity, plus-end-directed(GO:0008574) |
| 1.2 | 16.8 | GO:0003680 | AT DNA binding(GO:0003680) |
| 1.2 | 24.7 | GO:0008327 | methyl-CpG binding(GO:0008327) |
| 1.2 | 11.7 | GO:0003906 | DNA-(apurinic or apyrimidinic site) lyase activity(GO:0003906) |
| 1.1 | 43.3 | GO:0008536 | Ran GTPase binding(GO:0008536) |
| 1.1 | 19.8 | GO:0030955 | potassium ion binding(GO:0030955) |
| 1.1 | 50.2 | GO:0005547 | phosphatidylinositol-3,4,5-trisphosphate binding(GO:0005547) |
| 1.1 | 4.3 | GO:0009378 | four-way junction helicase activity(GO:0009378) |
| 1.0 | 60.2 | GO:0016763 | transferase activity, transferring pentosyl groups(GO:0016763) |
| 1.0 | 4.1 | GO:0019826 | oxygen sensor activity(GO:0019826) |
| 1.0 | 12.8 | GO:0098641 | cadherin binding involved in cell-cell adhesion(GO:0098641) |
| 1.0 | 26.4 | GO:0046933 | proton-transporting ATP synthase activity, rotational mechanism(GO:0046933) |
| 1.0 | 56.9 | GO:0003743 | translation initiation factor activity(GO:0003743) |
| 1.0 | 47.1 | GO:0005154 | epidermal growth factor receptor binding(GO:0005154) |
| 1.0 | 44.9 | GO:0042169 | SH2 domain binding(GO:0042169) |
| 0.9 | 14.0 | GO:0004887 | thyroid hormone receptor activity(GO:0004887) |
| 0.9 | 5.6 | GO:0045569 | TRAIL binding(GO:0045569) |
| 0.9 | 19.1 | GO:0050811 | GABA receptor binding(GO:0050811) |
| 0.9 | 17.2 | GO:0016505 | peptidase activator activity involved in apoptotic process(GO:0016505) |
| 0.9 | 56.0 | GO:0035064 | methylated histone binding(GO:0035064) |
| 0.9 | 8.1 | GO:0008312 | 7S RNA binding(GO:0008312) |
| 0.9 | 5.3 | GO:0017150 | tRNA dihydrouridine synthase activity(GO:0017150) |
| 0.9 | 64.2 | GO:0019003 | GDP binding(GO:0019003) |
| 0.9 | 12.2 | GO:0050700 | CARD domain binding(GO:0050700) |
| 0.8 | 18.8 | GO:0070006 | metalloaminopeptidase activity(GO:0070006) |
| 0.8 | 13.5 | GO:0004708 | MAP kinase kinase activity(GO:0004708) |
| 0.8 | 14.2 | GO:0004535 | poly(A)-specific ribonuclease activity(GO:0004535) |
| 0.8 | 4.6 | GO:0015187 | glycine transmembrane transporter activity(GO:0015187) |
| 0.8 | 4.6 | GO:0046979 | TAP2 binding(GO:0046979) |
| 0.8 | 8.3 | GO:0016421 | CoA carboxylase activity(GO:0016421) |
| 0.8 | 8.3 | GO:0019869 | chloride channel inhibitor activity(GO:0019869) |
| 0.7 | 27.5 | GO:0005548 | phospholipid transporter activity(GO:0005548) |
| 0.7 | 13.2 | GO:0004143 | diacylglycerol kinase activity(GO:0004143) |
| 0.7 | 5.0 | GO:0004920 | interleukin-10 receptor activity(GO:0004920) |
| 0.7 | 35.9 | GO:0008137 | NADH dehydrogenase (ubiquinone) activity(GO:0008137) NADH dehydrogenase (quinone) activity(GO:0050136) |
| 0.7 | 9.8 | GO:1990381 | ubiquitin-specific protease binding(GO:1990381) |
| 0.7 | 17.5 | GO:0004003 | ATP-dependent DNA helicase activity(GO:0004003) |
| 0.7 | 3.4 | GO:0004994 | somatostatin receptor activity(GO:0004994) |
| 0.7 | 34.9 | GO:0015485 | cholesterol binding(GO:0015485) |
| 0.7 | 24.1 | GO:0035035 | histone acetyltransferase binding(GO:0035035) |
| 0.7 | 7.8 | GO:0005095 | GTPase inhibitor activity(GO:0005095) |
| 0.6 | 9.1 | GO:0004028 | 3-chloroallyl aldehyde dehydrogenase activity(GO:0004028) |
| 0.6 | 27.7 | GO:0003785 | actin monomer binding(GO:0003785) |
| 0.6 | 9.4 | GO:0048027 | mRNA 5'-UTR binding(GO:0048027) |
| 0.6 | 40.3 | GO:0016776 | phosphotransferase activity, phosphate group as acceptor(GO:0016776) |
| 0.6 | 2.5 | GO:0004312 | fatty acid synthase activity(GO:0004312) |
| 0.6 | 5.5 | GO:0038085 | vascular endothelial growth factor binding(GO:0038085) |
| 0.6 | 17.7 | GO:0031492 | nucleosomal DNA binding(GO:0031492) |
| 0.6 | 10.1 | GO:0030881 | beta-2-microglobulin binding(GO:0030881) |
| 0.6 | 15.4 | GO:0016504 | peptidase activator activity(GO:0016504) |
| 0.6 | 4.1 | GO:0016167 | glial cell-derived neurotrophic factor receptor activity(GO:0016167) |
| 0.6 | 17.2 | GO:0017134 | fibroblast growth factor binding(GO:0017134) |
| 0.6 | 3.9 | GO:0097157 | pre-mRNA intronic binding(GO:0097157) |
| 0.6 | 7.2 | GO:0051537 | 2 iron, 2 sulfur cluster binding(GO:0051537) |
| 0.5 | 23.3 | GO:0061631 | ubiquitin conjugating enzyme activity(GO:0061631) ubiquitin-like protein conjugating enzyme activity(GO:0061650) |
| 0.5 | 10.0 | GO:0031491 | nucleosome binding(GO:0031491) |
| 0.5 | 8.2 | GO:0019966 | interleukin-1 binding(GO:0019966) |
| 0.5 | 8.0 | GO:0008179 | adenylate cyclase binding(GO:0008179) |
| 0.5 | 27.8 | GO:0008186 | RNA-dependent ATPase activity(GO:0008186) |
| 0.5 | 4.4 | GO:0032190 | acrosin binding(GO:0032190) |
| 0.5 | 29.1 | GO:0003684 | damaged DNA binding(GO:0003684) |
| 0.4 | 5.8 | GO:0016018 | cyclosporin A binding(GO:0016018) |
| 0.4 | 72.9 | GO:0005200 | structural constituent of cytoskeleton(GO:0005200) |
| 0.4 | 1.7 | GO:0004809 | tRNA (guanine-N2-)-methyltransferase activity(GO:0004809) |
| 0.4 | 5.8 | GO:0031996 | thioesterase binding(GO:0031996) |
| 0.4 | 7.6 | GO:0016500 | protein-hormone receptor activity(GO:0016500) |
| 0.4 | 3.1 | GO:0016842 | amidine-lyase activity(GO:0016842) |
| 0.4 | 21.8 | GO:0005246 | calcium channel regulator activity(GO:0005246) |
| 0.4 | 15.8 | GO:0008138 | protein tyrosine/serine/threonine phosphatase activity(GO:0008138) |
| 0.4 | 27.5 | GO:0032947 | protein complex scaffold(GO:0032947) |
| 0.4 | 12.6 | GO:0051721 | protein phosphatase 2A binding(GO:0051721) |
| 0.3 | 5.9 | GO:0000175 | 3'-5'-exoribonuclease activity(GO:0000175) |
| 0.3 | 2.7 | GO:0008175 | tRNA methyltransferase activity(GO:0008175) |
| 0.3 | 9.2 | GO:0051059 | NF-kappaB binding(GO:0051059) |
| 0.3 | 13.5 | GO:0016875 | aminoacyl-tRNA ligase activity(GO:0004812) ligase activity, forming carbon-oxygen bonds(GO:0016875) ligase activity, forming aminoacyl-tRNA and related compounds(GO:0016876) |
| 0.3 | 7.4 | GO:0051019 | mitogen-activated protein kinase binding(GO:0051019) |
| 0.3 | 1.0 | GO:0004768 | stearoyl-CoA 9-desaturase activity(GO:0004768) acyl-CoA desaturase activity(GO:0016215) |
| 0.3 | 1.5 | GO:0016882 | cyclo-ligase activity(GO:0016882) |
| 0.3 | 2.7 | GO:0003876 | AMP deaminase activity(GO:0003876) adenosine-phosphate deaminase activity(GO:0047623) |
| 0.3 | 384.3 | GO:0003723 | RNA binding(GO:0003723) |
| 0.3 | 2.2 | GO:0035174 | histone serine kinase activity(GO:0035174) |
| 0.3 | 6.7 | GO:0001078 | transcriptional repressor activity, RNA polymerase II core promoter proximal region sequence-specific binding(GO:0001078) |
| 0.3 | 1.5 | GO:0019531 | oxalate transmembrane transporter activity(GO:0019531) |
| 0.2 | 1.4 | GO:0016884 | carbon-nitrogen ligase activity, with glutamine as amido-N-donor(GO:0016884) |
| 0.2 | 1.9 | GO:0043225 | anion transmembrane-transporting ATPase activity(GO:0043225) |
| 0.2 | 1.4 | GO:0050693 | LBD domain binding(GO:0050693) |
| 0.2 | 63.2 | GO:0005525 | GTP binding(GO:0005525) |
| 0.2 | 5.9 | GO:0015002 | cytochrome-c oxidase activity(GO:0004129) heme-copper terminal oxidase activity(GO:0015002) oxidoreductase activity, acting on a heme group of donors, oxygen as acceptor(GO:0016676) |
| 0.2 | 5.1 | GO:0030544 | Hsp70 protein binding(GO:0030544) |
| 0.2 | 7.9 | GO:0016709 | oxidoreductase activity, acting on paired donors, with incorporation or reduction of molecular oxygen, NAD(P)H as one donor, and incorporation of one atom of oxygen(GO:0016709) |
| 0.2 | 11.0 | GO:0000979 | RNA polymerase II core promoter sequence-specific DNA binding(GO:0000979) |
| 0.2 | 10.9 | GO:0048306 | calcium-dependent protein binding(GO:0048306) |
| 0.2 | 8.7 | GO:0033613 | activating transcription factor binding(GO:0033613) |
| 0.2 | 2.9 | GO:0048018 | receptor agonist activity(GO:0048018) |
| 0.1 | 13.6 | GO:0042393 | histone binding(GO:0042393) |
| 0.1 | 1.4 | GO:0001135 | transcription factor activity, RNA polymerase II transcription factor recruiting(GO:0001135) |
| 0.1 | 0.5 | GO:0003990 | acetylcholinesterase activity(GO:0003990) |
| 0.1 | 9.0 | GO:0016765 | transferase activity, transferring alkyl or aryl (other than methyl) groups(GO:0016765) |
| 0.1 | 3.8 | GO:0050699 | WW domain binding(GO:0050699) |
| 0.1 | 1.4 | GO:0005132 | type I interferon receptor binding(GO:0005132) |
| 0.1 | 1.4 | GO:0008140 | cAMP response element binding protein binding(GO:0008140) |
| 0.1 | 10.1 | GO:0044325 | ion channel binding(GO:0044325) |
| 0.1 | 2.0 | GO:0002039 | p53 binding(GO:0002039) |
| 0.1 | 1.3 | GO:0004697 | protein kinase C activity(GO:0004697) |
| 0.1 | 0.6 | GO:0001056 | RNA polymerase III activity(GO:0001056) |
| 0.1 | 0.3 | GO:0052832 | inositol monophosphate 1-phosphatase activity(GO:0008934) inositol monophosphate 3-phosphatase activity(GO:0052832) inositol monophosphate 4-phosphatase activity(GO:0052833) inositol monophosphate phosphatase activity(GO:0052834) |
| 0.1 | 23.9 | GO:0000978 | RNA polymerase II core promoter proximal region sequence-specific DNA binding(GO:0000978) |
| 0.1 | 0.4 | GO:0072320 | volume-sensitive chloride channel activity(GO:0072320) |
| 0.1 | 1.3 | GO:0070008 | serine-type exopeptidase activity(GO:0070008) |
| 0.0 | 2.0 | GO:0034987 | immunoglobulin receptor binding(GO:0034987) |
| 0.0 | 1.0 | GO:0001848 | complement binding(GO:0001848) |
| 0.0 | 1.6 | GO:0015078 | hydrogen ion transmembrane transporter activity(GO:0015078) |
| 0.0 | 4.4 | GO:0005178 | integrin binding(GO:0005178) |
| 0.0 | 0.7 | GO:0002020 | protease binding(GO:0002020) |
| 0.0 | 0.5 | GO:0004115 | 3',5'-cyclic-AMP phosphodiesterase activity(GO:0004115) |
| 0.0 | 0.2 | GO:0030331 | estrogen receptor binding(GO:0030331) |
Gene overrepresentation in C2:CP category:
| Log-likelihood per target | Total log-likelihood | Term | Description |
|---|---|---|---|
| 4.1 | 213.4 | PID MYC PATHWAY | C-MYC pathway |
| 3.1 | 107.0 | PID HDAC CLASSIII PATHWAY | Signaling events mediated by HDAC Class III |
| 2.5 | 278.7 | PID MYC ACTIV PATHWAY | Validated targets of C-MYC transcriptional activation |
| 2.1 | 128.8 | PID AURORA B PATHWAY | Aurora B signaling |
| 1.8 | 28.5 | SA REG CASCADE OF CYCLIN EXPR | Expression of cyclins regulates progression through the cell cycle by activating cyclin-dependent kinases. |
| 1.6 | 61.4 | PID INSULIN GLUCOSE PATHWAY | Insulin-mediated glucose transport |
| 1.6 | 58.2 | PID FOXM1 PATHWAY | FOXM1 transcription factor network |
| 1.5 | 16.1 | PID IL5 PATHWAY | IL5-mediated signaling events |
| 1.5 | 138.1 | PID TELOMERASE PATHWAY | Regulation of Telomerase |
| 1.2 | 30.7 | ST INTERLEUKIN 4 PATHWAY | Interleukin 4 (IL-4) Pathway |
| 1.1 | 39.6 | PID BARD1 PATHWAY | BARD1 signaling events |
| 1.1 | 25.0 | PID ERB GENOMIC PATHWAY | Validated nuclear estrogen receptor beta network |
| 1.0 | 28.2 | PID FANCONI PATHWAY | Fanconi anemia pathway |
| 1.0 | 63.1 | PID NOTCH PATHWAY | Notch signaling pathway |
| 0.9 | 42.6 | SIG REGULATION OF THE ACTIN CYTOSKELETON BY RHO GTPASES | Genes related to regulation of the actin cytoskeleton |
| 0.9 | 68.3 | PID E2F PATHWAY | E2F transcription factor network |
| 0.9 | 22.1 | PID CIRCADIAN PATHWAY | Circadian rhythm pathway |
| 0.9 | 44.0 | PID PLK1 PATHWAY | PLK1 signaling events |
| 0.9 | 39.6 | PID NCADHERIN PATHWAY | N-cadherin signaling events |
| 0.9 | 60.5 | PID ERBB1 INTERNALIZATION PATHWAY | Internalization of ErbB1 |
| 0.8 | 39.8 | PID P53 REGULATION PATHWAY | p53 pathway |
| 0.8 | 20.6 | PID HIF1A PATHWAY | Hypoxic and oxygen homeostasis regulation of HIF-1-alpha |
| 0.8 | 39.0 | PID INTEGRIN A4B1 PATHWAY | Alpha4 beta1 integrin signaling events |
| 0.8 | 21.5 | PID RETINOIC ACID PATHWAY | Retinoic acid receptors-mediated signaling |
| 0.8 | 14.5 | PID PRL SIGNALING EVENTS PATHWAY | Signaling events mediated by PRL |
| 0.7 | 6.9 | PID ECADHERIN KERATINOCYTE PATHWAY | E-cadherin signaling in keratinocytes |
| 0.7 | 27.5 | PID SYNDECAN 2 PATHWAY | Syndecan-2-mediated signaling events |
| 0.7 | 26.1 | SIG INSULIN RECEPTOR PATHWAY IN CARDIAC MYOCYTES | Genes related to the insulin receptor pathway |
| 0.5 | 41.9 | ST FAS SIGNALING PATHWAY | Fas Signaling Pathway |
| 0.5 | 8.4 | PID P38 MK2 PATHWAY | p38 signaling mediated by MAPKAP kinases |
| 0.5 | 14.7 | PID NETRIN PATHWAY | Netrin-mediated signaling events |
| 0.5 | 9.4 | SIG CD40PATHWAYMAP | Genes related to CD40 signaling |
| 0.5 | 9.7 | PID ATM PATHWAY | ATM pathway |
| 0.4 | 15.2 | PID MAPK TRK PATHWAY | Trk receptor signaling mediated by the MAPK pathway |
| 0.4 | 20.8 | PID LKB1 PATHWAY | LKB1 signaling events |
| 0.4 | 6.5 | PID ALK2 PATHWAY | ALK2 signaling events |
| 0.3 | 7.9 | PID REELIN PATHWAY | Reelin signaling pathway |
| 0.3 | 18.5 | PID IL4 2PATHWAY | IL4-mediated signaling events |
| 0.3 | 16.0 | PID CDC42 PATHWAY | CDC42 signaling events |
| 0.3 | 5.5 | PID VEGF VEGFR PATHWAY | VEGF and VEGFR signaling network |
| 0.3 | 17.7 | PID REG GR PATHWAY | Glucocorticoid receptor regulatory network |
| 0.3 | 11.8 | PID MTOR 4PATHWAY | mTOR signaling pathway |
| 0.3 | 11.3 | PID CERAMIDE PATHWAY | Ceramide signaling pathway |
| 0.3 | 20.7 | PID CMYB PATHWAY | C-MYB transcription factor network |
| 0.3 | 5.6 | PID TRAIL PATHWAY | TRAIL signaling pathway |
| 0.2 | 12.2 | PID TGFBR PATHWAY | TGF-beta receptor signaling |
| 0.2 | 11.5 | PID CD8 TCR DOWNSTREAM PATHWAY | Downstream signaling in naïve CD8+ T cells |
| 0.2 | 4.9 | PID S1P S1P1 PATHWAY | S1P1 pathway |
| 0.2 | 8.9 | PID ALPHA SYNUCLEIN PATHWAY | Alpha-synuclein signaling |
| 0.2 | 10.5 | PID MYC REPRESS PATHWAY | Validated targets of C-MYC transcriptional repression |
| 0.2 | 1.7 | PID RANBP2 PATHWAY | Sumoylation by RanBP2 regulates transcriptional repression |
| 0.2 | 4.1 | PID RET PATHWAY | Signaling events regulated by Ret tyrosine kinase |
| 0.2 | 6.4 | PID ARF6 TRAFFICKING PATHWAY | Arf6 trafficking events |
| 0.2 | 2.9 | PID WNT NONCANONICAL PATHWAY | Noncanonical Wnt signaling pathway |
| 0.1 | 3.2 | PID SYNDECAN 4 PATHWAY | Syndecan-4-mediated signaling events |
| 0.1 | 4.4 | PID BCR 5PATHWAY | BCR signaling pathway |
| 0.1 | 4.0 | PID ARF6 PATHWAY | Arf6 signaling events |
| 0.1 | 2.2 | PID PS1 PATHWAY | Presenilin action in Notch and Wnt signaling |
| 0.1 | 1.4 | PID TCR CALCIUM PATHWAY | Calcium signaling in the CD4+ TCR pathway |
| 0.0 | 0.5 | PID FOXO PATHWAY | FoxO family signaling |
| 0.0 | 1.4 | PID SMAD2 3NUCLEAR PATHWAY | Regulation of nuclear SMAD2/3 signaling |
| 0.0 | 0.5 | PID ATF2 PATHWAY | ATF-2 transcription factor network |
Gene overrepresentation in C2:CP:REACTOME category:
| Log-likelihood per target | Total log-likelihood | Term | Description |
|---|---|---|---|
| 8.1 | 128.9 | REACTOME SLBP DEPENDENT PROCESSING OF REPLICATION DEPENDENT HISTONE PRE MRNAS | Genes involved in SLBP Dependent Processing of Replication-Dependent Histone Pre-mRNAs |
| 7.9 | 181.6 | REACTOME RNA POL III CHAIN ELONGATION | Genes involved in RNA Polymerase III Chain Elongation |
| 6.1 | 450.6 | REACTOME CDK MEDIATED PHOSPHORYLATION AND REMOVAL OF CDC6 | Genes involved in CDK-mediated phosphorylation and removal of Cdc6 |
| 5.3 | 15.8 | REACTOME APC C CDH1 MEDIATED DEGRADATION OF CDC20 AND OTHER APC C CDH1 TARGETED PROTEINS IN LATE MITOSIS EARLY G1 | Genes involved in APC/C:Cdh1 mediated degradation of Cdc20 and other APC/C:Cdh1 targeted proteins in late mitosis/early G1 |
| 5.2 | 87.9 | REACTOME PURINE RIBONUCLEOSIDE MONOPHOSPHATE BIOSYNTHESIS | Genes involved in Purine ribonucleoside monophosphate biosynthesis |
| 4.1 | 57.1 | REACTOME VITAMIN B5 PANTOTHENATE METABOLISM | Genes involved in Vitamin B5 (pantothenate) metabolism |
| 3.8 | 56.8 | REACTOME POL SWITCHING | Genes involved in Polymerase switching |
| 3.7 | 119.2 | REACTOME RNA POL II TRANSCRIPTION PRE INITIATION AND PROMOTER OPENING | Genes involved in RNA Polymerase II Transcription Pre-Initiation And Promoter Opening |
| 3.6 | 64.9 | REACTOME INTEGRATION OF PROVIRUS | Genes involved in Integration of provirus |
| 3.5 | 52.9 | REACTOME MRNA DECAY BY 5 TO 3 EXORIBONUCLEASE | Genes involved in mRNA Decay by 5' to 3' Exoribonuclease |
| 3.2 | 340.8 | REACTOME MITOTIC PROMETAPHASE | Genes involved in Mitotic Prometaphase |
| 3.2 | 79.7 | REACTOME CYCLIN A B1 ASSOCIATED EVENTS DURING G2 M TRANSITION | Genes involved in Cyclin A/B1 associated events during G2/M transition |
| 3.0 | 54.0 | REACTOME BASE FREE SUGAR PHOSPHATE REMOVAL VIA THE SINGLE NUCLEOTIDE REPLACEMENT PATHWAY | Genes involved in Base-free sugar-phosphate removal via the single-nucleotide replacement pathway |
| 2.9 | 93.4 | REACTOME TRANSFERRIN ENDOCYTOSIS AND RECYCLING | Genes involved in Transferrin endocytosis and recycling |
| 2.9 | 61.2 | REACTOME ENDOSOMAL SORTING COMPLEX REQUIRED FOR TRANSPORT ESCRT | Genes involved in Endosomal Sorting Complex Required For Transport (ESCRT) |
| 2.9 | 94.6 | REACTOME POST TRANSLATIONAL MODIFICATION SYNTHESIS OF GPI ANCHORED PROTEINS | Genes involved in Post-translational modification: synthesis of GPI-anchored proteins |
| 2.9 | 97.4 | REACTOME SYNTHESIS AND INTERCONVERSION OF NUCLEOTIDE DI AND TRIPHOSPHATES | Genes involved in Synthesis and interconversion of nucleotide di- and triphosphates |
| 2.8 | 109.0 | REACTOME PREFOLDIN MEDIATED TRANSFER OF SUBSTRATE TO CCT TRIC | Genes involved in Prefoldin mediated transfer of substrate to CCT/TriC |
| 2.7 | 362.4 | REACTOME MRNA SPLICING | Genes involved in mRNA Splicing |
| 2.6 | 52.1 | REACTOME REGULATION OF RHEB GTPASE ACTIVITY BY AMPK | Genes involved in Regulation of Rheb GTPase activity by AMPK |
| 2.6 | 48.6 | REACTOME HYALURONAN UPTAKE AND DEGRADATION | Genes involved in Hyaluronan uptake and degradation |
| 2.3 | 46.7 | REACTOME KINESINS | Genes involved in Kinesins |
| 2.3 | 144.4 | REACTOME MITOCHONDRIAL PROTEIN IMPORT | Genes involved in Mitochondrial Protein Import |
| 2.3 | 37.2 | REACTOME UNWINDING OF DNA | Genes involved in Unwinding of DNA |
| 2.1 | 158.9 | REACTOME FORMATION OF THE TERNARY COMPLEX AND SUBSEQUENTLY THE 43S COMPLEX | Genes involved in Formation of the ternary complex, and subsequently, the 43S complex |
| 2.1 | 19.0 | REACTOME VIF MEDIATED DEGRADATION OF APOBEC3G | Genes involved in Vif-mediated degradation of APOBEC3G |
| 2.0 | 211.5 | REACTOME PEPTIDE CHAIN ELONGATION | Genes involved in Peptide chain elongation |
| 2.0 | 109.5 | REACTOME TRNA AMINOACYLATION | Genes involved in tRNA Aminoacylation |
| 2.0 | 56.6 | REACTOME AMINO ACID SYNTHESIS AND INTERCONVERSION TRANSAMINATION | Genes involved in Amino acid synthesis and interconversion (transamination) |
| 2.0 | 23.8 | REACTOME IRAK1 RECRUITS IKK COMPLEX | Genes involved in IRAK1 recruits IKK complex |
| 1.9 | 30.9 | REACTOME FORMATION OF INCISION COMPLEX IN GG NER | Genes involved in Formation of incision complex in GG-NER |
| 1.9 | 40.4 | REACTOME TETRAHYDROBIOPTERIN BH4 SYNTHESIS RECYCLING SALVAGE AND REGULATION | Genes involved in Tetrahydrobiopterin (BH4) synthesis, recycling, salvage and regulation |
| 1.9 | 47.9 | REACTOME ACTIVATION OF BH3 ONLY PROTEINS | Genes involved in Activation of BH3-only proteins |
| 1.9 | 22.8 | REACTOME NOTCH HLH TRANSCRIPTION PATHWAY | Genes involved in Notch-HLH transcription pathway |
| 1.9 | 32.0 | REACTOME SYNTHESIS SECRETION AND DEACYLATION OF GHRELIN | Genes involved in Synthesis, Secretion, and Deacylation of Ghrelin |
| 1.8 | 45.1 | REACTOME PURINE SALVAGE | Genes involved in Purine salvage |
| 1.7 | 12.0 | REACTOME PRE NOTCH TRANSCRIPTION AND TRANSLATION | Genes involved in Pre-NOTCH Transcription and Translation |
| 1.6 | 28.5 | REACTOME ACTIVATION OF THE PRE REPLICATIVE COMPLEX | Genes involved in Activation of the pre-replicative complex |
| 1.5 | 13.9 | REACTOME MRNA DECAY BY 3 TO 5 EXORIBONUCLEASE | Genes involved in mRNA Decay by 3' to 5' Exoribonuclease |
| 1.5 | 21.6 | REACTOME SIGNALING BY NOTCH2 | Genes involved in Signaling by NOTCH2 |
| 1.5 | 41.3 | REACTOME PROTEOLYTIC CLEAVAGE OF SNARE COMPLEX PROTEINS | Genes involved in Proteolytic cleavage of SNARE complex proteins |
| 1.5 | 14.7 | REACTOME ENDOSOMAL VACUOLAR PATHWAY | Genes involved in Endosomal/Vacuolar pathway |
| 1.5 | 35.2 | REACTOME METABOLISM OF POLYAMINES | Genes involved in Metabolism of polyamines |
| 1.4 | 44.5 | REACTOME MEIOTIC RECOMBINATION | Genes involved in Meiotic Recombination |
| 1.2 | 27.0 | REACTOME RETROGRADE NEUROTROPHIN SIGNALLING | Genes involved in Retrograde neurotrophin signalling |
| 1.2 | 24.3 | REACTOME DESTABILIZATION OF MRNA BY AUF1 HNRNP D0 | Genes involved in Destabilization of mRNA by AUF1 (hnRNP D0) |
| 1.2 | 14.2 | REACTOME RNA POL III TRANSCRIPTION INITIATION FROM TYPE 3 PROMOTER | Genes involved in RNA Polymerase III Transcription Initiation From Type 3 Promoter |
| 1.1 | 20.6 | REACTOME MITOCHONDRIAL FATTY ACID BETA OXIDATION | Genes involved in Mitochondrial Fatty Acid Beta-Oxidation |
| 1.1 | 24.8 | REACTOME G BETA GAMMA SIGNALLING THROUGH PLC BETA | Genes involved in G beta:gamma signalling through PLC beta |
| 1.0 | 39.0 | REACTOME REGULATION OF INSULIN SECRETION BY GLUCAGON LIKE PEPTIDE1 | Genes involved in Regulation of Insulin Secretion by Glucagon-like Peptide-1 |
| 1.0 | 26.5 | REACTOME OXYGEN DEPENDENT PROLINE HYDROXYLATION OF HYPOXIA INDUCIBLE FACTOR ALPHA | Genes involved in Oxygen-dependent Proline Hydroxylation of Hypoxia-inducible Factor Alpha |
| 1.0 | 15.2 | REACTOME SIGNALLING TO P38 VIA RIT AND RIN | Genes involved in Signalling to p38 via RIT and RIN |
| 1.0 | 13.3 | REACTOME DEPOSITION OF NEW CENPA CONTAINING NUCLEOSOMES AT THE CENTROMERE | Genes involved in Deposition of New CENPA-containing Nucleosomes at the Centromere |
| 0.9 | 26.5 | REACTOME HORMONE SENSITIVE LIPASE HSL MEDIATED TRIACYLGLYCEROL HYDROLYSIS | Genes involved in Hormone-sensitive lipase (HSL)-mediated triacylglycerol hydrolysis |
| 0.9 | 30.8 | REACTOME PYRIMIDINE METABOLISM | Genes involved in Pyrimidine metabolism |
| 0.9 | 11.7 | REACTOME ER PHAGOSOME PATHWAY | Genes involved in ER-Phagosome pathway |
| 0.9 | 11.2 | REACTOME NFKB ACTIVATION THROUGH FADD RIP1 PATHWAY MEDIATED BY CASPASE 8 AND10 | Genes involved in NF-kB activation through FADD/RIP-1 pathway mediated by caspase-8 and -10 |
| 0.8 | 27.2 | REACTOME SPHINGOLIPID DE NOVO BIOSYNTHESIS | Genes involved in Sphingolipid de novo biosynthesis |
| 0.8 | 37.8 | REACTOME SIGNALING BY ROBO RECEPTOR | Genes involved in Signaling by Robo receptor |
| 0.7 | 71.6 | REACTOME RNA POL I RNA POL III AND MITOCHONDRIAL TRANSCRIPTION | Genes involved in RNA Polymerase I, RNA Polymerase III, and Mitochondrial Transcription |
| 0.7 | 6.6 | REACTOME DOUBLE STRAND BREAK REPAIR | Genes involved in Double-Strand Break Repair |
| 0.7 | 59.8 | REACTOME RESPIRATORY ELECTRON TRANSPORT | Genes involved in Respiratory electron transport |
| 0.7 | 14.8 | REACTOME SYNTHESIS OF VERY LONG CHAIN FATTY ACYL COAS | Genes involved in Synthesis of very long-chain fatty acyl-CoAs |
| 0.7 | 8.9 | REACTOME PLATELET SENSITIZATION BY LDL | Genes involved in Platelet sensitization by LDL |
| 0.6 | 10.9 | REACTOME NEPHRIN INTERACTIONS | Genes involved in Nephrin interactions |
| 0.6 | 7.6 | REACTOME EXTENSION OF TELOMERES | Genes involved in Extension of Telomeres |
| 0.6 | 21.7 | REACTOME HOST INTERACTIONS OF HIV FACTORS | Genes involved in Host Interactions of HIV factors |
| 0.6 | 12.9 | REACTOME SIGNALING BY CONSTITUTIVELY ACTIVE EGFR | Genes involved in Signaling by constitutively active EGFR |
| 0.5 | 8.8 | REACTOME PECAM1 INTERACTIONS | Genes involved in PECAM1 interactions |
| 0.4 | 4.4 | REACTOME ACTIVATION OF ATR IN RESPONSE TO REPLICATION STRESS | Genes involved in Activation of ATR in response to replication stress |
| 0.4 | 18.8 | REACTOME GLYCOLYSIS | Genes involved in Glycolysis |
| 0.4 | 9.4 | REACTOME DEADENYLATION DEPENDENT MRNA DECAY | Genes involved in Deadenylation-dependent mRNA decay |
| 0.4 | 8.1 | REACTOME NONSENSE MEDIATED DECAY ENHANCED BY THE EXON JUNCTION COMPLEX | Genes involved in Nonsense Mediated Decay Enhanced by the Exon Junction Complex |
| 0.4 | 13.2 | REACTOME EFFECTS OF PIP2 HYDROLYSIS | Genes involved in Effects of PIP2 hydrolysis |
| 0.3 | 5.5 | REACTOME SEMA3A PLEXIN REPULSION SIGNALING BY INHIBITING INTEGRIN ADHESION | Genes involved in SEMA3A-Plexin repulsion signaling by inhibiting Integrin adhesion |
| 0.3 | 15.1 | REACTOME G1 PHASE | Genes involved in G1 Phase |
| 0.3 | 23.8 | REACTOME ANTIVIRAL MECHANISM BY IFN STIMULATED GENES | Genes involved in Antiviral mechanism by IFN-stimulated genes |
| 0.3 | 53.1 | REACTOME ANTIGEN PROCESSING UBIQUITINATION PROTEASOME DEGRADATION | Genes involved in Antigen processing: Ubiquitination & Proteasome degradation |
| 0.3 | 10.0 | REACTOME CHOLESTEROL BIOSYNTHESIS | Genes involved in Cholesterol biosynthesis |
| 0.3 | 8.2 | REACTOME SIGNALING BY HIPPO | Genes involved in Signaling by Hippo |
| 0.3 | 3.5 | REACTOME MRNA PROCESSING | Genes involved in mRNA Processing |
| 0.3 | 4.3 | REACTOME FANCONI ANEMIA PATHWAY | Genes involved in Fanconi Anemia pathway |
| 0.3 | 31.0 | REACTOME RESPONSE TO ELEVATED PLATELET CYTOSOLIC CA2 | Genes involved in Response to elevated platelet cytosolic Ca2+ |
| 0.3 | 5.6 | REACTOME EXTRINSIC PATHWAY FOR APOPTOSIS | Genes involved in Extrinsic Pathway for Apoptosis |
| 0.2 | 1.0 | REACTOME ALPHA LINOLENIC ACID ALA METABOLISM | Genes involved in alpha-linolenic acid (ALA) metabolism |
| 0.2 | 2.2 | REACTOME CTNNB1 PHOSPHORYLATION CASCADE | Genes involved in Beta-catenin phosphorylation cascade |
| 0.2 | 6.5 | REACTOME CHONDROITIN SULFATE BIOSYNTHESIS | Genes involved in Chondroitin sulfate biosynthesis |
| 0.2 | 5.5 | REACTOME METABOLISM OF PORPHYRINS | Genes involved in Metabolism of porphyrins |
| 0.2 | 3.1 | REACTOME N GLYCAN TRIMMING IN THE ER AND CALNEXIN CALRETICULIN CYCLE | Genes involved in N-glycan trimming in the ER and Calnexin/Calreticulin cycle |
| 0.2 | 0.7 | REACTOME CIRCADIAN REPRESSION OF EXPRESSION BY REV ERBA | Genes involved in Circadian Repression of Expression by REV-ERBA |
| 0.1 | 6.4 | REACTOME O LINKED GLYCOSYLATION OF MUCINS | Genes involved in O-linked glycosylation of mucins |
| 0.1 | 6.7 | REACTOME MYOGENESIS | Genes involved in Myogenesis |
| 0.1 | 8.7 | REACTOME LOSS OF NLP FROM MITOTIC CENTROSOMES | Genes involved in Loss of Nlp from mitotic centrosomes |
| 0.1 | 3.2 | REACTOME FORMATION OF FIBRIN CLOT CLOTTING CASCADE | Genes involved in Formation of Fibrin Clot (Clotting Cascade) |
| 0.1 | 1.8 | REACTOME ACTIVATED TAK1 MEDIATES P38 MAPK ACTIVATION | Genes involved in activated TAK1 mediates p38 MAPK activation |
| 0.1 | 4.8 | REACTOME TRANSLATION | Genes involved in Translation |
| 0.1 | 1.6 | REACTOME FORMATION OF ATP BY CHEMIOSMOTIC COUPLING | Genes involved in Formation of ATP by chemiosmotic coupling |
| 0.1 | 3.5 | REACTOME NETRIN1 SIGNALING | Genes involved in Netrin-1 signaling |
| 0.1 | 8.9 | REACTOME L1CAM INTERACTIONS | Genes involved in L1CAM interactions |
| 0.1 | 10.7 | REACTOME SIGNALING BY RHO GTPASES | Genes involved in Signaling by Rho GTPases |
| 0.1 | 3.4 | REACTOME NRAGE SIGNALS DEATH THROUGH JNK | Genes involved in NRAGE signals death through JNK |
| 0.1 | 1.4 | REACTOME REGULATION OF IFNA SIGNALING | Genes involved in Regulation of IFNA signaling |
| 0.0 | 1.0 | REACTOME REGULATION OF COMPLEMENT CASCADE | Genes involved in Regulation of Complement cascade |
| 0.0 | 0.6 | REACTOME PRE NOTCH PROCESSING IN GOLGI | Genes involved in Pre-NOTCH Processing in Golgi |
| 0.0 | 0.7 | REACTOME GABA SYNTHESIS RELEASE REUPTAKE AND DEGRADATION | Genes involved in GABA synthesis, release, reuptake and degradation |
| 0.0 | 0.4 | REACTOME SYNTHESIS OF PIPS AT THE PLASMA MEMBRANE | Genes involved in Synthesis of PIPs at the plasma membrane |