Project
GNF SymAtlas + NCI-60 cancer cell lines, comparison of cancers vs non-cancers, human (Su, 2004; Ross, 2000)
Navigation
Downloads
Results for GSC_GSC2
Z-value: 0.51
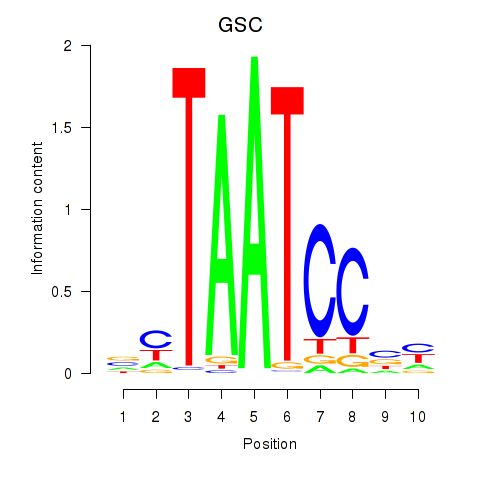
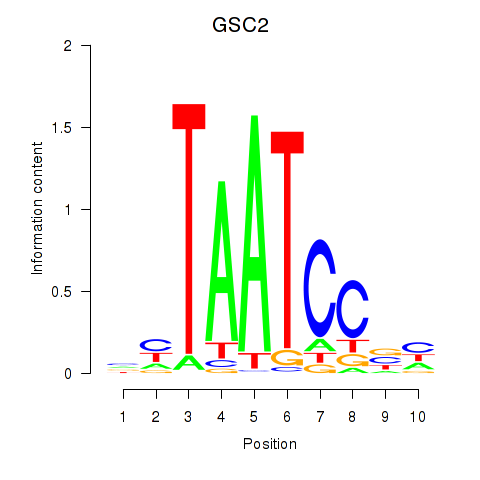
Motif logo
Transcription factors associated with GSC_GSC2
| Gene Symbol | Gene ID | Gene Info |
|---|---|---|
|
GSC
|
ENSG00000133937.3 | goosecoid homeobox |
|
GSC2
|
ENSG00000063515.2 | goosecoid homeobox 2 |
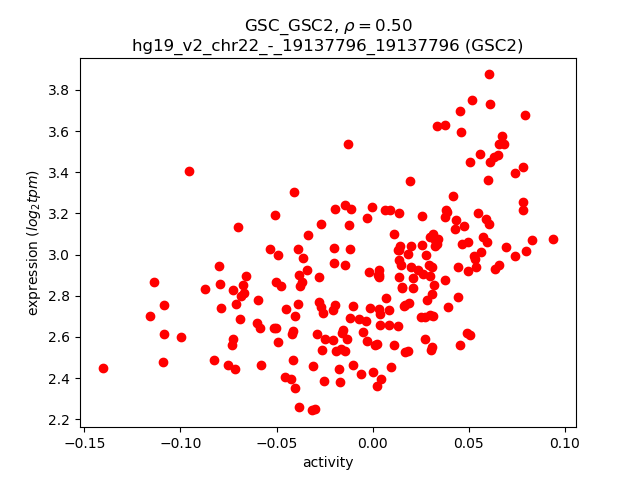
Activity-expression correlation:
| Gene | Promoter | Pearson corr. coef. | P-value | Plot |
|---|---|---|---|---|
| GSC2 | hg19_v2_chr22_-_19137796_19137796 | 0.50 | 3.2e-15 | Click! |
Activity profile of GSC_GSC2 motif
Sorted Z-values of GSC_GSC2 motif
| Promoter | Log-likelihood | Transcript | Gene | Gene Info |
|---|---|---|---|---|
| chr1_+_169079823 | 26.71 |
ENST00000367813.3
|
ATP1B1
|
ATPase, Na+/K+ transporting, beta 1 polypeptide |
| chr2_-_175711133 | 21.32 |
ENST00000409597.1
ENST00000413882.1 |
CHN1
|
chimerin 1 |
| chr11_-_111794446 | 16.48 |
ENST00000527950.1
|
CRYAB
|
crystallin, alpha B |
| chr11_-_111783595 | 14.66 |
ENST00000528628.1
|
CRYAB
|
crystallin, alpha B |
| chr6_+_111580508 | 14.01 |
ENST00000368847.4
|
KIAA1919
|
KIAA1919 |
| chr14_-_101034407 | 12.03 |
ENST00000443071.2
ENST00000557378.1 |
BEGAIN
|
brain-enriched guanylate kinase-associated |
| chr11_-_76155618 | 11.94 |
ENST00000530759.1
|
RP11-111M22.3
|
RP11-111M22.3 |
| chr11_-_76155700 | 11.85 |
ENST00000572035.1
|
RP11-111M22.3
|
RP11-111M22.3 |
| chr9_+_17134980 | 9.82 |
ENST00000380647.3
|
CNTLN
|
centlein, centrosomal protein |
| chrX_-_54384425 | 9.67 |
ENST00000375169.3
ENST00000354646.2 |
WNK3
|
WNK lysine deficient protein kinase 3 |
| chr19_-_36247910 | 9.36 |
ENST00000587965.1
ENST00000004982.3 |
HSPB6
|
heat shock protein, alpha-crystallin-related, B6 |
| chrX_+_135279179 | 8.24 |
ENST00000370676.3
|
FHL1
|
four and a half LIM domains 1 |
| chrX_+_100333709 | 8.23 |
ENST00000372930.4
|
TMEM35
|
transmembrane protein 35 |
| chr1_+_20396649 | 8.15 |
ENST00000375108.3
|
PLA2G5
|
phospholipase A2, group V |
| chr20_-_18774614 | 8.10 |
ENST00000412553.1
|
LINC00652
|
long intergenic non-protein coding RNA 652 |
| chr9_-_13279563 | 8.07 |
ENST00000541718.1
|
MPDZ
|
multiple PDZ domain protein |
| chr7_-_97881429 | 7.88 |
ENST00000420697.1
ENST00000379795.3 ENST00000415086.1 ENST00000542604.1 ENST00000447648.2 |
TECPR1
|
tectonin beta-propeller repeat containing 1 |
| chr9_+_103204553 | 7.88 |
ENST00000502978.1
ENST00000334943.6 |
MSANTD3-TMEFF1
TMEFF1
|
MSANTD3-TMEFF1 readthrough transmembrane protein with EGF-like and two follistatin-like domains 1 |
| chr3_-_170626418 | 7.78 |
ENST00000474096.1
ENST00000295822.2 |
EIF5A2
|
eukaryotic translation initiation factor 5A2 |
| chr6_+_121756809 | 7.71 |
ENST00000282561.3
|
GJA1
|
gap junction protein, alpha 1, 43kDa |
| chr18_-_64271363 | 7.38 |
ENST00000262150.2
|
CDH19
|
cadherin 19, type 2 |
| chr11_+_61522844 | 7.29 |
ENST00000265460.5
|
MYRF
|
myelin regulatory factor |
| chr11_+_76156045 | 7.21 |
ENST00000533988.1
ENST00000524490.1 ENST00000334736.3 ENST00000343878.3 ENST00000533972.1 |
C11orf30
|
chromosome 11 open reading frame 30 |
| chr2_+_120770645 | 6.93 |
ENST00000443902.2
|
EPB41L5
|
erythrocyte membrane protein band 4.1 like 5 |
| chr9_+_17135016 | 6.41 |
ENST00000425824.1
ENST00000262360.5 ENST00000380641.4 |
CNTLN
|
centlein, centrosomal protein |
| chr10_+_74451883 | 6.33 |
ENST00000373053.3
ENST00000357157.6 |
MCU
|
mitochondrial calcium uniporter |
| chr9_-_13279589 | 6.26 |
ENST00000319217.7
|
MPDZ
|
multiple PDZ domain protein |
| chr17_-_26903900 | 6.16 |
ENST00000395319.3
ENST00000581807.1 ENST00000584086.1 ENST00000395321.2 |
ALDOC
|
aldolase C, fructose-bisphosphate |
| chr2_+_120770581 | 5.82 |
ENST00000263713.5
|
EPB41L5
|
erythrocyte membrane protein band 4.1 like 5 |
| chr5_+_140868717 | 5.67 |
ENST00000252087.1
|
PCDHGC5
|
protocadherin gamma subfamily C, 5 |
| chrX_-_6146876 | 5.21 |
ENST00000381095.3
|
NLGN4X
|
neuroligin 4, X-linked |
| chr11_-_62783303 | 5.16 |
ENST00000336232.2
ENST00000430500.2 |
SLC22A8
|
solute carrier family 22 (organic anion transporter), member 8 |
| chr3_-_10547192 | 5.10 |
ENST00000360273.2
ENST00000343816.4 |
ATP2B2
|
ATPase, Ca++ transporting, plasma membrane 2 |
| chr17_-_48207157 | 5.06 |
ENST00000330175.4
ENST00000503131.1 |
SAMD14
|
sterile alpha motif domain containing 14 |
| chr11_-_62783276 | 5.04 |
ENST00000535878.1
ENST00000545207.1 |
SLC22A8
|
solute carrier family 22 (organic anion transporter), member 8 |
| chr3_-_98241358 | 4.97 |
ENST00000503004.1
ENST00000506575.1 ENST00000513452.1 ENST00000515620.1 |
CLDND1
|
claudin domain containing 1 |
| chrX_-_10588595 | 4.91 |
ENST00000423614.1
ENST00000317552.4 |
MID1
|
midline 1 (Opitz/BBB syndrome) |
| chrX_-_48931648 | 4.87 |
ENST00000376386.3
ENST00000376390.4 |
PRAF2
|
PRA1 domain family, member 2 |
| chr8_-_133123406 | 4.72 |
ENST00000434736.2
|
HHLA1
|
HERV-H LTR-associating 1 |
| chr10_+_102222798 | 4.53 |
ENST00000343737.5
|
WNT8B
|
wingless-type MMTV integration site family, member 8B |
| chr13_+_73632897 | 4.46 |
ENST00000377687.4
|
KLF5
|
Kruppel-like factor 5 (intestinal) |
| chrX_-_10588459 | 4.37 |
ENST00000380782.2
|
MID1
|
midline 1 (Opitz/BBB syndrome) |
| chr14_+_96722152 | 4.25 |
ENST00000216629.6
|
BDKRB1
|
bradykinin receptor B1 |
| chr5_+_161274940 | 4.25 |
ENST00000393943.4
|
GABRA1
|
gamma-aminobutyric acid (GABA) A receptor, alpha 1 |
| chr4_+_70916119 | 4.20 |
ENST00000246896.3
ENST00000511674.1 |
HTN1
|
histatin 1 |
| chr5_+_161274685 | 4.11 |
ENST00000428797.2
|
GABRA1
|
gamma-aminobutyric acid (GABA) A receptor, alpha 1 |
| chr17_-_40021656 | 4.00 |
ENST00000319121.3
|
KLHL11
|
kelch-like family member 11 |
| chr17_+_44668035 | 3.98 |
ENST00000398238.4
ENST00000225282.8 |
NSF
|
N-ethylmaleimide-sensitive factor |
| chr4_-_16077741 | 3.96 |
ENST00000447510.2
ENST00000540805.1 ENST00000539194.1 |
PROM1
|
prominin 1 |
| chr18_+_32290218 | 3.96 |
ENST00000348997.5
ENST00000588949.1 ENST00000597599.1 |
DTNA
|
dystrobrevin, alpha |
| chr4_+_70894130 | 3.87 |
ENST00000526767.1
ENST00000530128.1 ENST00000381057.3 |
HTN3
|
histatin 3 |
| chr5_-_149324306 | 3.82 |
ENST00000255266.5
|
PDE6A
|
phosphodiesterase 6A, cGMP-specific, rod, alpha |
| chr19_-_48547294 | 3.74 |
ENST00000293255.2
|
CABP5
|
calcium binding protein 5 |
| chr8_-_87755878 | 3.72 |
ENST00000320005.5
|
CNGB3
|
cyclic nucleotide gated channel beta 3 |
| chr6_+_35310391 | 3.71 |
ENST00000337400.2
ENST00000311565.4 ENST00000540939.1 |
PPARD
|
peroxisome proliferator-activated receptor delta |
| chr10_-_104178857 | 3.66 |
ENST00000020673.5
|
PSD
|
pleckstrin and Sec7 domain containing |
| chrX_+_135278908 | 3.53 |
ENST00000539015.1
ENST00000370683.1 |
FHL1
|
four and a half LIM domains 1 |
| chr7_-_128415844 | 3.49 |
ENST00000249389.2
|
OPN1SW
|
opsin 1 (cone pigments), short-wave-sensitive |
| chr2_+_189156638 | 3.39 |
ENST00000410051.1
|
GULP1
|
GULP, engulfment adaptor PTB domain containing 1 |
| chr3_-_49058479 | 3.20 |
ENST00000440857.1
|
DALRD3
|
DALR anticodon binding domain containing 3 |
| chr1_-_47655686 | 3.17 |
ENST00000294338.2
|
PDZK1IP1
|
PDZK1 interacting protein 1 |
| chr15_-_27184664 | 3.16 |
ENST00000541819.2
|
GABRB3
|
gamma-aminobutyric acid (GABA) A receptor, beta 3 |
| chr7_+_138482695 | 3.15 |
ENST00000422794.2
ENST00000397602.3 ENST00000442682.2 ENST00000458494.1 ENST00000413208.1 |
TMEM213
|
transmembrane protein 213 |
| chr12_+_7941989 | 3.01 |
ENST00000229307.4
|
NANOG
|
Nanog homeobox |
| chr5_+_161275320 | 2.91 |
ENST00000437025.2
|
GABRA1
|
gamma-aminobutyric acid (GABA) A receptor, alpha 1 |
| chr17_-_19651654 | 2.89 |
ENST00000395555.3
|
ALDH3A1
|
aldehyde dehydrogenase 3 family, member A1 |
| chr1_+_17248418 | 2.85 |
ENST00000375541.5
|
CROCC
|
ciliary rootlet coiled-coil, rootletin |
| chr6_+_35310312 | 2.77 |
ENST00000448077.2
ENST00000360694.3 ENST00000418635.2 ENST00000444397.1 |
PPARD
|
peroxisome proliferator-activated receptor delta |
| chr11_-_128712362 | 2.75 |
ENST00000392664.2
|
KCNJ1
|
potassium inwardly-rectifying channel, subfamily J, member 1 |
| chr5_-_33984741 | 2.73 |
ENST00000382102.3
ENST00000509381.1 ENST00000342059.3 ENST00000345083.5 |
SLC45A2
|
solute carrier family 45, member 2 |
| chr12_-_77272765 | 2.72 |
ENST00000547435.1
ENST00000552330.1 ENST00000546966.1 ENST00000311083.5 |
CSRP2
|
cysteine and glycine-rich protein 2 |
| chr4_+_170541678 | 2.71 |
ENST00000360642.3
ENST00000512813.1 |
CLCN3
|
chloride channel, voltage-sensitive 3 |
| chr19_-_55866061 | 2.69 |
ENST00000588572.2
ENST00000593184.1 ENST00000589467.1 |
COX6B2
|
cytochrome c oxidase subunit VIb polypeptide 2 (testis) |
| chr17_-_40264692 | 2.67 |
ENST00000591220.1
ENST00000251642.3 |
DHX58
|
DEXH (Asp-Glu-X-His) box polypeptide 58 |
| chr22_-_19137796 | 2.67 |
ENST00000086933.2
|
GSC2
|
goosecoid homeobox 2 |
| chr17_-_19651668 | 2.66 |
ENST00000494157.2
ENST00000225740.6 |
ALDH3A1
|
aldehyde dehydrogenase 3 family, member A1 |
| chr19_-_49520338 | 2.63 |
ENST00000221421.2
|
LHB
|
luteinizing hormone beta polypeptide |
| chr2_-_30144432 | 2.63 |
ENST00000389048.3
|
ALK
|
anaplastic lymphoma receptor tyrosine kinase |
| chr16_-_3074231 | 2.62 |
ENST00000572355.1
ENST00000248089.3 ENST00000574980.1 ENST00000354679.3 ENST00000396916.1 ENST00000573842.1 |
HCFC1R1
|
host cell factor C1 regulator 1 (XPO1 dependent) |
| chr19_-_49560987 | 2.59 |
ENST00000596965.1
|
CGB7
|
chorionic gonadotropin, beta polypeptide 7 |
| chr16_-_68269971 | 2.59 |
ENST00000565858.1
|
ESRP2
|
epithelial splicing regulatory protein 2 |
| chr17_+_68100989 | 2.59 |
ENST00000585558.1
ENST00000392670.1 |
KCNJ16
|
potassium inwardly-rectifying channel, subfamily J, member 16 |
| chr19_-_10121144 | 2.56 |
ENST00000264828.3
|
COL5A3
|
collagen, type V, alpha 3 |
| chr5_-_33984786 | 2.48 |
ENST00000296589.4
|
SLC45A2
|
solute carrier family 45, member 2 |
| chr4_+_169552748 | 2.46 |
ENST00000504519.1
ENST00000512127.1 |
PALLD
|
palladin, cytoskeletal associated protein |
| chr5_-_146461027 | 2.38 |
ENST00000394410.2
ENST00000508267.1 ENST00000504198.1 |
PPP2R2B
|
protein phosphatase 2, regulatory subunit B, beta |
| chr19_-_42931567 | 2.25 |
ENST00000244289.4
|
LIPE
|
lipase, hormone-sensitive |
| chr17_+_77020325 | 2.22 |
ENST00000311661.4
|
C1QTNF1
|
C1q and tumor necrosis factor related protein 1 |
| chr12_-_13248598 | 2.14 |
ENST00000337630.6
ENST00000545699.1 |
GSG1
|
germ cell associated 1 |
| chr1_+_114447763 | 2.08 |
ENST00000369563.3
|
DCLRE1B
|
DNA cross-link repair 1B |
| chr11_-_35440579 | 2.03 |
ENST00000606205.1
|
SLC1A2
|
solute carrier family 1 (glial high affinity glutamate transporter), member 2 |
| chr17_+_77020224 | 1.96 |
ENST00000339142.2
|
C1QTNF1
|
C1q and tumor necrosis factor related protein 1 |
| chr3_+_36421826 | 1.92 |
ENST00000273183.3
|
STAC
|
SH3 and cysteine rich domain |
| chrX_+_15767971 | 1.90 |
ENST00000479740.1
ENST00000454127.2 |
CA5B
|
carbonic anhydrase VB, mitochondrial |
| chr1_+_197237352 | 1.85 |
ENST00000538660.1
ENST00000367400.3 ENST00000367399.2 |
CRB1
|
crumbs homolog 1 (Drosophila) |
| chr16_-_58004992 | 1.83 |
ENST00000564448.1
ENST00000251102.8 ENST00000311183.4 |
CNGB1
|
cyclic nucleotide gated channel beta 1 |
| chr1_+_244816237 | 1.82 |
ENST00000302550.11
|
DESI2
|
desumoylating isopeptidase 2 |
| chr19_+_2476116 | 1.80 |
ENST00000215631.4
ENST00000587345.1 |
GADD45B
|
growth arrest and DNA-damage-inducible, beta |
| chr12_+_81101277 | 1.78 |
ENST00000228641.3
|
MYF6
|
myogenic factor 6 (herculin) |
| chr12_-_113574028 | 1.77 |
ENST00000546530.1
ENST00000261729.5 |
RASAL1
|
RAS protein activator like 1 (GAP1 like) |
| chrX_-_138724994 | 1.74 |
ENST00000536274.1
|
MCF2
|
MCF.2 cell line derived transforming sequence |
| chr1_+_18957500 | 1.73 |
ENST00000375375.3
|
PAX7
|
paired box 7 |
| chr14_+_21785693 | 1.72 |
ENST00000382933.4
ENST00000557351.1 |
RPGRIP1
|
retinitis pigmentosa GTPase regulator interacting protein 1 |
| chr18_-_24443151 | 1.69 |
ENST00000440832.3
|
AQP4
|
aquaporin 4 |
| chr2_+_189156389 | 1.66 |
ENST00000409843.1
|
GULP1
|
GULP, engulfment adaptor PTB domain containing 1 |
| chr14_-_24551195 | 1.63 |
ENST00000560550.1
|
NRL
|
neural retina leucine zipper |
| chr11_-_35440796 | 1.62 |
ENST00000278379.3
|
SLC1A2
|
solute carrier family 1 (glial high affinity glutamate transporter), member 2 |
| chr10_-_86001210 | 1.62 |
ENST00000372105.3
|
LRIT1
|
leucine-rich repeat, immunoglobulin-like and transmembrane domains 1 |
| chr6_+_31588478 | 1.56 |
ENST00000376007.4
ENST00000376033.2 |
PRRC2A
|
proline-rich coiled-coil 2A |
| chrX_-_138724677 | 1.49 |
ENST00000370573.4
ENST00000338585.6 ENST00000370576.4 |
MCF2
|
MCF.2 cell line derived transforming sequence |
| chr1_-_21606013 | 1.47 |
ENST00000357071.4
|
ECE1
|
endothelin converting enzyme 1 |
| chr14_-_24551137 | 1.47 |
ENST00000396995.1
|
NRL
|
neural retina leucine zipper |
| chr8_+_70378852 | 1.42 |
ENST00000525061.1
ENST00000458141.2 ENST00000260128.4 |
SULF1
|
sulfatase 1 |
| chr1_+_11751748 | 1.41 |
ENST00000294485.5
|
DRAXIN
|
dorsal inhibitory axon guidance protein |
| chr17_-_9808887 | 1.37 |
ENST00000226193.5
|
RCVRN
|
recoverin |
| chr15_-_31453359 | 1.29 |
ENST00000542188.1
|
TRPM1
|
transient receptor potential cation channel, subfamily M, member 1 |
| chr6_-_35480640 | 1.29 |
ENST00000428978.1
ENST00000322263.4 |
TULP1
|
tubby like protein 1 |
| chr10_-_126849588 | 1.29 |
ENST00000411419.2
|
CTBP2
|
C-terminal binding protein 2 |
| chr1_+_244816371 | 1.26 |
ENST00000263831.7
|
DESI2
|
desumoylating isopeptidase 2 |
| chr22_-_40929812 | 1.22 |
ENST00000422851.1
|
MKL1
|
megakaryoblastic leukemia (translocation) 1 |
| chr11_-_62752455 | 1.20 |
ENST00000360421.4
|
SLC22A6
|
solute carrier family 22 (organic anion transporter), member 6 |
| chr7_-_138482933 | 1.14 |
ENST00000310018.2
|
ATP6V0A4
|
ATPase, H+ transporting, lysosomal V0 subunit a4 |
| chr12_-_13248562 | 1.11 |
ENST00000457134.2
ENST00000537302.1 |
GSG1
|
germ cell associated 1 |
| chr11_-_62752429 | 1.10 |
ENST00000377871.3
|
SLC22A6
|
solute carrier family 22 (organic anion transporter), member 6 |
| chr16_+_69373323 | 1.08 |
ENST00000254940.5
|
NIP7
|
NIP7, nucleolar pre-rRNA processing protein |
| chr4_+_170541660 | 1.07 |
ENST00000513761.1
ENST00000347613.4 |
CLCN3
|
chloride channel, voltage-sensitive 3 |
| chr22_-_29663954 | 1.00 |
ENST00000216085.7
|
RHBDD3
|
rhomboid domain containing 3 |
| chr10_-_76868931 | 1.00 |
ENST00000372700.3
ENST00000473072.2 ENST00000491677.2 ENST00000607131.1 ENST00000372702.3 |
DUSP13
|
dual specificity phosphatase 13 |
| chr12_+_53818855 | 0.98 |
ENST00000550839.1
|
AMHR2
|
anti-Mullerian hormone receptor, type II |
| chrX_-_24665353 | 0.98 |
ENST00000379144.2
|
PCYT1B
|
phosphate cytidylyltransferase 1, choline, beta |
| chr15_-_43559055 | 0.97 |
ENST00000220420.5
ENST00000349114.4 |
TGM5
|
transglutaminase 5 |
| chr4_-_76823681 | 0.96 |
ENST00000286719.7
|
PPEF2
|
protein phosphatase, EF-hand calcium binding domain 2 |
| chr4_+_170541835 | 0.95 |
ENST00000504131.2
|
CLCN3
|
chloride channel, voltage-sensitive 3 |
| chr8_-_116681221 | 0.94 |
ENST00000395715.3
|
TRPS1
|
trichorhinophalangeal syndrome I |
| chrX_-_49089771 | 0.94 |
ENST00000376251.1
ENST00000323022.5 ENST00000376265.2 |
CACNA1F
|
calcium channel, voltage-dependent, L type, alpha 1F subunit |
| chr6_-_41130841 | 0.88 |
ENST00000373122.4
|
TREM2
|
triggering receptor expressed on myeloid cells 2 |
| chr11_-_62752162 | 0.88 |
ENST00000458333.2
ENST00000421062.2 |
SLC22A6
|
solute carrier family 22 (organic anion transporter), member 6 |
| chr6_-_41130914 | 0.85 |
ENST00000373113.3
ENST00000338469.3 |
TREM2
|
triggering receptor expressed on myeloid cells 2 |
| chr12_-_13248705 | 0.83 |
ENST00000396310.2
|
GSG1
|
germ cell associated 1 |
| chr7_-_138482849 | 0.76 |
ENST00000353492.4
|
ATP6V0A4
|
ATPase, H+ transporting, lysosomal V0 subunit a4 |
| chrX_+_107069063 | 0.76 |
ENST00000262843.6
|
MID2
|
midline 2 |
| chr1_+_114522049 | 0.75 |
ENST00000369551.1
ENST00000320334.4 |
OLFML3
|
olfactomedin-like 3 |
| chr11_+_44587141 | 0.73 |
ENST00000227155.4
ENST00000342935.3 ENST00000532544.1 |
CD82
|
CD82 molecule |
| chr3_-_54962100 | 0.73 |
ENST00000273286.5
|
LRTM1
|
leucine-rich repeats and transmembrane domains 1 |
| chr1_+_202431859 | 0.65 |
ENST00000391959.3
ENST00000367270.4 |
PPP1R12B
|
protein phosphatase 1, regulatory subunit 12B |
| chr2_+_189156586 | 0.63 |
ENST00000409830.1
|
GULP1
|
GULP, engulfment adaptor PTB domain containing 1 |
| chr2_+_189156721 | 0.61 |
ENST00000409927.1
ENST00000409805.1 |
GULP1
|
GULP, engulfment adaptor PTB domain containing 1 |
| chr1_-_165414414 | 0.60 |
ENST00000359842.5
|
RXRG
|
retinoid X receptor, gamma |
| chrY_+_16634483 | 0.55 |
ENST00000382872.1
|
NLGN4Y
|
neuroligin 4, Y-linked |
| chr19_+_40877583 | 0.49 |
ENST00000596470.1
|
PLD3
|
phospholipase D family, member 3 |
| chrX_+_99899180 | 0.48 |
ENST00000373004.3
|
SRPX2
|
sushi-repeat containing protein, X-linked 2 |
| chr10_+_118350468 | 0.46 |
ENST00000358834.4
ENST00000528052.1 ENST00000442761.1 |
PNLIPRP1
|
pancreatic lipase-related protein 1 |
| chr2_+_128175997 | 0.45 |
ENST00000234071.3
ENST00000429925.1 ENST00000442644.1 ENST00000453608.2 |
PROC
|
protein C (inactivator of coagulation factors Va and VIIIa) |
| chr6_-_35480705 | 0.43 |
ENST00000229771.6
|
TULP1
|
tubby like protein 1 |
| chr15_+_96876340 | 0.36 |
ENST00000453270.2
|
NR2F2
|
nuclear receptor subfamily 2, group F, member 2 |
| chr15_+_48498480 | 0.33 |
ENST00000380993.3
ENST00000396577.3 |
SLC12A1
|
solute carrier family 12 (sodium/potassium/chloride transporter), member 1 |
| chr12_-_13248732 | 0.32 |
ENST00000396302.3
|
GSG1
|
germ cell associated 1 |
| chr10_+_52750930 | 0.25 |
ENST00000401604.2
|
PRKG1
|
protein kinase, cGMP-dependent, type I |
| chrX_+_41306575 | 0.25 |
ENST00000342595.2
ENST00000378220.1 |
NYX
|
nyctalopin |
| chr5_-_16738451 | 0.20 |
ENST00000274203.9
ENST00000515803.1 |
MYO10
|
myosin X |
| chr13_-_36050819 | 0.17 |
ENST00000379919.4
|
MAB21L1
|
mab-21-like 1 (C. elegans) |
| chr11_+_124735282 | 0.13 |
ENST00000397801.1
|
ROBO3
|
roundabout, axon guidance receptor, homolog 3 (Drosophila) |
| chr6_-_42690312 | 0.09 |
ENST00000230381.5
|
PRPH2
|
peripherin 2 (retinal degeneration, slow) |
| chr16_+_87636474 | 0.04 |
ENST00000284262.2
|
JPH3
|
junctophilin 3 |
| chr1_+_159409512 | 0.01 |
ENST00000423932.3
|
OR10J1
|
olfactory receptor, family 10, subfamily J, member 1 |
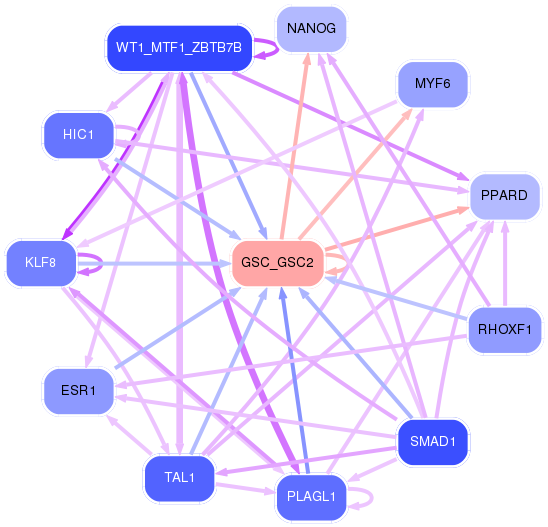
Network of associatons between targets according to the STRING database.

First level regulatory network of GSC_GSC2
Gene Ontology Analysis
Gene overrepresentation in biological_process category:
| Log-likelihood per target | Total log-likelihood | Term | Description |
|---|---|---|---|
| 6.7 | 26.7 | GO:1903288 | protein transport into plasma membrane raft(GO:0044861) positive regulation of potassium ion import(GO:1903288) |
| 4.3 | 12.8 | GO:0003383 | apical constriction(GO:0003383) mesoderm migration involved in gastrulation(GO:0007509) |
| 2.4 | 9.7 | GO:2000686 | regulation of rubidium ion transmembrane transporter activity(GO:2000686) |
| 2.0 | 8.2 | GO:0006663 | platelet activating factor biosynthetic process(GO:0006663) |
| 1.9 | 7.7 | GO:0010645 | regulation of cell communication by chemical coupling(GO:0010645) positive regulation of cell communication by chemical coupling(GO:0010652) |
| 1.7 | 31.1 | GO:0007021 | tubulin complex assembly(GO:0007021) |
| 1.1 | 3.2 | GO:0006420 | arginyl-tRNA aminoacylation(GO:0006420) |
| 1.1 | 19.1 | GO:0010457 | centriole-centriole cohesion(GO:0010457) |
| 1.1 | 3.2 | GO:0097254 | renal tubular secretion(GO:0097254) |
| 1.1 | 6.3 | GO:0036444 | calcium ion transmembrane import into mitochondrion(GO:0036444) |
| 1.0 | 4.2 | GO:2000860 | positive regulation of mineralocorticoid secretion(GO:2000857) positive regulation of aldosterone secretion(GO:2000860) |
| 1.0 | 4.0 | GO:2000768 | glomerular parietal epithelial cell differentiation(GO:0072139) positive regulation of nephron tubule epithelial cell differentiation(GO:2000768) |
| 1.0 | 7.8 | GO:0006452 | translational frameshifting(GO:0006452) positive regulation of translational termination(GO:0045905) |
| 0.9 | 4.7 | GO:0048388 | endosomal lumen acidification(GO:0048388) |
| 0.8 | 14.4 | GO:0071420 | cellular response to histamine(GO:0071420) |
| 0.8 | 3.1 | GO:0045872 | positive regulation of rhodopsin gene expression(GO:0045872) |
| 0.8 | 10.0 | GO:0035372 | protein localization to microtubule(GO:0035372) |
| 0.7 | 8.2 | GO:2000288 | positive regulation of myoblast proliferation(GO:2000288) |
| 0.7 | 5.2 | GO:0090394 | negative regulation of excitatory postsynaptic potential(GO:0090394) |
| 0.7 | 7.3 | GO:0032286 | central nervous system myelin maintenance(GO:0032286) |
| 0.7 | 2.1 | GO:0031627 | telomeric loop formation(GO:0031627) |
| 0.7 | 2.7 | GO:0039534 | negative regulation of MDA-5 signaling pathway(GO:0039534) positive regulation of MDA-5 signaling pathway(GO:1900245) |
| 0.7 | 2.6 | GO:0036269 | swimming behavior(GO:0036269) |
| 0.6 | 3.2 | GO:0048066 | developmental pigmentation(GO:0048066) |
| 0.6 | 21.3 | GO:0008045 | motor neuron axon guidance(GO:0008045) |
| 0.6 | 1.7 | GO:0032499 | positive regulation of antigen processing and presentation of peptide or polysaccharide antigen via MHC class II(GO:0002582) positive regulation of antigen processing and presentation of peptide antigen(GO:0002585) positive regulation of antigen processing and presentation of peptide antigen via MHC class II(GO:0002588) detection of peptidoglycan(GO:0032499) |
| 0.5 | 3.0 | GO:0001714 | endodermal cell fate specification(GO:0001714) |
| 0.5 | 4.5 | GO:0032534 | regulation of microvillus assembly(GO:0032534) |
| 0.5 | 3.7 | GO:0070777 | D-aspartate transport(GO:0070777) D-aspartate import(GO:0070779) |
| 0.5 | 4.5 | GO:0048263 | determination of dorsal identity(GO:0048263) |
| 0.4 | 2.2 | GO:0046340 | diacylglycerol catabolic process(GO:0046340) |
| 0.4 | 1.5 | GO:0010814 | substance P catabolic process(GO:0010814) calcitonin catabolic process(GO:0010816) endothelin maturation(GO:0034959) |
| 0.3 | 6.2 | GO:0030388 | fructose 1,6-bisphosphate metabolic process(GO:0030388) |
| 0.3 | 2.6 | GO:0006701 | progesterone biosynthetic process(GO:0006701) |
| 0.3 | 4.5 | GO:0050962 | detection of light stimulus involved in visual perception(GO:0050908) detection of light stimulus involved in sensory perception(GO:0050962) |
| 0.3 | 9.4 | GO:0010667 | negative regulation of cardiac muscle cell apoptotic process(GO:0010667) |
| 0.3 | 10.2 | GO:0043252 | sodium-independent organic anion transport(GO:0043252) |
| 0.2 | 1.0 | GO:0032815 | negative regulation of natural killer cell activation(GO:0032815) |
| 0.2 | 1.0 | GO:1990262 | regulation of anti-Mullerian hormone signaling pathway(GO:1902612) negative regulation of anti-Mullerian hormone signaling pathway(GO:1902613) anti-Mullerian hormone signaling pathway(GO:1990262) |
| 0.2 | 11.8 | GO:0043268 | positive regulation of potassium ion transport(GO:0043268) |
| 0.2 | 7.9 | GO:0097352 | autophagosome maturation(GO:0097352) |
| 0.2 | 3.5 | GO:0018298 | protein-chromophore linkage(GO:0018298) |
| 0.2 | 4.9 | GO:0015813 | L-glutamate transport(GO:0015813) |
| 0.2 | 1.2 | GO:0010735 | positive regulation of transcription via serum response element binding(GO:0010735) |
| 0.2 | 8.1 | GO:0050832 | defense response to fungus(GO:0050832) |
| 0.2 | 3.7 | GO:0032012 | regulation of ARF protein signal transduction(GO:0032012) |
| 0.2 | 1.9 | GO:0070070 | proton-transporting V-type ATPase complex assembly(GO:0070070) vacuolar proton-transporting V-type ATPase complex assembly(GO:0070072) |
| 0.2 | 4.0 | GO:0001921 | positive regulation of receptor recycling(GO:0001921) |
| 0.2 | 1.8 | GO:0048743 | positive regulation of skeletal muscle fiber development(GO:0048743) |
| 0.2 | 5.3 | GO:0010107 | potassium ion import(GO:0010107) |
| 0.2 | 1.4 | GO:0060686 | negative regulation of prostatic bud formation(GO:0060686) |
| 0.2 | 1.4 | GO:0031284 | positive regulation of guanylate cyclase activity(GO:0031284) |
| 0.2 | 0.5 | GO:0044537 | regulation of circulating fibrinogen levels(GO:0044537) |
| 0.1 | 3.8 | GO:0022400 | regulation of rhodopsin mediated signaling pathway(GO:0022400) |
| 0.1 | 4.3 | GO:0051281 | positive regulation of release of sequestered calcium ion into cytosol(GO:0051281) |
| 0.1 | 3.7 | GO:0042462 | eye photoreceptor cell development(GO:0042462) |
| 0.1 | 2.5 | GO:0003334 | keratinocyte development(GO:0003334) |
| 0.1 | 2.4 | GO:0070262 | peptidyl-serine dephosphorylation(GO:0070262) |
| 0.1 | 2.6 | GO:0060445 | branching involved in salivary gland morphogenesis(GO:0060445) |
| 0.1 | 1.4 | GO:0021516 | dorsal spinal cord development(GO:0021516) |
| 0.1 | 0.5 | GO:0097105 | presynaptic membrane assembly(GO:0097105) |
| 0.1 | 1.8 | GO:1900745 | positive regulation of p38MAPK cascade(GO:1900745) |
| 0.1 | 0.4 | GO:0060849 | radial pattern formation(GO:0009956) regulation of transcription involved in lymphatic endothelial cell fate commitment(GO:0060849) |
| 0.1 | 0.5 | GO:0090050 | positive regulation of cell migration involved in sprouting angiogenesis(GO:0090050) |
| 0.1 | 13.1 | GO:0007156 | homophilic cell adhesion via plasma membrane adhesion molecules(GO:0007156) |
| 0.1 | 2.6 | GO:0030199 | collagen fibril organization(GO:0030199) |
| 0.1 | 6.2 | GO:0006911 | phagocytosis, engulfment(GO:0006911) |
| 0.1 | 1.8 | GO:1903861 | positive regulation of dendrite extension(GO:1903861) |
| 0.1 | 2.2 | GO:0007274 | neuromuscular synaptic transmission(GO:0007274) |
| 0.0 | 3.6 | GO:1903779 | regulation of cardiac conduction(GO:1903779) |
| 0.0 | 1.9 | GO:0006730 | one-carbon metabolic process(GO:0006730) bicarbonate transport(GO:0015701) |
| 0.0 | 1.7 | GO:0003091 | renal water homeostasis(GO:0003091) |
| 0.0 | 5.5 | GO:0006805 | xenobiotic metabolic process(GO:0006805) |
| 0.0 | 0.9 | GO:0006607 | NLS-bearing protein import into nucleus(GO:0006607) |
| 0.0 | 0.1 | GO:0016199 | axon midline choice point recognition(GO:0016199) |
| 0.0 | 0.4 | GO:0010801 | negative regulation of peptidyl-threonine phosphorylation(GO:0010801) |
| 0.0 | 0.2 | GO:0006657 | CDP-choline pathway(GO:0006657) |
| 0.0 | 1.0 | GO:0018149 | peptide cross-linking(GO:0018149) |
| 0.0 | 2.6 | GO:0007292 | female gamete generation(GO:0007292) |
| 0.0 | 3.2 | GO:0035023 | regulation of Rho protein signal transduction(GO:0035023) |
| 0.0 | 1.0 | GO:0046426 | negative regulation of JAK-STAT cascade(GO:0046426) negative regulation of STAT cascade(GO:1904893) |
| 0.0 | 0.6 | GO:1901522 | positive regulation of transcription from RNA polymerase II promoter involved in cellular response to chemical stimulus(GO:1901522) |
| 0.0 | 1.1 | GO:0042255 | ribosome assembly(GO:0042255) |
| 0.0 | 4.0 | GO:0042787 | protein ubiquitination involved in ubiquitin-dependent protein catabolic process(GO:0042787) |
| 0.0 | 1.9 | GO:0034605 | cellular response to heat(GO:0034605) |
| 0.0 | 0.2 | GO:0051489 | regulation of filopodium assembly(GO:0051489) |
| 0.0 | 3.7 | GO:0042391 | regulation of membrane potential(GO:0042391) |
Gene overrepresentation in cellular_component category:
| Log-likelihood per target | Total log-likelihood | Term | Description |
|---|---|---|---|
| 1.9 | 31.1 | GO:0097512 | cardiac myofibril(GO:0097512) |
| 1.6 | 6.3 | GO:1990246 | uniplex complex(GO:1990246) |
| 1.3 | 26.7 | GO:0005890 | sodium:potassium-exchanging ATPase complex(GO:0005890) |
| 0.9 | 2.6 | GO:0005588 | collagen type V trimer(GO:0005588) |
| 0.7 | 14.3 | GO:0043220 | Schmidt-Lanterman incisure(GO:0043220) |
| 0.6 | 7.7 | GO:0005916 | fascia adherens(GO:0005916) |
| 0.4 | 14.4 | GO:1902711 | GABA-A receptor complex(GO:1902711) |
| 0.4 | 2.7 | GO:0030061 | mitochondrial crista(GO:0030061) |
| 0.4 | 1.5 | GO:0031302 | intrinsic component of endosome membrane(GO:0031302) |
| 0.3 | 4.0 | GO:0042622 | photoreceptor outer segment membrane(GO:0042622) |
| 0.2 | 6.7 | GO:0097381 | photoreceptor disc membrane(GO:0097381) |
| 0.2 | 2.9 | GO:0035253 | ciliary rootlet(GO:0035253) |
| 0.2 | 1.9 | GO:0000220 | vacuolar proton-transporting V-type ATPase, V0 domain(GO:0000220) |
| 0.2 | 7.9 | GO:0000421 | autophagosome membrane(GO:0000421) |
| 0.2 | 0.7 | GO:0035838 | growing cell tip(GO:0035838) |
| 0.1 | 16.2 | GO:0005814 | centriole(GO:0005814) |
| 0.1 | 9.3 | GO:0005881 | cytoplasmic microtubule(GO:0005881) |
| 0.1 | 3.7 | GO:0030673 | axolemma(GO:0030673) |
| 0.1 | 6.5 | GO:0001750 | photoreceptor outer segment(GO:0001750) |
| 0.1 | 14.8 | GO:0032587 | ruffle membrane(GO:0032587) |
| 0.1 | 1.8 | GO:0031235 | intrinsic component of the cytoplasmic side of the plasma membrane(GO:0031235) |
| 0.1 | 4.0 | GO:0043198 | dendritic shaft(GO:0043198) |
| 0.1 | 1.7 | GO:0032391 | photoreceptor connecting cilium(GO:0032391) |
| 0.1 | 2.4 | GO:0000159 | protein phosphatase type 2A complex(GO:0000159) |
| 0.1 | 6.2 | GO:1904724 | tertiary granule lumen(GO:1904724) |
| 0.1 | 7.8 | GO:0005643 | nuclear pore(GO:0005643) |
| 0.1 | 5.4 | GO:0005901 | caveola(GO:0005901) |
| 0.1 | 2.5 | GO:0002102 | podosome(GO:0002102) |
| 0.0 | 5.3 | GO:0008076 | voltage-gated potassium channel complex(GO:0008076) potassium channel complex(GO:0034705) |
| 0.0 | 4.2 | GO:0005581 | collagen trimer(GO:0005581) |
| 0.0 | 4.7 | GO:0031902 | late endosome membrane(GO:0031902) |
| 0.0 | 2.0 | GO:0019005 | SCF ubiquitin ligase complex(GO:0019005) |
| 0.0 | 5.9 | GO:0042383 | sarcolemma(GO:0042383) |
| 0.0 | 1.8 | GO:0005902 | microvillus(GO:0005902) |
| 0.0 | 3.1 | GO:0005796 | Golgi lumen(GO:0005796) |
| 0.0 | 14.5 | GO:0005925 | focal adhesion(GO:0005925) |
| 0.0 | 0.7 | GO:0031672 | A band(GO:0031672) |
| 0.0 | 4.8 | GO:0005578 | proteinaceous extracellular matrix(GO:0005578) |
| 0.0 | 0.2 | GO:0032433 | filopodium tip(GO:0032433) |
| 0.0 | 24.4 | GO:0005887 | integral component of plasma membrane(GO:0005887) |
| 0.0 | 2.1 | GO:0000784 | nuclear chromosome, telomeric region(GO:0000784) |
| 0.0 | 0.0 | GO:0030314 | junctional membrane complex(GO:0030314) |
| 0.0 | 0.7 | GO:0005912 | adherens junction(GO:0005912) |
| 0.0 | 1.4 | GO:0005795 | Golgi stack(GO:0005795) |
Gene overrepresentation in molecular_function category:
| Log-likelihood per target | Total log-likelihood | Term | Description |
|---|---|---|---|
| 1.7 | 26.7 | GO:0005391 | sodium:potassium-exchanging ATPase activity(GO:0005391) |
| 1.4 | 4.3 | GO:0004947 | bradykinin receptor activity(GO:0004947) |
| 1.4 | 11.3 | GO:0099529 | neurotransmitter receptor activity involved in regulation of postsynaptic membrane potential(GO:0099529) transmitter-gated ion channel activity involved in regulation of postsynaptic membrane potential(GO:1904315) |
| 1.3 | 40.5 | GO:0005212 | structural constituent of eye lens(GO:0005212) |
| 1.3 | 7.7 | GO:0086075 | gap junction channel activity involved in cardiac conduction electrical coupling(GO:0086075) |
| 1.1 | 5.5 | GO:0018479 | benzaldehyde dehydrogenase (NAD+) activity(GO:0018479) |
| 1.1 | 3.2 | GO:0004814 | arginine-tRNA ligase activity(GO:0004814) |
| 0.9 | 9.7 | GO:0019869 | chloride channel inhibitor activity(GO:0019869) |
| 0.8 | 8.2 | GO:0047498 | calcium-dependent phospholipase A2 activity(GO:0047498) |
| 0.8 | 5.6 | GO:0005223 | intracellular cGMP activated cation channel activity(GO:0005223) |
| 0.8 | 4.7 | GO:0072320 | volume-sensitive chloride channel activity(GO:0072320) |
| 0.7 | 2.2 | GO:0033878 | hormone-sensitive lipase activity(GO:0033878) |
| 0.6 | 6.2 | GO:0004332 | fructose-bisphosphate aldolase activity(GO:0004332) |
| 0.5 | 3.7 | GO:0015501 | glutamate:sodium symporter activity(GO:0015501) |
| 0.5 | 2.7 | GO:0015272 | ATP-activated inward rectifier potassium channel activity(GO:0015272) |
| 0.4 | 21.3 | GO:0046875 | ephrin receptor binding(GO:0046875) |
| 0.4 | 13.4 | GO:0015301 | anion:anion antiporter activity(GO:0015301) |
| 0.4 | 5.8 | GO:0042043 | neurexin family protein binding(GO:0042043) |
| 0.4 | 2.6 | GO:0004704 | NF-kappaB-inducing kinase activity(GO:0004704) |
| 0.4 | 1.4 | GO:0008449 | N-acetylglucosamine-6-sulfatase activity(GO:0008449) |
| 0.3 | 5.2 | GO:0005402 | sugar:proton symporter activity(GO:0005351) cation:sugar symporter activity(GO:0005402) |
| 0.3 | 3.5 | GO:0008020 | G-protein coupled photoreceptor activity(GO:0008020) |
| 0.3 | 3.2 | GO:0022851 | GABA-gated chloride ion channel activity(GO:0022851) |
| 0.3 | 7.8 | GO:0003746 | translation elongation factor activity(GO:0003746) |
| 0.3 | 1.4 | GO:0008048 | calcium sensitive guanylate cyclase activator activity(GO:0008048) |
| 0.3 | 7.3 | GO:0032266 | phosphatidylinositol-3-phosphate binding(GO:0032266) |
| 0.3 | 2.1 | GO:0035312 | 5'-3' exodeoxyribonuclease activity(GO:0035312) |
| 0.2 | 1.7 | GO:0070891 | lipoteichoic acid binding(GO:0070891) |
| 0.2 | 1.0 | GO:0005026 | transforming growth factor beta receptor activity, type II(GO:0005026) |
| 0.2 | 6.5 | GO:0036041 | long-chain fatty acid binding(GO:0036041) |
| 0.2 | 5.1 | GO:0005388 | calcium-transporting ATPase activity(GO:0005388) |
| 0.2 | 3.0 | GO:0043522 | leucine zipper domain binding(GO:0043522) |
| 0.2 | 2.6 | GO:0015467 | G-protein activated inward rectifier potassium channel activity(GO:0015467) |
| 0.1 | 0.6 | GO:0004886 | 9-cis retinoic acid receptor activity(GO:0004886) |
| 0.1 | 3.7 | GO:0005086 | ARF guanyl-nucleotide exchange factor activity(GO:0005086) |
| 0.1 | 4.0 | GO:0017075 | syntaxin-1 binding(GO:0017075) |
| 0.1 | 4.5 | GO:0005109 | frizzled binding(GO:0005109) |
| 0.1 | 0.5 | GO:0070290 | N-acylphosphatidylethanolamine-specific phospholipase D activity(GO:0070290) |
| 0.1 | 1.0 | GO:0003810 | protein-glutamine gamma-glutamyltransferase activity(GO:0003810) |
| 0.1 | 1.9 | GO:0004089 | carbonate dehydratase activity(GO:0004089) |
| 0.1 | 2.5 | GO:0051371 | muscle alpha-actinin binding(GO:0051371) |
| 0.1 | 10.0 | GO:0051219 | phosphoprotein binding(GO:0051219) |
| 0.1 | 12.8 | GO:0005200 | structural constituent of cytoskeleton(GO:0005200) |
| 0.1 | 16.2 | GO:0030674 | protein binding, bridging(GO:0030674) |
| 0.1 | 11.8 | GO:0044325 | ion channel binding(GO:0044325) |
| 0.1 | 2.6 | GO:0043394 | proteoglycan binding(GO:0043394) |
| 0.1 | 1.9 | GO:0046961 | proton-transporting ATPase activity, rotational mechanism(GO:0046961) |
| 0.1 | 8.0 | GO:0005262 | calcium channel activity(GO:0005262) |
| 0.1 | 2.9 | GO:0019894 | kinesin binding(GO:0019894) |
| 0.1 | 1.0 | GO:0031435 | mitogen-activated protein kinase kinase kinase binding(GO:0031435) |
| 0.1 | 4.1 | GO:0070063 | RNA polymerase binding(GO:0070063) |
| 0.0 | 0.2 | GO:0004105 | choline-phosphate cytidylyltransferase activity(GO:0004105) |
| 0.0 | 4.2 | GO:0005518 | collagen binding(GO:0005518) |
| 0.0 | 1.7 | GO:0000983 | transcription factor activity, RNA polymerase II core promoter sequence-specific(GO:0000983) |
| 0.0 | 2.7 | GO:0030165 | PDZ domain binding(GO:0030165) |
| 0.0 | 1.0 | GO:0047555 | 3',5'-cyclic-GMP phosphodiesterase activity(GO:0047555) |
| 0.0 | 3.2 | GO:0005089 | Rho guanyl-nucleotide exchange factor activity(GO:0005089) |
| 0.0 | 4.3 | GO:0005179 | hormone activity(GO:0005179) |
| 0.0 | 1.8 | GO:0070888 | E-box binding(GO:0070888) |
| 0.0 | 1.0 | GO:0008138 | protein tyrosine/serine/threonine phosphatase activity(GO:0008138) |
| 0.0 | 2.4 | GO:0004722 | protein serine/threonine phosphatase activity(GO:0004722) |
| 0.0 | 0.3 | GO:0015377 | cation:chloride symporter activity(GO:0015377) |
| 0.0 | 5.4 | GO:0008022 | protein C-terminus binding(GO:0008022) |
| 0.0 | 0.5 | GO:0004806 | triglyceride lipase activity(GO:0004806) |
| 0.0 | 0.2 | GO:0060002 | plus-end directed microfilament motor activity(GO:0060002) |
| 0.0 | 14.1 | GO:0005509 | calcium ion binding(GO:0005509) |
| 0.0 | 1.5 | GO:0004222 | metalloendopeptidase activity(GO:0004222) |
| 0.0 | 0.5 | GO:0005546 | phosphatidylinositol-4,5-bisphosphate binding(GO:0005546) |
| 0.0 | 1.0 | GO:0004860 | protein kinase inhibitor activity(GO:0004860) |
Gene overrepresentation in C2:CP category:
| Log-likelihood per target | Total log-likelihood | Term | Description |
|---|---|---|---|
| 0.3 | 21.2 | PID RAC1 REG PATHWAY | Regulation of RAC1 activity |
| 0.1 | 7.7 | PID NCADHERIN PATHWAY | N-cadherin signaling events |
| 0.1 | 5.1 | PID RXR VDR PATHWAY | RXR and RAR heterodimerization with other nuclear receptor |
| 0.1 | 6.3 | PID ARF6 PATHWAY | Arf6 signaling events |
| 0.1 | 2.3 | PID RHODOPSIN PATHWAY | Visual signal transduction: Rods |
| 0.1 | 2.2 | ST GA12 PATHWAY | G alpha 12 Pathway |
| 0.1 | 2.6 | NABA COLLAGENS | Genes encoding collagen proteins |
| 0.1 | 1.0 | PID ALK2 PATHWAY | ALK2 signaling events |
| 0.0 | 1.8 | PID P38 MKK3 6PATHWAY | p38 MAPK signaling pathway |
| 0.0 | 2.4 | PID ATR PATHWAY | ATR signaling pathway |
| 0.0 | 2.7 | PID ATF2 PATHWAY | ATF-2 transcription factor network |
| 0.0 | 4.2 | NABA ECM AFFILIATED | Genes encoding proteins affiliated structurally or functionally to extracellular matrix proteins |
| 0.0 | 4.5 | NABA SECRETED FACTORS | Genes encoding secreted soluble factors |
Gene overrepresentation in C2:CP:REACTOME category:
| Log-likelihood per target | Total log-likelihood | Term | Description |
|---|---|---|---|
| 0.6 | 13.4 | REACTOME ORGANIC CATION ANION ZWITTERION TRANSPORT | Genes involved in Organic cation/anion/zwitterion transport |
| 0.6 | 26.7 | REACTOME BASIGIN INTERACTIONS | Genes involved in Basigin interactions |
| 0.5 | 8.2 | REACTOME ACYL CHAIN REMODELLING OF PG | Genes involved in Acyl chain remodelling of PG |
| 0.5 | 14.4 | REACTOME GABA A RECEPTOR ACTIVATION | Genes involved in GABA A receptor activation |
| 0.4 | 7.7 | REACTOME GAP JUNCTION ASSEMBLY | Genes involved in Gap junction assembly |
| 0.3 | 3.5 | REACTOME OPSINS | Genes involved in Opsins |
| 0.2 | 8.2 | REACTOME PTM GAMMA CARBOXYLATION HYPUSINE FORMATION AND ARYLSULFATASE ACTIVATION | Genes involved in PTM: gamma carboxylation, hypusine formation and arylsulfatase activation |
| 0.2 | 5.3 | REACTOME INWARDLY RECTIFYING K CHANNELS | Genes involved in Inwardly rectifying K+ channels |
| 0.2 | 5.1 | REACTOME PLATELET CALCIUM HOMEOSTASIS | Genes involved in Platelet calcium homeostasis |
| 0.2 | 2.6 | REACTOME GLYCOPROTEIN HORMONES | Genes involved in Glycoprotein hormones |
| 0.2 | 1.7 | REACTOME REGULATION OF WATER BALANCE BY RENAL AQUAPORINS | Genes involved in Regulation of Water Balance by Renal Aquaporins |
| 0.2 | 4.0 | REACTOME TRAFFICKING OF GLUR2 CONTAINING AMPA RECEPTORS | Genes involved in Trafficking of GluR2-containing AMPA receptors |
| 0.1 | 24.5 | REACTOME SIGNALING BY RHO GTPASES | Genes involved in Signaling by Rho GTPases |
| 0.1 | 1.9 | REACTOME REVERSIBLE HYDRATION OF CARBON DIOXIDE | Genes involved in Reversible Hydration of Carbon Dioxide |
| 0.1 | 6.2 | REACTOME GLYCOLYSIS | Genes involved in Glycolysis |
| 0.1 | 2.2 | REACTOME HORMONE SENSITIVE LIPASE HSL MEDIATED TRIACYLGLYCEROL HYDROLYSIS | Genes involved in Hormone-sensitive lipase (HSL)-mediated triacylglycerol hydrolysis |
| 0.1 | 1.7 | REACTOME OTHER SEMAPHORIN INTERACTIONS | Genes involved in Other semaphorin interactions |
| 0.1 | 3.7 | REACTOME AMINO ACID AND OLIGOPEPTIDE SLC TRANSPORTERS | Genes involved in Amino acid and oligopeptide SLC transporters |
| 0.1 | 2.7 | REACTOME CGMP EFFECTS | Genes involved in cGMP effects |
| 0.1 | 1.9 | REACTOME INSULIN RECEPTOR RECYCLING | Genes involved in Insulin receptor recycling |
| 0.1 | 5.1 | REACTOME NUCLEAR RECEPTOR TRANSCRIPTION PATHWAY | Genes involved in Nuclear Receptor transcription pathway |
| 0.1 | 4.8 | REACTOME TRANSCRIPTIONAL REGULATION OF WHITE ADIPOCYTE DIFFERENTIATION | Genes involved in Transcriptional Regulation of White Adipocyte Differentiation |
| 0.0 | 2.6 | REACTOME COLLAGEN FORMATION | Genes involved in Collagen formation |
| 0.0 | 1.8 | REACTOME MYOGENESIS | Genes involved in Myogenesis |
| 0.0 | 4.2 | REACTOME PEPTIDE LIGAND BINDING RECEPTORS | Genes involved in Peptide ligand-binding receptors |