Project
GNF SymAtlas + NCI-60 cancer cell lines, comparison of cancers vs non-cancers, human (Su, 2004; Ross, 2000)
Navigation
Downloads
Results for GUGCAAA
Z-value: 0.09
Motif logo

miRNA associated with seed GUGCAAA
| Name | miRBASE accession |
|---|---|
|
hsa-miR-19a-3p
|
MIMAT0000073 |
|
hsa-miR-19b-3p
|
MIMAT0000074 |
Activity profile of GUGCAAA motif
Sorted Z-values of GUGCAAA motif
| Promoter | Log-likelihood | Transcript | Gene | Gene Info |
|---|---|---|---|---|
| chr5_-_136834982 | 24.98 |
ENST00000510689.1
ENST00000394945.1 |
SPOCK1
|
sparc/osteonectin, cwcv and kazal-like domains proteoglycan (testican) 1 |
| chr14_-_60097297 | 21.06 |
ENST00000395090.1
|
RTN1
|
reticulon 1 |
| chr1_+_51701924 | 20.51 |
ENST00000242719.3
|
RNF11
|
ring finger protein 11 |
| chr15_-_73925651 | 20.19 |
ENST00000545878.1
ENST00000287226.8 ENST00000345330.4 |
NPTN
|
neuroplastin |
| chr6_+_121756809 | 18.52 |
ENST00000282561.3
|
GJA1
|
gap junction protein, alpha 1, 43kDa |
| chr12_+_79258547 | 18.46 |
ENST00000457153.2
|
SYT1
|
synaptotagmin I |
| chrX_+_135067576 | 16.81 |
ENST00000370701.1
ENST00000370698.3 ENST00000370695.4 |
SLC9A6
|
solute carrier family 9, subfamily A (NHE6, cation proton antiporter 6), member 6 |
| chr7_-_95064264 | 16.75 |
ENST00000536183.1
ENST00000433091.2 ENST00000222572.3 |
PON2
|
paraoxonase 2 |
| chr14_+_90863327 | 15.71 |
ENST00000356978.4
|
CALM1
|
calmodulin 1 (phosphorylase kinase, delta) |
| chr1_+_84543734 | 15.52 |
ENST00000370689.2
|
PRKACB
|
protein kinase, cAMP-dependent, catalytic, beta |
| chr10_-_118764862 | 14.97 |
ENST00000260777.10
|
KIAA1598
|
KIAA1598 |
| chr5_-_73937244 | 12.79 |
ENST00000302351.4
ENST00000510316.1 ENST00000508331.1 |
ENC1
|
ectodermal-neural cortex 1 (with BTB domain) |
| chr20_+_19867150 | 12.78 |
ENST00000255006.6
|
RIN2
|
Ras and Rab interactor 2 |
| chr16_-_66785699 | 12.41 |
ENST00000258198.2
|
DYNC1LI2
|
dynein, cytoplasmic 1, light intermediate chain 2 |
| chr1_+_10271674 | 12.23 |
ENST00000377086.1
|
KIF1B
|
kinesin family member 1B |
| chr20_-_36156125 | 12.20 |
ENST00000397135.1
ENST00000397137.1 |
BLCAP
|
bladder cancer associated protein |
| chr15_-_34394119 | 12.08 |
ENST00000256545.4
|
EMC7
|
ER membrane protein complex subunit 7 |
| chr8_+_132916318 | 12.05 |
ENST00000254624.5
ENST00000522709.1 |
EFR3A
|
EFR3 homolog A (S. cerevisiae) |
| chr15_-_52861394 | 11.91 |
ENST00000563277.1
ENST00000566423.1 |
ARPP19
|
cAMP-regulated phosphoprotein, 19kDa |
| chr22_-_36236265 | 11.88 |
ENST00000414461.2
ENST00000416721.2 ENST00000449924.2 ENST00000262829.7 ENST00000397305.3 |
RBFOX2
|
RNA binding protein, fox-1 homolog (C. elegans) 2 |
| chr7_+_35840542 | 11.66 |
ENST00000435235.1
ENST00000399034.2 ENST00000350320.6 ENST00000469679.2 |
SEPT7
|
septin 7 |
| chr1_+_236558694 | 11.52 |
ENST00000359362.5
|
EDARADD
|
EDAR-associated death domain |
| chr11_-_12030629 | 11.38 |
ENST00000396505.2
|
DKK3
|
dickkopf WNT signaling pathway inhibitor 3 |
| chr5_+_71403061 | 11.13 |
ENST00000512974.1
ENST00000296755.7 |
MAP1B
|
microtubule-associated protein 1B |
| chr6_-_134639180 | 10.06 |
ENST00000367858.5
|
SGK1
|
serum/glucocorticoid regulated kinase 1 |
| chr9_-_93405352 | 9.95 |
ENST00000375765.3
|
DIRAS2
|
DIRAS family, GTP-binding RAS-like 2 |
| chr6_-_16761678 | 9.80 |
ENST00000244769.4
ENST00000436367.1 |
ATXN1
|
ataxin 1 |
| chr8_-_110660999 | 9.74 |
ENST00000424158.2
ENST00000533895.1 ENST00000446070.2 ENST00000528331.1 ENST00000526302.1 ENST00000433638.1 ENST00000408908.2 ENST00000524720.1 |
SYBU
|
syntabulin (syntaxin-interacting) |
| chr17_-_1083078 | 9.51 |
ENST00000574266.1
ENST00000302538.5 |
ABR
|
active BCR-related |
| chr1_-_93426998 | 9.41 |
ENST00000370310.4
|
FAM69A
|
family with sequence similarity 69, member A |
| chr1_+_244214577 | 9.14 |
ENST00000358704.4
|
ZBTB18
|
zinc finger and BTB domain containing 18 |
| chr2_-_2334888 | 9.04 |
ENST00000428368.2
ENST00000399161.2 |
MYT1L
|
myelin transcription factor 1-like |
| chr10_-_75173785 | 8.83 |
ENST00000535178.1
ENST00000372921.5 ENST00000372919.4 |
ANXA7
|
annexin A7 |
| chr17_+_57784826 | 8.66 |
ENST00000262291.4
|
VMP1
|
vacuole membrane protein 1 |
| chr4_+_41362796 | 8.63 |
ENST00000508501.1
ENST00000512946.1 ENST00000313860.7 ENST00000512632.1 ENST00000512820.1 |
LIMCH1
|
LIM and calponin homology domains 1 |
| chr12_+_56367697 | 8.58 |
ENST00000553116.1
ENST00000360299.5 ENST00000548068.1 ENST00000549915.1 ENST00000551459.1 ENST00000448789.2 |
RAB5B
|
RAB5B, member RAS oncogene family |
| chr2_-_86094764 | 8.57 |
ENST00000393808.3
|
ST3GAL5
|
ST3 beta-galactoside alpha-2,3-sialyltransferase 5 |
| chr2_+_20646824 | 8.52 |
ENST00000272233.4
|
RHOB
|
ras homolog family member B |
| chr17_-_62658186 | 8.36 |
ENST00000262435.9
|
SMURF2
|
SMAD specific E3 ubiquitin protein ligase 2 |
| chr5_+_86564739 | 8.25 |
ENST00000456692.2
ENST00000512763.1 ENST00000506290.1 |
RASA1
|
RAS p21 protein activator (GTPase activating protein) 1 |
| chr1_-_1624083 | 8.14 |
ENST00000378662.1
ENST00000234800.6 |
SLC35E2B
|
solute carrier family 35, member E2B |
| chr2_-_169104651 | 8.11 |
ENST00000355999.4
|
STK39
|
serine threonine kinase 39 |
| chr13_-_30424821 | 7.94 |
ENST00000380680.4
|
UBL3
|
ubiquitin-like 3 |
| chr18_+_8717369 | 7.92 |
ENST00000359865.3
ENST00000400050.3 ENST00000306285.7 |
SOGA2
|
SOGA family member 2 |
| chr5_+_140227048 | 7.75 |
ENST00000532602.1
|
PCDHA9
|
protocadherin alpha 9 |
| chr11_-_117186946 | 7.68 |
ENST00000313005.6
ENST00000528053.1 |
BACE1
|
beta-site APP-cleaving enzyme 1 |
| chr5_+_140220769 | 7.63 |
ENST00000531613.1
ENST00000378123.3 |
PCDHA8
|
protocadherin alpha 8 |
| chr15_-_49338748 | 7.57 |
ENST00000559471.1
|
SECISBP2L
|
SECIS binding protein 2-like |
| chr1_+_155829286 | 7.57 |
ENST00000368324.4
|
SYT11
|
synaptotagmin XI |
| chr20_-_48330377 | 7.56 |
ENST00000371711.4
|
B4GALT5
|
UDP-Gal:betaGlcNAc beta 1,4- galactosyltransferase, polypeptide 5 |
| chr15_+_52311398 | 7.52 |
ENST00000261845.5
|
MAPK6
|
mitogen-activated protein kinase 6 |
| chr11_+_121322832 | 7.48 |
ENST00000260197.7
|
SORL1
|
sortilin-related receptor, L(DLR class) A repeats containing |
| chr8_-_103876965 | 7.42 |
ENST00000337198.5
|
AZIN1
|
antizyme inhibitor 1 |
| chr14_-_64010046 | 7.38 |
ENST00000337537.3
|
PPP2R5E
|
protein phosphatase 2, regulatory subunit B', epsilon isoform |
| chr2_-_225811747 | 7.31 |
ENST00000409592.3
|
DOCK10
|
dedicator of cytokinesis 10 |
| chr3_-_66551351 | 7.25 |
ENST00000273261.3
|
LRIG1
|
leucine-rich repeats and immunoglobulin-like domains 1 |
| chr15_-_51914996 | 7.08 |
ENST00000251076.5
|
DMXL2
|
Dmx-like 2 |
| chr6_-_53213780 | 6.96 |
ENST00000304434.6
ENST00000370918.4 |
ELOVL5
|
ELOVL fatty acid elongase 5 |
| chr18_-_61089665 | 6.91 |
ENST00000238497.5
|
VPS4B
|
vacuolar protein sorting 4 homolog B (S. cerevisiae) |
| chr5_+_140248518 | 6.86 |
ENST00000398640.2
|
PCDHA11
|
protocadherin alpha 11 |
| chr3_+_130569429 | 6.71 |
ENST00000505330.1
ENST00000504381.1 ENST00000507488.2 ENST00000393221.4 |
ATP2C1
|
ATPase, Ca++ transporting, type 2C, member 1 |
| chr1_+_160175117 | 6.67 |
ENST00000360472.4
|
PEA15
|
phosphoprotein enriched in astrocytes 15 |
| chr1_-_244615425 | 6.66 |
ENST00000366535.3
|
ADSS
|
adenylosuccinate synthase |
| chr2_-_85555385 | 6.44 |
ENST00000377386.3
|
TGOLN2
|
trans-golgi network protein 2 |
| chr9_+_115913222 | 6.36 |
ENST00000259392.3
|
SLC31A2
|
solute carrier family 31 (copper transporter), member 2 |
| chr10_+_63661053 | 6.32 |
ENST00000279873.7
|
ARID5B
|
AT rich interactive domain 5B (MRF1-like) |
| chr5_+_95997918 | 6.30 |
ENST00000395812.2
ENST00000395813.1 ENST00000359176.4 ENST00000325674.7 |
CAST
|
calpastatin |
| chr1_-_51984908 | 6.27 |
ENST00000371730.2
|
EPS15
|
epidermal growth factor receptor pathway substrate 15 |
| chr2_+_9346892 | 6.24 |
ENST00000281419.3
ENST00000315273.4 |
ASAP2
|
ArfGAP with SH3 domain, ankyrin repeat and PH domain 2 |
| chr2_+_231577532 | 6.23 |
ENST00000258418.5
|
CAB39
|
calcium binding protein 39 |
| chr1_-_70671216 | 6.19 |
ENST00000370952.3
|
LRRC40
|
leucine rich repeat containing 40 |
| chrX_+_77359671 | 6.19 |
ENST00000373316.4
|
PGK1
|
phosphoglycerate kinase 1 |
| chr5_+_140306478 | 6.16 |
ENST00000253807.2
|
PCDHAC1
|
protocadherin alpha subfamily C, 1 |
| chr16_-_47007545 | 6.14 |
ENST00000317089.5
|
DNAJA2
|
DnaJ (Hsp40) homolog, subfamily A, member 2 |
| chr15_+_59279851 | 6.09 |
ENST00000348370.4
ENST00000434298.1 ENST00000559160.1 |
RNF111
|
ring finger protein 111 |
| chr12_+_72148614 | 6.05 |
ENST00000261263.3
|
RAB21
|
RAB21, member RAS oncogene family |
| chr10_-_73611046 | 6.03 |
ENST00000394934.1
ENST00000394936.3 |
PSAP
|
prosaposin |
| chr16_-_46723066 | 5.99 |
ENST00000299138.7
|
VPS35
|
vacuolar protein sorting 35 homolog (S. cerevisiae) |
| chr7_-_111846435 | 5.97 |
ENST00000437633.1
ENST00000428084.1 |
DOCK4
|
dedicator of cytokinesis 4 |
| chr1_-_149889382 | 5.97 |
ENST00000369145.1
ENST00000369146.3 |
SV2A
|
synaptic vesicle glycoprotein 2A |
| chr4_-_76598296 | 5.94 |
ENST00000395719.3
|
G3BP2
|
GTPase activating protein (SH3 domain) binding protein 2 |
| chr4_-_71705590 | 5.85 |
ENST00000254799.6
|
GRSF1
|
G-rich RNA sequence binding factor 1 |
| chr17_-_73851285 | 5.82 |
ENST00000589642.1
ENST00000593002.1 ENST00000590221.1 ENST00000344296.4 ENST00000587374.1 ENST00000585462.1 ENST00000433525.2 ENST00000254806.3 |
WBP2
|
WW domain binding protein 2 |
| chrX_+_118708493 | 5.75 |
ENST00000371558.2
|
UBE2A
|
ubiquitin-conjugating enzyme E2A |
| chr11_-_45687128 | 5.56 |
ENST00000308064.2
|
CHST1
|
carbohydrate (keratan sulfate Gal-6) sulfotransferase 1 |
| chr1_-_226924980 | 5.50 |
ENST00000272117.3
|
ITPKB
|
inositol-trisphosphate 3-kinase B |
| chr5_+_140345820 | 5.48 |
ENST00000289269.5
|
PCDHAC2
|
protocadherin alpha subfamily C, 2 |
| chr3_-_9291063 | 5.48 |
ENST00000383836.3
|
SRGAP3
|
SLIT-ROBO Rho GTPase activating protein 3 |
| chr17_-_80606304 | 5.45 |
ENST00000392325.4
|
WDR45B
|
WD repeat domain 45B |
| chr17_+_57697216 | 5.38 |
ENST00000393043.1
ENST00000269122.3 |
CLTC
|
clathrin, heavy chain (Hc) |
| chr4_-_5894777 | 5.34 |
ENST00000324989.7
|
CRMP1
|
collapsin response mediator protein 1 |
| chr20_+_1246908 | 5.34 |
ENST00000381873.3
ENST00000381867.1 |
SNPH
|
syntaphilin |
| chrX_+_146993449 | 5.33 |
ENST00000218200.8
ENST00000370471.3 ENST00000370477.1 |
FMR1
|
fragile X mental retardation 1 |
| chrX_-_34675391 | 5.20 |
ENST00000275954.3
|
TMEM47
|
transmembrane protein 47 |
| chr1_-_243418344 | 5.13 |
ENST00000366542.1
|
CEP170
|
centrosomal protein 170kDa |
| chr19_+_41768401 | 5.02 |
ENST00000352456.3
ENST00000595018.1 ENST00000597725.1 |
HNRNPUL1
|
heterogeneous nuclear ribonucleoprotein U-like 1 |
| chr5_+_140254884 | 5.02 |
ENST00000398631.2
|
PCDHA12
|
protocadherin alpha 12 |
| chr15_+_40532058 | 4.96 |
ENST00000260404.4
|
PAK6
|
p21 protein (Cdc42/Rac)-activated kinase 6 |
| chr10_+_180987 | 4.89 |
ENST00000381591.1
|
ZMYND11
|
zinc finger, MYND-type containing 11 |
| chr1_-_212004090 | 4.86 |
ENST00000366997.4
|
LPGAT1
|
lysophosphatidylglycerol acyltransferase 1 |
| chr1_-_185286461 | 4.81 |
ENST00000367498.3
|
IVNS1ABP
|
influenza virus NS1A binding protein |
| chr22_-_39268308 | 4.76 |
ENST00000407418.3
|
CBX6
|
chromobox homolog 6 |
| chr1_+_29063271 | 4.76 |
ENST00000373812.3
|
YTHDF2
|
YTH domain family, member 2 |
| chr12_-_57082060 | 4.58 |
ENST00000448157.2
ENST00000414274.3 ENST00000262033.6 ENST00000456859.2 |
PTGES3
|
prostaglandin E synthase 3 (cytosolic) |
| chr1_+_7831323 | 4.55 |
ENST00000054666.6
|
VAMP3
|
vesicle-associated membrane protein 3 |
| chr4_+_166248775 | 4.54 |
ENST00000261507.6
ENST00000507013.1 ENST00000393766.2 ENST00000504317.1 |
MSMO1
|
methylsterol monooxygenase 1 |
| chr5_+_140213815 | 4.53 |
ENST00000525929.1
ENST00000378125.3 |
PCDHA7
|
protocadherin alpha 7 |
| chr2_+_134877740 | 4.51 |
ENST00000409645.1
|
MGAT5
|
mannosyl (alpha-1,6-)-glycoprotein beta-1,6-N-acetyl-glucosaminyltransferase |
| chr18_+_9913977 | 4.51 |
ENST00000400000.2
ENST00000340541.4 |
VAPA
|
VAMP (vesicle-associated membrane protein)-associated protein A, 33kDa |
| chr5_+_138940742 | 4.49 |
ENST00000398733.3
ENST00000253815.2 ENST00000505007.1 |
UBE2D2
|
ubiquitin-conjugating enzyme E2D 2 |
| chr6_+_96463840 | 4.43 |
ENST00000302103.5
|
FUT9
|
fucosyltransferase 9 (alpha (1,3) fucosyltransferase) |
| chr3_+_50712672 | 4.38 |
ENST00000266037.9
|
DOCK3
|
dedicator of cytokinesis 3 |
| chr4_-_69215699 | 4.33 |
ENST00000510746.1
ENST00000344157.4 ENST00000355665.3 |
YTHDC1
|
YTH domain containing 1 |
| chr13_+_97874574 | 4.31 |
ENST00000343600.4
ENST00000345429.6 ENST00000376673.3 |
MBNL2
|
muscleblind-like splicing regulator 2 |
| chr2_-_183903133 | 4.31 |
ENST00000361354.4
|
NCKAP1
|
NCK-associated protein 1 |
| chr7_+_12250886 | 4.30 |
ENST00000444443.1
ENST00000396667.3 |
TMEM106B
|
transmembrane protein 106B |
| chr12_+_56473628 | 4.28 |
ENST00000549282.1
ENST00000549061.1 ENST00000267101.3 |
ERBB3
|
v-erb-b2 avian erythroblastic leukemia viral oncogene homolog 3 |
| chr10_+_111767720 | 4.24 |
ENST00000356080.4
ENST00000277900.8 |
ADD3
|
adducin 3 (gamma) |
| chr9_-_14314066 | 4.23 |
ENST00000397575.3
|
NFIB
|
nuclear factor I/B |
| chr3_+_49591881 | 4.22 |
ENST00000296452.4
|
BSN
|
bassoon presynaptic cytomatrix protein |
| chr1_+_160085501 | 4.21 |
ENST00000361216.3
|
ATP1A2
|
ATPase, Na+/K+ transporting, alpha 2 polypeptide |
| chr6_-_132272504 | 4.20 |
ENST00000367976.3
|
CTGF
|
connective tissue growth factor |
| chr20_+_47662805 | 4.18 |
ENST00000262982.2
ENST00000542325.1 |
CSE1L
|
CSE1 chromosome segregation 1-like (yeast) |
| chr22_-_21213029 | 4.17 |
ENST00000572273.1
ENST00000255882.6 |
PI4KA
|
phosphatidylinositol 4-kinase, catalytic, alpha |
| chr5_-_176889381 | 4.16 |
ENST00000393563.4
ENST00000512501.1 |
DBN1
|
drebrin 1 |
| chr17_+_57642886 | 4.12 |
ENST00000251241.4
ENST00000451169.2 ENST00000425628.3 ENST00000584385.1 ENST00000580030.1 |
DHX40
|
DEAH (Asp-Glu-Ala-His) box polypeptide 40 |
| chr4_+_38869410 | 4.08 |
ENST00000358869.2
|
FAM114A1
|
family with sequence similarity 114, member A1 |
| chr10_-_98346801 | 4.05 |
ENST00000371142.4
|
TM9SF3
|
transmembrane 9 superfamily member 3 |
| chr3_+_186501336 | 4.03 |
ENST00000323963.5
ENST00000440191.2 ENST00000356531.5 |
EIF4A2
|
eukaryotic translation initiation factor 4A2 |
| chr9_-_36400213 | 4.02 |
ENST00000259605.6
ENST00000353739.4 |
RNF38
|
ring finger protein 38 |
| chr5_+_140165876 | 4.01 |
ENST00000504120.2
ENST00000394633.3 ENST00000378133.3 |
PCDHA1
|
protocadherin alpha 1 |
| chr10_+_95256356 | 3.99 |
ENST00000371485.3
|
CEP55
|
centrosomal protein 55kDa |
| chr3_-_12705600 | 3.92 |
ENST00000542177.1
ENST00000442415.2 ENST00000251849.4 |
RAF1
|
v-raf-1 murine leukemia viral oncogene homolog 1 |
| chr16_+_3070313 | 3.84 |
ENST00000326577.4
|
TNFRSF12A
|
tumor necrosis factor receptor superfamily, member 12A |
| chr7_-_79082867 | 3.83 |
ENST00000419488.1
ENST00000354212.4 |
MAGI2
|
membrane associated guanylate kinase, WW and PDZ domain containing 2 |
| chr2_-_202316260 | 3.82 |
ENST00000332624.3
|
TRAK2
|
trafficking protein, kinesin binding 2 |
| chr7_-_45960850 | 3.81 |
ENST00000381083.4
ENST00000381086.5 ENST00000275521.6 |
IGFBP3
|
insulin-like growth factor binding protein 3 |
| chr10_-_79686284 | 3.81 |
ENST00000372391.2
ENST00000372388.2 |
DLG5
|
discs, large homolog 5 (Drosophila) |
| chr3_+_171758344 | 3.80 |
ENST00000336824.4
ENST00000423424.1 |
FNDC3B
|
fibronectin type III domain containing 3B |
| chr12_-_57824739 | 3.78 |
ENST00000347140.3
ENST00000402412.1 |
R3HDM2
|
R3H domain containing 2 |
| chr8_+_59323823 | 3.76 |
ENST00000399598.2
|
UBXN2B
|
UBX domain protein 2B |
| chr20_-_43150601 | 3.73 |
ENST00000541235.1
ENST00000255175.1 ENST00000342374.4 |
SERINC3
|
serine incorporator 3 |
| chr8_+_6565854 | 3.69 |
ENST00000285518.6
|
AGPAT5
|
1-acylglycerol-3-phosphate O-acyltransferase 5 |
| chr1_-_78225482 | 3.67 |
ENST00000524778.1
ENST00000370794.3 ENST00000370793.1 ENST00000370792.3 |
USP33
|
ubiquitin specific peptidase 33 |
| chr11_+_123396528 | 3.61 |
ENST00000322282.7
ENST00000529750.1 |
GRAMD1B
|
GRAM domain containing 1B |
| chr8_+_104311059 | 3.60 |
ENST00000358755.4
ENST00000523739.1 ENST00000540287.1 |
FZD6
|
frizzled family receptor 6 |
| chr5_-_132073210 | 3.55 |
ENST00000378735.1
ENST00000378746.4 |
KIF3A
|
kinesin family member 3A |
| chrX_-_10645773 | 3.54 |
ENST00000453318.2
|
MID1
|
midline 1 (Opitz/BBB syndrome) |
| chr1_+_112162381 | 3.53 |
ENST00000433097.1
ENST00000369709.3 ENST00000436150.2 |
RAP1A
|
RAP1A, member of RAS oncogene family |
| chr5_-_171433819 | 3.48 |
ENST00000296933.6
|
FBXW11
|
F-box and WD repeat domain containing 11 |
| chr13_-_107187462 | 3.46 |
ENST00000245323.4
|
EFNB2
|
ephrin-B2 |
| chrX_-_108976521 | 3.42 |
ENST00000469796.2
ENST00000502391.1 ENST00000508092.1 ENST00000340800.2 ENST00000348502.6 |
ACSL4
|
acyl-CoA synthetase long-chain family member 4 |
| chr9_-_79520989 | 3.41 |
ENST00000376713.3
ENST00000376718.3 ENST00000428286.1 |
PRUNE2
|
prune homolog 2 (Drosophila) |
| chrX_-_1511617 | 3.37 |
ENST00000381401.5
|
SLC25A6
|
solute carrier family 25 (mitochondrial carrier; adenine nucleotide translocator), member 6 |
| chr9_+_2015335 | 3.31 |
ENST00000349721.2
ENST00000357248.2 ENST00000450198.1 |
SMARCA2
|
SWI/SNF related, matrix associated, actin dependent regulator of chromatin, subfamily a, member 2 |
| chr20_+_19193269 | 3.30 |
ENST00000328041.6
|
SLC24A3
|
solute carrier family 24 (sodium/potassium/calcium exchanger), member 3 |
| chr16_-_46655538 | 3.28 |
ENST00000303383.3
|
SHCBP1
|
SHC SH2-domain binding protein 1 |
| chr8_-_67525473 | 3.27 |
ENST00000522677.3
|
MYBL1
|
v-myb avian myeloblastosis viral oncogene homolog-like 1 |
| chr13_-_36920420 | 3.25 |
ENST00000438666.2
|
SPG20
|
spastic paraplegia 20 (Troyer syndrome) |
| chr5_-_133968529 | 3.24 |
ENST00000402673.2
|
SAR1B
|
SAR1 homolog B (S. cerevisiae) |
| chr2_-_161350305 | 3.21 |
ENST00000348849.3
|
RBMS1
|
RNA binding motif, single stranded interacting protein 1 |
| chr2_-_65357225 | 3.19 |
ENST00000398529.3
ENST00000409751.1 ENST00000356214.7 ENST00000409892.1 ENST00000409784.3 |
RAB1A
|
RAB1A, member RAS oncogene family |
| chr6_+_44238203 | 3.16 |
ENST00000451188.2
|
TMEM151B
|
transmembrane protein 151B |
| chr17_+_68165657 | 3.14 |
ENST00000243457.3
|
KCNJ2
|
potassium inwardly-rectifying channel, subfamily J, member 2 |
| chr1_+_93913713 | 3.09 |
ENST00000604705.1
ENST00000370253.2 |
FNBP1L
|
formin binding protein 1-like |
| chr8_+_104831472 | 3.09 |
ENST00000262231.10
ENST00000507740.1 |
RIMS2
|
regulating synaptic membrane exocytosis 2 |
| chr9_+_125703282 | 3.07 |
ENST00000373647.4
ENST00000402311.1 |
RABGAP1
|
RAB GTPase activating protein 1 |
| chr12_+_69004619 | 3.06 |
ENST00000250559.9
ENST00000393436.5 ENST00000425247.2 ENST00000489473.2 ENST00000422358.2 ENST00000541167.1 ENST00000538283.1 ENST00000341355.5 ENST00000537460.1 ENST00000450214.2 ENST00000545270.1 ENST00000538980.1 ENST00000542018.1 ENST00000543393.1 |
RAP1B
|
RAP1B, member of RAS oncogene family |
| chr12_+_1800179 | 3.04 |
ENST00000357103.4
|
ADIPOR2
|
adiponectin receptor 2 |
| chr2_+_62932779 | 3.01 |
ENST00000427809.1
ENST00000405482.1 ENST00000431489.1 |
EHBP1
|
EH domain binding protein 1 |
| chr10_+_96162242 | 3.00 |
ENST00000225235.4
|
TBC1D12
|
TBC1 domain family, member 12 |
| chr1_-_201438282 | 2.99 |
ENST00000367311.3
ENST00000367309.1 |
PHLDA3
|
pleckstrin homology-like domain, family A, member 3 |
| chr8_+_20054878 | 2.97 |
ENST00000276390.2
ENST00000519667.1 |
ATP6V1B2
|
ATPase, H+ transporting, lysosomal 56/58kDa, V1 subunit B2 |
| chr1_+_178995021 | 2.84 |
ENST00000263733.4
|
FAM20B
|
family with sequence similarity 20, member B |
| chr15_+_62853562 | 2.84 |
ENST00000561311.1
|
TLN2
|
talin 2 |
| chr2_-_97535708 | 2.83 |
ENST00000305476.5
|
SEMA4C
|
sema domain, immunoglobulin domain (Ig), transmembrane domain (TM) and short cytoplasmic domain, (semaphorin) 4C |
| chr1_+_28099683 | 2.81 |
ENST00000373943.4
|
STX12
|
syntaxin 12 |
| chr6_+_64281906 | 2.77 |
ENST00000370651.3
|
PTP4A1
|
protein tyrosine phosphatase type IVA, member 1 |
| chr17_+_16593539 | 2.75 |
ENST00000340621.5
ENST00000399273.1 ENST00000443444.2 ENST00000360524.8 ENST00000456009.1 |
CCDC144A
|
coiled-coil domain containing 144A |
| chr2_-_39664405 | 2.73 |
ENST00000341681.5
ENST00000263881.3 |
MAP4K3
|
mitogen-activated protein kinase kinase kinase kinase 3 |
| chr12_-_53893399 | 2.72 |
ENST00000267079.2
|
MAP3K12
|
mitogen-activated protein kinase kinase kinase 12 |
| chr1_+_114472222 | 2.72 |
ENST00000369558.1
ENST00000369561.4 |
HIPK1
|
homeodomain interacting protein kinase 1 |
| chr4_-_36246060 | 2.68 |
ENST00000303965.4
|
ARAP2
|
ArfGAP with RhoGAP domain, ankyrin repeat and PH domain 2 |
| chr10_+_28966271 | 2.67 |
ENST00000375533.3
|
BAMBI
|
BMP and activin membrane-bound inhibitor |
| chr9_+_131873591 | 2.66 |
ENST00000393370.2
ENST00000337738.1 ENST00000348141.5 |
PPP2R4
|
protein phosphatase 2A activator, regulatory subunit 4 |
| chr1_-_222885770 | 2.64 |
ENST00000355727.2
ENST00000340020.6 |
AIDA
|
axin interactor, dorsalization associated |
| chr2_+_189156389 | 2.63 |
ENST00000409843.1
|
GULP1
|
GULP, engulfment adaptor PTB domain containing 1 |
| chr9_+_103790991 | 2.60 |
ENST00000374874.3
|
LPPR1
|
Lipid phosphate phosphatase-related protein type 1 |
| chr17_+_28705921 | 2.59 |
ENST00000225719.4
|
CPD
|
carboxypeptidase D |
| chr16_+_67063036 | 2.58 |
ENST00000290858.6
ENST00000564034.1 |
CBFB
|
core-binding factor, beta subunit |
| chr3_-_138553594 | 2.58 |
ENST00000477593.1
ENST00000483968.1 |
PIK3CB
|
phosphatidylinositol-4,5-bisphosphate 3-kinase, catalytic subunit beta |
| chr2_-_86564776 | 2.57 |
ENST00000165698.5
ENST00000541910.1 ENST00000535845.1 |
REEP1
|
receptor accessory protein 1 |
| chr4_-_170924888 | 2.56 |
ENST00000502832.1
ENST00000393704.3 |
MFAP3L
|
microfibrillar-associated protein 3-like |
| chr11_+_34073195 | 2.56 |
ENST00000341394.4
|
CAPRIN1
|
cell cycle associated protein 1 |
| chr9_-_74980113 | 2.53 |
ENST00000376962.5
ENST00000376960.4 ENST00000237937.3 |
ZFAND5
|
zinc finger, AN1-type domain 5 |
| chr2_-_69614373 | 2.52 |
ENST00000361060.5
ENST00000357308.4 |
GFPT1
|
glutamine--fructose-6-phosphate transaminase 1 |
| chr22_-_18507279 | 2.52 |
ENST00000441493.2
ENST00000444520.1 ENST00000207726.7 ENST00000429452.1 |
MICAL3
|
microtubule associated monooxygenase, calponin and LIM domain containing 3 |
| chrX_-_47479246 | 2.52 |
ENST00000295987.7
ENST00000340666.4 |
SYN1
|
synapsin I |
| chr8_-_22550815 | 2.51 |
ENST00000317216.2
|
EGR3
|
early growth response 3 |
| chr12_+_12764773 | 2.50 |
ENST00000228865.2
|
CREBL2
|
cAMP responsive element binding protein-like 2 |
Network of associatons between targets according to the STRING database.

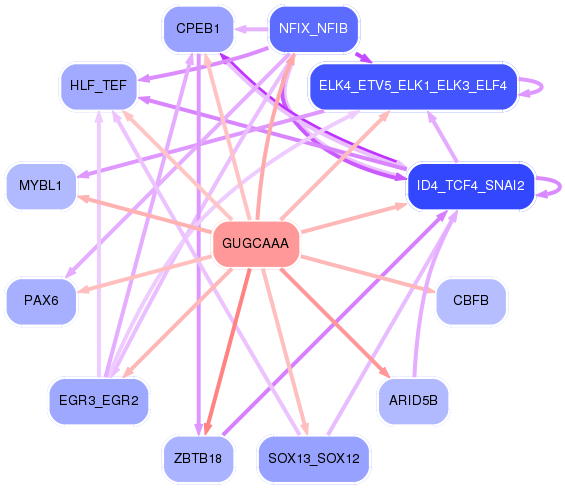
First level regulatory network of GUGCAAA
Gene Ontology Analysis
Gene overrepresentation in biological_process category:
| Log-likelihood per target | Total log-likelihood | Term | Description |
|---|---|---|---|
| 7.5 | 22.6 | GO:0048170 | positive regulation of long-term neuronal synaptic plasticity(GO:0048170) |
| 6.2 | 18.5 | GO:0098746 | fast, calcium ion-dependent exocytosis of neurotransmitter(GO:0098746) |
| 4.8 | 14.3 | GO:2000681 | negative regulation of rubidium ion transport(GO:2000681) negative regulation of rubidium ion transmembrane transporter activity(GO:2000687) |
| 4.6 | 18.5 | GO:0010645 | regulation of cell communication by chemical coupling(GO:0010645) positive regulation of cell communication by chemical coupling(GO:0010652) |
| 4.1 | 12.2 | GO:1904647 | response to rotenone(GO:1904647) |
| 3.2 | 9.5 | GO:0043314 | negative regulation of neutrophil degranulation(GO:0043314) |
| 3.1 | 15.5 | GO:0097338 | response to clozapine(GO:0097338) |
| 2.8 | 11.4 | GO:1902612 | regulation of anti-Mullerian hormone signaling pathway(GO:1902612) negative regulation of anti-Mullerian hormone signaling pathway(GO:1902613) anti-Mullerian hormone signaling pathway(GO:1990262) |
| 2.5 | 7.6 | GO:1905154 | negative regulation of membrane invagination(GO:1905154) |
| 2.5 | 7.5 | GO:1905246 | regulation of choline O-acetyltransferase activity(GO:1902769) positive regulation of choline O-acetyltransferase activity(GO:1902771) negative regulation of tau-protein kinase activity(GO:1902948) positive regulation of early endosome to recycling endosome transport(GO:1902955) negative regulation of aspartic-type endopeptidase activity involved in amyloid precursor protein catabolic process(GO:1902960) negative regulation of neurofibrillary tangle assembly(GO:1902997) negative regulation of aspartic-type peptidase activity(GO:1905246) |
| 2.5 | 7.4 | GO:1903336 | negative regulation of vacuolar transport(GO:1903336) |
| 2.4 | 7.3 | GO:0032474 | otolith morphogenesis(GO:0032474) |
| 2.3 | 11.7 | GO:0016476 | regulation of embryonic cell shape(GO:0016476) |
| 2.3 | 6.9 | GO:0090611 | ubiquitin-independent protein catabolic process via the multivesicular body sorting pathway(GO:0090611) negative regulation of exosomal secretion(GO:1903542) regulation of centriole elongation(GO:1903722) |
| 2.2 | 6.7 | GO:0044208 | 'de novo' AMP biosynthetic process(GO:0044208) |
| 2.1 | 8.4 | GO:1901165 | positive regulation of trophoblast cell migration(GO:1901165) |
| 2.1 | 4.2 | GO:0010643 | cell communication by chemical coupling(GO:0010643) |
| 2.0 | 11.9 | GO:0010724 | regulation of definitive erythrocyte differentiation(GO:0010724) |
| 1.9 | 19.1 | GO:0031547 | brain-derived neurotrophic factor receptor signaling pathway(GO:0031547) |
| 1.9 | 7.4 | GO:0033387 | putrescine biosynthetic process from ornithine(GO:0033387) |
| 1.8 | 5.3 | GO:1904530 | negative regulation of actin filament binding(GO:1904530) negative regulation of actin binding(GO:1904617) |
| 1.8 | 8.9 | GO:2000301 | negative regulation of synaptic vesicle exocytosis(GO:2000301) |
| 1.5 | 4.5 | GO:0044828 | negative regulation by host of viral genome replication(GO:0044828) |
| 1.4 | 10.1 | GO:0070294 | renal sodium ion absorption(GO:0070294) |
| 1.4 | 12.8 | GO:0010499 | proteasomal ubiquitin-independent protein catabolic process(GO:0010499) |
| 1.4 | 4.2 | GO:0070318 | positive regulation of G0 to G1 transition(GO:0070318) |
| 1.3 | 3.8 | GO:0098937 | dendritic transport(GO:0098935) anterograde dendritic transport(GO:0098937) |
| 1.3 | 1.3 | GO:0044861 | protein transport into plasma membrane raft(GO:0044861) |
| 1.2 | 7.0 | GO:0019367 | fatty acid elongation, saturated fatty acid(GO:0019367) fatty acid elongation, unsaturated fatty acid(GO:0019368) fatty acid elongation, monounsaturated fatty acid(GO:0034625) fatty acid elongation, polyunsaturated fatty acid(GO:0034626) |
| 1.2 | 8.1 | GO:0033029 | regulation of neutrophil apoptotic process(GO:0033029) |
| 1.1 | 3.4 | GO:0046732 | induction by symbiont of host defense response(GO:0044416) induction of host immune response by virus(GO:0046730) active induction of host immune response by virus(GO:0046732) modulation by symbiont of host defense response(GO:0052031) induction by organism of defense response of other organism involved in symbiotic interaction(GO:0052251) modulation by organism of defense response of other organism involved in symbiotic interaction(GO:0052255) positive regulation by symbiont of host defense response(GO:0052509) positive regulation by organism of defense response of other organism involved in symbiotic interaction(GO:0052510) modulation by organism of immune response of other organism involved in symbiotic interaction(GO:0052552) modulation by symbiont of host immune response(GO:0052553) modulation by virus of host immune response(GO:0075528) |
| 1.1 | 6.7 | GO:0032468 | Golgi calcium ion homeostasis(GO:0032468) |
| 1.1 | 4.2 | GO:0097368 | establishment of Sertoli cell barrier(GO:0097368) |
| 1.0 | 11.9 | GO:0045722 | positive regulation of gluconeogenesis(GO:0045722) |
| 1.0 | 7.9 | GO:0001574 | ganglioside biosynthetic process(GO:0001574) |
| 1.0 | 4.8 | GO:0045906 | negative regulation of vasoconstriction(GO:0045906) |
| 1.0 | 3.8 | GO:0071896 | protein localization to adherens junction(GO:0071896) |
| 1.0 | 1.0 | GO:0021897 | forebrain astrocyte differentiation(GO:0021896) forebrain astrocyte development(GO:0021897) |
| 0.9 | 3.6 | GO:0035880 | embryonic nail plate morphogenesis(GO:0035880) |
| 0.9 | 6.3 | GO:0019065 | receptor-mediated endocytosis of virus by host cell(GO:0019065) endocytosis involved in viral entry into host cell(GO:0075509) |
| 0.9 | 6.1 | GO:1903279 | regulation of calcium:sodium antiporter activity(GO:1903279) |
| 0.9 | 1.7 | GO:0023016 | signal transduction by trans-phosphorylation(GO:0023016) |
| 0.9 | 6.1 | GO:2000643 | positive regulation of early endosome to late endosome transport(GO:2000643) |
| 0.8 | 2.5 | GO:0097091 | synaptic vesicle clustering(GO:0097091) |
| 0.8 | 0.8 | GO:0090427 | activation of meiosis(GO:0090427) |
| 0.8 | 5.8 | GO:0071442 | positive regulation of histone H3-K14 acetylation(GO:0071442) |
| 0.8 | 3.3 | GO:0048698 | negative regulation of collateral sprouting in absence of injury(GO:0048698) |
| 0.8 | 7.1 | GO:0002315 | marginal zone B cell differentiation(GO:0002315) |
| 0.8 | 3.1 | GO:0090076 | relaxation of skeletal muscle(GO:0090076) |
| 0.8 | 3.1 | GO:0010752 | regulation of cGMP-mediated signaling(GO:0010752) |
| 0.8 | 3.8 | GO:0003402 | planar cell polarity pathway involved in axis elongation(GO:0003402) positive regulation of synaptic vesicle clustering(GO:2000809) |
| 0.7 | 2.2 | GO:0043490 | malate-aspartate shuttle(GO:0043490) |
| 0.7 | 16.8 | GO:0019372 | lipoxygenase pathway(GO:0019372) |
| 0.7 | 11.1 | GO:0061162 | establishment of monopolar cell polarity(GO:0061162) establishment or maintenance of monopolar cell polarity(GO:0061339) |
| 0.7 | 7.6 | GO:0001514 | selenocysteine incorporation(GO:0001514) translational readthrough(GO:0006451) |
| 0.7 | 2.7 | GO:2000672 | negative regulation of motor neuron apoptotic process(GO:2000672) |
| 0.7 | 4.8 | GO:1904688 | regulation of cap-independent translational initiation(GO:1903677) positive regulation of cap-independent translational initiation(GO:1903679) regulation of cytoplasmic translational initiation(GO:1904688) positive regulation of cytoplasmic translational initiation(GO:1904690) |
| 0.7 | 0.7 | GO:0035973 | aggrephagy(GO:0035973) |
| 0.7 | 6.0 | GO:0014052 | regulation of gamma-aminobutyric acid secretion(GO:0014052) |
| 0.7 | 8.6 | GO:0048227 | plasma membrane to endosome transport(GO:0048227) |
| 0.7 | 4.6 | GO:1903593 | regulation of histamine secretion by mast cell(GO:1903593) |
| 0.6 | 1.9 | GO:0002541 | activation of plasma proteins involved in acute inflammatory response(GO:0002541) |
| 0.6 | 6.4 | GO:0035434 | copper ion transmembrane transport(GO:0035434) |
| 0.6 | 1.9 | GO:0021966 | corticospinal neuron axon guidance(GO:0021966) |
| 0.6 | 1.9 | GO:0060920 | atrioventricular node development(GO:0003162) cardiac pacemaker cell differentiation(GO:0060920) cardiac pacemaker cell development(GO:0060926) |
| 0.6 | 4.2 | GO:0021730 | trigeminal sensory nucleus development(GO:0021730) principal sensory nucleus of trigeminal nerve development(GO:0021740) negative regulation of epithelial cell proliferation involved in lung morphogenesis(GO:2000795) |
| 0.6 | 7.1 | GO:0070072 | proton-transporting V-type ATPase complex assembly(GO:0070070) vacuolar proton-transporting V-type ATPase complex assembly(GO:0070072) |
| 0.6 | 3.4 | GO:0060136 | embryonic process involved in female pregnancy(GO:0060136) |
| 0.6 | 1.7 | GO:0007206 | phospholipase C-activating G-protein coupled glutamate receptor signaling pathway(GO:0007206) |
| 0.5 | 1.6 | GO:0046098 | hypoxanthine salvage(GO:0043103) guanine metabolic process(GO:0046098) |
| 0.5 | 3.7 | GO:0009597 | detection of virus(GO:0009597) |
| 0.5 | 2.0 | GO:0042256 | mature ribosome assembly(GO:0042256) |
| 0.5 | 2.5 | GO:0061107 | prostate gland stromal morphogenesis(GO:0060741) seminal vesicle development(GO:0061107) |
| 0.5 | 2.5 | GO:0030579 | ubiquitin-dependent SMAD protein catabolic process(GO:0030579) |
| 0.5 | 4.2 | GO:1900125 | regulation of hyaluronan biosynthetic process(GO:1900125) |
| 0.5 | 31.5 | GO:0051865 | protein autoubiquitination(GO:0051865) |
| 0.5 | 6.4 | GO:0070389 | chaperone cofactor-dependent protein refolding(GO:0070389) |
| 0.5 | 2.7 | GO:0060235 | lens induction in camera-type eye(GO:0060235) |
| 0.4 | 0.4 | GO:0003241 | growth involved in heart morphogenesis(GO:0003241) |
| 0.4 | 1.3 | GO:0045578 | negative regulation of B cell differentiation(GO:0045578) |
| 0.4 | 2.2 | GO:0061136 | regulation of proteasomal ubiquitin-dependent protein catabolic process(GO:0032434) regulation of proteasomal protein catabolic process(GO:0061136) regulation of proteolysis involved in cellular protein catabolic process(GO:1903050) |
| 0.4 | 4.3 | GO:0072383 | plus-end-directed vesicle transport along microtubule(GO:0072383) |
| 0.4 | 2.9 | GO:0000290 | deadenylation-dependent decapping of nuclear-transcribed mRNA(GO:0000290) |
| 0.4 | 3.3 | GO:0006931 | substrate-dependent cell migration, cell attachment to substrate(GO:0006931) |
| 0.4 | 2.0 | GO:0098728 | germ-line stem cell division(GO:0042078) male germ-line stem cell asymmetric division(GO:0048133) regulation of branching involved in mammary gland duct morphogenesis(GO:0060762) germline stem cell asymmetric division(GO:0098728) |
| 0.4 | 1.6 | GO:0015910 | peroxisomal long-chain fatty acid import(GO:0015910) |
| 0.4 | 1.2 | GO:0085032 | modulation of signal transduction in other organism(GO:0044501) modulation by symbiont of host signal transduction pathway(GO:0052027) modulation of signal transduction in other organism involved in symbiotic interaction(GO:0052250) modulation by symbiont of host I-kappaB kinase/NF-kappaB cascade(GO:0085032) |
| 0.4 | 8.5 | GO:0061154 | endothelial tube morphogenesis(GO:0061154) |
| 0.4 | 2.3 | GO:0021957 | corticospinal tract morphogenesis(GO:0021957) |
| 0.4 | 3.0 | GO:0033211 | adiponectin-activated signaling pathway(GO:0033211) |
| 0.4 | 6.0 | GO:0060742 | epithelial cell differentiation involved in prostate gland development(GO:0060742) |
| 0.4 | 5.6 | GO:0034063 | stress granule assembly(GO:0034063) |
| 0.4 | 4.4 | GO:0042355 | fucose catabolic process(GO:0019317) L-fucose metabolic process(GO:0042354) L-fucose catabolic process(GO:0042355) |
| 0.4 | 7.0 | GO:0006895 | Golgi to endosome transport(GO:0006895) |
| 0.4 | 5.5 | GO:0034497 | protein localization to pre-autophagosomal structure(GO:0034497) |
| 0.4 | 12.4 | GO:0051642 | centrosome localization(GO:0051642) |
| 0.3 | 3.5 | GO:0072178 | nephric duct morphogenesis(GO:0072178) |
| 0.3 | 3.1 | GO:0098814 | spontaneous neurotransmitter secretion(GO:0061669) spontaneous synaptic transmission(GO:0098814) |
| 0.3 | 1.0 | GO:0090283 | regulation of protein glycosylation in Golgi(GO:0090283) |
| 0.3 | 1.7 | GO:0031340 | positive regulation of vesicle fusion(GO:0031340) |
| 0.3 | 1.7 | GO:0003322 | pancreatic A cell development(GO:0003322) |
| 0.3 | 1.0 | GO:0016240 | autophagosome docking(GO:0016240) |
| 0.3 | 13.1 | GO:0018146 | keratan sulfate biosynthetic process(GO:0018146) |
| 0.3 | 1.0 | GO:0019858 | cytosine metabolic process(GO:0019858) |
| 0.3 | 2.5 | GO:0045586 | regulation of gamma-delta T cell differentiation(GO:0045586) |
| 0.3 | 4.0 | GO:0000920 | cell separation after cytokinesis(GO:0000920) |
| 0.3 | 4.9 | GO:0036148 | phosphatidylglycerol acyl-chain remodeling(GO:0036148) |
| 0.3 | 3.9 | GO:0071550 | death-inducing signaling complex assembly(GO:0071550) |
| 0.3 | 1.5 | GO:0090270 | fibroblast growth factor production(GO:0090269) regulation of fibroblast growth factor production(GO:0090270) |
| 0.3 | 2.4 | GO:0032808 | lacrimal gland development(GO:0032808) |
| 0.3 | 4.4 | GO:0016024 | CDP-diacylglycerol biosynthetic process(GO:0016024) |
| 0.3 | 1.2 | GO:0036072 | intramembranous ossification(GO:0001957) direct ossification(GO:0036072) |
| 0.3 | 7.9 | GO:0006884 | cell volume homeostasis(GO:0006884) |
| 0.3 | 0.8 | GO:0018008 | N-terminal peptidyl-glycine N-myristoylation(GO:0018008) peptidyl-glycine modification(GO:0018201) |
| 0.3 | 4.2 | GO:0044803 | multi-organism membrane organization(GO:0044803) |
| 0.3 | 12.2 | GO:0030262 | apoptotic nuclear changes(GO:0030262) |
| 0.3 | 3.5 | GO:0035372 | protein localization to microtubule(GO:0035372) |
| 0.3 | 0.8 | GO:0090649 | response to oxygen-glucose deprivation(GO:0090649) cellular response to oxygen-glucose deprivation(GO:0090650) |
| 0.3 | 6.2 | GO:0031639 | plasminogen activation(GO:0031639) |
| 0.3 | 3.1 | GO:0030050 | vesicle transport along actin filament(GO:0030050) actin filament-based transport(GO:0099515) |
| 0.3 | 3.3 | GO:0046325 | negative regulation of glucose import(GO:0046325) |
| 0.2 | 0.7 | GO:0006499 | N-terminal protein myristoylation(GO:0006499) |
| 0.2 | 7.2 | GO:0042026 | protein refolding(GO:0042026) |
| 0.2 | 1.7 | GO:0045359 | positive regulation of interferon-beta biosynthetic process(GO:0045359) |
| 0.2 | 21.6 | GO:0010812 | negative regulation of cell-substrate adhesion(GO:0010812) |
| 0.2 | 1.2 | GO:0018230 | peptidyl-L-cysteine S-palmitoylation(GO:0018230) peptidyl-S-diacylglycerol-L-cysteine biosynthetic process from peptidyl-cysteine(GO:0018231) |
| 0.2 | 2.4 | GO:0033327 | Leydig cell differentiation(GO:0033327) response to UV-A(GO:0070141) |
| 0.2 | 2.7 | GO:0035413 | positive regulation of catenin import into nucleus(GO:0035413) |
| 0.2 | 2.6 | GO:0048262 | determination of dorsal/ventral asymmetry(GO:0048262) |
| 0.2 | 12.1 | GO:0007029 | endoplasmic reticulum organization(GO:0007029) |
| 0.2 | 1.2 | GO:2000766 | negative regulation of cytoplasmic translation(GO:2000766) |
| 0.2 | 6.3 | GO:0097341 | inhibition of cysteine-type endopeptidase activity(GO:0097340) zymogen inhibition(GO:0097341) |
| 0.2 | 0.5 | GO:0044821 | meiotic telomere tethering at nuclear periphery(GO:0044821) meiotic attachment of telomere to nuclear envelope(GO:0070197) chromosome attachment to the nuclear envelope(GO:0097240) |
| 0.2 | 0.7 | GO:0099550 | trans-synaptic signalling, modulating synaptic transmission(GO:0099550) trans-synaptic signaling by lipid, modulating synaptic transmission(GO:0099552) trans-synaptic signaling by endocannabinoid, modulating synaptic transmission(GO:0099553) |
| 0.2 | 1.5 | GO:0075071 | autophagy of host cells involved in interaction with symbiont(GO:0075044) autophagy involved in symbiotic interaction(GO:0075071) |
| 0.2 | 1.2 | GO:0021766 | hippocampus development(GO:0021766) |
| 0.2 | 1.8 | GO:0045634 | regulation of melanocyte differentiation(GO:0045634) |
| 0.2 | 2.5 | GO:0006048 | UDP-N-acetylglucosamine biosynthetic process(GO:0006048) |
| 0.2 | 0.4 | GO:0048627 | myoblast development(GO:0048627) |
| 0.2 | 2.2 | GO:0010592 | positive regulation of lamellipodium assembly(GO:0010592) |
| 0.2 | 0.9 | GO:0060148 | positive regulation of posttranscriptional gene silencing(GO:0060148) positive regulation of gene silencing by miRNA(GO:2000637) |
| 0.2 | 2.8 | GO:0007016 | cytoskeletal anchoring at plasma membrane(GO:0007016) |
| 0.2 | 0.4 | GO:2000969 | positive regulation of alpha-amino-3-hydroxy-5-methyl-4-isoxazole propionate selective glutamate receptor activity(GO:2000969) |
| 0.2 | 1.1 | GO:0071233 | cellular response to leucine(GO:0071233) |
| 0.2 | 7.7 | GO:0050435 | beta-amyloid metabolic process(GO:0050435) |
| 0.2 | 2.0 | GO:0016081 | synaptic vesicle docking(GO:0016081) |
| 0.2 | 4.8 | GO:0034243 | regulation of transcription elongation from RNA polymerase II promoter(GO:0034243) |
| 0.2 | 3.8 | GO:0045663 | positive regulation of myoblast differentiation(GO:0045663) |
| 0.2 | 3.2 | GO:0090110 | cargo loading into COPII-coated vesicle(GO:0090110) |
| 0.2 | 1.0 | GO:1904720 | regulation of mRNA cleavage(GO:0031437) negative regulation of mRNA cleavage(GO:0031438) negative regulation of immunoglobulin secretion(GO:0051025) negative regulation of ribonuclease activity(GO:0060701) negative regulation of endoribonuclease activity(GO:0060702) negative regulation of IRE1-mediated unfolded protein response(GO:1903895) regulation of mRNA endonucleolytic cleavage involved in unfolded protein response(GO:1904720) negative regulation of mRNA endonucleolytic cleavage involved in unfolded protein response(GO:1904721) |
| 0.2 | 1.4 | GO:0035360 | positive regulation of peroxisome proliferator activated receptor signaling pathway(GO:0035360) |
| 0.2 | 1.5 | GO:0072321 | chaperone-mediated protein transport(GO:0072321) |
| 0.2 | 1.1 | GO:0032482 | Rab protein signal transduction(GO:0032482) |
| 0.1 | 1.5 | GO:0035878 | nail development(GO:0035878) |
| 0.1 | 1.8 | GO:0006610 | ribosomal protein import into nucleus(GO:0006610) |
| 0.1 | 3.1 | GO:2000114 | regulation of establishment of cell polarity(GO:2000114) |
| 0.1 | 0.6 | GO:0035093 | spermatogenesis, exchange of chromosomal proteins(GO:0035093) |
| 0.1 | 3.8 | GO:0031468 | nuclear envelope reassembly(GO:0031468) |
| 0.1 | 1.2 | GO:0016127 | cholesterol catabolic process(GO:0006707) sterol catabolic process(GO:0016127) |
| 0.1 | 0.8 | GO:0006177 | GMP biosynthetic process(GO:0006177) |
| 0.1 | 6.9 | GO:0060999 | positive regulation of dendritic spine development(GO:0060999) |
| 0.1 | 0.9 | GO:0042759 | long-chain fatty acid biosynthetic process(GO:0042759) |
| 0.1 | 1.1 | GO:0098700 | neurotransmitter loading into synaptic vesicle(GO:0098700) |
| 0.1 | 3.0 | GO:0090383 | phagosome acidification(GO:0090383) |
| 0.1 | 0.7 | GO:1900029 | positive regulation of ruffle assembly(GO:1900029) |
| 0.1 | 0.3 | GO:0070213 | protein auto-ADP-ribosylation(GO:0070213) |
| 0.1 | 0.2 | GO:0015917 | aminophospholipid transport(GO:0015917) |
| 0.1 | 3.3 | GO:1900006 | positive regulation of dendrite development(GO:1900006) |
| 0.1 | 17.1 | GO:0007156 | homophilic cell adhesion via plasma membrane adhesion molecules(GO:0007156) |
| 0.1 | 0.8 | GO:0010764 | negative regulation of fibroblast migration(GO:0010764) |
| 0.1 | 5.8 | GO:0006378 | mRNA polyadenylation(GO:0006378) |
| 0.1 | 4.2 | GO:0035418 | protein localization to synapse(GO:0035418) |
| 0.1 | 1.0 | GO:0043568 | positive regulation of insulin-like growth factor receptor signaling pathway(GO:0043568) |
| 0.1 | 3.0 | GO:0051898 | negative regulation of protein kinase B signaling(GO:0051898) |
| 0.1 | 2.6 | GO:0060216 | definitive hemopoiesis(GO:0060216) |
| 0.1 | 7.3 | GO:0061178 | regulation of insulin secretion involved in cellular response to glucose stimulus(GO:0061178) |
| 0.1 | 2.8 | GO:0050919 | negative chemotaxis(GO:0050919) |
| 0.1 | 1.0 | GO:0006183 | GTP biosynthetic process(GO:0006183) |
| 0.1 | 1.9 | GO:0000185 | activation of MAPKKK activity(GO:0000185) |
| 0.1 | 0.4 | GO:0035063 | nuclear speck organization(GO:0035063) |
| 0.1 | 10.9 | GO:0090002 | establishment of protein localization to plasma membrane(GO:0090002) |
| 0.1 | 3.1 | GO:0014037 | Schwann cell differentiation(GO:0014037) |
| 0.1 | 2.1 | GO:0000002 | mitochondrial genome maintenance(GO:0000002) |
| 0.1 | 1.4 | GO:0045672 | positive regulation of osteoclast differentiation(GO:0045672) |
| 0.1 | 4.8 | GO:0006383 | transcription from RNA polymerase III promoter(GO:0006383) |
| 0.1 | 0.7 | GO:0019054 | modulation by virus of host process(GO:0019054) |
| 0.1 | 1.9 | GO:0045943 | positive regulation of transcription from RNA polymerase I promoter(GO:0045943) |
| 0.1 | 3.7 | GO:0051298 | centrosome duplication(GO:0051298) |
| 0.1 | 0.5 | GO:0070934 | CRD-mediated mRNA stabilization(GO:0070934) |
| 0.1 | 0.4 | GO:0070966 | regulation of cytoplasmic mRNA processing body assembly(GO:0010603) positive regulation of cytoplasmic mRNA processing body assembly(GO:0010606) nuclear-transcribed mRNA catabolic process, no-go decay(GO:0070966) |
| 0.1 | 2.2 | GO:0000715 | nucleotide-excision repair, DNA damage recognition(GO:0000715) |
| 0.1 | 2.1 | GO:0042744 | hydrogen peroxide catabolic process(GO:0042744) |
| 0.1 | 2.3 | GO:0048008 | platelet-derived growth factor receptor signaling pathway(GO:0048008) |
| 0.1 | 0.3 | GO:0032906 | transforming growth factor beta2 production(GO:0032906) regulation of transforming growth factor beta2 production(GO:0032909) |
| 0.1 | 1.8 | GO:0000281 | mitotic cytokinesis(GO:0000281) |
| 0.1 | 1.1 | GO:1903432 | regulation of TORC1 signaling(GO:1903432) |
| 0.1 | 2.9 | GO:0000045 | autophagosome assembly(GO:0000045) |
| 0.0 | 2.5 | GO:0045600 | positive regulation of fat cell differentiation(GO:0045600) |
| 0.0 | 0.1 | GO:0003408 | optic cup formation involved in camera-type eye development(GO:0003408) |
| 0.0 | 0.6 | GO:0060004 | reflex(GO:0060004) |
| 0.0 | 1.6 | GO:0000188 | inactivation of MAPK activity(GO:0000188) |
| 0.0 | 4.4 | GO:0048024 | regulation of mRNA splicing, via spliceosome(GO:0048024) |
| 0.0 | 3.7 | GO:0006487 | protein N-linked glycosylation(GO:0006487) |
| 0.0 | 2.2 | GO:0030042 | actin filament depolymerization(GO:0030042) |
| 0.0 | 0.1 | GO:0090063 | positive regulation of microtubule nucleation(GO:0090063) |
| 0.0 | 1.2 | GO:0007157 | heterophilic cell-cell adhesion via plasma membrane cell adhesion molecules(GO:0007157) |
| 0.0 | 1.1 | GO:0042347 | negative regulation of NF-kappaB import into nucleus(GO:0042347) |
| 0.0 | 2.1 | GO:0006284 | base-excision repair(GO:0006284) |
| 0.0 | 2.5 | GO:0072332 | intrinsic apoptotic signaling pathway by p53 class mediator(GO:0072332) |
| 0.0 | 2.9 | GO:1903955 | positive regulation of protein targeting to mitochondrion(GO:1903955) |
| 0.0 | 1.0 | GO:0016577 | histone demethylation(GO:0016577) |
| 0.0 | 0.3 | GO:0010265 | SCF complex assembly(GO:0010265) |
| 0.0 | 6.6 | GO:0051168 | nuclear export(GO:0051168) |
| 0.0 | 6.0 | GO:0033209 | tumor necrosis factor-mediated signaling pathway(GO:0033209) |
| 0.0 | 0.6 | GO:0045601 | regulation of endothelial cell differentiation(GO:0045601) |
| 0.0 | 3.2 | GO:0019886 | antigen processing and presentation of exogenous peptide antigen via MHC class II(GO:0019886) |
| 0.0 | 1.6 | GO:0021510 | spinal cord development(GO:0021510) |
| 0.0 | 2.4 | GO:0035335 | peptidyl-tyrosine dephosphorylation(GO:0035335) |
| 0.0 | 2.6 | GO:0006911 | phagocytosis, engulfment(GO:0006911) |
| 0.0 | 2.4 | GO:0007286 | spermatid development(GO:0007286) |
| 0.0 | 0.3 | GO:0034453 | microtubule anchoring(GO:0034453) |
| 0.0 | 1.2 | GO:2000177 | regulation of neural precursor cell proliferation(GO:2000177) |
| 0.0 | 0.5 | GO:0043406 | positive regulation of MAP kinase activity(GO:0043406) |
| 0.0 | 0.7 | GO:0016575 | histone deacetylation(GO:0016575) |
| 0.0 | 1.0 | GO:0006099 | tricarboxylic acid cycle(GO:0006099) |
| 0.0 | 0.8 | GO:0030521 | androgen receptor signaling pathway(GO:0030521) |
| 0.0 | 0.4 | GO:2001273 | regulation of glucose import in response to insulin stimulus(GO:2001273) positive regulation of glucose import in response to insulin stimulus(GO:2001275) |
| 0.0 | 0.7 | GO:1990090 | cellular response to nerve growth factor stimulus(GO:1990090) |
| 0.0 | 11.9 | GO:0007264 | small GTPase mediated signal transduction(GO:0007264) |
| 0.0 | 0.6 | GO:0016574 | histone ubiquitination(GO:0016574) |
| 0.0 | 0.8 | GO:0072337 | modified amino acid transport(GO:0072337) |
| 0.0 | 0.3 | GO:0043982 | histone H4-K5 acetylation(GO:0043981) histone H4-K8 acetylation(GO:0043982) |
| 0.0 | 2.7 | GO:0031032 | actomyosin structure organization(GO:0031032) |
| 0.0 | 0.7 | GO:0000289 | nuclear-transcribed mRNA poly(A) tail shortening(GO:0000289) |
| 0.0 | 0.8 | GO:0014047 | glutamate secretion(GO:0014047) |
| 0.0 | 0.3 | GO:0007184 | SMAD protein import into nucleus(GO:0007184) |
| 0.0 | 0.3 | GO:0048665 | neuron fate specification(GO:0048665) |
| 0.0 | 0.3 | GO:0019932 | second-messenger-mediated signaling(GO:0019932) |
| 0.0 | 1.0 | GO:0021987 | cerebral cortex development(GO:0021987) |
| 0.0 | 1.5 | GO:0044070 | regulation of anion transport(GO:0044070) |
| 0.0 | 0.1 | GO:0001767 | establishment of lymphocyte polarity(GO:0001767) |
| 0.0 | 1.3 | GO:0038096 | immune response-regulating cell surface receptor signaling pathway involved in phagocytosis(GO:0002433) Fc-gamma receptor signaling pathway involved in phagocytosis(GO:0038096) |
| 0.0 | 0.5 | GO:0036498 | IRE1-mediated unfolded protein response(GO:0036498) |
Gene overrepresentation in cellular_component category:
| Log-likelihood per target | Total log-likelihood | Term | Description |
|---|---|---|---|
| 3.7 | 18.5 | GO:0060200 | clathrin-sculpted acetylcholine transport vesicle(GO:0060200) clathrin-sculpted acetylcholine transport vesicle membrane(GO:0060201) |
| 3.2 | 9.5 | GO:0019034 | viral replication complex(GO:0019034) |
| 2.7 | 13.6 | GO:0044308 | axonal spine(GO:0044308) |
| 2.4 | 7.1 | GO:0043291 | RAVE complex(GO:0043291) |
| 2.3 | 7.0 | GO:0097447 | dendritic tree(GO:0097447) |
| 2.3 | 27.8 | GO:0060077 | inhibitory synapse(GO:0060077) |
| 2.0 | 6.0 | GO:0030906 | retromer, cargo-selective complex(GO:0030906) |
| 2.0 | 9.8 | GO:0042272 | nuclear RNA export factor complex(GO:0042272) |
| 1.9 | 1.9 | GO:0044094 | host cell nucleus(GO:0042025) host cell nuclear part(GO:0044094) |
| 1.3 | 12.1 | GO:0072546 | ER membrane protein complex(GO:0072546) |
| 1.3 | 8.8 | GO:0042584 | chromaffin granule membrane(GO:0042584) |
| 1.2 | 18.5 | GO:0005916 | fascia adherens(GO:0005916) |
| 1.2 | 5.8 | GO:0033503 | HULC complex(GO:0033503) |
| 0.9 | 3.6 | GO:0016939 | kinesin II complex(GO:0016939) |
| 0.8 | 23.8 | GO:0033268 | node of Ranvier(GO:0033268) |
| 0.8 | 19.2 | GO:0032156 | septin cytoskeleton(GO:0032156) |
| 0.8 | 6.1 | GO:0098559 | cytoplasmic side of early endosome membrane(GO:0098559) |
| 0.7 | 9.7 | GO:0097433 | dense body(GO:0097433) |
| 0.7 | 15.0 | GO:0005952 | cAMP-dependent protein kinase complex(GO:0005952) |
| 0.7 | 3.7 | GO:0030891 | VCB complex(GO:0030891) |
| 0.7 | 10.9 | GO:0090543 | Flemming body(GO:0090543) |
| 0.7 | 0.7 | GO:0034274 | Atg12-Atg5-Atg16 complex(GO:0034274) |
| 0.6 | 5.4 | GO:0071439 | clathrin complex(GO:0071439) |
| 0.6 | 4.5 | GO:0032593 | insulin-responsive compartment(GO:0032593) |
| 0.5 | 2.1 | GO:0017059 | serine C-palmitoyltransferase complex(GO:0017059) endoplasmic reticulum palmitoyltransferase complex(GO:0031211) |
| 0.5 | 1.0 | GO:1903349 | omegasome membrane(GO:1903349) |
| 0.5 | 7.6 | GO:0005641 | nuclear envelope lumen(GO:0005641) |
| 0.5 | 18.4 | GO:0000407 | pre-autophagosomal structure(GO:0000407) |
| 0.5 | 1.5 | GO:0034676 | integrin alpha6-beta4 complex(GO:0034676) |
| 0.5 | 3.4 | GO:0044233 | ER-mitochondrion membrane contact site(GO:0044233) |
| 0.5 | 8.3 | GO:0031235 | intrinsic component of the cytoplasmic side of the plasma membrane(GO:0031235) |
| 0.5 | 3.8 | GO:0036057 | filtration diaphragm(GO:0036056) slit diaphragm(GO:0036057) |
| 0.4 | 1.3 | GO:0043511 | inhibin complex(GO:0043511) inhibin A complex(GO:0043512) |
| 0.4 | 6.0 | GO:0030285 | integral component of synaptic vesicle membrane(GO:0030285) intrinsic component of synaptic vesicle membrane(GO:0098563) |
| 0.4 | 4.2 | GO:0044300 | cerebellar mossy fiber(GO:0044300) |
| 0.4 | 2.4 | GO:0000306 | extrinsic component of vacuolar membrane(GO:0000306) extrinsic component of endosome membrane(GO:0031313) |
| 0.4 | 11.3 | GO:0005868 | cytoplasmic dynein complex(GO:0005868) |
| 0.4 | 1.9 | GO:0002193 | MAML1-RBP-Jkappa- ICN1 complex(GO:0002193) |
| 0.4 | 2.1 | GO:1990131 | EGO complex(GO:0034448) Gtr1-Gtr2 GTPase complex(GO:1990131) |
| 0.3 | 6.0 | GO:0030122 | AP-2 adaptor complex(GO:0030122) |
| 0.3 | 3.4 | GO:0005744 | mitochondrial inner membrane presequence translocase complex(GO:0005744) |
| 0.3 | 12.2 | GO:1904115 | axon cytoplasm(GO:1904115) |
| 0.3 | 1.3 | GO:0044354 | pinosome(GO:0044352) macropinosome(GO:0044354) |
| 0.2 | 1.2 | GO:0031466 | Cul5-RING ubiquitin ligase complex(GO:0031466) |
| 0.2 | 0.7 | GO:0000806 | Y chromosome(GO:0000806) |
| 0.2 | 21.5 | GO:0032580 | Golgi cisterna membrane(GO:0032580) |
| 0.2 | 3.0 | GO:0033180 | proton-transporting V-type ATPase, V1 domain(GO:0033180) |
| 0.2 | 6.1 | GO:0090533 | cation-transporting ATPase complex(GO:0090533) |
| 0.2 | 5.6 | GO:0030140 | trans-Golgi network transport vesicle(GO:0030140) |
| 0.2 | 1.0 | GO:0001739 | sex chromatin(GO:0001739) |
| 0.2 | 4.9 | GO:0031143 | pseudopodium(GO:0031143) |
| 0.2 | 1.4 | GO:0097443 | sorting endosome(GO:0097443) |
| 0.2 | 4.0 | GO:0036126 | sperm flagellum(GO:0036126) |
| 0.2 | 0.8 | GO:0033596 | TSC1-TSC2 complex(GO:0033596) |
| 0.2 | 13.6 | GO:0035577 | azurophil granule membrane(GO:0035577) |
| 0.2 | 4.0 | GO:0016281 | eukaryotic translation initiation factor 4F complex(GO:0016281) |
| 0.2 | 7.7 | GO:0005771 | multivesicular body(GO:0005771) |
| 0.2 | 6.0 | GO:0032420 | stereocilium(GO:0032420) |
| 0.2 | 5.8 | GO:0005697 | telomerase holoenzyme complex(GO:0005697) |
| 0.2 | 3.8 | GO:0032839 | dendrite cytoplasm(GO:0032839) |
| 0.2 | 23.2 | GO:0005875 | microtubule associated complex(GO:0005875) |
| 0.2 | 6.8 | GO:0045171 | intercellular bridge(GO:0045171) |
| 0.2 | 2.1 | GO:0005577 | fibrinogen complex(GO:0005577) |
| 0.2 | 22.5 | GO:0055037 | recycling endosome(GO:0055037) |
| 0.2 | 5.0 | GO:0005881 | cytoplasmic microtubule(GO:0005881) |
| 0.1 | 8.1 | GO:0032154 | cleavage furrow(GO:0032154) cell surface furrow(GO:0097610) |
| 0.1 | 3.5 | GO:0071564 | npBAF complex(GO:0071564) |
| 0.1 | 4.2 | GO:0005921 | gap junction(GO:0005921) |
| 0.1 | 2.2 | GO:0000109 | nucleotide-excision repair complex(GO:0000109) |
| 0.1 | 1.5 | GO:0032045 | guanyl-nucleotide exchange factor complex(GO:0032045) |
| 0.1 | 15.4 | GO:0000922 | spindle pole(GO:0000922) |
| 0.1 | 3.8 | GO:0070161 | anchoring junction(GO:0070161) |
| 0.1 | 4.6 | GO:0000159 | protein phosphatase type 2A complex(GO:0000159) |
| 0.1 | 8.5 | GO:0031463 | Cul3-RING ubiquitin ligase complex(GO:0031463) |
| 0.1 | 5.1 | GO:0048786 | presynaptic active zone(GO:0048786) |
| 0.1 | 2.6 | GO:0071782 | endoplasmic reticulum tubular network(GO:0071782) |
| 0.1 | 15.9 | GO:0030176 | integral component of endoplasmic reticulum membrane(GO:0030176) |
| 0.1 | 1.9 | GO:0031233 | intrinsic component of external side of plasma membrane(GO:0031233) |
| 0.1 | 0.5 | GO:0031462 | Cul2-RING ubiquitin ligase complex(GO:0031462) |
| 0.1 | 13.7 | GO:0030496 | midbody(GO:0030496) |
| 0.1 | 3.1 | GO:0005790 | smooth endoplasmic reticulum(GO:0005790) |
| 0.1 | 3.6 | GO:0016327 | apicolateral plasma membrane(GO:0016327) |
| 0.1 | 5.8 | GO:0009295 | nucleoid(GO:0009295) mitochondrial nucleoid(GO:0042645) |
| 0.1 | 11.8 | GO:0042470 | melanosome(GO:0042470) pigment granule(GO:0048770) |
| 0.1 | 4.0 | GO:0031258 | lamellipodium membrane(GO:0031258) |
| 0.1 | 1.4 | GO:0035102 | PRC1 complex(GO:0035102) |
| 0.1 | 0.7 | GO:0016589 | NURF complex(GO:0016589) |
| 0.1 | 2.0 | GO:0005852 | eukaryotic translation initiation factor 3 complex(GO:0005852) |
| 0.1 | 1.0 | GO:0017146 | NMDA selective glutamate receptor complex(GO:0017146) |
| 0.1 | 8.4 | GO:0005819 | spindle(GO:0005819) |
| 0.1 | 3.7 | GO:0005801 | cis-Golgi network(GO:0005801) |
| 0.1 | 0.4 | GO:0005942 | phosphatidylinositol 3-kinase complex(GO:0005942) |
| 0.1 | 2.6 | GO:0016592 | mediator complex(GO:0016592) |
| 0.1 | 3.7 | GO:0030672 | synaptic vesicle membrane(GO:0030672) exocytic vesicle membrane(GO:0099501) |
| 0.1 | 3.3 | GO:0016328 | lateral plasma membrane(GO:0016328) |
| 0.1 | 0.8 | GO:0035869 | ciliary transition zone(GO:0035869) |
| 0.1 | 2.4 | GO:0042629 | mast cell granule(GO:0042629) |
| 0.1 | 4.3 | GO:0031902 | late endosome membrane(GO:0031902) |
| 0.1 | 4.3 | GO:0000794 | condensed nuclear chromosome(GO:0000794) |
| 0.1 | 2.1 | GO:0000315 | organellar large ribosomal subunit(GO:0000315) mitochondrial large ribosomal subunit(GO:0005762) |
| 0.1 | 3.8 | GO:0036064 | ciliary basal body(GO:0036064) |
| 0.0 | 1.7 | GO:0000792 | heterochromatin(GO:0000792) |
| 0.0 | 2.3 | GO:0016605 | PML body(GO:0016605) |
| 0.0 | 0.7 | GO:0030127 | COPII vesicle coat(GO:0030127) |
| 0.0 | 1.2 | GO:0001917 | photoreceptor inner segment(GO:0001917) |
| 0.0 | 1.5 | GO:0008180 | COP9 signalosome(GO:0008180) |
| 0.0 | 1.2 | GO:0090545 | NuRD complex(GO:0016581) CHD-type complex(GO:0090545) |
| 0.0 | 7.5 | GO:0001726 | ruffle(GO:0001726) |
| 0.0 | 1.8 | GO:0005834 | heterotrimeric G-protein complex(GO:0005834) |
| 0.0 | 4.4 | GO:0005802 | trans-Golgi network(GO:0005802) |
| 0.0 | 0.9 | GO:0080008 | Cul4-RING E3 ubiquitin ligase complex(GO:0080008) |
| 0.0 | 5.5 | GO:1904813 | ficolin-1-rich granule(GO:0101002) ficolin-1-rich granule lumen(GO:1904813) |
| 0.0 | 0.5 | GO:0031514 | motile cilium(GO:0031514) |
| 0.0 | 0.5 | GO:0031229 | integral component of nuclear inner membrane(GO:0005639) intrinsic component of nuclear inner membrane(GO:0031229) nuclear membrane part(GO:0044453) |
| 0.0 | 1.6 | GO:0031907 | peroxisomal matrix(GO:0005782) microbody lumen(GO:0031907) |
| 0.0 | 0.8 | GO:0043034 | costamere(GO:0043034) |
| 0.0 | 6.1 | GO:0005681 | spliceosomal complex(GO:0005681) |
| 0.0 | 8.4 | GO:0000139 | Golgi membrane(GO:0000139) |
| 0.0 | 2.1 | GO:0005923 | bicellular tight junction(GO:0005923) |
| 0.0 | 11.5 | GO:0005764 | lytic vacuole(GO:0000323) lysosome(GO:0005764) |
| 0.0 | 6.9 | GO:0098857 | membrane raft(GO:0045121) membrane microdomain(GO:0098857) |
| 0.0 | 0.4 | GO:0030014 | CCR4-NOT complex(GO:0030014) |
| 0.0 | 1.6 | GO:0043657 | host(GO:0018995) host cell(GO:0043657) |
| 0.0 | 4.9 | GO:0016323 | basolateral plasma membrane(GO:0016323) |
| 0.0 | 16.9 | GO:0005789 | endoplasmic reticulum membrane(GO:0005789) |
| 0.0 | 0.8 | GO:0000777 | condensed chromosome kinetochore(GO:0000777) |
| 0.0 | 0.1 | GO:0030904 | retromer complex(GO:0030904) |
| 0.0 | 0.3 | GO:0035861 | site of double-strand break(GO:0035861) |
| 0.0 | 0.5 | GO:1904724 | tertiary granule lumen(GO:1904724) |
| 0.0 | 0.1 | GO:0000930 | gamma-tubulin complex(GO:0000930) |
| 0.0 | 0.9 | GO:0009986 | cell surface(GO:0009986) |
Gene overrepresentation in molecular_function category:
| Log-likelihood per target | Total log-likelihood | Term | Description |
|---|---|---|---|
| 5.6 | 16.8 | GO:0102007 | lactonohydrolase activity(GO:0046573) acyl-L-homoserine-lactone lactonohydrolase activity(GO:0102007) |
| 5.0 | 20.2 | GO:0005105 | type 1 fibroblast growth factor receptor binding(GO:0005105) |
| 3.7 | 18.5 | GO:0030348 | syntaxin-3 binding(GO:0030348) |
| 3.1 | 18.5 | GO:0086075 | gap junction channel activity involved in cardiac conduction electrical coupling(GO:0086075) |
| 3.0 | 15.1 | GO:0034046 | poly(G) binding(GO:0034046) |
| 2.6 | 7.7 | GO:0008798 | beta-aspartyl-peptidase activity(GO:0008798) |
| 2.1 | 6.2 | GO:0004618 | phosphoglycerate kinase activity(GO:0004618) |
| 2.0 | 6.1 | GO:0032184 | SUMO polymer binding(GO:0032184) |
| 1.9 | 3.7 | GO:0032451 | demethylase activity(GO:0032451) histone demethylase activity(GO:0032452) |
| 1.7 | 5.1 | GO:0070699 | type II activin receptor binding(GO:0070699) |
| 1.6 | 15.8 | GO:0015386 | sodium:proton antiporter activity(GO:0015385) potassium:proton antiporter activity(GO:0015386) |
| 1.5 | 4.5 | GO:0033149 | FFAT motif binding(GO:0033149) |
| 1.3 | 7.6 | GO:0035368 | selenocysteine insertion sequence binding(GO:0035368) |
| 1.2 | 1.2 | GO:0043422 | protein kinase B binding(GO:0043422) |
| 1.2 | 7.0 | GO:0102337 | fatty acid elongase activity(GO:0009922) 3-oxo-arachidoyl-CoA synthase activity(GO:0102336) 3-oxo-cerotoyl-CoA synthase activity(GO:0102337) 3-oxo-lignoceronyl-CoA synthase activity(GO:0102338) |
| 1.1 | 4.6 | GO:0050220 | prostaglandin-E synthase activity(GO:0050220) |
| 1.1 | 7.4 | GO:0042978 | ornithine decarboxylase activator activity(GO:0042978) |
| 1.1 | 6.3 | GO:0010859 | calcium-dependent cysteine-type endopeptidase inhibitor activity(GO:0010859) |
| 1.0 | 25.0 | GO:0008191 | metalloendopeptidase inhibitor activity(GO:0008191) |
| 0.9 | 5.5 | GO:0008440 | inositol-1,4,5-trisphosphate 3-kinase activity(GO:0008440) |
| 0.8 | 3.4 | GO:0015207 | ATP:ADP antiporter activity(GO:0005471) adenine transmembrane transporter activity(GO:0015207) |
| 0.8 | 5.4 | GO:0001517 | N-acetylglucosamine 6-O-sulfotransferase activity(GO:0001517) |
| 0.8 | 6.0 | GO:0004565 | beta-galactosidase activity(GO:0004565) |
| 0.7 | 8.2 | GO:0003831 | beta-N-acetylglucosaminylglycopeptide beta-1,4-galactosyltransferase activity(GO:0003831) |
| 0.7 | 10.0 | GO:0019870 | potassium channel inhibitor activity(GO:0019870) |
| 0.7 | 9.1 | GO:1990247 | N6-methyladenosine-containing RNA binding(GO:1990247) |
| 0.7 | 2.1 | GO:0070052 | collagen V binding(GO:0070052) |
| 0.7 | 4.2 | GO:0004430 | 1-phosphatidylinositol 4-kinase activity(GO:0004430) |
| 0.7 | 2.1 | GO:0016454 | serine C-palmitoyltransferase activity(GO:0004758) C-palmitoyltransferase activity(GO:0016454) |
| 0.7 | 3.3 | GO:0008273 | calcium, potassium:sodium antiporter activity(GO:0008273) |
| 0.7 | 8.6 | GO:0003836 | beta-galactoside (CMP) alpha-2,3-sialyltransferase activity(GO:0003836) |
| 0.7 | 10.5 | GO:0004691 | cAMP-dependent protein kinase activity(GO:0004691) |
| 0.6 | 6.4 | GO:0005375 | copper ion transmembrane transporter activity(GO:0005375) |
| 0.6 | 1.9 | GO:0086062 | voltage-gated sodium channel activity involved in Purkinje myocyte action potential(GO:0086062) |
| 0.6 | 16.3 | GO:0017075 | syntaxin-1 binding(GO:0017075) |
| 0.6 | 4.9 | GO:0047144 | 2-acylglycerol-3-phosphate O-acyltransferase activity(GO:0047144) |
| 0.6 | 1.8 | GO:0031826 | type 2A serotonin receptor binding(GO:0031826) |
| 0.6 | 2.3 | GO:0031697 | beta-1 adrenergic receptor binding(GO:0031697) |
| 0.6 | 5.1 | GO:0032051 | clathrin light chain binding(GO:0032051) |
| 0.6 | 6.7 | GO:0042301 | phosphate ion binding(GO:0042301) |
| 0.6 | 4.4 | GO:0046920 | alpha-(1->3)-fucosyltransferase activity(GO:0046920) |
| 0.6 | 1.7 | GO:0032422 | purine-rich negative regulatory element binding(GO:0032422) |
| 0.5 | 10.4 | GO:0045504 | dynein heavy chain binding(GO:0045504) |
| 0.4 | 2.2 | GO:0015183 | L-aspartate transmembrane transporter activity(GO:0015183) |
| 0.4 | 10.1 | GO:0017081 | chloride channel regulator activity(GO:0017081) |
| 0.4 | 1.3 | GO:0001069 | regulatory region RNA binding(GO:0001069) |
| 0.4 | 5.5 | GO:0038132 | neuregulin binding(GO:0038132) |
| 0.4 | 15.8 | GO:1990939 | ATP-dependent microtubule motor activity(GO:1990939) |
| 0.4 | 2.1 | GO:0005152 | interleukin-1 receptor antagonist activity(GO:0005152) |
| 0.4 | 30.4 | GO:0019003 | GDP binding(GO:0019003) |
| 0.4 | 18.4 | GO:0005544 | calcium-dependent phospholipid binding(GO:0005544) |
| 0.4 | 8.5 | GO:0004707 | MAP kinase activity(GO:0004707) |
| 0.4 | 3.8 | GO:0031994 | insulin-like growth factor I binding(GO:0031994) |
| 0.4 | 4.2 | GO:0005049 | nuclear export signal receptor activity(GO:0005049) |
| 0.4 | 6.0 | GO:0031748 | D1 dopamine receptor binding(GO:0031748) |
| 0.4 | 8.4 | GO:0080025 | phosphatidylinositol-3,5-bisphosphate binding(GO:0080025) |
| 0.4 | 4.2 | GO:1990239 | steroid hormone binding(GO:1990239) |
| 0.3 | 5.5 | GO:0030306 | ADP-ribosylation factor binding(GO:0030306) |
| 0.3 | 1.0 | GO:0043423 | 3-phosphoinositide-dependent protein kinase binding(GO:0043423) |
| 0.3 | 3.7 | GO:0022889 | L-serine transmembrane transporter activity(GO:0015194) serine transmembrane transporter activity(GO:0022889) |
| 0.3 | 2.9 | GO:0033592 | RNA strand annealing activity(GO:0033592) |
| 0.3 | 3.3 | GO:0001135 | transcription factor activity, RNA polymerase II transcription factor recruiting(GO:0001135) |
| 0.3 | 3.5 | GO:0017034 | Rap guanyl-nucleotide exchange factor activity(GO:0017034) |
| 0.3 | 0.6 | GO:0061628 | H3K27me3 modified histone binding(GO:0061628) |
| 0.3 | 0.8 | GO:0019107 | glycylpeptide N-tetradecanoyltransferase activity(GO:0004379) myristoyltransferase activity(GO:0019107) |
| 0.3 | 9.7 | GO:0030159 | receptor signaling complex scaffold activity(GO:0030159) |
| 0.3 | 3.2 | GO:0017160 | Ral GTPase binding(GO:0017160) |
| 0.3 | 2.7 | GO:0005114 | type II transforming growth factor beta receptor binding(GO:0005114) |
| 0.3 | 11.9 | GO:0004864 | protein phosphatase inhibitor activity(GO:0004864) |
| 0.3 | 5.3 | GO:0031005 | filamin binding(GO:0031005) |
| 0.2 | 6.7 | GO:0005388 | calcium-transporting ATPase activity(GO:0005388) |
| 0.2 | 0.7 | GO:0004605 | phosphatidate cytidylyltransferase activity(GO:0004605) |
| 0.2 | 4.2 | GO:0005522 | profilin binding(GO:0005522) |
| 0.2 | 3.4 | GO:0031957 | very long-chain fatty acid-CoA ligase activity(GO:0031957) |
| 0.2 | 11.0 | GO:0061631 | ubiquitin conjugating enzyme activity(GO:0061631) |
| 0.2 | 4.3 | GO:0005520 | insulin-like growth factor binding(GO:0005520) |
| 0.2 | 15.8 | GO:0048365 | Rac GTPase binding(GO:0048365) |
| 0.2 | 1.6 | GO:0005324 | long-chain fatty acid transporter activity(GO:0005324) |
| 0.2 | 7.6 | GO:0001671 | ATPase activator activity(GO:0001671) |
| 0.2 | 1.6 | GO:0035005 | 1-phosphatidylinositol-4-phosphate 3-kinase activity(GO:0035005) |
| 0.2 | 0.7 | GO:0004949 | cannabinoid receptor activity(GO:0004949) |
| 0.2 | 6.6 | GO:0004709 | MAP kinase kinase kinase activity(GO:0004709) |
| 0.2 | 1.9 | GO:0000182 | rDNA binding(GO:0000182) |
| 0.2 | 0.8 | GO:0003938 | IMP dehydrogenase activity(GO:0003938) |
| 0.2 | 8.5 | GO:0004702 | receptor signaling protein serine/threonine kinase activity(GO:0004702) |
| 0.2 | 3.0 | GO:0016500 | protein-hormone receptor activity(GO:0016500) |
| 0.2 | 2.8 | GO:0038191 | neuropilin binding(GO:0038191) |
| 0.2 | 3.1 | GO:0086008 | voltage-gated potassium channel activity involved in cardiac muscle cell action potential repolarization(GO:0086008) |
| 0.2 | 6.2 | GO:0043539 | protein serine/threonine kinase activator activity(GO:0043539) |
| 0.2 | 2.6 | GO:0004185 | serine-type carboxypeptidase activity(GO:0004185) |
| 0.2 | 1.0 | GO:0060698 | endoribonuclease inhibitor activity(GO:0060698) |
| 0.1 | 2.1 | GO:0003841 | 1-acylglycerol-3-phosphate O-acyltransferase activity(GO:0003841) |
| 0.1 | 1.8 | GO:0000774 | adenyl-nucleotide exchange factor activity(GO:0000774) |
| 0.1 | 1.5 | GO:0005225 | volume-sensitive anion channel activity(GO:0005225) |
| 0.1 | 1.8 | GO:0004716 | receptor signaling protein tyrosine kinase activity(GO:0004716) |
| 0.1 | 1.9 | GO:0031435 | mitogen-activated protein kinase kinase kinase binding(GO:0031435) |
| 0.1 | 2.3 | GO:0004535 | poly(A)-specific ribonuclease activity(GO:0004535) |
| 0.1 | 6.4 | GO:0016709 | oxidoreductase activity, acting on paired donors, with incorporation or reduction of molecular oxygen, NAD(P)H as one donor, and incorporation of one atom of oxygen(GO:0016709) |
| 0.1 | 1.7 | GO:0035256 | G-protein coupled glutamate receptor binding(GO:0035256) |
| 0.1 | 1.0 | GO:0046976 | histone methyltransferase activity (H3-K27 specific)(GO:0046976) |
| 0.1 | 2.5 | GO:0008483 | transaminase activity(GO:0008483) |
| 0.1 | 2.4 | GO:0050811 | GABA receptor binding(GO:0050811) |
| 0.1 | 14.5 | GO:0017124 | SH3 domain binding(GO:0017124) |
| 0.1 | 1.0 | GO:0050072 | m7G(5')pppN diphosphatase activity(GO:0050072) |
| 0.1 | 1.6 | GO:0017017 | MAP kinase tyrosine/serine/threonine phosphatase activity(GO:0017017) |
| 0.1 | 8.4 | GO:0017137 | Rab GTPase binding(GO:0017137) |
| 0.1 | 3.0 | GO:0046961 | proton-transporting ATPase activity, rotational mechanism(GO:0046961) |
| 0.1 | 35.3 | GO:0005096 | GTPase activator activity(GO:0005096) |
| 0.1 | 1.4 | GO:0042975 | peroxisome proliferator activated receptor binding(GO:0042975) |
| 0.1 | 0.5 | GO:0046912 | transferase activity, transferring acyl groups, acyl groups converted into alkyl on transfer(GO:0046912) |
| 0.1 | 3.3 | GO:0042169 | SH2 domain binding(GO:0042169) |
| 0.1 | 1.1 | GO:0005313 | L-glutamate transmembrane transporter activity(GO:0005313) acidic amino acid transmembrane transporter activity(GO:0015172) |
| 0.1 | 2.8 | GO:0005484 | SNAP receptor activity(GO:0005484) |
| 0.1 | 0.7 | GO:0033192 | calmodulin-dependent protein phosphatase activity(GO:0033192) |
| 0.1 | 0.2 | GO:0034188 | apolipoprotein A-I receptor activity(GO:0034188) phosphatidylserine-translocating ATPase activity(GO:0090556) |
| 0.1 | 2.4 | GO:0030552 | cAMP binding(GO:0030552) |
| 0.1 | 0.7 | GO:0004726 | non-membrane spanning protein tyrosine phosphatase activity(GO:0004726) |
| 0.1 | 0.8 | GO:0032794 | GTPase activating protein binding(GO:0032794) |
| 0.1 | 1.2 | GO:0050750 | low-density lipoprotein particle receptor binding(GO:0050750) |
| 0.1 | 1.5 | GO:0042813 | Wnt-activated receptor activity(GO:0042813) |
| 0.1 | 3.4 | GO:0005160 | transforming growth factor beta receptor binding(GO:0005160) |
| 0.1 | 1.6 | GO:0034236 | protein kinase A catalytic subunit binding(GO:0034236) |
| 0.1 | 8.8 | GO:0044325 | ion channel binding(GO:0044325) |
| 0.1 | 1.0 | GO:0004550 | nucleoside diphosphate kinase activity(GO:0004550) |
| 0.1 | 3.8 | GO:0008375 | acetylglucosaminyltransferase activity(GO:0008375) |
| 0.1 | 1.2 | GO:0071889 | 14-3-3 protein binding(GO:0071889) |
| 0.1 | 0.8 | GO:0042809 | vitamin D receptor binding(GO:0042809) |
| 0.1 | 4.0 | GO:0003743 | translation initiation factor activity(GO:0003743) |
| 0.1 | 18.7 | GO:0005525 | GTP binding(GO:0005525) |
| 0.1 | 1.8 | GO:0008536 | Ran GTPase binding(GO:0008536) |
| 0.0 | 0.4 | GO:0046625 | sphingolipid binding(GO:0046625) |
| 0.0 | 1.9 | GO:0042605 | peptide antigen binding(GO:0042605) |
| 0.0 | 1.3 | GO:0051010 | microtubule plus-end binding(GO:0051010) |
| 0.0 | 1.2 | GO:0070034 | telomerase RNA binding(GO:0070034) |
| 0.0 | 1.0 | GO:0070577 | lysine-acetylated histone binding(GO:0070577) |
| 0.0 | 0.8 | GO:0072349 | modified amino acid transmembrane transporter activity(GO:0072349) |
| 0.0 | 2.4 | GO:0004693 | cyclin-dependent protein serine/threonine kinase activity(GO:0004693) |
| 0.0 | 4.3 | GO:0000979 | RNA polymerase II core promoter sequence-specific DNA binding(GO:0000979) |
| 0.0 | 2.5 | GO:0035064 | methylated histone binding(GO:0035064) |
| 0.0 | 19.9 | GO:0003779 | actin binding(GO:0003779) |
| 0.0 | 1.2 | GO:0051019 | mitogen-activated protein kinase binding(GO:0051019) |
| 0.0 | 2.5 | GO:0002039 | p53 binding(GO:0002039) |
| 0.0 | 0.4 | GO:0046935 | 1-phosphatidylinositol-3-kinase regulator activity(GO:0046935) |
| 0.0 | 0.3 | GO:0046972 | histone acetyltransferase activity (H4-K5 specific)(GO:0043995) histone acetyltransferase activity (H4-K8 specific)(GO:0043996) histone acetyltransferase activity (H4-K16 specific)(GO:0046972) |
| 0.0 | 7.1 | GO:0008022 | protein C-terminus binding(GO:0008022) |
| 0.0 | 0.9 | GO:0043022 | ribosome binding(GO:0043022) |
| 0.0 | 0.5 | GO:0031490 | chromatin DNA binding(GO:0031490) |
| 0.0 | 8.3 | GO:0030246 | carbohydrate binding(GO:0030246) |
| 0.0 | 18.0 | GO:0005509 | calcium ion binding(GO:0005509) |
| 0.0 | 0.3 | GO:0008140 | cAMP response element binding protein binding(GO:0008140) |
| 0.0 | 2.3 | GO:0020037 | heme binding(GO:0020037) |
| 0.0 | 1.1 | GO:0016763 | transferase activity, transferring pentosyl groups(GO:0016763) |
| 0.0 | 4.1 | GO:0003729 | mRNA binding(GO:0003729) poly(A) RNA binding(GO:0044822) |
| 0.0 | 0.2 | GO:0034483 | heparan sulfate sulfotransferase activity(GO:0034483) |
| 0.0 | 2.7 | GO:0008017 | microtubule binding(GO:0008017) |
| 0.0 | 0.3 | GO:0030544 | Hsp70 protein binding(GO:0030544) |
| 0.0 | 0.8 | GO:0008094 | DNA-dependent ATPase activity(GO:0008094) |
| 0.0 | 0.2 | GO:0046875 | ephrin receptor binding(GO:0046875) |
| 0.0 | 0.9 | GO:0047485 | protein N-terminus binding(GO:0047485) |
Gene overrepresentation in C2:CP category:
| Log-likelihood per target | Total log-likelihood | Term | Description |
|---|---|---|---|
| 0.7 | 7.3 | ST PAC1 RECEPTOR PATHWAY | PAC1 Receptor Pathway |
| 0.4 | 25.0 | NABA PROTEOGLYCANS | Genes encoding proteoglycans |
| 0.4 | 15.2 | PID IL3 PATHWAY | IL3-mediated signaling events |
| 0.4 | 19.2 | PID NCADHERIN PATHWAY | N-cadherin signaling events |
| 0.4 | 17.7 | PID ARF6 TRAFFICKING PATHWAY | Arf6 trafficking events |
| 0.4 | 14.7 | PID REELIN PATHWAY | Reelin signaling pathway |
| 0.4 | 7.3 | PID CDC42 REG PATHWAY | Regulation of CDC42 activity |
| 0.4 | 17.8 | PID INSULIN PATHWAY | Insulin Pathway |
| 0.3 | 26.9 | PID ERBB1 INTERNALIZATION PATHWAY | Internalization of ErbB1 |
| 0.3 | 0.7 | PID EPHA2 FWD PATHWAY | EPHA2 forward signaling |
| 0.3 | 11.4 | ST WNT BETA CATENIN PATHWAY | Wnt/beta-catenin Pathway |
| 0.3 | 18.4 | SIG CD40PATHWAYMAP | Genes related to CD40 signaling |
| 0.3 | 13.8 | PID MET PATHWAY | Signaling events mediated by Hepatocyte Growth Factor Receptor (c-Met) |
| 0.2 | 3.5 | PID EPHRINB REV PATHWAY | Ephrin B reverse signaling |
| 0.2 | 14.0 | PID TGFBR PATHWAY | TGF-beta receptor signaling |
| 0.2 | 6.7 | PID ARF6 PATHWAY | Arf6 signaling events |
| 0.2 | 13.2 | PID PDGFRB PATHWAY | PDGFR-beta signaling pathway |
| 0.2 | 2.4 | SA REG CASCADE OF CYCLIN EXPR | Expression of cyclins regulates progression through the cell cycle by activating cyclin-dependent kinases. |
| 0.2 | 3.6 | PID WNT NONCANONICAL PATHWAY | Noncanonical Wnt signaling pathway |
| 0.2 | 2.8 | PID PRL SIGNALING EVENTS PATHWAY | Signaling events mediated by PRL |
| 0.2 | 9.6 | ST INTEGRIN SIGNALING PATHWAY | Integrin Signaling Pathway |
| 0.2 | 8.1 | PID TCR PATHWAY | TCR signaling in naïve CD4+ T cells |
| 0.1 | 2.5 | PID FOXO PATHWAY | FoxO family signaling |
| 0.1 | 8.0 | PID MTOR 4PATHWAY | mTOR signaling pathway |
| 0.1 | 4.3 | PID ERBB2 ERBB3 PATHWAY | ErbB2/ErbB3 signaling events |
| 0.1 | 6.2 | PID HIF2PATHWAY | HIF-2-alpha transcription factor network |
| 0.1 | 6.5 | PID RAC1 REG PATHWAY | Regulation of RAC1 activity |
| 0.1 | 10.7 | PID CXCR4 PATHWAY | CXCR4-mediated signaling events |
| 0.1 | 2.0 | PID IL12 STAT4 PATHWAY | IL12 signaling mediated by STAT4 |
| 0.1 | 2.0 | PID CDC42 PATHWAY | CDC42 signaling events |
| 0.1 | 1.9 | PID RHOA PATHWAY | RhoA signaling pathway |
| 0.1 | 2.1 | PID INTEGRIN A4B1 PATHWAY | Alpha4 beta1 integrin signaling events |
| 0.1 | 2.6 | PID PLK1 PATHWAY | PLK1 signaling events |
| 0.1 | 0.9 | PID P38 ALPHA BETA PATHWAY | Regulation of p38-alpha and p38-beta |
| 0.1 | 2.2 | PID AURORA A PATHWAY | Aurora A signaling |
| 0.1 | 3.3 | PID AR TF PATHWAY | Regulation of Androgen receptor activity |
| 0.1 | 0.7 | PID SMAD2 3PATHWAY | Regulation of cytoplasmic and nuclear SMAD2/3 signaling |
| 0.1 | 5.3 | PID P73PATHWAY | p73 transcription factor network |
| 0.0 | 2.5 | PID NFAT TFPATHWAY | Calcineurin-regulated NFAT-dependent transcription in lymphocytes |
| 0.0 | 1.9 | PID AR PATHWAY | Coregulation of Androgen receptor activity |
| 0.0 | 3.2 | NABA ECM AFFILIATED | Genes encoding proteins affiliated structurally or functionally to extracellular matrix proteins |
| 0.0 | 0.7 | ST FAS SIGNALING PATHWAY | Fas Signaling Pathway |
Gene overrepresentation in C2:CP:REACTOME category:
| Log-likelihood per target | Total log-likelihood | Term | Description |
|---|---|---|---|
| 1.3 | 23.9 | REACTOME GAP JUNCTION DEGRADATION | Genes involved in Gap junction degradation |
| 1.2 | 21.0 | REACTOME DOPAMINE NEUROTRANSMITTER RELEASE CYCLE | Genes involved in Dopamine Neurotransmitter Release Cycle |
| 0.7 | 15.7 | REACTOME RAS ACTIVATION UOPN CA2 INFUX THROUGH NMDA RECEPTOR | Genes involved in Ras activation uopn Ca2+ infux through NMDA receptor |
| 0.6 | 20.4 | REACTOME POST NMDA RECEPTOR ACTIVATION EVENTS | Genes involved in Post NMDA receptor activation events |
| 0.6 | 1.3 | REACTOME VIF MEDIATED DEGRADATION OF APOBEC3G | Genes involved in Vif-mediated degradation of APOBEC3G |
| 0.6 | 6.7 | REACTOME SIGNALING BY EGFR IN CANCER | Genes involved in Signaling by EGFR in Cancer |
| 0.5 | 14.4 | REACTOME RECYCLING PATHWAY OF L1 | Genes involved in Recycling pathway of L1 |
| 0.5 | 12.1 | REACTOME N GLYCAN ANTENNAE ELONGATION | Genes involved in N-Glycan antennae elongation |
| 0.5 | 10.4 | REACTOME SYNTHESIS OF VERY LONG CHAIN FATTY ACYL COAS | Genes involved in Synthesis of very long-chain fatty acyl-CoAs |
| 0.4 | 7.5 | REACTOME PURINE RIBONUCLEOSIDE MONOPHOSPHATE BIOSYNTHESIS | Genes involved in Purine ribonucleoside monophosphate biosynthesis |
| 0.4 | 0.8 | REACTOME MEMBRANE BINDING AND TARGETTING OF GAG PROTEINS | Genes involved in Membrane binding and targetting of GAG proteins |
| 0.3 | 4.9 | REACTOME ACYL CHAIN REMODELLING OF PG | Genes involved in Acyl chain remodelling of PG |
| 0.3 | 7.4 | REACTOME CTNNB1 PHOSPHORYLATION CASCADE | Genes involved in Beta-catenin phosphorylation cascade |
| 0.3 | 6.3 | REACTOME P130CAS LINKAGE TO MAPK SIGNALING FOR INTEGRINS | Genes involved in p130Cas linkage to MAPK signaling for integrins |
| 0.2 | 5.1 | REACTOME EGFR DOWNREGULATION | Genes involved in EGFR downregulation |
| 0.2 | 5.1 | REACTOME ENDOSOMAL SORTING COMPLEX REQUIRED FOR TRANSPORT ESCRT | Genes involved in Endosomal Sorting Complex Required For Transport (ESCRT) |
| 0.2 | 2.6 | REACTOME REGULATION OF INSULIN SECRETION BY ACETYLCHOLINE | Genes involved in Regulation of Insulin Secretion by Acetylcholine |
| 0.2 | 1.6 | REACTOME ERKS ARE INACTIVATED | Genes involved in ERKs are inactivated |
| 0.2 | 5.6 | REACTOME KERATAN SULFATE BIOSYNTHESIS | Genes involved in Keratan sulfate biosynthesis |
| 0.2 | 6.7 | REACTOME DOWNREGULATION OF ERBB2 ERBB3 SIGNALING | Genes involved in Downregulation of ERBB2:ERBB3 signaling |
| 0.2 | 4.5 | REACTOME OXYGEN DEPENDENT PROLINE HYDROXYLATION OF HYPOXIA INDUCIBLE FACTOR ALPHA | Genes involved in Oxygen-dependent Proline Hydroxylation of Hypoxia-inducible Factor Alpha |
| 0.2 | 9.8 | REACTOME DOWNREGULATION OF SMAD2 3 SMAD4 TRANSCRIPTIONAL ACTIVITY | Genes involved in Downregulation of SMAD2/3:SMAD4 transcriptional activity |
| 0.2 | 3.7 | REACTOME SYNTHESIS OF PA | Genes involved in Synthesis of PA |
| 0.2 | 5.4 | REACTOME NEPHRIN INTERACTIONS | Genes involved in Nephrin interactions |
| 0.2 | 4.5 | REACTOME SYNTHESIS OF PIPS AT THE GOLGI MEMBRANE | Genes involved in Synthesis of PIPs at the Golgi membrane |
| 0.2 | 7.6 | REACTOME SEMA4D INDUCED CELL MIGRATION AND GROWTH CONE COLLAPSE | Genes involved in Sema4D induced cell migration and growth-cone collapse |
| 0.2 | 8.8 | REACTOME SIGNALING BY ROBO RECEPTOR | Genes involved in Signaling by Robo receptor |
| 0.2 | 6.3 | REACTOME DEADENYLATION OF MRNA | Genes involved in Deadenylation of mRNA |
| 0.2 | 8.4 | REACTOME NRAGE SIGNALS DEATH THROUGH JNK | Genes involved in NRAGE signals death through JNK |
| 0.2 | 3.2 | REACTOME ABCA TRANSPORTERS IN LIPID HOMEOSTASIS | Genes involved in ABCA transporters in lipid homeostasis |
| 0.2 | 1.9 | REACTOME NOTCH HLH TRANSCRIPTION PATHWAY | Genes involved in Notch-HLH transcription pathway |
| 0.1 | 3.8 | REACTOME REGULATION OF INSULIN LIKE GROWTH FACTOR IGF ACTIVITY BY INSULIN LIKE GROWTH FACTOR BINDING PROTEINS IGFBPS | Genes involved in Regulation of Insulin-like Growth Factor (IGF) Activity by Insulin-like Growth Factor Binding Proteins (IGFBPs) |
| 0.1 | 7.9 | REACTOME ION TRANSPORT BY P TYPE ATPASES | Genes involved in Ion transport by P-type ATPases |
| 0.1 | 6.2 | REACTOME GLYCOLYSIS | Genes involved in Glycolysis |
| 0.1 | 15.0 | REACTOME MHC CLASS II ANTIGEN PRESENTATION | Genes involved in MHC class II antigen presentation |
| 0.1 | 6.0 | REACTOME GLYCOSPHINGOLIPID METABOLISM | Genes involved in Glycosphingolipid metabolism |
| 0.1 | 4.2 | REACTOME RNA POL III TRANSCRIPTION TERMINATION | Genes involved in RNA Polymerase III Transcription Termination |
| 0.1 | 9.1 | REACTOME GOLGI ASSOCIATED VESICLE BIOGENESIS | Genes involved in Golgi Associated Vesicle Biogenesis |
| 0.1 | 4.0 | REACTOME CHOLESTEROL BIOSYNTHESIS | Genes involved in Cholesterol biosynthesis |
| 0.1 | 1.7 | REACTOME SHC MEDIATED SIGNALLING | Genes involved in SHC-mediated signalling |
| 0.1 | 1.9 | REACTOME HYALURONAN UPTAKE AND DEGRADATION | Genes involved in Hyaluronan uptake and degradation |
| 0.1 | 3.5 | REACTOME ACTIVATION OF NF KAPPAB IN B CELLS | Genes involved in Activation of NF-kappaB in B Cells |
| 0.1 | 4.1 | REACTOME SPHINGOLIPID DE NOVO BIOSYNTHESIS | Genes involved in Sphingolipid de novo biosynthesis |
| 0.1 | 2.8 | REACTOME PROTEOLYTIC CLEAVAGE OF SNARE COMPLEX PROTEINS | Genes involved in Proteolytic cleavage of SNARE complex proteins |
| 0.1 | 4.2 | REACTOME YAP1 AND WWTR1 TAZ STIMULATED GENE EXPRESSION | Genes involved in YAP1- and WWTR1 (TAZ)-stimulated gene expression |
| 0.1 | 1.7 | REACTOME ACTIVATION OF IRF3 IRF7 MEDIATED BY TBK1 IKK EPSILON | Genes involved in Activation of IRF3/IRF7 mediated by TBK1/IKK epsilon |
| 0.1 | 1.7 | REACTOME SYNTHESIS SECRETION AND INACTIVATION OF GIP | Genes involved in Synthesis, Secretion, and Inactivation of Glucose-dependent Insulinotropic Polypeptide (GIP) |
| 0.1 | 6.6 | REACTOME MITOCHONDRIAL PROTEIN IMPORT | Genes involved in Mitochondrial Protein Import |
| 0.1 | 1.2 | REACTOME ROLE OF DCC IN REGULATING APOPTOSIS | Genes involved in Role of DCC in regulating apoptosis |
| 0.1 | 13.2 | REACTOME FACTORS INVOLVED IN MEGAKARYOCYTE DEVELOPMENT AND PLATELET PRODUCTION | Genes involved in Factors involved in megakaryocyte development and platelet production |
| 0.1 | 3.0 | REACTOME INSULIN RECEPTOR RECYCLING | Genes involved in Insulin receptor recycling |
| 0.1 | 7.4 | REACTOME REGULATION OF ORNITHINE DECARBOXYLASE ODC | Genes involved in Regulation of ornithine decarboxylase (ODC) |
| 0.1 | 10.4 | REACTOME TRANSPORT OF INORGANIC CATIONS ANIONS AND AMINO ACIDS OLIGOPEPTIDES | Genes involved in Transport of inorganic cations/anions and amino acids/oligopeptides |
| 0.1 | 9.6 | REACTOME SIGNALING BY RHO GTPASES | Genes involved in Signaling by Rho GTPases |
| 0.1 | 2.3 | REACTOME ADHERENS JUNCTIONS INTERACTIONS | Genes involved in Adherens junctions interactions |
| 0.1 | 1.7 | REACTOME INTEGRIN ALPHAIIB BETA3 SIGNALING | Genes involved in Integrin alphaIIb beta3 signaling |
| 0.1 | 1.0 | REACTOME DESTABILIZATION OF MRNA BY BRF1 | Genes involved in Destabilization of mRNA by Butyrate Response Factor 1 (BRF1) |
| 0.1 | 1.6 | REACTOME PURINE SALVAGE | Genes involved in Purine salvage |
| 0.1 | 1.9 | REACTOME FORMATION OF FIBRIN CLOT CLOTTING CASCADE | Genes involved in Formation of Fibrin Clot (Clotting Cascade) |
| 0.0 | 0.7 | REACTOME GLYCOPROTEIN HORMONES | Genes involved in Glycoprotein hormones |
| 0.0 | 1.0 | REACTOME SIGNAL REGULATORY PROTEIN SIRP FAMILY INTERACTIONS | Genes involved in Signal regulatory protein (SIRP) family interactions |
| 0.0 | 0.9 | REACTOME ER PHAGOSOME PATHWAY | Genes involved in ER-Phagosome pathway |
| 0.0 | 1.4 | REACTOME INHIBITION OF VOLTAGE GATED CA2 CHANNELS VIA GBETA GAMMA SUBUNITS | Genes involved in Inhibition of voltage gated Ca2+ channels via Gbeta/gamma subunits |
| 0.0 | 5.8 | REACTOME INFLUENZA VIRAL RNA TRANSCRIPTION AND REPLICATION | Genes involved in Influenza Viral RNA Transcription and Replication |
| 0.0 | 0.4 | REACTOME REGULATION OF SIGNALING BY CBL | Genes involved in Regulation of signaling by CBL |
| 0.0 | 0.8 | REACTOME FORMATION OF INCISION COMPLEX IN GG NER | Genes involved in Formation of incision complex in GG-NER |
| 0.0 | 0.4 | REACTOME N GLYCAN TRIMMING IN THE ER AND CALNEXIN CALRETICULIN CYCLE | Genes involved in N-glycan trimming in the ER and Calnexin/Calreticulin cycle |
| 0.0 | 1.9 | REACTOME DOWNSTREAM SIGNAL TRANSDUCTION | Genes involved in Downstream signal transduction |
| 0.0 | 0.7 | REACTOME SIGNALING BY PDGF | Genes involved in Signaling by PDGF |
| 0.0 | 1.3 | REACTOME MITOTIC PROMETAPHASE | Genes involved in Mitotic Prometaphase |
| 0.0 | 0.3 | REACTOME ACTIVATION OF THE AP1 FAMILY OF TRANSCRIPTION FACTORS | Genes involved in Activation of the AP-1 family of transcription factors |
| 0.0 | 0.4 | REACTOME HS GAG DEGRADATION | Genes involved in HS-GAG degradation |
| 0.0 | 1.2 | REACTOME S PHASE | Genes involved in S Phase |
| 0.0 | 0.3 | REACTOME ENERGY DEPENDENT REGULATION OF MTOR BY LKB1 AMPK | Genes involved in Energy dependent regulation of mTOR by LKB1-AMPK |
| 0.0 | 0.2 | REACTOME HDL MEDIATED LIPID TRANSPORT | Genes involved in HDL-mediated lipid transport |
| 0.0 | 0.8 | REACTOME ANTIVIRAL MECHANISM BY IFN STIMULATED GENES | Genes involved in Antiviral mechanism by IFN-stimulated genes |