Project
GNF SymAtlas + NCI-60 cancer cell lines, comparison of cancers vs non-cancers, human (Su, 2004; Ross, 2000)
Navigation
Downloads
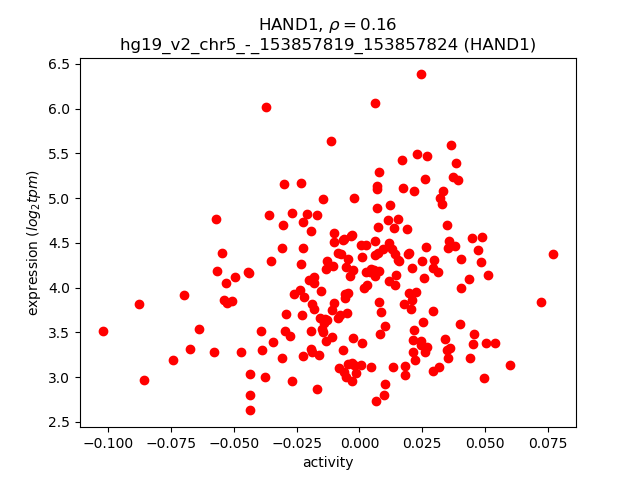
Results for HAND1
Z-value: 0.07
Motif logo

Transcription factors associated with HAND1
| Gene Symbol | Gene ID | Gene Info |
|---|---|---|
|
HAND1
|
ENSG00000113196.2 | heart and neural crest derivatives expressed 1 |
Activity-expression correlation:
| Gene | Promoter | Pearson corr. coef. | P-value | Plot |
|---|---|---|---|---|
| HAND1 | hg19_v2_chr5_-_153857819_153857824 | 0.16 | 2.1e-02 | Click! |
Activity profile of HAND1 motif
Sorted Z-values of HAND1 motif
| Promoter | Log-likelihood | Transcript | Gene | Gene Info |
|---|---|---|---|---|
| chr19_+_36359341 | 9.08 |
ENST00000221891.4
|
APLP1
|
amyloid beta (A4) precursor-like protein 1 |
| chr1_+_65775204 | 8.10 |
ENST00000371069.4
|
DNAJC6
|
DnaJ (Hsp40) homolog, subfamily C, member 6 |
| chr5_+_36608422 | 4.44 |
ENST00000381918.3
|
SLC1A3
|
solute carrier family 1 (glial high affinity glutamate transporter), member 3 |
| chr19_-_37701386 | 3.93 |
ENST00000527838.1
ENST00000591492.1 ENST00000532828.2 |
ZNF585B
|
zinc finger protein 585B |
| chr16_+_6069586 | 3.23 |
ENST00000547372.1
|
RBFOX1
|
RNA binding protein, fox-1 homolog (C. elegans) 1 |
| chr4_+_41614909 | 2.97 |
ENST00000509454.1
ENST00000396595.3 ENST00000381753.4 |
LIMCH1
|
LIM and calponin homology domains 1 |
| chr16_-_28621312 | 2.43 |
ENST00000314752.7
|
SULT1A1
|
sulfotransferase family, cytosolic, 1A, phenol-preferring, member 1 |
| chr16_-_28621353 | 2.26 |
ENST00000567512.1
|
SULT1A1
|
sulfotransferase family, cytosolic, 1A, phenol-preferring, member 1 |
| chr14_-_65409438 | 2.10 |
ENST00000557049.1
|
GPX2
|
glutathione peroxidase 2 (gastrointestinal) |
| chr1_+_174846570 | 2.06 |
ENST00000392064.2
|
RABGAP1L
|
RAB GTPase activating protein 1-like |
| chr6_+_6588902 | 1.99 |
ENST00000230568.4
|
LY86
|
lymphocyte antigen 86 |
| chr16_-_28608364 | 1.99 |
ENST00000533150.1
|
SULT1A2
|
sulfotransferase family, cytosolic, 1A, phenol-preferring, member 2 |
| chr8_+_79428539 | 1.99 |
ENST00000352966.5
|
PKIA
|
protein kinase (cAMP-dependent, catalytic) inhibitor alpha |
| chr6_+_6588316 | 1.90 |
ENST00000379953.2
|
LY86
|
lymphocyte antigen 86 |
| chr16_-_28621298 | 1.84 |
ENST00000566189.1
|
SULT1A1
|
sulfotransferase family, cytosolic, 1A, phenol-preferring, member 1 |
| chr14_-_65409502 | 1.81 |
ENST00000389614.5
|
GPX2
|
glutathione peroxidase 2 (gastrointestinal) |
| chr1_-_32210275 | 1.78 |
ENST00000440175.2
|
BAI2
|
brain-specific angiogenesis inhibitor 2 |
| chr3_+_123813509 | 1.71 |
ENST00000460856.1
ENST00000240874.3 |
KALRN
|
kalirin, RhoGEF kinase |
| chr1_+_28261533 | 1.69 |
ENST00000411604.1
ENST00000373888.4 |
SMPDL3B
|
sphingomyelin phosphodiesterase, acid-like 3B |
| chr4_+_41614720 | 1.67 |
ENST00000509277.1
|
LIMCH1
|
LIM and calponin homology domains 1 |
| chr16_+_6069664 | 1.65 |
ENST00000422070.4
|
RBFOX1
|
RNA binding protein, fox-1 homolog (C. elegans) 1 |
| chr10_+_118350468 | 1.58 |
ENST00000358834.4
ENST00000528052.1 ENST00000442761.1 |
PNLIPRP1
|
pancreatic lipase-related protein 1 |
| chr12_+_98909260 | 1.55 |
ENST00000556029.1
|
TMPO
|
thymopoietin |
| chr5_-_41870621 | 1.54 |
ENST00000196371.5
|
OXCT1
|
3-oxoacid CoA transferase 1 |
| chr10_+_118350522 | 1.54 |
ENST00000530319.1
ENST00000527980.1 ENST00000471549.1 ENST00000534537.1 |
PNLIPRP1
|
pancreatic lipase-related protein 1 |
| chr3_-_9811595 | 1.54 |
ENST00000256460.3
|
CAMK1
|
calcium/calmodulin-dependent protein kinase I |
| chr11_-_2323290 | 1.48 |
ENST00000381153.3
|
C11orf21
|
chromosome 11 open reading frame 21 |
| chr1_-_52870059 | 1.41 |
ENST00000371566.1
|
ORC1
|
origin recognition complex, subunit 1 |
| chr11_+_2323349 | 1.39 |
ENST00000381121.3
|
TSPAN32
|
tetraspanin 32 |
| chr1_+_164528866 | 1.39 |
ENST00000420696.2
|
PBX1
|
pre-B-cell leukemia homeobox 1 |
| chr2_+_210444142 | 1.38 |
ENST00000360351.4
ENST00000361559.4 |
MAP2
|
microtubule-associated protein 2 |
| chr10_-_99393242 | 1.32 |
ENST00000370635.3
ENST00000478953.1 ENST00000335628.3 |
MORN4
|
MORN repeat containing 4 |
| chr16_-_28608424 | 1.30 |
ENST00000335715.4
|
SULT1A2
|
sulfotransferase family, cytosolic, 1A, phenol-preferring, member 2 |
| chr2_-_27718052 | 1.29 |
ENST00000264703.3
|
FNDC4
|
fibronectin type III domain containing 4 |
| chr1_-_52870104 | 1.25 |
ENST00000371568.3
|
ORC1
|
origin recognition complex, subunit 1 |
| chr19_-_36304201 | 1.21 |
ENST00000301175.3
|
PRODH2
|
proline dehydrogenase (oxidase) 2 |
| chr1_+_207262170 | 1.20 |
ENST00000367078.3
|
C4BPB
|
complement component 4 binding protein, beta |
| chr10_-_99393208 | 1.20 |
ENST00000307450.6
|
MORN4
|
MORN repeat containing 4 |
| chr1_+_207262540 | 1.18 |
ENST00000452902.2
|
C4BPB
|
complement component 4 binding protein, beta |
| chr2_+_204732487 | 1.15 |
ENST00000302823.3
|
CTLA4
|
cytotoxic T-lymphocyte-associated protein 4 |
| chr17_+_11924129 | 1.12 |
ENST00000353533.5
ENST00000415385.3 |
MAP2K4
|
mitogen-activated protein kinase kinase 4 |
| chrX_+_15767971 | 1.07 |
ENST00000479740.1
ENST00000454127.2 |
CA5B
|
carbonic anhydrase VB, mitochondrial |
| chr7_-_142583506 | 1.05 |
ENST00000359396.3
|
TRPV6
|
transient receptor potential cation channel, subfamily V, member 6 |
| chr4_-_40631859 | 1.05 |
ENST00000295971.7
ENST00000319592.4 |
RBM47
|
RNA binding motif protein 47 |
| chr17_+_53342311 | 1.01 |
ENST00000226067.5
|
HLF
|
hepatic leukemia factor |
| chr1_+_207262578 | 1.00 |
ENST00000243611.5
ENST00000367076.3 |
C4BPB
|
complement component 4 binding protein, beta |
| chr17_-_56358287 | 0.98 |
ENST00000225275.3
ENST00000340482.3 |
MPO
|
myeloperoxidase |
| chr1_+_207262627 | 0.97 |
ENST00000391923.1
|
C4BPB
|
complement component 4 binding protein, beta |
| chr10_+_103113840 | 0.97 |
ENST00000393441.4
ENST00000408038.2 |
BTRC
|
beta-transducin repeat containing E3 ubiquitin protein ligase |
| chr7_-_2883928 | 0.96 |
ENST00000275364.3
|
GNA12
|
guanine nucleotide binding protein (G protein) alpha 12 |
| chr7_-_150754935 | 0.94 |
ENST00000297518.4
|
CDK5
|
cyclin-dependent kinase 5 |
| chrX_+_70364667 | 0.94 |
ENST00000536169.1
ENST00000395855.2 ENST00000374051.3 ENST00000358741.3 |
NLGN3
|
neuroligin 3 |
| chr7_+_96634850 | 0.91 |
ENST00000518156.2
|
DLX6
|
distal-less homeobox 6 |
| chr12_-_57630873 | 0.91 |
ENST00000556732.1
|
NDUFA4L2
|
NADH dehydrogenase (ubiquinone) 1 alpha subcomplex, 4-like 2 |
| chr2_+_113816215 | 0.91 |
ENST00000346807.3
|
IL36RN
|
interleukin 36 receptor antagonist |
| chr18_+_12407895 | 0.90 |
ENST00000590956.1
ENST00000336990.4 ENST00000440960.1 ENST00000588729.1 |
SLMO1
|
slowmo homolog 1 (Drosophila) |
| chr10_-_118032979 | 0.89 |
ENST00000355422.6
|
GFRA1
|
GDNF family receptor alpha 1 |
| chr6_-_53013620 | 0.88 |
ENST00000259803.7
|
GCM1
|
glial cells missing homolog 1 (Drosophila) |
| chr2_-_208031943 | 0.85 |
ENST00000421199.1
ENST00000457962.1 |
KLF7
|
Kruppel-like factor 7 (ubiquitous) |
| chr1_+_44444865 | 0.85 |
ENST00000372324.1
|
B4GALT2
|
UDP-Gal:betaGlcNAc beta 1,4- galactosyltransferase, polypeptide 2 |
| chr14_+_96722152 | 0.84 |
ENST00000216629.6
|
BDKRB1
|
bradykinin receptor B1 |
| chr1_+_28261621 | 0.84 |
ENST00000549094.1
|
SMPDL3B
|
sphingomyelin phosphodiesterase, acid-like 3B |
| chr10_+_99344104 | 0.82 |
ENST00000555577.1
ENST00000370649.3 |
PI4K2A
PI4K2A
|
phosphatidylinositol 4-kinase type 2 alpha Phosphatidylinositol 4-kinase type 2-alpha; Uncharacterized protein |
| chr9_-_115095123 | 0.81 |
ENST00000458258.1
|
PTBP3
|
polypyrimidine tract binding protein 3 |
| chr6_+_44191507 | 0.81 |
ENST00000371724.1
ENST00000371713.1 |
SLC29A1
|
solute carrier family 29 (equilibrative nucleoside transporter), member 1 |
| chr7_+_110731062 | 0.81 |
ENST00000308478.5
ENST00000451085.1 ENST00000422987.3 ENST00000421101.1 |
LRRN3
|
leucine rich repeat neuronal 3 |
| chr1_+_28261492 | 0.76 |
ENST00000373894.3
|
SMPDL3B
|
sphingomyelin phosphodiesterase, acid-like 3B |
| chr20_-_56286479 | 0.71 |
ENST00000265626.4
|
PMEPA1
|
prostate transmembrane protein, androgen induced 1 |
| chr10_-_118032697 | 0.69 |
ENST00000439649.3
|
GFRA1
|
GDNF family receptor alpha 1 |
| chr16_+_90089008 | 0.69 |
ENST00000268699.4
|
GAS8
|
growth arrest-specific 8 |
| chr14_+_96722539 | 0.69 |
ENST00000553356.1
|
BDKRB1
|
bradykinin receptor B1 |
| chr8_+_1993152 | 0.68 |
ENST00000262113.4
|
MYOM2
|
myomesin 2 |
| chr20_-_1165117 | 0.63 |
ENST00000381894.3
|
TMEM74B
|
transmembrane protein 74B |
| chr6_+_35996859 | 0.62 |
ENST00000472333.1
|
MAPK14
|
mitogen-activated protein kinase 14 |
| chr2_+_201997595 | 0.60 |
ENST00000470178.2
|
CFLAR
|
CASP8 and FADD-like apoptosis regulator |
| chr17_-_64216748 | 0.59 |
ENST00000585162.1
|
APOH
|
apolipoprotein H (beta-2-glycoprotein I) |
| chr7_-_142207004 | 0.59 |
ENST00000426318.2
|
TRBV10-2
|
T cell receptor beta variable 10-2 |
| chr12_+_54379569 | 0.58 |
ENST00000513209.1
|
RP11-834C11.12
|
RP11-834C11.12 |
| chr12_+_49717019 | 0.58 |
ENST00000549275.1
ENST00000551245.1 ENST00000380327.5 ENST00000548311.1 ENST00000550346.1 ENST00000550709.1 ENST00000549534.1 ENST00000257909.3 |
TROAP
|
trophinin associated protein |
| chr2_+_204732666 | 0.56 |
ENST00000295854.6
ENST00000472206.1 |
CTLA4
|
cytotoxic T-lymphocyte-associated protein 4 |
| chr11_+_2323236 | 0.56 |
ENST00000182290.4
|
TSPAN32
|
tetraspanin 32 |
| chr21_+_34602377 | 0.56 |
ENST00000342101.3
ENST00000413881.1 ENST00000443073.1 |
IFNAR2
|
interferon (alpha, beta and omega) receptor 2 |
| chr16_-_89556942 | 0.55 |
ENST00000301030.4
|
ANKRD11
|
ankyrin repeat domain 11 |
| chr8_+_1993173 | 0.54 |
ENST00000523438.1
|
MYOM2
|
myomesin 2 |
| chr12_+_68042495 | 0.53 |
ENST00000344096.3
|
DYRK2
|
dual-specificity tyrosine-(Y)-phosphorylation regulated kinase 2 |
| chr11_-_63330842 | 0.51 |
ENST00000255695.1
|
HRASLS2
|
HRAS-like suppressor 2 |
| chr10_-_104211294 | 0.49 |
ENST00000239125.1
|
C10orf95
|
chromosome 10 open reading frame 95 |
| chr22_+_24999114 | 0.49 |
ENST00000412658.1
ENST00000445029.1 ENST00000419133.1 ENST00000400382.1 ENST00000438643.2 ENST00000452551.1 ENST00000400383.1 ENST00000412898.1 ENST00000400380.1 ENST00000455483.1 ENST00000430289.1 |
GGT1
|
gamma-glutamyltransferase 1 |
| chr2_-_42588338 | 0.49 |
ENST00000234301.2
|
COX7A2L
|
cytochrome c oxidase subunit VIIa polypeptide 2 like |
| chr17_-_43025005 | 0.49 |
ENST00000587309.1
ENST00000593135.1 ENST00000339151.4 |
KIF18B
|
kinesin family member 18B |
| chr21_+_34602200 | 0.48 |
ENST00000382264.3
ENST00000382241.3 ENST00000404220.3 ENST00000342136.4 |
IFNAR2
|
interferon (alpha, beta and omega) receptor 2 |
| chr17_+_66624280 | 0.48 |
ENST00000585484.1
|
RP11-118B18.1
|
RP11-118B18.1 |
| chr1_+_52870227 | 0.48 |
ENST00000257181.9
|
PRPF38A
|
pre-mRNA processing factor 38A |
| chr16_+_70328680 | 0.47 |
ENST00000563206.1
ENST00000451014.3 ENST00000568625.1 |
DDX19B
|
DEAD (Asp-Glu-Ala-Asp) box polypeptide 19B |
| chr7_+_76139833 | 0.47 |
ENST00000257632.5
|
UPK3B
|
uroplakin 3B |
| chr7_-_116963334 | 0.45 |
ENST00000265441.3
|
WNT2
|
wingless-type MMTV integration site family member 2 |
| chr20_-_56285595 | 0.41 |
ENST00000395816.3
ENST00000347215.4 |
PMEPA1
|
prostate transmembrane protein, androgen induced 1 |
| chr17_+_6347761 | 0.40 |
ENST00000250056.8
ENST00000571373.1 ENST00000570337.2 ENST00000572595.2 ENST00000576056.1 |
FAM64A
|
family with sequence similarity 64, member A |
| chr22_+_25003626 | 0.39 |
ENST00000451366.1
ENST00000406383.2 ENST00000428855.1 |
GGT1
|
gamma-glutamyltransferase 1 |
| chr17_+_6347729 | 0.38 |
ENST00000572447.1
|
FAM64A
|
family with sequence similarity 64, member A |
| chr10_+_103113802 | 0.37 |
ENST00000370187.3
|
BTRC
|
beta-transducin repeat containing E3 ubiquitin protein ligase |
| chrX_+_149531524 | 0.37 |
ENST00000370401.2
|
MAMLD1
|
mastermind-like domain containing 1 |
| chr1_+_202091980 | 0.37 |
ENST00000367282.5
|
GPR37L1
|
G protein-coupled receptor 37 like 1 |
| chr12_-_110271178 | 0.36 |
ENST00000261740.2
ENST00000392719.2 ENST00000346520.2 |
TRPV4
|
transient receptor potential cation channel, subfamily V, member 4 |
| chr7_-_81399329 | 0.34 |
ENST00000453411.1
ENST00000444829.2 |
HGF
|
hepatocyte growth factor (hepapoietin A; scatter factor) |
| chr10_+_72972281 | 0.32 |
ENST00000335350.6
|
UNC5B
|
unc-5 homolog B (C. elegans) |
| chr3_+_123813543 | 0.31 |
ENST00000360013.3
|
KALRN
|
kalirin, RhoGEF kinase |
| chr12_+_26111823 | 0.31 |
ENST00000381352.3
ENST00000535907.1 ENST00000405154.2 |
RASSF8
|
Ras association (RalGDS/AF-6) domain family (N-terminal) member 8 |
| chr17_-_10372875 | 0.30 |
ENST00000255381.2
|
MYH4
|
myosin, heavy chain 4, skeletal muscle |
| chr1_+_11249398 | 0.30 |
ENST00000376819.3
|
ANGPTL7
|
angiopoietin-like 7 |
| chr3_+_112051994 | 0.28 |
ENST00000473539.1
ENST00000315711.8 ENST00000383681.3 |
CD200
|
CD200 molecule |
| chr19_+_12862486 | 0.27 |
ENST00000549706.1
|
BEST2
|
bestrophin 2 |
| chr3_-_49131013 | 0.26 |
ENST00000424300.1
|
QRICH1
|
glutamine-rich 1 |
| chr1_+_215747118 | 0.25 |
ENST00000448333.1
|
KCTD3
|
potassium channel tetramerization domain containing 3 |
| chr7_-_81399355 | 0.18 |
ENST00000457544.2
|
HGF
|
hepatocyte growth factor (hepapoietin A; scatter factor) |
| chr2_-_25475120 | 0.17 |
ENST00000380746.4
ENST00000402667.1 |
DNMT3A
|
DNA (cytosine-5-)-methyltransferase 3 alpha |
| chr3_+_148415571 | 0.17 |
ENST00000497524.1
ENST00000349243.3 ENST00000542281.1 ENST00000418473.2 ENST00000404754.2 |
AGTR1
|
angiotensin II receptor, type 1 |
| chr2_-_228582709 | 0.15 |
ENST00000541617.1
ENST00000409456.2 ENST00000409287.1 ENST00000258403.3 |
SLC19A3
|
solute carrier family 19 (thiamine transporter), member 3 |
| chr11_-_102496063 | 0.13 |
ENST00000260228.2
|
MMP20
|
matrix metallopeptidase 20 |
| chr11_+_118826999 | 0.12 |
ENST00000264031.2
|
UPK2
|
uroplakin 2 |
| chr7_-_81399438 | 0.12 |
ENST00000222390.5
|
HGF
|
hepatocyte growth factor (hepapoietin A; scatter factor) |
| chr7_-_81399411 | 0.11 |
ENST00000423064.2
|
HGF
|
hepatocyte growth factor (hepapoietin A; scatter factor) |
| chr12_+_68042517 | 0.10 |
ENST00000393555.3
|
DYRK2
|
dual-specificity tyrosine-(Y)-phosphorylation regulated kinase 2 |
| chr1_-_205601064 | 0.10 |
ENST00000357992.4
ENST00000289703.4 |
ELK4
|
ELK4, ETS-domain protein (SRF accessory protein 1) |
| chr2_+_3642545 | 0.07 |
ENST00000382062.2
ENST00000236693.7 ENST00000349077.4 |
COLEC11
|
collectin sub-family member 11 |
| chr1_+_27719148 | 0.06 |
ENST00000374024.3
|
GPR3
|
G protein-coupled receptor 3 |
| chr14_-_106642049 | 0.04 |
ENST00000390605.2
|
IGHV1-18
|
immunoglobulin heavy variable 1-18 |
| chr2_+_201997676 | 0.04 |
ENST00000462763.1
ENST00000479953.2 |
CFLAR
|
CASP8 and FADD-like apoptosis regulator |
| chr19_-_55866061 | 0.02 |
ENST00000588572.2
ENST00000593184.1 ENST00000589467.1 |
COX6B2
|
cytochrome c oxidase subunit VIb polypeptide 2 (testis) |
| chr2_-_197791441 | 0.01 |
ENST00000409475.1
ENST00000354764.4 ENST00000374738.3 |
PGAP1
|
post-GPI attachment to proteins 1 |
| chr16_-_70729496 | 0.01 |
ENST00000567648.1
|
VAC14
|
Vac14 homolog (S. cerevisiae) |
| chr2_+_98262497 | 0.01 |
ENST00000258424.2
|
COX5B
|
cytochrome c oxidase subunit Vb |
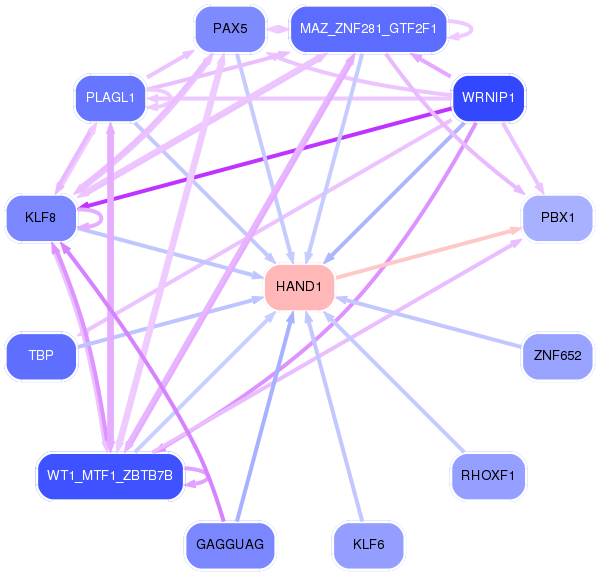
Network of associatons between targets according to the STRING database.

First level regulatory network of HAND1
Gene Ontology Analysis
Gene overrepresentation in biological_process category:
| Log-likelihood per target | Total log-likelihood | Term | Description |
|---|---|---|---|
| 1.8 | 9.1 | GO:0071874 | cellular response to norepinephrine stimulus(GO:0071874) |
| 0.9 | 8.1 | GO:0016191 | synaptic vesicle uncoating(GO:0016191) |
| 0.7 | 2.0 | GO:0030886 | negative regulation of myeloid dendritic cell activation(GO:0030886) |
| 0.6 | 4.4 | GO:0006537 | glutamate biosynthetic process(GO:0006537) gamma-aminobutyric acid biosynthetic process(GO:0009449) |
| 0.5 | 4.4 | GO:0045959 | regulation of complement activation, classical pathway(GO:0030450) negative regulation of complement activation, classical pathway(GO:0045959) regulation of opsonization(GO:1903027) |
| 0.4 | 3.9 | GO:0031666 | positive regulation of lipopolysaccharide-mediated signaling pathway(GO:0031666) |
| 0.4 | 2.0 | GO:0060125 | negative regulation of growth hormone secretion(GO:0060125) |
| 0.4 | 9.8 | GO:0006068 | ethanol catabolic process(GO:0006068) |
| 0.4 | 1.5 | GO:0051835 | positive regulation of synapse structural plasticity(GO:0051835) |
| 0.4 | 1.1 | GO:0072709 | cellular response to sorbitol(GO:0072709) |
| 0.3 | 1.7 | GO:0045590 | negative regulation of regulatory T cell differentiation(GO:0045590) |
| 0.3 | 3.3 | GO:0006685 | sphingomyelin catabolic process(GO:0006685) |
| 0.3 | 1.5 | GO:0046952 | ketone body catabolic process(GO:0046952) |
| 0.3 | 0.9 | GO:0060018 | astrocyte fate commitment(GO:0060018) |
| 0.3 | 0.8 | GO:0002276 | basophil activation involved in immune response(GO:0002276) |
| 0.2 | 0.9 | GO:2000969 | positive regulation of alpha-amino-3-hydroxy-5-methyl-4-isoxazole propionate selective glutamate receptor activity(GO:2000969) |
| 0.2 | 1.2 | GO:0010133 | proline catabolic process to glutamate(GO:0010133) |
| 0.2 | 1.0 | GO:0016554 | cytidine to uridine editing(GO:0016554) |
| 0.2 | 0.8 | GO:0015862 | uridine transport(GO:0015862) |
| 0.2 | 0.9 | GO:0031914 | negative regulation of synaptic plasticity(GO:0031914) |
| 0.2 | 1.2 | GO:0002074 | extraocular skeletal muscle development(GO:0002074) |
| 0.2 | 0.9 | GO:1902714 | negative regulation of interferon-gamma secretion(GO:1902714) |
| 0.1 | 1.6 | GO:0035860 | glial cell-derived neurotrophic factor receptor signaling pathway(GO:0035860) |
| 0.1 | 0.6 | GO:0051534 | negative regulation of NFAT protein import into nucleus(GO:0051534) |
| 0.1 | 0.9 | GO:0019344 | cysteine biosynthetic process(GO:0019344) |
| 0.1 | 2.0 | GO:2000480 | negative regulation of cAMP-dependent protein kinase activity(GO:2000480) |
| 0.1 | 0.6 | GO:0014835 | myoblast differentiation involved in skeletal muscle regeneration(GO:0014835) |
| 0.1 | 0.4 | GO:0007231 | osmosensory signaling pathway(GO:0007231) |
| 0.1 | 1.0 | GO:0001878 | response to yeast(GO:0001878) |
| 0.1 | 0.7 | GO:0060294 | cilium movement involved in cell motility(GO:0060294) regulation of microtubule binding(GO:1904526) |
| 0.1 | 1.1 | GO:0010991 | negative regulation of SMAD protein complex assembly(GO:0010991) |
| 0.1 | 0.7 | GO:0060665 | regulation of branching involved in salivary gland morphogenesis by mesenchymal-epithelial signaling(GO:0060665) |
| 0.1 | 0.4 | GO:0060501 | positive regulation of epithelial cell proliferation involved in lung morphogenesis(GO:0060501) canonical Wnt signaling pathway involved in midbrain dopaminergic neuron differentiation(GO:1904954) |
| 0.1 | 4.9 | GO:0000381 | regulation of alternative mRNA splicing, via spliceosome(GO:0000381) |
| 0.1 | 0.8 | GO:0043249 | erythrocyte maturation(GO:0043249) |
| 0.1 | 1.0 | GO:1990035 | calcium ion import across plasma membrane(GO:0098703) calcium ion import into cell(GO:1990035) |
| 0.1 | 0.3 | GO:0033564 | anterior/posterior axon guidance(GO:0033564) |
| 0.1 | 1.4 | GO:0010971 | positive regulation of G2/M transition of mitotic cell cycle(GO:0010971) |
| 0.1 | 0.3 | GO:0034334 | adherens junction maintenance(GO:0034334) |
| 0.1 | 2.7 | GO:0000083 | regulation of transcription involved in G1/S transition of mitotic cell cycle(GO:0000083) |
| 0.1 | 0.6 | GO:0051918 | negative regulation of fibrinolysis(GO:0051918) |
| 0.1 | 1.3 | GO:0042753 | positive regulation of circadian rhythm(GO:0042753) |
| 0.0 | 0.1 | GO:0071934 | thiamine transport(GO:0015888) thiamine transmembrane transport(GO:0071934) |
| 0.0 | 0.4 | GO:0021940 | positive regulation of cerebellar granule cell precursor proliferation(GO:0021940) |
| 0.0 | 0.4 | GO:1903944 | regulation of hepatocyte apoptotic process(GO:1903943) negative regulation of hepatocyte apoptotic process(GO:1903944) |
| 0.0 | 0.2 | GO:0086097 | phospholipase C-activating angiotensin-activated signaling pathway(GO:0086097) |
| 0.0 | 1.0 | GO:0035455 | response to interferon-alpha(GO:0035455) |
| 0.0 | 1.3 | GO:0007205 | protein kinase C-activating G-protein coupled receptor signaling pathway(GO:0007205) |
| 0.0 | 0.8 | GO:0021680 | cerebellar Purkinje cell layer development(GO:0021680) |
| 0.0 | 0.2 | GO:1901538 | DNA methylation involved in embryo development(GO:0043045) C-5 methylation of cytosine(GO:0090116) changes to DNA methylation involved in embryo development(GO:1901538) |
| 0.0 | 0.5 | GO:0006123 | mitochondrial electron transport, cytochrome c to oxygen(GO:0006123) |
| 0.0 | 0.3 | GO:0043031 | negative regulation of macrophage activation(GO:0043031) |
| 0.0 | 1.0 | GO:0010762 | regulation of fibroblast migration(GO:0010762) |
| 0.0 | 1.1 | GO:0006730 | one-carbon metabolic process(GO:0006730) |
| 0.0 | 1.4 | GO:0001578 | microtubule bundle formation(GO:0001578) |
| 0.0 | 1.0 | GO:0035914 | skeletal muscle cell differentiation(GO:0035914) |
| 0.0 | 0.5 | GO:0036152 | phosphatidylethanolamine acyl-chain remodeling(GO:0036152) |
| 0.0 | 1.6 | GO:0031338 | regulation of vesicle fusion(GO:0031338) |
| 0.0 | 2.1 | GO:0098869 | cellular oxidant detoxification(GO:0098869) |
| 0.0 | 0.6 | GO:0060325 | face morphogenesis(GO:0060325) |
| 0.0 | 0.1 | GO:0070166 | enamel mineralization(GO:0070166) |
| 0.0 | 4.3 | GO:0031032 | actomyosin structure organization(GO:0031032) |
| 0.0 | 0.5 | GO:0007019 | microtubule depolymerization(GO:0007019) |
| 0.0 | 0.8 | GO:0051965 | positive regulation of synapse assembly(GO:0051965) |
| 0.0 | 0.9 | GO:0042472 | inner ear morphogenesis(GO:0042472) |
Gene overrepresentation in cellular_component category:
| Log-likelihood per target | Total log-likelihood | Term | Description |
|---|---|---|---|
| 0.2 | 0.9 | GO:0016533 | cyclin-dependent protein kinase 5 holoenzyme complex(GO:0016533) |
| 0.2 | 1.4 | GO:0097442 | CA3 pyramidal cell dendrite(GO:0097442) |
| 0.2 | 2.7 | GO:0005664 | origin recognition complex(GO:0000808) nuclear origin of replication recognition complex(GO:0005664) |
| 0.1 | 0.8 | GO:0044279 | other organism cell membrane(GO:0044218) other organism membrane(GO:0044279) |
| 0.1 | 9.1 | GO:0005604 | basement membrane(GO:0005604) |
| 0.1 | 3.7 | GO:0098636 | protein complex involved in cell adhesion(GO:0098636) |
| 0.1 | 0.9 | GO:0005751 | mitochondrial respiratory chain complex IV(GO:0005751) |
| 0.1 | 0.5 | GO:0000235 | astral microtubule(GO:0000235) aster(GO:0005818) |
| 0.1 | 1.5 | GO:0032982 | myosin filament(GO:0032982) |
| 0.0 | 4.4 | GO:0044216 | other organism(GO:0044215) other organism cell(GO:0044216) other organism part(GO:0044217) |
| 0.0 | 0.4 | GO:1990909 | Wnt signalosome(GO:1990909) |
| 0.0 | 1.1 | GO:0032839 | dendrite cytoplasm(GO:0032839) |
| 0.0 | 0.6 | GO:0031089 | platelet dense granule lumen(GO:0031089) |
| 0.0 | 10.6 | GO:0060076 | excitatory synapse(GO:0060076) |
| 0.0 | 4.6 | GO:0031225 | anchored component of membrane(GO:0031225) |
| 0.0 | 0.4 | GO:0097342 | ripoptosome(GO:0097342) |
| 0.0 | 1.3 | GO:0019005 | SCF ubiquitin ligase complex(GO:0019005) |
| 0.0 | 1.0 | GO:0005834 | heterotrimeric G-protein complex(GO:0005834) |
| 0.0 | 4.6 | GO:0005802 | trans-Golgi network(GO:0005802) |
| 0.0 | 0.5 | GO:0071011 | precatalytic spliceosome(GO:0071011) |
| 0.0 | 0.3 | GO:0045121 | membrane raft(GO:0045121) membrane microdomain(GO:0098857) |
| 0.0 | 0.2 | GO:0001741 | XY body(GO:0001741) |
| 0.0 | 0.8 | GO:0032580 | Golgi cisterna membrane(GO:0032580) |
Gene overrepresentation in molecular_function category:
| Log-likelihood per target | Total log-likelihood | Term | Description |
|---|---|---|---|
| 2.3 | 9.1 | GO:0031694 | alpha-2A adrenergic receptor binding(GO:0031694) |
| 1.4 | 9.8 | GO:0047894 | flavonol 3-sulfotransferase activity(GO:0047894) |
| 0.6 | 4.4 | GO:0015501 | glutamate:sodium symporter activity(GO:0015501) |
| 0.5 | 1.5 | GO:0004947 | bradykinin receptor activity(GO:0004947) |
| 0.4 | 1.5 | GO:0008410 | CoA-transferase activity(GO:0008410) |
| 0.3 | 3.3 | GO:0004767 | sphingomyelin phosphodiesterase activity(GO:0004767) |
| 0.3 | 1.2 | GO:0004657 | proline dehydrogenase activity(GO:0004657) |
| 0.2 | 1.6 | GO:0016167 | glial cell-derived neurotrophic factor receptor activity(GO:0016167) |
| 0.2 | 0.8 | GO:0004461 | lactose synthase activity(GO:0004461) |
| 0.2 | 1.0 | GO:0004905 | type I interferon receptor activity(GO:0004905) |
| 0.2 | 0.8 | GO:0035651 | AP-3 adaptor complex binding(GO:0035651) |
| 0.2 | 0.9 | GO:0005152 | interleukin-1 receptor antagonist activity(GO:0005152) |
| 0.2 | 0.9 | GO:0030548 | acetylcholine receptor regulator activity(GO:0030548) neurotransmitter receptor regulator activity(GO:0099602) |
| 0.1 | 3.1 | GO:0004806 | triglyceride lipase activity(GO:0004806) |
| 0.1 | 0.4 | GO:0015275 | stretch-activated, cation-selective, calcium channel activity(GO:0015275) |
| 0.1 | 0.6 | GO:0060230 | lipoprotein lipase activator activity(GO:0060230) |
| 0.1 | 2.0 | GO:0004862 | cAMP-dependent protein kinase inhibitor activity(GO:0004862) |
| 0.1 | 2.0 | GO:0030676 | Rac guanyl-nucleotide exchange factor activity(GO:0030676) |
| 0.1 | 2.1 | GO:0004602 | glutathione peroxidase activity(GO:0004602) |
| 0.1 | 0.9 | GO:0042043 | neurexin family protein binding(GO:0042043) |
| 0.1 | 1.1 | GO:0004089 | carbonate dehydratase activity(GO:0004089) |
| 0.1 | 0.9 | GO:0036374 | glutathione hydrolase activity(GO:0036374) |
| 0.1 | 1.7 | GO:0004708 | MAP kinase kinase activity(GO:0004708) |
| 0.1 | 1.4 | GO:0002162 | dystroglycan binding(GO:0002162) |
| 0.1 | 7.4 | GO:0004725 | protein tyrosine phosphatase activity(GO:0004725) |
| 0.1 | 1.6 | GO:0005521 | lamin binding(GO:0005521) |
| 0.1 | 0.2 | GO:0001596 | angiotensin type I receptor activity(GO:0001596) |
| 0.1 | 1.2 | GO:0051371 | muscle alpha-actinin binding(GO:0051371) structural molecule activity conferring elasticity(GO:0097493) |
| 0.0 | 0.1 | GO:0015234 | thiamine transmembrane transporter activity(GO:0015234) thiamine uptake transmembrane transporter activity(GO:0015403) |
| 0.0 | 1.4 | GO:0004129 | cytochrome-c oxidase activity(GO:0004129) heme-copper terminal oxidase activity(GO:0015002) oxidoreductase activity, acting on a heme group of donors, oxygen as acceptor(GO:0016676) |
| 0.0 | 0.8 | GO:0005337 | nucleoside transmembrane transporter activity(GO:0005337) |
| 0.0 | 1.5 | GO:0004683 | calmodulin-dependent protein kinase activity(GO:0004683) |
| 0.0 | 1.0 | GO:0050780 | dopamine receptor binding(GO:0050780) |
| 0.0 | 1.0 | GO:0004601 | peroxidase activity(GO:0004601) |
| 0.0 | 0.2 | GO:0003886 | DNA (cytosine-5-)-methyltransferase activity(GO:0003886) |
| 0.0 | 1.1 | GO:0050699 | WW domain binding(GO:0050699) |
| 0.0 | 0.4 | GO:0048018 | receptor agonist activity(GO:0048018) |
| 0.0 | 1.3 | GO:0045309 | protein phosphorylated amino acid binding(GO:0045309) |
| 0.0 | 0.7 | GO:0042056 | chemoattractant activity(GO:0042056) |
| 0.0 | 4.9 | GO:0003729 | mRNA binding(GO:0003729) poly(A) RNA binding(GO:0044822) |
| 0.0 | 0.6 | GO:0004712 | protein serine/threonine/tyrosine kinase activity(GO:0004712) |
| 0.0 | 0.4 | GO:0097200 | cysteine-type endopeptidase activity involved in execution phase of apoptosis(GO:0097200) |
| 0.0 | 2.2 | GO:0017137 | Rab GTPase binding(GO:0017137) |
Gene overrepresentation in C2:CP category:
| Log-likelihood per target | Total log-likelihood | Term | Description |
|---|---|---|---|
| 0.1 | 2.0 | PID ARF6 DOWNSTREAM PATHWAY | Arf6 downstream pathway |
| 0.1 | 1.0 | PID S1P S1P4 PATHWAY | S1P4 pathway |
| 0.1 | 4.4 | PID HNF3A PATHWAY | FOXA1 transcription factor network |
| 0.1 | 4.8 | PID DELTA NP63 PATHWAY | Validated transcriptional targets of deltaNp63 isoforms |
| 0.0 | 1.1 | PID ANTHRAX PATHWAY | Cellular roles of Anthrax toxin |
| 0.0 | 0.6 | PID S1P S1P2 PATHWAY | S1P2 pathway |
| 0.0 | 0.8 | PID WNT CANONICAL PATHWAY | Canonical Wnt signaling pathway |
| 0.0 | 2.7 | PID E2F PATHWAY | E2F transcription factor network |
| 0.0 | 0.9 | PID LIS1 PATHWAY | Lissencephaly gene (LIS1) in neuronal migration and development |
| 0.0 | 1.0 | PID IL23 PATHWAY | IL23-mediated signaling events |
| 0.0 | 1.7 | PID NFAT TFPATHWAY | Calcineurin-regulated NFAT-dependent transcription in lymphocytes |
| 0.0 | 1.6 | PID RET PATHWAY | Signaling events regulated by Ret tyrosine kinase |
| 0.0 | 1.0 | PID CD8 TCR DOWNSTREAM PATHWAY | Downstream signaling in naïve CD8+ T cells |
| 0.0 | 1.7 | WNT SIGNALING | Genes related to Wnt-mediated signal transduction |
| 0.0 | 0.9 | PID ARF6 PATHWAY | Arf6 signaling events |
| 0.0 | 1.3 | PID REG GR PATHWAY | Glucocorticoid receptor regulatory network |
| 0.0 | 0.4 | SA FAS SIGNALING | The TNF-type receptor Fas induces apoptosis on ligand binding. |
| 0.0 | 0.3 | PID NETRIN PATHWAY | Netrin-mediated signaling events |
| 0.0 | 0.6 | PID P53 REGULATION PATHWAY | p53 pathway |
Gene overrepresentation in C2:CP:REACTOME category:
| Log-likelihood per target | Total log-likelihood | Term | Description |
|---|---|---|---|
| 0.4 | 9.8 | REACTOME CYTOSOLIC SULFONATION OF SMALL MOLECULES | Genes involved in Cytosolic sulfonation of small molecules |
| 0.2 | 2.7 | REACTOME CDC6 ASSOCIATION WITH THE ORC ORIGIN COMPLEX | Genes involved in CDC6 association with the ORC:origin complex |
| 0.2 | 8.1 | REACTOME LYSOSOME VESICLE BIOGENESIS | Genes involved in Lysosome Vesicle Biogenesis |
| 0.2 | 4.4 | REACTOME REGULATION OF COMPLEMENT CASCADE | Genes involved in Regulation of Complement cascade |
| 0.1 | 1.1 | REACTOME REVERSIBLE HYDRATION OF CARBON DIOXIDE | Genes involved in Reversible Hydration of Carbon Dioxide |
| 0.1 | 4.4 | REACTOME AMINO ACID AND OLIGOPEPTIDE SLC TRANSPORTERS | Genes involved in Amino acid and oligopeptide SLC transporters |
| 0.1 | 0.8 | REACTOME SYNTHESIS OF PIPS AT THE EARLY ENDOSOME MEMBRANE | Genes involved in Synthesis of PIPs at the early endosome membrane |
| 0.1 | 1.3 | REACTOME PROLACTIN RECEPTOR SIGNALING | Genes involved in Prolactin receptor signaling |
| 0.1 | 1.1 | REACTOME JNK C JUN KINASES PHOSPHORYLATION AND ACTIVATION MEDIATED BY ACTIVATED HUMAN TAK1 | Genes involved in JNK (c-Jun kinases) phosphorylation and activation mediated by activated human TAK1 |
| 0.0 | 0.6 | REACTOME ACTIVATED TAK1 MEDIATES P38 MAPK ACTIVATION | Genes involved in activated TAK1 mediates p38 MAPK activation |
| 0.0 | 0.7 | REACTOME IL 7 SIGNALING | Genes involved in Interleukin-7 signaling |
| 0.0 | 0.9 | REACTOME CRMPS IN SEMA3A SIGNALING | Genes involved in CRMPs in Sema3A signaling |
| 0.0 | 2.0 | REACTOME NRAGE SIGNALS DEATH THROUGH JNK | Genes involved in NRAGE signals death through JNK |
| 0.0 | 0.8 | REACTOME N GLYCAN ANTENNAE ELONGATION | Genes involved in N-Glycan antennae elongation |
| 0.0 | 1.2 | REACTOME CTLA4 INHIBITORY SIGNALING | Genes involved in CTLA4 inhibitory signaling |
| 0.0 | 1.0 | REACTOME REGULATION OF IFNA SIGNALING | Genes involved in Regulation of IFNA signaling |
| 0.0 | 1.1 | REACTOME DOWNREGULATION OF TGF BETA RECEPTOR SIGNALING | Genes involved in Downregulation of TGF-beta receptor signaling |
| 0.0 | 0.4 | REACTOME NOTCH HLH TRANSCRIPTION PATHWAY | Genes involved in Notch-HLH transcription pathway |
| 0.0 | 3.9 | REACTOME TOLL RECEPTOR CASCADES | Genes involved in Toll Receptor Cascades |
| 0.0 | 1.0 | REACTOME THROMBIN SIGNALLING THROUGH PROTEINASE ACTIVATED RECEPTORS PARS | Genes involved in Thrombin signalling through proteinase activated receptors (PARs) |
| 0.0 | 0.3 | REACTOME ROLE OF DCC IN REGULATING APOPTOSIS | Genes involved in Role of DCC in regulating apoptosis |
| 0.0 | 1.6 | REACTOME NCAM1 INTERACTIONS | Genes involved in NCAM1 interactions |
| 0.0 | 0.9 | REACTOME GLUTATHIONE CONJUGATION | Genes involved in Glutathione conjugation |
| 0.0 | 0.8 | REACTOME TRANSPORT OF VITAMINS NUCLEOSIDES AND RELATED MOLECULES | Genes involved in Transport of vitamins, nucleosides, and related molecules |
| 0.0 | 0.4 | REACTOME EXTRINSIC PATHWAY FOR APOPTOSIS | Genes involved in Extrinsic Pathway for Apoptosis |
| 0.0 | 3.9 | REACTOME GENERIC TRANSCRIPTION PATHWAY | Genes involved in Generic Transcription Pathway |