Project
GNF SymAtlas + NCI-60 cancer cell lines, comparison of cancers vs non-cancers, human (Su, 2004; Ross, 2000)
Navigation
Downloads
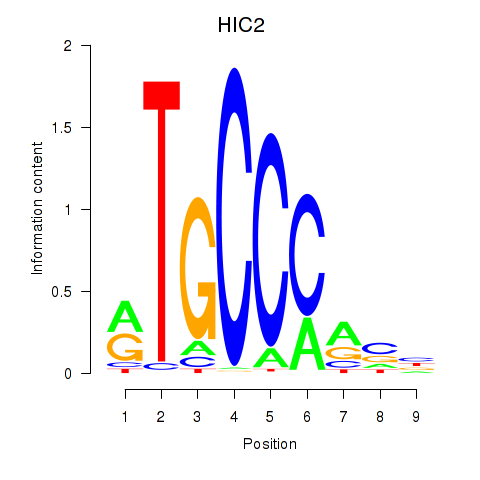
Results for HIC2
Z-value: 0.59
Motif logo
Transcription factors associated with HIC2
| Gene Symbol | Gene ID | Gene Info |
|---|---|---|
|
HIC2
|
ENSG00000169635.5 | HIC ZBTB transcriptional repressor 2 |
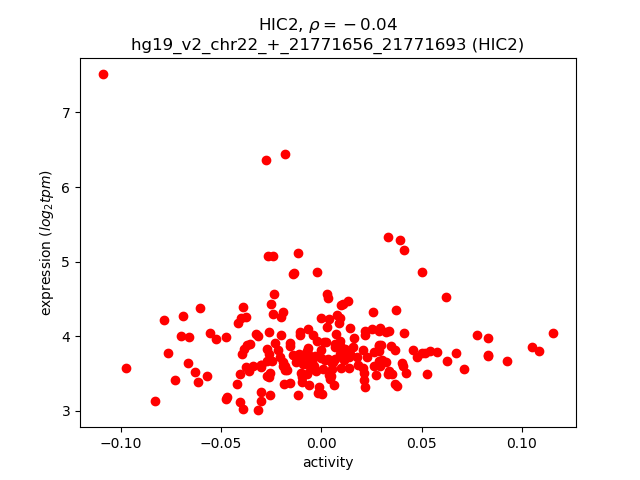
Activity-expression correlation:
| Gene | Promoter | Pearson corr. coef. | P-value | Plot |
|---|---|---|---|---|
| HIC2 | hg19_v2_chr22_+_21771656_21771693 | -0.04 | 5.1e-01 | Click! |
Activity profile of HIC2 motif
Sorted Z-values of HIC2 motif
| Promoter | Log-likelihood | Transcript | Gene | Gene Info |
|---|---|---|---|---|
| chr14_-_94856951 | 23.68 |
ENST00000553327.1
ENST00000556955.1 ENST00000557118.1 ENST00000440909.1 |
SERPINA1
|
serpin peptidase inhibitor, clade A (alpha-1 antiproteinase, antitrypsin), member 1 |
| chr14_-_94856987 | 22.18 |
ENST00000449399.3
ENST00000404814.4 |
SERPINA1
|
serpin peptidase inhibitor, clade A (alpha-1 antiproteinase, antitrypsin), member 1 |
| chr14_-_94857004 | 16.41 |
ENST00000557492.1
ENST00000448921.1 ENST00000437397.1 ENST00000355814.4 ENST00000393088.4 |
SERPINA1
|
serpin peptidase inhibitor, clade A (alpha-1 antiproteinase, antitrypsin), member 1 |
| chr14_-_106092403 | 16.30 |
ENST00000390543.2
|
IGHG4
|
immunoglobulin heavy constant gamma 4 (G4m marker) |
| chr3_+_10206545 | 16.15 |
ENST00000256458.4
|
IRAK2
|
interleukin-1 receptor-associated kinase 2 |
| chr14_-_106209368 | 14.88 |
ENST00000390548.2
ENST00000390549.2 ENST00000390542.2 |
IGHG1
|
immunoglobulin heavy constant gamma 1 (G1m marker) |
| chr22_-_27620603 | 14.67 |
ENST00000418271.1
ENST00000444114.1 |
RP5-1172A22.1
|
RP5-1172A22.1 |
| chr11_-_5248294 | 14.51 |
ENST00000335295.4
|
HBB
|
hemoglobin, beta |
| chr5_-_172198190 | 14.39 |
ENST00000239223.3
|
DUSP1
|
dual specificity phosphatase 1 |
| chr9_+_124088860 | 13.95 |
ENST00000373806.1
|
GSN
|
gelsolin |
| chr22_+_33197683 | 13.88 |
ENST00000266085.6
|
TIMP3
|
TIMP metallopeptidase inhibitor 3 |
| chr7_+_30960915 | 13.81 |
ENST00000441328.2
ENST00000409899.1 ENST00000409611.1 |
AQP1
|
aquaporin 1 (Colton blood group) |
| chr12_-_15038779 | 13.78 |
ENST00000228938.5
ENST00000539261.1 |
MGP
|
matrix Gla protein |
| chr12_-_7245125 | 13.69 |
ENST00000542285.1
ENST00000540610.1 |
C1R
|
complement component 1, r subcomponent |
| chr6_+_31865552 | 11.69 |
ENST00000469372.1
ENST00000497706.1 |
C2
|
complement component 2 |
| chr9_+_124030338 | 11.45 |
ENST00000449773.1
ENST00000432226.1 ENST00000436847.1 ENST00000394353.2 ENST00000449733.1 ENST00000412819.1 ENST00000341272.2 ENST00000373808.2 |
GSN
|
gelsolin |
| chr1_-_153363452 | 10.89 |
ENST00000368732.1
ENST00000368733.3 |
S100A8
|
S100 calcium binding protein A8 |
| chr18_+_71815743 | 10.57 |
ENST00000169551.6
ENST00000580087.1 |
TIMM21
|
translocase of inner mitochondrial membrane 21 homolog (yeast) |
| chr1_-_120311517 | 10.36 |
ENST00000369406.3
ENST00000544913.2 |
HMGCS2
|
3-hydroxy-3-methylglutaryl-CoA synthase 2 (mitochondrial) |
| chrX_-_17878827 | 10.35 |
ENST00000360011.1
|
RAI2
|
retinoic acid induced 2 |
| chr1_+_10270863 | 10.28 |
ENST00000377093.4
ENST00000263934.6 |
KIF1B
|
kinesin family member 1B |
| chr19_+_33182823 | 10.14 |
ENST00000397061.3
|
NUDT19
|
nudix (nucleoside diphosphate linked moiety X)-type motif 19 |
| chr11_-_2162468 | 9.62 |
ENST00000434045.2
|
IGF2
|
insulin-like growth factor 2 (somatomedin A) |
| chr14_+_101193246 | 9.50 |
ENST00000331224.6
|
DLK1
|
delta-like 1 homolog (Drosophila) |
| chr17_+_1674982 | 9.42 |
ENST00000572048.1
ENST00000573763.1 |
SERPINF1
|
serpin peptidase inhibitor, clade F (alpha-2 antiplasmin, pigment epithelium derived factor), member 1 |
| chr14_+_101193164 | 9.21 |
ENST00000341267.4
|
DLK1
|
delta-like 1 homolog (Drosophila) |
| chr9_+_139871948 | 8.96 |
ENST00000224167.2
ENST00000457950.1 ENST00000371625.3 ENST00000371623.3 |
PTGDS
|
prostaglandin D2 synthase 21kDa (brain) |
| chr22_-_37415475 | 8.95 |
ENST00000403892.3
ENST00000249042.3 ENST00000438203.1 |
TST
|
thiosulfate sulfurtransferase (rhodanese) |
| chr3_+_32726774 | 8.92 |
ENST00000538368.1
|
CNOT10
|
CCR4-NOT transcription complex, subunit 10 |
| chr14_-_106054659 | 8.92 |
ENST00000390539.2
|
IGHA2
|
immunoglobulin heavy constant alpha 2 (A2m marker) |
| chr10_+_124221036 | 8.84 |
ENST00000368984.3
|
HTRA1
|
HtrA serine peptidase 1 |
| chr17_-_18218237 | 8.76 |
ENST00000542570.1
|
TOP3A
|
topoisomerase (DNA) III alpha |
| chr10_-_71169031 | 8.70 |
ENST00000373307.1
|
TACR2
|
tachykinin receptor 2 |
| chr3_-_138763734 | 8.63 |
ENST00000413199.1
ENST00000502927.2 |
PRR23C
|
proline rich 23C |
| chr11_+_46722368 | 8.55 |
ENST00000311764.2
|
ZNF408
|
zinc finger protein 408 |
| chr1_+_159175201 | 8.53 |
ENST00000368121.2
|
DARC
|
Duffy blood group, atypical chemokine receptor |
| chr3_+_52529346 | 8.34 |
ENST00000321725.6
|
STAB1
|
stabilin 1 |
| chr11_-_2162162 | 8.32 |
ENST00000381389.1
|
IGF2
|
insulin-like growth factor 2 (somatomedin A) |
| chr14_+_73704201 | 8.26 |
ENST00000340738.5
ENST00000427855.1 ENST00000381166.3 |
PAPLN
|
papilin, proteoglycan-like sulfated glycoprotein |
| chr11_+_61717279 | 8.20 |
ENST00000378043.4
|
BEST1
|
bestrophin 1 |
| chrX_-_43741594 | 8.02 |
ENST00000536181.1
ENST00000378069.4 |
MAOB
|
monoamine oxidase B |
| chr11_+_71927807 | 7.93 |
ENST00000298223.6
ENST00000454954.2 ENST00000541003.1 ENST00000539412.1 ENST00000536778.1 ENST00000535625.1 ENST00000321324.7 |
FOLR2
|
folate receptor 2 (fetal) |
| chr2_+_26915584 | 7.90 |
ENST00000302909.3
|
KCNK3
|
potassium channel, subfamily K, member 3 |
| chr19_-_17488143 | 7.84 |
ENST00000599426.1
ENST00000252590.4 |
PLVAP
|
plasmalemma vesicle associated protein |
| chr11_+_61717336 | 7.81 |
ENST00000378042.3
|
BEST1
|
bestrophin 1 |
| chr22_+_23243156 | 7.81 |
ENST00000390323.2
|
IGLC2
|
immunoglobulin lambda constant 2 (Kern-Oz- marker) |
| chr5_-_41261540 | 7.74 |
ENST00000263413.3
|
C6
|
complement component 6 |
| chr5_-_159739532 | 7.73 |
ENST00000520748.1
ENST00000393977.3 ENST00000257536.7 |
CCNJL
|
cyclin J-like |
| chrX_+_70435044 | 7.67 |
ENST00000374029.1
ENST00000374022.3 ENST00000447581.1 |
GJB1
|
gap junction protein, beta 1, 32kDa |
| chr16_+_56642489 | 7.55 |
ENST00000561491.1
|
MT2A
|
metallothionein 2A |
| chr10_-_95360983 | 7.54 |
ENST00000371464.3
|
RBP4
|
retinol binding protein 4, plasma |
| chr11_+_17756279 | 7.52 |
ENST00000265969.6
|
KCNC1
|
potassium voltage-gated channel, Shaw-related subfamily, member 1 |
| chr11_+_1889880 | 7.47 |
ENST00000405957.2
|
LSP1
|
lymphocyte-specific protein 1 |
| chr12_-_56882136 | 7.36 |
ENST00000311966.4
|
GLS2
|
glutaminase 2 (liver, mitochondrial) |
| chr17_+_38083977 | 7.26 |
ENST00000578802.1
ENST00000578478.1 ENST00000582263.1 |
RP11-387H17.4
|
RP11-387H17.4 |
| chr15_+_75118888 | 7.13 |
ENST00000395018.4
|
CPLX3
|
complexin 3 |
| chr11_-_111783595 | 7.09 |
ENST00000528628.1
|
CRYAB
|
crystallin, alpha B |
| chr11_-_2170786 | 6.82 |
ENST00000300632.5
|
IGF2
|
insulin-like growth factor 2 (somatomedin A) |
| chr19_+_45418067 | 6.77 |
ENST00000589078.1
ENST00000586638.1 |
APOC1
|
apolipoprotein C-I |
| chr4_+_156588806 | 6.70 |
ENST00000513574.1
|
GUCY1A3
|
guanylate cyclase 1, soluble, alpha 3 |
| chr3_+_148457585 | 6.69 |
ENST00000402260.1
|
AGTR1
|
angiotensin II receptor, type 1 |
| chrX_+_152224766 | 6.64 |
ENST00000370265.4
ENST00000447306.1 |
PNMA3
|
paraneoplastic Ma antigen 3 |
| chr19_+_859425 | 6.57 |
ENST00000327726.6
|
CFD
|
complement factor D (adipsin) |
| chr12_+_53443963 | 6.54 |
ENST00000546602.1
ENST00000552570.1 ENST00000549700.1 |
TENC1
|
tensin like C1 domain containing phosphatase (tensin 2) |
| chrX_+_68048803 | 6.51 |
ENST00000204961.4
|
EFNB1
|
ephrin-B1 |
| chr17_-_18218270 | 6.51 |
ENST00000321105.5
|
TOP3A
|
topoisomerase (DNA) III alpha |
| chr22_-_18923655 | 6.47 |
ENST00000438924.1
ENST00000457083.1 ENST00000420436.1 ENST00000334029.2 ENST00000357068.6 |
PRODH
|
proline dehydrogenase (oxidase) 1 |
| chr8_+_21915368 | 6.46 |
ENST00000265800.5
ENST00000517418.1 |
DMTN
|
dematin actin binding protein |
| chr19_+_45417504 | 6.44 |
ENST00000588750.1
ENST00000588802.1 |
APOC1
|
apolipoprotein C-I |
| chr13_+_96204961 | 6.43 |
ENST00000299339.2
|
CLDN10
|
claudin 10 |
| chr2_-_24583314 | 6.42 |
ENST00000443927.1
ENST00000406921.3 ENST00000412011.1 |
ITSN2
|
intersectin 2 |
| chr4_+_156588350 | 6.40 |
ENST00000296518.7
|
GUCY1A3
|
guanylate cyclase 1, soluble, alpha 3 |
| chr3_+_169490606 | 6.35 |
ENST00000349841.5
|
MYNN
|
myoneurin |
| chr11_-_66084508 | 6.34 |
ENST00000311330.3
|
CD248
|
CD248 molecule, endosialin |
| chr2_+_105471969 | 6.33 |
ENST00000361360.2
|
POU3F3
|
POU class 3 homeobox 3 |
| chr22_+_30792980 | 6.28 |
ENST00000403484.1
ENST00000405717.3 ENST00000402592.3 |
SEC14L2
|
SEC14-like 2 (S. cerevisiae) |
| chr16_-_20364122 | 6.23 |
ENST00000396138.4
ENST00000577168.1 |
UMOD
|
uromodulin |
| chr16_+_84328429 | 6.15 |
ENST00000568638.1
|
WFDC1
|
WAP four-disulfide core domain 1 |
| chr3_-_50340996 | 6.15 |
ENST00000266031.4
ENST00000395143.2 ENST00000457214.2 ENST00000447605.2 ENST00000418723.1 ENST00000395144.2 |
HYAL1
|
hyaluronoglucosaminidase 1 |
| chrX_+_153237740 | 6.12 |
ENST00000369982.4
|
TMEM187
|
transmembrane protein 187 |
| chr3_+_37284824 | 6.10 |
ENST00000431105.1
|
GOLGA4
|
golgin A4 |
| chr17_-_79818354 | 6.09 |
ENST00000576541.1
ENST00000576380.1 ENST00000571617.1 ENST00000576052.1 ENST00000576390.1 ENST00000573778.2 ENST00000439918.2 ENST00000574914.1 ENST00000331483.4 |
P4HB
|
prolyl 4-hydroxylase, beta polypeptide |
| chr17_-_26694979 | 6.08 |
ENST00000438614.1
|
VTN
|
vitronectin |
| chr12_+_53443680 | 6.06 |
ENST00000314250.6
ENST00000451358.1 |
TENC1
|
tensin like C1 domain containing phosphatase (tensin 2) |
| chr16_-_55867146 | 6.05 |
ENST00000422046.2
|
CES1
|
carboxylesterase 1 |
| chr6_-_62996066 | 5.96 |
ENST00000281156.4
|
KHDRBS2
|
KH domain containing, RNA binding, signal transduction associated 2 |
| chr8_-_27457494 | 5.93 |
ENST00000521770.1
|
CLU
|
clusterin |
| chr17_-_26695013 | 5.92 |
ENST00000555059.2
|
CTB-96E2.2
|
Homeobox protein SEBOX |
| chr3_-_127541194 | 5.92 |
ENST00000453507.2
|
MGLL
|
monoglyceride lipase |
| chr4_-_186733363 | 5.91 |
ENST00000393523.2
ENST00000393528.3 ENST00000449407.2 |
SORBS2
|
sorbin and SH3 domain containing 2 |
| chr18_+_29171689 | 5.90 |
ENST00000237014.3
|
TTR
|
transthyretin |
| chr16_+_81812863 | 5.86 |
ENST00000359376.3
|
PLCG2
|
phospholipase C, gamma 2 (phosphatidylinositol-specific) |
| chr1_+_32671236 | 5.82 |
ENST00000537469.1
ENST00000291358.6 |
IQCC
|
IQ motif containing C |
| chr3_+_10857885 | 5.82 |
ENST00000254488.2
ENST00000454147.1 |
SLC6A11
|
solute carrier family 6 (neurotransmitter transporter), member 11 |
| chr16_+_84328252 | 5.81 |
ENST00000219454.5
|
WFDC1
|
WAP four-disulfide core domain 1 |
| chrX_+_43515467 | 5.78 |
ENST00000338702.3
ENST00000542639.1 |
MAOA
|
monoamine oxidase A |
| chr17_+_73717551 | 5.77 |
ENST00000450894.3
|
ITGB4
|
integrin, beta 4 |
| chr9_-_137809718 | 5.76 |
ENST00000371806.3
|
FCN1
|
ficolin (collagen/fibrinogen domain containing) 1 |
| chr19_+_17982747 | 5.74 |
ENST00000222248.3
|
SLC5A5
|
solute carrier family 5 (sodium/iodide cotransporter), member 5 |
| chr17_+_73717407 | 5.73 |
ENST00000579662.1
|
ITGB4
|
integrin, beta 4 |
| chr12_-_117537240 | 5.71 |
ENST00000392545.4
ENST00000541210.1 ENST00000335209.7 |
TESC
|
tescalcin |
| chr17_+_7461781 | 5.71 |
ENST00000349228.4
|
TNFSF13
|
tumor necrosis factor (ligand) superfamily, member 13 |
| chr11_-_64885111 | 5.70 |
ENST00000528598.1
ENST00000310597.4 |
ZNHIT2
|
zinc finger, HIT-type containing 2 |
| chr17_-_18585541 | 5.69 |
ENST00000285274.5
ENST00000545289.1 ENST00000580145.1 |
ZNF286B
|
zinc finger protein 286B |
| chr6_+_31555045 | 5.67 |
ENST00000396101.3
ENST00000490742.1 |
LST1
|
leukocyte specific transcript 1 |
| chr8_-_11710979 | 5.66 |
ENST00000415599.2
|
CTSB
|
cathepsin B |
| chr6_+_31554456 | 5.61 |
ENST00000339530.4
|
LST1
|
leukocyte specific transcript 1 |
| chr19_+_45582453 | 5.57 |
ENST00000591607.1
ENST00000591747.1 ENST00000270257.4 ENST00000391951.2 ENST00000587566.1 |
GEMIN7
MARK4
|
gem (nuclear organelle) associated protein 7 MAP/microtubule affinity-regulating kinase 4 |
| chr9_-_33264676 | 5.52 |
ENST00000472232.3
ENST00000379704.2 |
BAG1
|
BCL2-associated athanogene |
| chr3_+_49027308 | 5.50 |
ENST00000383729.4
ENST00000343546.4 |
P4HTM
|
prolyl 4-hydroxylase, transmembrane (endoplasmic reticulum) |
| chr16_-_20364030 | 5.50 |
ENST00000396134.2
ENST00000573567.1 ENST00000570757.1 ENST00000424589.1 ENST00000302509.4 ENST00000571174.1 ENST00000576688.1 |
UMOD
|
uromodulin |
| chr10_+_99258625 | 5.49 |
ENST00000370664.3
|
UBTD1
|
ubiquitin domain containing 1 |
| chr5_-_115872142 | 5.48 |
ENST00000510263.1
|
SEMA6A
|
sema domain, transmembrane domain (TM), and cytoplasmic domain, (semaphorin) 6A |
| chr17_-_26903900 | 5.48 |
ENST00000395319.3
ENST00000581807.1 ENST00000584086.1 ENST00000395321.2 |
ALDOC
|
aldolase C, fructose-bisphosphate |
| chr7_-_37488834 | 5.47 |
ENST00000310758.4
|
ELMO1
|
engulfment and cell motility 1 |
| chr19_+_17326521 | 5.46 |
ENST00000593597.1
|
USE1
|
unconventional SNARE in the ER 1 homolog (S. cerevisiae) |
| chr3_+_183903811 | 5.46 |
ENST00000429586.2
ENST00000292808.5 |
ABCF3
|
ATP-binding cassette, sub-family F (GCN20), member 3 |
| chr17_-_42277203 | 5.45 |
ENST00000587097.1
|
ATXN7L3
|
ataxin 7-like 3 |
| chr19_+_7069690 | 5.43 |
ENST00000439035.2
|
ZNF557
|
zinc finger protein 557 |
| chr13_-_37494365 | 5.42 |
ENST00000350148.5
|
SMAD9
|
SMAD family member 9 |
| chr5_-_134914673 | 5.41 |
ENST00000512158.1
|
CXCL14
|
chemokine (C-X-C motif) ligand 14 |
| chr8_-_90769422 | 5.41 |
ENST00000524190.1
ENST00000523859.1 |
RP11-37B2.1
|
RP11-37B2.1 |
| chr20_+_30640004 | 5.40 |
ENST00000520553.1
ENST00000518730.1 ENST00000375852.2 |
HCK
|
hemopoietic cell kinase |
| chr17_+_7210852 | 5.27 |
ENST00000576930.1
|
EIF5A
|
eukaryotic translation initiation factor 5A |
| chr17_-_79269067 | 5.25 |
ENST00000288439.5
ENST00000374759.3 |
SLC38A10
|
solute carrier family 38, member 10 |
| chrX_-_38186811 | 5.24 |
ENST00000318842.7
|
RPGR
|
retinitis pigmentosa GTPase regulator |
| chr8_-_27472198 | 5.23 |
ENST00000519472.1
ENST00000523589.1 ENST00000522413.1 ENST00000523396.1 ENST00000560366.1 |
CLU
|
clusterin |
| chr17_-_17875688 | 5.23 |
ENST00000379504.3
ENST00000318094.10 ENST00000540946.1 ENST00000542206.1 ENST00000395739.4 ENST00000581396.1 ENST00000535933.1 ENST00000579586.1 |
TOM1L2
|
target of myb1-like 2 (chicken) |
| chr3_-_52479043 | 5.22 |
ENST00000231721.2
ENST00000475739.1 |
SEMA3G
|
sema domain, immunoglobulin domain (Ig), short basic domain, secreted, (semaphorin) 3G |
| chr10_-_98273668 | 5.19 |
ENST00000357947.3
|
TLL2
|
tolloid-like 2 |
| chr1_+_156698708 | 5.19 |
ENST00000519086.1
|
RRNAD1
|
ribosomal RNA adenine dimethylase domain containing 1 |
| chr6_-_39902185 | 5.18 |
ENST00000373195.3
ENST00000308559.7 ENST00000373188.2 |
MOCS1
|
molybdenum cofactor synthesis 1 |
| chr3_+_46921732 | 5.18 |
ENST00000418619.1
|
PTH1R
|
parathyroid hormone 1 receptor |
| chrX_-_106960285 | 5.16 |
ENST00000503515.1
ENST00000372397.2 |
TSC22D3
|
TSC22 domain family, member 3 |
| chr13_-_37494391 | 5.15 |
ENST00000379826.4
|
SMAD9
|
SMAD family member 9 |
| chr1_+_220960033 | 5.12 |
ENST00000366910.5
|
MARC1
|
mitochondrial amidoxime reducing component 1 |
| chr4_-_121843985 | 5.11 |
ENST00000264808.3
ENST00000428209.2 ENST00000515109.1 ENST00000394435.2 |
PRDM5
|
PR domain containing 5 |
| chr11_+_116700614 | 5.09 |
ENST00000375345.1
|
APOC3
|
apolipoprotein C-III |
| chr2_-_73869508 | 5.07 |
ENST00000272425.3
|
NAT8
|
N-acetyltransferase 8 (GCN5-related, putative) |
| chr14_-_88459182 | 5.04 |
ENST00000544807.2
|
GALC
|
galactosylceramidase |
| chr11_+_116700600 | 5.00 |
ENST00000227667.3
|
APOC3
|
apolipoprotein C-III |
| chr19_+_859654 | 4.98 |
ENST00000592860.1
|
CFD
|
complement factor D (adipsin) |
| chr19_+_18794470 | 4.96 |
ENST00000321949.8
ENST00000338797.6 |
CRTC1
|
CREB regulated transcription coactivator 1 |
| chr16_-_75241050 | 4.95 |
ENST00000303037.8
|
CTRB2
|
chymotrypsinogen B2 |
| chr6_+_31554962 | 4.94 |
ENST00000376092.3
ENST00000376086.3 ENST00000303757.8 ENST00000376093.2 ENST00000376102.3 |
LST1
|
leukocyte specific transcript 1 |
| chr13_-_45150392 | 4.94 |
ENST00000501704.2
|
TSC22D1
|
TSC22 domain family, member 1 |
| chr10_-_90712520 | 4.91 |
ENST00000224784.6
|
ACTA2
|
actin, alpha 2, smooth muscle, aorta |
| chr10_-_70092671 | 4.90 |
ENST00000358769.2
ENST00000432941.1 ENST00000495025.2 |
PBLD
|
phenazine biosynthesis-like protein domain containing |
| chr1_+_205473720 | 4.89 |
ENST00000429964.2
ENST00000506784.1 ENST00000360066.2 |
CDK18
|
cyclin-dependent kinase 18 |
| chr22_+_41865109 | 4.89 |
ENST00000216254.4
ENST00000396512.3 |
ACO2
|
aconitase 2, mitochondrial |
| chr17_-_8021710 | 4.88 |
ENST00000380149.1
ENST00000448843.2 |
ALOXE3
|
arachidonate lipoxygenase 3 |
| chr17_-_64216748 | 4.86 |
ENST00000585162.1
|
APOH
|
apolipoprotein H (beta-2-glycoprotein I) |
| chr1_-_237167718 | 4.85 |
ENST00000464121.2
|
MT1HL1
|
metallothionein 1H-like 1 |
| chr8_+_9046503 | 4.85 |
ENST00000512942.2
|
RP11-10A14.5
|
RP11-10A14.5 |
| chr7_-_5553369 | 4.82 |
ENST00000453700.3
ENST00000382368.3 |
FBXL18
|
F-box and leucine-rich repeat protein 18 |
| chr12_+_53440753 | 4.82 |
ENST00000379902.3
|
TENC1
|
tensin like C1 domain containing phosphatase (tensin 2) |
| chr11_+_61717535 | 4.80 |
ENST00000534553.1
ENST00000301774.9 |
BEST1
|
bestrophin 1 |
| chr22_+_38453207 | 4.80 |
ENST00000404072.3
ENST00000424694.1 |
PICK1
|
protein interacting with PRKCA 1 |
| chr17_-_617949 | 4.79 |
ENST00000401468.3
ENST00000574029.1 ENST00000291074.5 ENST00000571805.1 ENST00000437048.2 ENST00000446250.2 |
VPS53
|
vacuolar protein sorting 53 homolog (S. cerevisiae) |
| chr14_+_24583836 | 4.79 |
ENST00000559115.1
ENST00000558215.1 ENST00000557810.1 ENST00000561375.1 ENST00000446197.3 ENST00000559796.1 ENST00000560713.1 ENST00000560901.1 ENST00000559382.1 |
DCAF11
|
DDB1 and CUL4 associated factor 11 |
| chr1_+_32042131 | 4.76 |
ENST00000271064.7
ENST00000537531.1 |
TINAGL1
|
tubulointerstitial nephritis antigen-like 1 |
| chr17_-_2614927 | 4.76 |
ENST00000435359.1
|
CLUH
|
clustered mitochondria (cluA/CLU1) homolog |
| chr6_-_150039249 | 4.75 |
ENST00000543571.1
|
LATS1
|
large tumor suppressor kinase 1 |
| chr6_+_41040678 | 4.75 |
ENST00000341376.6
ENST00000353205.5 |
NFYA
|
nuclear transcription factor Y, alpha |
| chr6_+_80816372 | 4.71 |
ENST00000545529.1
|
BCKDHB
|
branched chain keto acid dehydrogenase E1, beta polypeptide |
| chrX_-_131623982 | 4.68 |
ENST00000370844.1
|
MBNL3
|
muscleblind-like splicing regulator 3 |
| chr4_+_668348 | 4.67 |
ENST00000511290.1
|
MYL5
|
myosin, light chain 5, regulatory |
| chr1_-_17445930 | 4.66 |
ENST00000375486.4
ENST00000375481.1 ENST00000444885.2 |
PADI2
|
peptidyl arginine deiminase, type II |
| chr20_+_54967409 | 4.65 |
ENST00000415828.1
ENST00000217109.4 ENST00000428552.1 |
CSTF1
|
cleavage stimulation factor, 3' pre-RNA, subunit 1, 50kDa |
| chr19_+_35629702 | 4.64 |
ENST00000351325.4
|
FXYD1
|
FXYD domain containing ion transport regulator 1 |
| chr6_+_43739697 | 4.62 |
ENST00000230480.6
|
VEGFA
|
vascular endothelial growth factor A |
| chr8_+_21911054 | 4.60 |
ENST00000519850.1
ENST00000381470.3 |
DMTN
|
dematin actin binding protein |
| chr1_+_160085501 | 4.59 |
ENST00000361216.3
|
ATP1A2
|
ATPase, Na+/K+ transporting, alpha 2 polypeptide |
| chr15_+_92397051 | 4.59 |
ENST00000424469.2
|
SLCO3A1
|
solute carrier organic anion transporter family, member 3A1 |
| chr19_-_40919271 | 4.59 |
ENST00000291825.7
ENST00000324001.7 |
PRX
|
periaxin |
| chr15_-_35047166 | 4.59 |
ENST00000290374.4
|
GJD2
|
gap junction protein, delta 2, 36kDa |
| chr1_+_47603109 | 4.58 |
ENST00000371890.3
ENST00000294337.3 ENST00000371891.3 |
CYP4A22
|
cytochrome P450, family 4, subfamily A, polypeptide 22 |
| chr16_+_84853580 | 4.57 |
ENST00000262424.5
ENST00000566151.1 ENST00000567845.1 ENST00000564567.1 ENST00000569090.1 |
CRISPLD2
|
cysteine-rich secretory protein LCCL domain containing 2 |
| chr6_-_31763408 | 4.55 |
ENST00000444930.2
|
VARS
|
valyl-tRNA synthetase |
| chr11_+_1891380 | 4.55 |
ENST00000429923.1
ENST00000418975.1 ENST00000406638.2 |
LSP1
|
lymphocyte-specific protein 1 |
| chr22_-_51021397 | 4.55 |
ENST00000406938.2
|
CHKB
|
choline kinase beta |
| chr1_-_151345159 | 4.55 |
ENST00000458566.1
ENST00000447402.3 ENST00000426705.2 ENST00000435071.1 ENST00000368868.5 |
SELENBP1
|
selenium binding protein 1 |
| chr2_+_90248739 | 4.54 |
ENST00000468879.1
|
IGKV1D-43
|
immunoglobulin kappa variable 1D-43 |
| chr12_+_50355647 | 4.54 |
ENST00000293599.6
|
AQP5
|
aquaporin 5 |
| chr3_+_32147997 | 4.53 |
ENST00000282541.5
|
GPD1L
|
glycerol-3-phosphate dehydrogenase 1-like |
| chr11_+_64323428 | 4.49 |
ENST00000377581.3
|
SLC22A11
|
solute carrier family 22 (organic anion/urate transporter), member 11 |
| chr1_+_27719148 | 4.46 |
ENST00000374024.3
|
GPR3
|
G protein-coupled receptor 3 |
| chr16_-_55866997 | 4.46 |
ENST00000360526.3
ENST00000361503.4 |
CES1
|
carboxylesterase 1 |
| chr12_-_56101647 | 4.45 |
ENST00000347027.6
ENST00000257879.6 ENST00000257880.7 ENST00000394230.2 ENST00000394229.2 |
ITGA7
|
integrin, alpha 7 |
| chr19_-_13617037 | 4.45 |
ENST00000360228.5
|
CACNA1A
|
calcium channel, voltage-dependent, P/Q type, alpha 1A subunit |
| chr6_-_39902160 | 4.44 |
ENST00000340692.5
|
MOCS1
|
molybdenum cofactor synthesis 1 |
| chr11_-_119599794 | 4.44 |
ENST00000264025.3
|
PVRL1
|
poliovirus receptor-related 1 (herpesvirus entry mediator C) |
| chr6_+_31554636 | 4.43 |
ENST00000433492.1
|
LST1
|
leukocyte specific transcript 1 |
| chr7_-_27183263 | 4.39 |
ENST00000222726.3
|
HOXA5
|
homeobox A5 |
| chr19_-_50316517 | 4.38 |
ENST00000313777.4
ENST00000445575.2 |
FUZ
|
fuzzy planar cell polarity protein |
| chr16_+_30386098 | 4.36 |
ENST00000322861.7
|
MYLPF
|
myosin light chain, phosphorylatable, fast skeletal muscle |
| chr10_-_120514720 | 4.35 |
ENST00000369151.3
ENST00000340214.4 |
CACUL1
|
CDK2-associated, cullin domain 1 |
| chrX_-_131623874 | 4.35 |
ENST00000436215.1
|
MBNL3
|
muscleblind-like splicing regulator 3 |
| chr10_+_114135952 | 4.35 |
ENST00000356116.1
ENST00000433418.1 ENST00000354273.4 |
ACSL5
|
acyl-CoA synthetase long-chain family member 5 |
| chr16_-_31439735 | 4.34 |
ENST00000287490.4
|
COX6A2
|
cytochrome c oxidase subunit VIa polypeptide 2 |
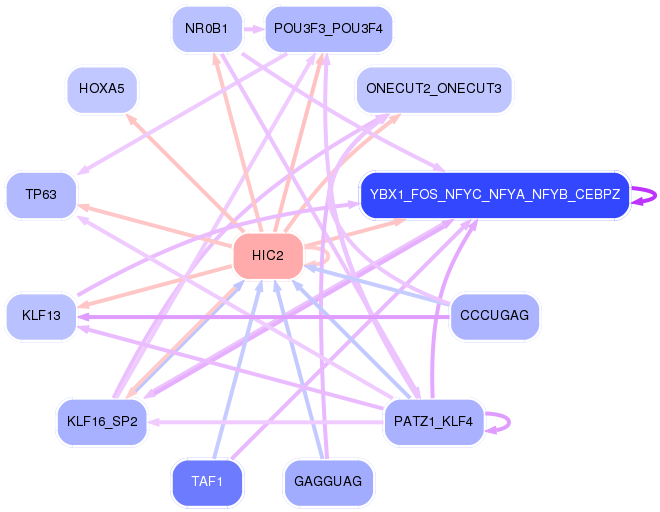
Network of associatons between targets according to the STRING database.

First level regulatory network of HIC2
Gene Ontology Analysis
Gene overrepresentation in biological_process category:
| Log-likelihood per target | Total log-likelihood | Term | Description |
|---|---|---|---|
| 7.1 | 28.3 | GO:0030185 | nitric oxide transport(GO:0030185) |
| 5.9 | 29.6 | GO:0044858 | plasma membrane raft distribution(GO:0044855) plasma membrane raft localization(GO:0044856) plasma membrane raft polarization(GO:0044858) regulation of plasma membrane raft polarization(GO:1903906) |
| 3.6 | 18.1 | GO:0072233 | thick ascending limb development(GO:0072023) metanephric thick ascending limb development(GO:0072233) |
| 3.5 | 13.9 | GO:1903984 | positive regulation of TRAIL-activated apoptotic signaling pathway(GO:1903984) |
| 3.4 | 10.3 | GO:1900106 | hyaluranon cable assembly(GO:0036118) regulation of hyaluranon cable assembly(GO:1900104) positive regulation of hyaluranon cable assembly(GO:1900106) |
| 3.4 | 10.1 | GO:0060621 | regulation of cholesterol import(GO:0060620) negative regulation of cholesterol import(GO:0060621) regulation of sterol import(GO:2000909) negative regulation of sterol import(GO:2000910) |
| 3.3 | 13.2 | GO:0010900 | negative regulation of phosphatidylcholine catabolic process(GO:0010900) |
| 3.2 | 19.4 | GO:0052551 | response to defense-related nitric oxide production by other organism involved in symbiotic interaction(GO:0052551) response to defense-related host nitric oxide production(GO:0052565) |
| 3.1 | 9.4 | GO:1902530 | regulation of protein linear polyubiquitination(GO:1902528) positive regulation of protein linear polyubiquitination(GO:1902530) |
| 3.1 | 28.0 | GO:0038028 | insulin receptor signaling pathway via phosphatidylinositol 3-kinase(GO:0038028) |
| 3.1 | 12.4 | GO:2000314 | fibroblast growth factor receptor signaling pathway involved in neural plate anterior/posterior pattern formation(GO:0060825) regulation of neural crest formation(GO:0090299) negative regulation of neural crest formation(GO:0090301) regulation of fibroblast growth factor receptor signaling pathway involved in neural plate anterior/posterior pattern formation(GO:2000313) negative regulation of fibroblast growth factor receptor signaling pathway involved in neural plate anterior/posterior pattern formation(GO:2000314) |
| 2.9 | 8.7 | GO:0014057 | positive regulation of acetylcholine secretion, neurotransmission(GO:0014057) |
| 2.8 | 13.9 | GO:0009440 | cyanate metabolic process(GO:0009439) cyanate catabolic process(GO:0009440) |
| 2.7 | 11.0 | GO:0086097 | phospholipase C-activating angiotensin-activated signaling pathway(GO:0086097) |
| 2.6 | 7.9 | GO:0021966 | corticospinal neuron axon guidance(GO:0021966) |
| 2.5 | 2.5 | GO:0098742 | cell-cell adhesion via plasma-membrane adhesion molecules(GO:0098742) |
| 2.5 | 14.9 | GO:0070560 | protein secretion by platelet(GO:0070560) |
| 2.4 | 4.7 | GO:1902567 | negative regulation of eosinophil activation(GO:1902567) |
| 2.4 | 9.4 | GO:0071279 | cellular response to cobalt ion(GO:0071279) |
| 2.3 | 6.9 | GO:2000439 | positive regulation of monocyte extravasation(GO:2000439) |
| 2.3 | 6.9 | GO:0032237 | activation of store-operated calcium channel activity(GO:0032237) positive regulation of store-operated calcium channel activity(GO:1901341) |
| 2.2 | 8.8 | GO:0006072 | glycerol-3-phosphate metabolic process(GO:0006072) |
| 2.2 | 2.2 | GO:0032713 | negative regulation of interleukin-4 production(GO:0032713) |
| 2.2 | 10.9 | GO:0048807 | female genitalia morphogenesis(GO:0048807) |
| 2.1 | 27.7 | GO:0030321 | transepithelial chloride transport(GO:0030321) |
| 2.1 | 6.3 | GO:0010902 | positive regulation of very-low-density lipoprotein particle remodeling(GO:0010902) |
| 2.1 | 8.4 | GO:0060392 | negative regulation of SMAD protein import into nucleus(GO:0060392) |
| 2.1 | 10.4 | GO:0036414 | protein citrullination(GO:0018101) histone citrullination(GO:0036414) |
| 2.1 | 2.1 | GO:1905154 | negative regulation of membrane invagination(GO:1905154) |
| 2.0 | 14.2 | GO:0032119 | sequestering of zinc ion(GO:0032119) |
| 2.0 | 6.1 | GO:1903401 | L-lysine transmembrane transport(GO:1903401) |
| 2.0 | 4.0 | GO:0036215 | response to stem cell factor(GO:0036215) cellular response to stem cell factor stimulus(GO:0036216) Kit signaling pathway(GO:0038109) |
| 2.0 | 7.9 | GO:0071231 | cellular response to folic acid(GO:0071231) |
| 2.0 | 5.9 | GO:0071883 | activation of MAPK activity by adrenergic receptor signaling pathway(GO:0071883) |
| 2.0 | 5.9 | GO:1900169 | regulation of glucocorticoid mediated signaling pathway(GO:1900169) |
| 1.9 | 5.8 | GO:1901899 | positive regulation of relaxation of cardiac muscle(GO:1901899) regulation of calcium ion import into sarcoplasmic reticulum(GO:1902080) negative regulation of calcium ion import into sarcoplasmic reticulum(GO:1902081) |
| 1.9 | 13.6 | GO:2000503 | positive regulation of natural killer cell chemotaxis(GO:2000503) |
| 1.9 | 7.7 | GO:0001970 | positive regulation of activation of membrane attack complex(GO:0001970) |
| 1.9 | 9.5 | GO:0099538 | synaptic signaling via neuropeptide(GO:0099538) trans-synaptic signaling by neuropeptide(GO:0099540) trans-synaptic signaling by neuropeptide, modulating synaptic transmission(GO:0099551) |
| 1.9 | 9.5 | GO:1990169 | detoxification of copper ion(GO:0010273) stress response to copper ion(GO:1990169) |
| 1.9 | 11.2 | GO:0061517 | macrophage proliferation(GO:0061517) microglial cell proliferation(GO:0061518) regulation of neuronal signal transduction(GO:1902847) positive regulation of neurofibrillary tangle assembly(GO:1902998) |
| 1.8 | 18.5 | GO:0060267 | positive regulation of respiratory burst(GO:0060267) |
| 1.8 | 5.4 | GO:0002522 | leukocyte migration involved in immune response(GO:0002522) |
| 1.8 | 1.8 | GO:0035359 | negative regulation of peroxisome proliferator activated receptor signaling pathway(GO:0035359) |
| 1.8 | 5.3 | GO:0034146 | toll-like receptor 5 signaling pathway(GO:0034146) |
| 1.8 | 8.8 | GO:0060718 | chorionic trophoblast cell differentiation(GO:0060718) |
| 1.7 | 11.8 | GO:0042126 | nitrate metabolic process(GO:0042126) |
| 1.7 | 5.0 | GO:0038193 | thromboxane A2 signaling pathway(GO:0038193) |
| 1.7 | 8.4 | GO:2001106 | regulation of Rho guanyl-nucleotide exchange factor activity(GO:2001106) |
| 1.7 | 1.7 | GO:0090212 | regulation of establishment of blood-brain barrier(GO:0090210) negative regulation of establishment of blood-brain barrier(GO:0090212) |
| 1.7 | 5.0 | GO:1902630 | regulation of membrane hyperpolarization(GO:1902630) |
| 1.7 | 6.6 | GO:0046671 | negative regulation of cellular pH reduction(GO:0032848) CD8-positive, alpha-beta T cell lineage commitment(GO:0043375) negative regulation of retinal cell programmed cell death(GO:0046671) |
| 1.6 | 6.5 | GO:0019470 | 4-hydroxyproline catabolic process(GO:0019470) |
| 1.6 | 8.1 | GO:0071918 | urea transmembrane transport(GO:0071918) |
| 1.6 | 7.9 | GO:0030035 | microspike assembly(GO:0030035) |
| 1.6 | 7.8 | GO:0090258 | negative regulation of mitochondrial fission(GO:0090258) |
| 1.5 | 3.1 | GO:0039703 | viral RNA genome replication(GO:0039694) RNA replication(GO:0039703) |
| 1.5 | 4.6 | GO:1903570 | regulation of protein kinase D signaling(GO:1903570) positive regulation of protein kinase D signaling(GO:1903572) |
| 1.5 | 4.6 | GO:0017186 | peptidyl-pyroglutamic acid biosynthetic process, using glutaminyl-peptide cyclotransferase(GO:0017186) |
| 1.5 | 4.6 | GO:0006438 | valyl-tRNA aminoacylation(GO:0006438) |
| 1.5 | 4.5 | GO:0015670 | carbon dioxide transport(GO:0015670) |
| 1.5 | 7.6 | GO:0021759 | globus pallidus development(GO:0021759) |
| 1.5 | 7.4 | GO:0006543 | glutamine catabolic process(GO:0006543) |
| 1.5 | 5.9 | GO:0042412 | taurine biosynthetic process(GO:0042412) |
| 1.5 | 4.4 | GO:0060535 | trachea cartilage morphogenesis(GO:0060535) |
| 1.5 | 2.9 | GO:0008380 | RNA splicing(GO:0008380) |
| 1.4 | 5.7 | GO:0035624 | receptor transactivation(GO:0035624) |
| 1.4 | 7.1 | GO:0030382 | sperm mitochondrion organization(GO:0030382) |
| 1.4 | 7.0 | GO:0070829 | response to vitamin B2(GO:0033274) heterochromatin maintenance(GO:0070829) |
| 1.4 | 4.1 | GO:0006434 | seryl-tRNA aminoacylation(GO:0006434) selenocysteinyl-tRNA(Sec) biosynthetic process(GO:0097056) |
| 1.4 | 9.5 | GO:2000124 | regulation of endocannabinoid signaling pathway(GO:2000124) |
| 1.4 | 4.1 | GO:0002752 | cell surface pattern recognition receptor signaling pathway(GO:0002752) |
| 1.4 | 4.1 | GO:0015793 | glycerol transport(GO:0015793) |
| 1.3 | 4.0 | GO:1904430 | negative regulation of t-circle formation(GO:1904430) |
| 1.3 | 2.7 | GO:0060681 | branch elongation involved in ureteric bud branching(GO:0060681) |
| 1.3 | 8.0 | GO:0051121 | hepoxilin metabolic process(GO:0051121) hepoxilin biosynthetic process(GO:0051122) |
| 1.3 | 5.3 | GO:0070120 | ciliary neurotrophic factor-mediated signaling pathway(GO:0070120) |
| 1.3 | 1.3 | GO:0046668 | regulation of retinal cell programmed cell death(GO:0046668) |
| 1.3 | 1.3 | GO:0006789 | bilirubin conjugation(GO:0006789) |
| 1.3 | 5.2 | GO:0048631 | regulation of skeletal muscle tissue growth(GO:0048631) |
| 1.3 | 10.4 | GO:0034587 | piRNA metabolic process(GO:0034587) |
| 1.3 | 5.2 | GO:0003095 | pressure natriuresis(GO:0003095) |
| 1.2 | 3.7 | GO:0051771 | negative regulation of nitric-oxide synthase biosynthetic process(GO:0051771) |
| 1.2 | 3.7 | GO:0018199 | isopeptide cross-linking via N6-(L-isoglutamyl)-L-lysine(GO:0018153) peptidyl-glutamine modification(GO:0018199) isopeptide cross-linking(GO:0018262) |
| 1.2 | 3.6 | GO:0007538 | primary sex determination(GO:0007538) |
| 1.2 | 3.6 | GO:0051725 | protein de-ADP-ribosylation(GO:0051725) |
| 1.2 | 3.6 | GO:0019557 | histidine catabolic process to glutamate and formamide(GO:0019556) histidine catabolic process to glutamate and formate(GO:0019557) formamide metabolic process(GO:0043606) |
| 1.2 | 9.6 | GO:0019720 | Mo-molybdopterin cofactor biosynthetic process(GO:0006777) Mo-molybdopterin cofactor metabolic process(GO:0019720) |
| 1.2 | 8.3 | GO:0010269 | response to selenium ion(GO:0010269) |
| 1.2 | 7.0 | GO:0002803 | positive regulation of antimicrobial peptide production(GO:0002225) positive regulation of antimicrobial humoral response(GO:0002760) positive regulation of antibacterial peptide production(GO:0002803) |
| 1.1 | 3.4 | GO:1900075 | regulation of neuromuscular synaptic transmission(GO:1900073) positive regulation of neuromuscular synaptic transmission(GO:1900075) |
| 1.1 | 3.4 | GO:2001168 | regulation of histone H2B ubiquitination(GO:2001166) positive regulation of histone H2B ubiquitination(GO:2001168) |
| 1.1 | 5.7 | GO:0019532 | oxalate transport(GO:0019532) |
| 1.1 | 3.4 | GO:0038096 | immune response-regulating cell surface receptor signaling pathway involved in phagocytosis(GO:0002433) Fc-gamma receptor signaling pathway involved in phagocytosis(GO:0038096) |
| 1.1 | 3.4 | GO:0010760 | negative regulation of macrophage chemotaxis(GO:0010760) |
| 1.1 | 2.2 | GO:0002537 | nitric oxide production involved in inflammatory response(GO:0002537) |
| 1.1 | 3.3 | GO:2001245 | regulation of phosphatidylcholine biosynthetic process(GO:2001245) |
| 1.1 | 6.6 | GO:0022614 | membrane to membrane docking(GO:0022614) |
| 1.1 | 1.1 | GO:0048668 | collateral sprouting(GO:0048668) regulation of collateral sprouting(GO:0048670) positive regulation of collateral sprouting(GO:0048672) |
| 1.1 | 9.8 | GO:0015705 | iodide transport(GO:0015705) |
| 1.1 | 3.3 | GO:0060940 | epithelial to mesenchymal transition involved in cardiac fibroblast development(GO:0060940) |
| 1.1 | 7.5 | GO:0002933 | lipid hydroxylation(GO:0002933) |
| 1.1 | 3.2 | GO:0090403 | oxidative stress-induced premature senescence(GO:0090403) |
| 1.1 | 11.7 | GO:2000427 | positive regulation of apoptotic cell clearance(GO:2000427) |
| 1.1 | 5.3 | GO:0045168 | cell-cell signaling involved in cell fate commitment(GO:0045168) |
| 1.1 | 2.1 | GO:0050968 | detection of chemical stimulus involved in sensory perception of pain(GO:0050968) |
| 1.0 | 2.1 | GO:1904886 | beta-catenin destruction complex disassembly(GO:1904886) |
| 1.0 | 3.1 | GO:0002071 | glandular epithelial cell maturation(GO:0002071) regulation of transcription from RNA polymerase II promoter involved in ventral spinal cord interneuron specification(GO:0021913) type B pancreatic cell maturation(GO:0072560) |
| 1.0 | 1.0 | GO:0018894 | dibenzo-p-dioxin metabolic process(GO:0018894) |
| 1.0 | 4.0 | GO:0014827 | intestine smooth muscle contraction(GO:0014827) |
| 1.0 | 19.1 | GO:0071850 | mitotic cell cycle arrest(GO:0071850) |
| 1.0 | 77.5 | GO:0006953 | acute-phase response(GO:0006953) |
| 1.0 | 5.9 | GO:0072716 | response to actinomycin D(GO:0072716) |
| 1.0 | 11.9 | GO:0048298 | positive regulation of isotype switching to IgA isotypes(GO:0048298) |
| 1.0 | 1.0 | GO:0099545 | trans-synaptic signaling by trans-synaptic complex(GO:0099545) |
| 1.0 | 1.9 | GO:0006883 | cellular sodium ion homeostasis(GO:0006883) |
| 1.0 | 10.6 | GO:0015865 | purine nucleotide transport(GO:0015865) purine ribonucleotide transport(GO:0015868) |
| 1.0 | 2.9 | GO:2000564 | regulation of MyD88-dependent toll-like receptor signaling pathway(GO:0034124) CD8-positive, alpha-beta T cell proliferation(GO:0035740) regulation of CD8-positive, alpha-beta T cell proliferation(GO:2000564) |
| 0.9 | 4.7 | GO:0001826 | inner cell mass cell differentiation(GO:0001826) |
| 0.9 | 1.9 | GO:0045079 | negative regulation of chemokine biosynthetic process(GO:0045079) |
| 0.9 | 8.4 | GO:0015747 | urate transport(GO:0015747) |
| 0.9 | 4.7 | GO:0021553 | olfactory nerve development(GO:0021553) |
| 0.9 | 2.8 | GO:0001300 | chronological cell aging(GO:0001300) |
| 0.9 | 4.6 | GO:1900920 | regulation of amino acid uptake involved in synaptic transmission(GO:0051941) regulation of glutamate uptake involved in transmission of nerve impulse(GO:0051946) regulation of L-glutamate import(GO:1900920) |
| 0.9 | 2.7 | GO:0048627 | myoblast development(GO:0048627) |
| 0.9 | 1.8 | GO:0035672 | oligopeptide transmembrane transport(GO:0035672) |
| 0.9 | 8.1 | GO:0030433 | ER-associated ubiquitin-dependent protein catabolic process(GO:0030433) |
| 0.9 | 6.3 | GO:0034378 | chylomicron assembly(GO:0034378) |
| 0.9 | 2.7 | GO:0061055 | myotome development(GO:0061055) |
| 0.9 | 5.4 | GO:0032097 | positive regulation of response to food(GO:0032097) positive regulation of appetite(GO:0032100) |
| 0.9 | 3.6 | GO:0044375 | regulation of peroxisome size(GO:0044375) |
| 0.9 | 3.6 | GO:2000980 | regulation of auditory receptor cell differentiation(GO:0045607) regulation of mechanoreceptor differentiation(GO:0045631) regulation of inner ear receptor cell differentiation(GO:2000980) |
| 0.9 | 3.6 | GO:0032899 | regulation of neurotrophin production(GO:0032899) |
| 0.9 | 1.7 | GO:0001575 | globoside metabolic process(GO:0001575) |
| 0.9 | 1.7 | GO:0090009 | primitive streak formation(GO:0090009) |
| 0.9 | 17.1 | GO:0006957 | complement activation, alternative pathway(GO:0006957) |
| 0.9 | 6.0 | GO:0052697 | flavonoid glucuronidation(GO:0052696) xenobiotic glucuronidation(GO:0052697) |
| 0.9 | 3.4 | GO:0042631 | cellular response to water deprivation(GO:0042631) |
| 0.8 | 2.5 | GO:0097029 | mature conventional dendritic cell differentiation(GO:0097029) |
| 0.8 | 1.7 | GO:2001184 | positive regulation of interleukin-12 secretion(GO:2001184) |
| 0.8 | 10.9 | GO:0097034 | mitochondrial respiratory chain complex IV assembly(GO:0033617) mitochondrial respiratory chain complex IV biogenesis(GO:0097034) |
| 0.8 | 5.0 | GO:2000418 | positive regulation of eosinophil migration(GO:2000418) |
| 0.8 | 2.5 | GO:0090034 | regulation of chaperone-mediated protein complex assembly(GO:0090034) positive regulation of chaperone-mediated protein complex assembly(GO:0090035) |
| 0.8 | 8.4 | GO:0032000 | positive regulation of fatty acid beta-oxidation(GO:0032000) |
| 0.8 | 4.1 | GO:0002415 | immunoglobulin transcytosis in epithelial cells mediated by polymeric immunoglobulin receptor(GO:0002415) |
| 0.8 | 2.5 | GO:1902949 | positive regulation of tau-protein kinase activity(GO:1902949) |
| 0.8 | 3.3 | GO:0019046 | release from viral latency(GO:0019046) |
| 0.8 | 8.2 | GO:0036066 | protein O-linked fucosylation(GO:0036066) |
| 0.8 | 4.9 | GO:0090131 | mesenchyme migration(GO:0090131) |
| 0.8 | 0.8 | GO:0045448 | regulation of mitotic cell cycle, embryonic(GO:0009794) mitotic cell cycle, embryonic(GO:0045448) negative regulation of mitotic cell cycle, embryonic(GO:0045976) |
| 0.8 | 3.2 | GO:0071504 | response to heparin(GO:0071503) cellular response to heparin(GO:0071504) |
| 0.8 | 3.2 | GO:0001757 | somite specification(GO:0001757) |
| 0.8 | 8.9 | GO:0008612 | peptidyl-lysine modification to peptidyl-hypusine(GO:0008612) |
| 0.8 | 3.2 | GO:2000346 | negative regulation of hepatocyte proliferation(GO:2000346) |
| 0.8 | 4.8 | GO:0006196 | AMP catabolic process(GO:0006196) |
| 0.8 | 20.0 | GO:0001502 | cartilage condensation(GO:0001502) |
| 0.8 | 1.6 | GO:0060018 | astrocyte fate commitment(GO:0060018) |
| 0.8 | 4.0 | GO:0003219 | cardiac right ventricle formation(GO:0003219) |
| 0.8 | 4.8 | GO:0048312 | intracellular distribution of mitochondria(GO:0048312) |
| 0.8 | 3.2 | GO:0021784 | postganglionic parasympathetic fiber development(GO:0021784) |
| 0.8 | 4.0 | GO:2001274 | negative regulation of glucose import in response to insulin stimulus(GO:2001274) |
| 0.8 | 9.4 | GO:0043046 | DNA methylation involved in gamete generation(GO:0043046) |
| 0.8 | 1.6 | GO:0014807 | regulation of somitogenesis(GO:0014807) |
| 0.8 | 4.6 | GO:0010732 | protein glutathionylation(GO:0010731) regulation of protein glutathionylation(GO:0010732) negative regulation of protein glutathionylation(GO:0010734) |
| 0.8 | 6.2 | GO:0032417 | positive regulation of sodium:proton antiporter activity(GO:0032417) |
| 0.8 | 2.3 | GO:0007509 | mesoderm migration involved in gastrulation(GO:0007509) |
| 0.8 | 3.1 | GO:0006663 | platelet activating factor biosynthetic process(GO:0006663) |
| 0.8 | 2.3 | GO:0033693 | neurofilament bundle assembly(GO:0033693) |
| 0.8 | 3.1 | GO:0035995 | detection of muscle stretch(GO:0035995) |
| 0.8 | 6.0 | GO:0051388 | positive regulation of neurotrophin TRK receptor signaling pathway(GO:0051388) |
| 0.8 | 4.5 | GO:0006287 | base-excision repair, gap-filling(GO:0006287) |
| 0.8 | 3.8 | GO:0032571 | response to vitamin K(GO:0032571) |
| 0.8 | 3.8 | GO:1990034 | calcium ion export from cell(GO:1990034) |
| 0.7 | 5.2 | GO:0006102 | isocitrate metabolic process(GO:0006102) |
| 0.7 | 1.5 | GO:2001178 | mediator complex assembly(GO:0036034) regulation of mediator complex assembly(GO:2001176) positive regulation of mediator complex assembly(GO:2001178) |
| 0.7 | 2.9 | GO:0060770 | negative regulation of epithelial cell proliferation involved in prostate gland development(GO:0060770) |
| 0.7 | 1.5 | GO:0035962 | response to interleukin-13(GO:0035962) |
| 0.7 | 1.4 | GO:0030860 | regulation of polarized epithelial cell differentiation(GO:0030860) |
| 0.7 | 1.4 | GO:0038086 | VEGF-activated platelet-derived growth factor receptor signaling pathway(GO:0038086) positive regulation of cell proliferation by VEGF-activated platelet derived growth factor receptor signaling pathway(GO:0038091) |
| 0.7 | 7.1 | GO:0015886 | heme transport(GO:0015886) |
| 0.7 | 4.3 | GO:0006003 | fructose 2,6-bisphosphate metabolic process(GO:0006003) |
| 0.7 | 2.1 | GO:0002025 | vasodilation by norepinephrine-epinephrine involved in regulation of systemic arterial blood pressure(GO:0002025) |
| 0.7 | 7.8 | GO:0030322 | stabilization of membrane potential(GO:0030322) |
| 0.7 | 1.4 | GO:2000364 | regulation of STAT protein import into nucleus(GO:2000364) positive regulation of STAT protein import into nucleus(GO:2000366) |
| 0.7 | 9.9 | GO:1901750 | leukotriene D4 metabolic process(GO:1901748) leukotriene D4 biosynthetic process(GO:1901750) |
| 0.7 | 4.2 | GO:0046886 | positive regulation of hormone biosynthetic process(GO:0046886) |
| 0.7 | 2.1 | GO:0002731 | negative regulation of dendritic cell cytokine production(GO:0002731) |
| 0.7 | 2.1 | GO:0043403 | skeletal muscle tissue regeneration(GO:0043403) |
| 0.7 | 4.9 | GO:0051918 | negative regulation of fibrinolysis(GO:0051918) |
| 0.7 | 6.1 | GO:0021936 | regulation of cerebellar granule cell precursor proliferation(GO:0021936) |
| 0.7 | 3.4 | GO:0002159 | desmosome assembly(GO:0002159) |
| 0.7 | 2.0 | GO:0048859 | formation of anatomical boundary(GO:0048859) |
| 0.7 | 0.7 | GO:0002351 | serotonin production involved in inflammatory response(GO:0002351) serotonin secretion involved in inflammatory response(GO:0002442) serotonin secretion by platelet(GO:0002554) |
| 0.7 | 0.7 | GO:0042938 | dipeptide transport(GO:0042938) |
| 0.7 | 10.0 | GO:0007196 | adenylate cyclase-inhibiting G-protein coupled glutamate receptor signaling pathway(GO:0007196) |
| 0.7 | 5.3 | GO:0007288 | sperm axoneme assembly(GO:0007288) |
| 0.7 | 17.3 | GO:0070498 | interleukin-1-mediated signaling pathway(GO:0070498) |
| 0.7 | 4.6 | GO:0035021 | negative regulation of Rac protein signal transduction(GO:0035021) |
| 0.7 | 2.0 | GO:0038163 | thrombopoietin-mediated signaling pathway(GO:0038163) |
| 0.7 | 3.3 | GO:0038169 | somatostatin receptor signaling pathway(GO:0038169) somatostatin signaling pathway(GO:0038170) |
| 0.7 | 2.0 | GO:0070940 | dephosphorylation of RNA polymerase II C-terminal domain(GO:0070940) |
| 0.6 | 1.9 | GO:0050916 | sensory perception of sweet taste(GO:0050916) |
| 0.6 | 1.3 | GO:0046666 | retinal cell programmed cell death(GO:0046666) |
| 0.6 | 1.9 | GO:0006808 | regulation of nitrogen utilization(GO:0006808) nitrogen utilization(GO:0019740) |
| 0.6 | 3.9 | GO:1904381 | Golgi apparatus mannose trimming(GO:1904381) |
| 0.6 | 4.5 | GO:0002693 | positive regulation of cellular extravasation(GO:0002693) |
| 0.6 | 3.2 | GO:0036123 | histone H3-K9 dimethylation(GO:0036123) |
| 0.6 | 9.5 | GO:0034497 | protein localization to pre-autophagosomal structure(GO:0034497) |
| 0.6 | 2.5 | GO:0046502 | uroporphyrinogen III biosynthetic process(GO:0006780) uroporphyrinogen III metabolic process(GO:0046502) |
| 0.6 | 9.4 | GO:2000353 | positive regulation of endothelial cell apoptotic process(GO:2000353) |
| 0.6 | 2.5 | GO:0060214 | stem cell fate commitment(GO:0048865) endocardium formation(GO:0060214) |
| 0.6 | 3.1 | GO:0050910 | detection of mechanical stimulus involved in sensory perception of sound(GO:0050910) |
| 0.6 | 1.9 | GO:0033364 | mast cell secretory granule organization(GO:0033364) |
| 0.6 | 10.6 | GO:0019371 | cyclooxygenase pathway(GO:0019371) |
| 0.6 | 3.1 | GO:0072249 | metanephric glomerular epithelium development(GO:0072244) metanephric glomerular visceral epithelial cell differentiation(GO:0072248) metanephric glomerular visceral epithelial cell development(GO:0072249) metanephric glomerular epithelial cell differentiation(GO:0072312) metanephric glomerular epithelial cell development(GO:0072313) |
| 0.6 | 10.5 | GO:0006265 | DNA topological change(GO:0006265) |
| 0.6 | 1.8 | GO:0061073 | ciliary body morphogenesis(GO:0061073) |
| 0.6 | 1.8 | GO:0060024 | rhythmic synaptic transmission(GO:0060024) |
| 0.6 | 3.0 | GO:0060033 | anatomical structure regression(GO:0060033) |
| 0.6 | 4.2 | GO:0021978 | telencephalon regionalization(GO:0021978) |
| 0.6 | 1.8 | GO:1904647 | response to rotenone(GO:1904647) |
| 0.6 | 0.6 | GO:0060019 | radial glial cell differentiation(GO:0060019) |
| 0.6 | 1.8 | GO:0090038 | negative regulation of protein kinase C signaling(GO:0090038) |
| 0.6 | 4.2 | GO:0071907 | determination of digestive tract left/right asymmetry(GO:0071907) |
| 0.6 | 2.4 | GO:0042414 | epinephrine metabolic process(GO:0042414) epinephrine biosynthetic process(GO:0042418) |
| 0.6 | 1.8 | GO:0060529 | squamous basal epithelial stem cell differentiation involved in prostate gland acinus development(GO:0060529) |
| 0.6 | 3.0 | GO:0090625 | mRNA cleavage involved in gene silencing by miRNA(GO:0035279) mRNA cleavage involved in gene silencing by siRNA(GO:0090625) mRNA cleavage involved in gene silencing(GO:0098795) |
| 0.6 | 3.5 | GO:0097113 | AMPA glutamate receptor clustering(GO:0097113) glutamate receptor clustering(GO:0097688) |
| 0.6 | 10.0 | GO:0006681 | galactosylceramide metabolic process(GO:0006681) galactolipid metabolic process(GO:0019374) |
| 0.6 | 2.9 | GO:1904954 | canonical Wnt signaling pathway involved in midbrain dopaminergic neuron differentiation(GO:1904954) |
| 0.6 | 2.3 | GO:0009298 | GDP-mannose biosynthetic process(GO:0009298) |
| 0.6 | 2.3 | GO:0071393 | cellular response to progesterone stimulus(GO:0071393) |
| 0.6 | 4.6 | GO:1902510 | regulation of apoptotic DNA fragmentation(GO:1902510) |
| 0.6 | 3.4 | GO:0018343 | protein farnesylation(GO:0018343) |
| 0.6 | 2.8 | GO:1901908 | diadenosine polyphosphate catabolic process(GO:0015961) diphosphoinositol polyphosphate metabolic process(GO:0071543) diadenosine pentaphosphate metabolic process(GO:1901906) diadenosine pentaphosphate catabolic process(GO:1901907) diadenosine hexaphosphate metabolic process(GO:1901908) diadenosine hexaphosphate catabolic process(GO:1901909) adenosine 5'-(hexahydrogen pentaphosphate) metabolic process(GO:1901910) adenosine 5'-(hexahydrogen pentaphosphate) catabolic process(GO:1901911) |
| 0.6 | 1.7 | GO:0016103 | diterpenoid catabolic process(GO:0016103) retinoic acid catabolic process(GO:0034653) |
| 0.6 | 7.7 | GO:0035878 | nail development(GO:0035878) |
| 0.5 | 8.8 | GO:0015812 | gamma-aminobutyric acid transport(GO:0015812) |
| 0.5 | 1.6 | GO:0051102 | DNA ligation involved in DNA recombination(GO:0051102) |
| 0.5 | 1.6 | GO:0019442 | tryptophan catabolic process to acetyl-CoA(GO:0019442) |
| 0.5 | 9.8 | GO:0032367 | intracellular sterol transport(GO:0032366) intracellular cholesterol transport(GO:0032367) |
| 0.5 | 6.0 | GO:0030238 | male sex determination(GO:0030238) |
| 0.5 | 4.3 | GO:2000507 | positive regulation of energy homeostasis(GO:2000507) |
| 0.5 | 2.7 | GO:0045741 | positive regulation of epidermal growth factor-activated receptor activity(GO:0045741) |
| 0.5 | 35.4 | GO:0006910 | phagocytosis, recognition(GO:0006910) |
| 0.5 | 2.1 | GO:1902498 | regulation of protein autoubiquitination(GO:1902498) |
| 0.5 | 16.0 | GO:0045746 | negative regulation of Notch signaling pathway(GO:0045746) |
| 0.5 | 1.6 | GO:0046440 | L-lysine catabolic process to acetyl-CoA(GO:0019474) L-lysine catabolic process(GO:0019477) L-lysine metabolic process(GO:0046440) |
| 0.5 | 1.0 | GO:1903527 | positive regulation of membrane tubulation(GO:1903527) |
| 0.5 | 0.5 | GO:0002282 | microglial cell activation involved in immune response(GO:0002282) |
| 0.5 | 1.5 | GO:0033602 | negative regulation of dopamine secretion(GO:0033602) |
| 0.5 | 1.5 | GO:0034444 | regulation of plasma lipoprotein particle oxidation(GO:0034444) negative regulation of plasma lipoprotein particle oxidation(GO:0034445) |
| 0.5 | 5.1 | GO:0042904 | 9-cis-retinoic acid biosynthetic process(GO:0042904) 9-cis-retinoic acid metabolic process(GO:0042905) |
| 0.5 | 1.5 | GO:0030187 | melatonin metabolic process(GO:0030186) melatonin biosynthetic process(GO:0030187) |
| 0.5 | 2.0 | GO:0006049 | UDP-N-acetylglucosamine catabolic process(GO:0006049) |
| 0.5 | 13.9 | GO:0016338 | calcium-independent cell-cell adhesion via plasma membrane cell-adhesion molecules(GO:0016338) |
| 0.5 | 2.5 | GO:0061146 | Peyer's patch morphogenesis(GO:0061146) |
| 0.5 | 2.0 | GO:0045065 | cytotoxic T cell differentiation(GO:0045065) |
| 0.5 | 1.0 | GO:0045994 | positive regulation of translational initiation by iron(GO:0045994) |
| 0.5 | 4.9 | GO:0043152 | induction of bacterial agglutination(GO:0043152) |
| 0.5 | 1.9 | GO:0007198 | adenylate cyclase-inhibiting serotonin receptor signaling pathway(GO:0007198) |
| 0.5 | 1.0 | GO:0014831 | gastro-intestinal system smooth muscle contraction(GO:0014831) |
| 0.5 | 5.8 | GO:1903025 | regulation of RNA polymerase II regulatory region sequence-specific DNA binding(GO:1903025) |
| 0.5 | 1.4 | GO:0009635 | response to herbicide(GO:0009635) negative regulation of mitophagy in response to mitochondrial depolarization(GO:1904924) |
| 0.5 | 1.9 | GO:0002408 | myeloid dendritic cell chemotaxis(GO:0002408) |
| 0.5 | 9.0 | GO:0045662 | negative regulation of myoblast differentiation(GO:0045662) |
| 0.5 | 4.3 | GO:0030091 | protein repair(GO:0030091) |
| 0.5 | 3.3 | GO:1903142 | positive regulation of endothelial cell development(GO:1901552) positive regulation of establishment of endothelial barrier(GO:1903142) |
| 0.5 | 3.8 | GO:0035865 | cellular response to potassium ion(GO:0035865) |
| 0.5 | 2.3 | GO:0060363 | cranial suture morphogenesis(GO:0060363) |
| 0.5 | 1.9 | GO:0001842 | neural fold formation(GO:0001842) |
| 0.5 | 3.7 | GO:0090080 | positive regulation of MAPKKK cascade by fibroblast growth factor receptor signaling pathway(GO:0090080) |
| 0.5 | 4.6 | GO:0015732 | prostaglandin transport(GO:0015732) |
| 0.5 | 2.7 | GO:0009099 | branched-chain amino acid biosynthetic process(GO:0009082) leucine biosynthetic process(GO:0009098) valine biosynthetic process(GO:0009099) |
| 0.5 | 1.4 | GO:1901491 | negative regulation of lymphangiogenesis(GO:1901491) |
| 0.5 | 1.4 | GO:0048213 | Golgi vesicle prefusion complex stabilization(GO:0048213) |
| 0.5 | 5.0 | GO:0006657 | CDP-choline pathway(GO:0006657) |
| 0.5 | 3.2 | GO:0031642 | negative regulation of myelination(GO:0031642) |
| 0.5 | 1.4 | GO:0050428 | purine ribonucleoside bisphosphate biosynthetic process(GO:0034036) 3'-phosphoadenosine 5'-phosphosulfate biosynthetic process(GO:0050428) |
| 0.5 | 1.8 | GO:1900425 | negative regulation of defense response to bacterium(GO:1900425) |
| 0.4 | 0.9 | GO:0070427 | nucleotide-binding oligomerization domain containing 1 signaling pathway(GO:0070427) |
| 0.4 | 1.8 | GO:1904491 | protein localization to ciliary transition zone(GO:1904491) |
| 0.4 | 3.6 | GO:0071318 | cellular response to ATP(GO:0071318) |
| 0.4 | 2.7 | GO:2000510 | positive regulation of dendritic cell chemotaxis(GO:2000510) |
| 0.4 | 3.5 | GO:1900113 | histone H3-K36 demethylation(GO:0070544) negative regulation of histone H3-K9 trimethylation(GO:1900113) |
| 0.4 | 1.8 | GO:0015808 | L-alanine transport(GO:0015808) |
| 0.4 | 0.9 | GO:0051088 | PMA-inducible membrane protein ectodomain proteolysis(GO:0051088) |
| 0.4 | 1.7 | GO:1901096 | regulation of autophagosome maturation(GO:1901096) positive regulation of autophagosome maturation(GO:1901098) |
| 0.4 | 3.5 | GO:0061302 | smooth muscle cell-matrix adhesion(GO:0061302) |
| 0.4 | 1.3 | GO:0044240 | multicellular organism lipid catabolic process(GO:0044240) |
| 0.4 | 1.7 | GO:0032455 | nerve growth factor processing(GO:0032455) |
| 0.4 | 0.9 | GO:0038165 | oncostatin-M-mediated signaling pathway(GO:0038165) |
| 0.4 | 1.7 | GO:1901727 | protein kinase D signaling(GO:0089700) positive regulation of histone deacetylase activity(GO:1901727) |
| 0.4 | 1.7 | GO:0097623 | potassium ion export across plasma membrane(GO:0097623) |
| 0.4 | 5.1 | GO:0043517 | positive regulation of DNA damage response, signal transduction by p53 class mediator(GO:0043517) |
| 0.4 | 0.8 | GO:0061386 | closure of optic fissure(GO:0061386) |
| 0.4 | 2.1 | GO:1904124 | positive regulation of odontogenesis of dentin-containing tooth(GO:0042488) mammary gland fat development(GO:0060611) positive regulation of macrophage colony-stimulating factor signaling pathway(GO:1902228) positive regulation of response to macrophage colony-stimulating factor(GO:1903971) positive regulation of cellular response to macrophage colony-stimulating factor stimulus(GO:1903974) microglial cell migration(GO:1904124) regulation of microglial cell migration(GO:1904139) positive regulation of microglial cell migration(GO:1904141) |
| 0.4 | 0.8 | GO:0090370 | negative regulation of cholesterol efflux(GO:0090370) |
| 0.4 | 1.2 | GO:0048250 | mitochondrial iron ion transport(GO:0048250) |
| 0.4 | 1.2 | GO:0001958 | endochondral ossification(GO:0001958) replacement ossification(GO:0036075) |
| 0.4 | 2.5 | GO:0051344 | regulation of cyclic-nucleotide phosphodiesterase activity(GO:0051342) negative regulation of cyclic-nucleotide phosphodiesterase activity(GO:0051344) |
| 0.4 | 2.0 | GO:0001865 | NK T cell differentiation(GO:0001865) |
| 0.4 | 5.7 | GO:0046697 | decidualization(GO:0046697) |
| 0.4 | 0.8 | GO:0009051 | pentose-phosphate shunt, oxidative branch(GO:0009051) |
| 0.4 | 3.2 | GO:0035897 | proteolysis in other organism(GO:0035897) |
| 0.4 | 1.6 | GO:0032049 | cardiolipin biosynthetic process(GO:0032049) |
| 0.4 | 2.4 | GO:0043307 | eosinophil activation(GO:0043307) |
| 0.4 | 1.6 | GO:0045586 | regulation of gamma-delta T cell differentiation(GO:0045586) |
| 0.4 | 1.2 | GO:1903237 | negative regulation of leukocyte tethering or rolling(GO:1903237) |
| 0.4 | 13.3 | GO:1903861 | positive regulation of dendrite extension(GO:1903861) |
| 0.4 | 4.4 | GO:1901072 | glucosamine-containing compound catabolic process(GO:1901072) |
| 0.4 | 1.2 | GO:0019074 | viral genome packaging(GO:0019072) viral RNA genome packaging(GO:0019074) |
| 0.4 | 1.6 | GO:0060074 | synapse maturation(GO:0060074) |
| 0.4 | 1.2 | GO:0002644 | negative regulation of tolerance induction(GO:0002644) |
| 0.4 | 0.8 | GO:0001812 | regulation of type I hypersensitivity(GO:0001810) positive regulation of type I hypersensitivity(GO:0001812) type I hypersensitivity(GO:0016068) |
| 0.4 | 7.1 | GO:0007021 | tubulin complex assembly(GO:0007021) |
| 0.4 | 3.2 | GO:0031284 | positive regulation of guanylate cyclase activity(GO:0031284) |
| 0.4 | 2.0 | GO:0070458 | cellular detoxification of nitrogen compound(GO:0070458) |
| 0.4 | 1.6 | GO:1903597 | negative regulation of gap junction assembly(GO:1903597) |
| 0.4 | 1.6 | GO:0071625 | vocalization behavior(GO:0071625) |
| 0.4 | 3.1 | GO:0050966 | detection of mechanical stimulus involved in sensory perception of pain(GO:0050966) |
| 0.4 | 3.9 | GO:0048712 | negative regulation of astrocyte differentiation(GO:0048712) |
| 0.4 | 2.3 | GO:0038063 | collagen-activated tyrosine kinase receptor signaling pathway(GO:0038063) collagen-activated signaling pathway(GO:0038065) |
| 0.4 | 1.9 | GO:0001555 | oocyte growth(GO:0001555) |
| 0.4 | 0.8 | GO:0045162 | clustering of voltage-gated sodium channels(GO:0045162) |
| 0.4 | 5.8 | GO:0042420 | dopamine catabolic process(GO:0042420) |
| 0.4 | 1.1 | GO:0002024 | diet induced thermogenesis(GO:0002024) |
| 0.4 | 36.6 | GO:0032945 | negative regulation of mononuclear cell proliferation(GO:0032945) negative regulation of lymphocyte proliferation(GO:0050672) |
| 0.4 | 1.9 | GO:1904073 | trophectodermal cell proliferation(GO:0001834) regulation of trophectodermal cell proliferation(GO:1904073) positive regulation of trophectodermal cell proliferation(GO:1904075) |
| 0.4 | 4.2 | GO:0006702 | androgen biosynthetic process(GO:0006702) |
| 0.4 | 9.7 | GO:0097503 | sialylation(GO:0097503) |
| 0.4 | 1.5 | GO:0070384 | Harderian gland development(GO:0070384) |
| 0.4 | 2.2 | GO:0061343 | cell adhesion involved in heart morphogenesis(GO:0061343) |
| 0.4 | 5.2 | GO:0048642 | negative regulation of skeletal muscle tissue development(GO:0048642) |
| 0.4 | 3.7 | GO:0099612 | protein localization to axon(GO:0099612) |
| 0.4 | 2.6 | GO:0048014 | Tie signaling pathway(GO:0048014) |
| 0.4 | 3.3 | GO:0048102 | autophagic cell death(GO:0048102) |
| 0.4 | 1.8 | GO:1901525 | negative regulation of macromitophagy(GO:1901525) |
| 0.4 | 4.4 | GO:1903963 | arachidonic acid secretion(GO:0050482) arachidonate transport(GO:1903963) |
| 0.4 | 3.6 | GO:0038003 | opioid receptor signaling pathway(GO:0038003) |
| 0.4 | 1.4 | GO:1904706 | negative regulation of vascular smooth muscle cell proliferation(GO:1904706) |
| 0.4 | 0.4 | GO:0009826 | unidimensional cell growth(GO:0009826) |
| 0.4 | 2.8 | GO:0070995 | NADPH oxidation(GO:0070995) |
| 0.4 | 2.1 | GO:1900029 | positive regulation of ruffle assembly(GO:1900029) |
| 0.4 | 0.7 | GO:0003285 | septum secundum development(GO:0003285) |
| 0.4 | 2.8 | GO:0098532 | histone H3-K27 trimethylation(GO:0098532) |
| 0.4 | 2.5 | GO:0044245 | polysaccharide digestion(GO:0044245) |
| 0.3 | 0.7 | GO:0043201 | response to leucine(GO:0043201) cellular response to leucine(GO:0071233) |
| 0.3 | 1.0 | GO:0061092 | regulation of phospholipid translocation(GO:0061091) positive regulation of phospholipid translocation(GO:0061092) |
| 0.3 | 2.1 | GO:2001300 | lipoxin metabolic process(GO:2001300) |
| 0.3 | 5.9 | GO:0003298 | physiological muscle hypertrophy(GO:0003298) physiological cardiac muscle hypertrophy(GO:0003301) cell growth involved in cardiac muscle cell development(GO:0061049) |
| 0.3 | 0.7 | GO:0006659 | phosphatidylserine biosynthetic process(GO:0006659) |
| 0.3 | 1.0 | GO:0061536 | glycine secretion(GO:0061536) glycine secretion, neurotransmission(GO:0061537) |
| 0.3 | 2.4 | GO:0046322 | negative regulation of fatty acid oxidation(GO:0046322) |
| 0.3 | 1.7 | GO:0048105 | establishment of body hair or bristle planar orientation(GO:0048104) establishment of body hair planar orientation(GO:0048105) |
| 0.3 | 10.5 | GO:0022400 | regulation of rhodopsin mediated signaling pathway(GO:0022400) |
| 0.3 | 1.4 | GO:0032053 | ciliary basal body organization(GO:0032053) |
| 0.3 | 1.4 | GO:0034434 | steroid esterification(GO:0034433) sterol esterification(GO:0034434) cholesterol esterification(GO:0034435) |
| 0.3 | 2.0 | GO:0010735 | positive regulation of transcription via serum response element binding(GO:0010735) |
| 0.3 | 2.3 | GO:0031536 | positive regulation of exit from mitosis(GO:0031536) |
| 0.3 | 0.7 | GO:0052564 | response to immune response of other organism involved in symbiotic interaction(GO:0052564) response to host immune response(GO:0052572) |
| 0.3 | 1.0 | GO:2001206 | positive regulation of osteoclast development(GO:2001206) |
| 0.3 | 5.3 | GO:0098719 | sodium ion import across plasma membrane(GO:0098719) sodium ion import into cell(GO:1990118) |
| 0.3 | 2.0 | GO:0061737 | leukotriene signaling pathway(GO:0061737) |
| 0.3 | 3.6 | GO:0006600 | creatine metabolic process(GO:0006600) |
| 0.3 | 2.6 | GO:0071313 | cellular response to caffeine(GO:0071313) |
| 0.3 | 4.6 | GO:0005513 | detection of calcium ion(GO:0005513) |
| 0.3 | 1.6 | GO:0060160 | negative regulation of dopamine receptor signaling pathway(GO:0060160) |
| 0.3 | 5.5 | GO:0030388 | fructose 1,6-bisphosphate metabolic process(GO:0030388) |
| 0.3 | 1.0 | GO:0039534 | negative regulation of MDA-5 signaling pathway(GO:0039534) |
| 0.3 | 1.3 | GO:0021633 | optic nerve structural organization(GO:0021633) |
| 0.3 | 3.8 | GO:0070389 | chaperone cofactor-dependent protein refolding(GO:0070389) |
| 0.3 | 0.6 | GO:0010040 | response to iron(II) ion(GO:0010040) |
| 0.3 | 3.5 | GO:0006451 | selenocysteine incorporation(GO:0001514) translational readthrough(GO:0006451) |
| 0.3 | 1.9 | GO:0019227 | neuronal action potential propagation(GO:0019227) action potential propagation(GO:0098870) |
| 0.3 | 8.2 | GO:0009235 | cobalamin metabolic process(GO:0009235) |
| 0.3 | 5.0 | GO:0035855 | megakaryocyte development(GO:0035855) |
| 0.3 | 1.9 | GO:0060244 | negative regulation of cell proliferation involved in contact inhibition(GO:0060244) |
| 0.3 | 4.0 | GO:0046320 | regulation of fatty acid oxidation(GO:0046320) |
| 0.3 | 4.6 | GO:0032988 | ribonucleoprotein complex disassembly(GO:0032988) |
| 0.3 | 2.4 | GO:0046618 | drug export(GO:0046618) |
| 0.3 | 0.9 | GO:0099566 | regulation of postsynaptic cytosolic calcium ion concentration(GO:0099566) |
| 0.3 | 1.2 | GO:0033563 | dorsal/ventral axon guidance(GO:0033563) |
| 0.3 | 3.2 | GO:0045792 | negative regulation of cell size(GO:0045792) |
| 0.3 | 4.6 | GO:1904837 | beta-catenin-TCF complex assembly(GO:1904837) |
| 0.3 | 1.7 | GO:0038172 | interleukin-33-mediated signaling pathway(GO:0038172) |
| 0.3 | 5.1 | GO:0042359 | vitamin D metabolic process(GO:0042359) |
| 0.3 | 1.4 | GO:0030070 | insulin processing(GO:0030070) |
| 0.3 | 1.7 | GO:0042118 | endothelial cell activation(GO:0042118) |
| 0.3 | 1.1 | GO:0001994 | norepinephrine-epinephrine vasoconstriction involved in regulation of systemic arterial blood pressure(GO:0001994) |
| 0.3 | 3.9 | GO:2001275 | positive regulation of glucose import in response to insulin stimulus(GO:2001275) |
| 0.3 | 3.3 | GO:0070327 | thyroid hormone transport(GO:0070327) |
| 0.3 | 5.6 | GO:0060732 | positive regulation of inositol phosphate biosynthetic process(GO:0060732) |
| 0.3 | 8.9 | GO:1901522 | positive regulation of transcription from RNA polymerase II promoter involved in cellular response to chemical stimulus(GO:1901522) |
| 0.3 | 6.4 | GO:0016578 | histone deubiquitination(GO:0016578) |
| 0.3 | 5.3 | GO:0042340 | keratan sulfate catabolic process(GO:0042340) |
| 0.3 | 2.2 | GO:0060080 | inhibitory postsynaptic potential(GO:0060080) |
| 0.3 | 4.1 | GO:0071294 | cellular response to zinc ion(GO:0071294) |
| 0.3 | 2.2 | GO:0016926 | protein desumoylation(GO:0016926) |
| 0.3 | 1.9 | GO:0070779 | D-aspartate transport(GO:0070777) D-aspartate import(GO:0070779) |
| 0.3 | 1.6 | GO:0050808 | synapse organization(GO:0050808) |
| 0.3 | 1.1 | GO:0033574 | response to testosterone(GO:0033574) |
| 0.3 | 2.1 | GO:0015693 | magnesium ion transport(GO:0015693) |
| 0.3 | 4.3 | GO:0030048 | actin filament-based movement(GO:0030048) |
| 0.3 | 1.9 | GO:0002544 | chronic inflammatory response(GO:0002544) |
| 0.3 | 0.5 | GO:0045214 | sarcomere organization(GO:0045214) |
| 0.3 | 1.8 | GO:0006701 | progesterone biosynthetic process(GO:0006701) |
| 0.3 | 0.8 | GO:0046900 | tetrahydrofolylpolyglutamate metabolic process(GO:0046900) |
| 0.3 | 1.3 | GO:1904936 | cerebral cortex GABAergic interneuron migration(GO:0021853) interneuron migration(GO:1904936) |
| 0.3 | 1.8 | GO:0060044 | negative regulation of cardiac muscle cell proliferation(GO:0060044) |
| 0.3 | 5.1 | GO:0015872 | dopamine transport(GO:0015872) |
| 0.3 | 2.3 | GO:0043923 | positive regulation by host of viral transcription(GO:0043923) |
| 0.3 | 2.8 | GO:0048169 | regulation of long-term neuronal synaptic plasticity(GO:0048169) |
| 0.3 | 3.3 | GO:0060081 | membrane hyperpolarization(GO:0060081) |
| 0.3 | 2.0 | GO:0097106 | postsynaptic density organization(GO:0097106) postsynaptic density assembly(GO:0097107) gephyrin clustering involved in postsynaptic density assembly(GO:0097116) |
| 0.2 | 3.7 | GO:0010248 | establishment or maintenance of transmembrane electrochemical gradient(GO:0010248) |
| 0.2 | 0.7 | GO:1900220 | semaphorin-plexin signaling pathway involved in bone trabecula morphogenesis(GO:1900220) |
| 0.2 | 3.6 | GO:0010457 | centriole-centriole cohesion(GO:0010457) |
| 0.2 | 17.7 | GO:0006695 | cholesterol biosynthetic process(GO:0006695) |
| 0.2 | 4.6 | GO:1900273 | positive regulation of long-term synaptic potentiation(GO:1900273) |
| 0.2 | 0.5 | GO:1903348 | positive regulation of bicellular tight junction assembly(GO:1903348) |
| 0.2 | 1.2 | GO:2000773 | negative regulation of cellular senescence(GO:2000773) |
| 0.2 | 1.4 | GO:0001867 | complement activation, lectin pathway(GO:0001867) |
| 0.2 | 4.3 | GO:0002230 | positive regulation of defense response to virus by host(GO:0002230) |
| 0.2 | 2.1 | GO:0048265 | response to pain(GO:0048265) |
| 0.2 | 2.4 | GO:0098887 | neurotransmitter receptor transport, endosome to postsynaptic membrane(GO:0098887) |
| 0.2 | 16.4 | GO:0016525 | negative regulation of angiogenesis(GO:0016525) |
| 0.2 | 4.2 | GO:0010172 | embryonic body morphogenesis(GO:0010172) |
| 0.2 | 0.7 | GO:0032803 | regulation of low-density lipoprotein particle receptor catabolic process(GO:0032803) |
| 0.2 | 0.9 | GO:0048630 | skeletal muscle tissue growth(GO:0048630) |
| 0.2 | 3.0 | GO:0048266 | behavioral response to pain(GO:0048266) |
| 0.2 | 2.1 | GO:0060973 | cell migration involved in heart development(GO:0060973) |
| 0.2 | 1.2 | GO:1904879 | positive regulation of calcium ion transmembrane transport via high voltage-gated calcium channel(GO:1904879) |
| 0.2 | 3.4 | GO:0050774 | negative regulation of dendrite morphogenesis(GO:0050774) |
| 0.2 | 2.1 | GO:0036342 | post-anal tail morphogenesis(GO:0036342) |
| 0.2 | 2.5 | GO:1902018 | negative regulation of cilium assembly(GO:1902018) |
| 0.2 | 0.5 | GO:0038098 | sequestering of BMP from receptor via BMP binding(GO:0038098) |
| 0.2 | 2.0 | GO:0035330 | regulation of hippo signaling(GO:0035330) |
| 0.2 | 4.7 | GO:0001755 | neural crest cell migration(GO:0001755) |
| 0.2 | 1.8 | GO:2000766 | negative regulation of cytoplasmic translation(GO:2000766) |
| 0.2 | 2.0 | GO:0050890 | cognition(GO:0050890) |
| 0.2 | 6.5 | GO:0031018 | endocrine pancreas development(GO:0031018) |
| 0.2 | 1.1 | GO:0097105 | postsynaptic membrane assembly(GO:0097104) presynaptic membrane assembly(GO:0097105) |
| 0.2 | 3.2 | GO:0040020 | regulation of meiotic nuclear division(GO:0040020) |
| 0.2 | 8.1 | GO:0002548 | monocyte chemotaxis(GO:0002548) |
| 0.2 | 2.3 | GO:0048251 | elastic fiber assembly(GO:0048251) |
| 0.2 | 1.9 | GO:0034501 | protein localization to kinetochore(GO:0034501) |
| 0.2 | 1.1 | GO:1904262 | negative regulation of TORC1 signaling(GO:1904262) |
| 0.2 | 3.4 | GO:0001976 | neurological system process involved in regulation of systemic arterial blood pressure(GO:0001976) |
| 0.2 | 0.4 | GO:0070101 | positive regulation of chemokine-mediated signaling pathway(GO:0070101) |
| 0.2 | 2.3 | GO:0045956 | positive regulation of calcium ion-dependent exocytosis(GO:0045956) |
| 0.2 | 0.2 | GO:0019367 | fatty acid elongation, saturated fatty acid(GO:0019367) fatty acid elongation, unsaturated fatty acid(GO:0019368) fatty acid elongation(GO:0030497) fatty acid elongation, monounsaturated fatty acid(GO:0034625) fatty acid elongation, polyunsaturated fatty acid(GO:0034626) very long-chain fatty acid biosynthetic process(GO:0042761) |
| 0.2 | 6.8 | GO:0007140 | male meiosis(GO:0007140) |
| 0.2 | 2.5 | GO:2000479 | regulation of cAMP-dependent protein kinase activity(GO:2000479) |
| 0.2 | 5.6 | GO:0006911 | phagocytosis, engulfment(GO:0006911) |
| 0.2 | 4.3 | GO:0006123 | mitochondrial electron transport, cytochrome c to oxygen(GO:0006123) |
| 0.2 | 1.9 | GO:0045670 | regulation of osteoclast differentiation(GO:0045670) |
| 0.2 | 2.7 | GO:0031441 | negative regulation of mRNA 3'-end processing(GO:0031441) |
| 0.2 | 5.9 | GO:0043001 | Golgi to plasma membrane protein transport(GO:0043001) |
| 0.2 | 12.1 | GO:0006968 | cellular defense response(GO:0006968) |
| 0.2 | 0.8 | GO:0015816 | glycine transport(GO:0015816) |
| 0.2 | 15.0 | GO:0006958 | complement activation, classical pathway(GO:0006958) |
| 0.2 | 5.4 | GO:0050435 | beta-amyloid metabolic process(GO:0050435) |
| 0.2 | 1.2 | GO:0050951 | sensory perception of temperature stimulus(GO:0050951) |
| 0.2 | 1.0 | GO:0070383 | DNA cytosine deamination(GO:0070383) |
| 0.2 | 1.3 | GO:0044130 | negative regulation of growth of symbiont in host(GO:0044130) |
| 0.2 | 3.6 | GO:0043011 | myeloid dendritic cell differentiation(GO:0043011) |
| 0.2 | 0.6 | GO:0007200 | phospholipase C-activating G-protein coupled receptor signaling pathway(GO:0007200) |
| 0.2 | 1.1 | GO:0098535 | de novo centriole assembly(GO:0098535) |
| 0.2 | 1.3 | GO:0043569 | negative regulation of insulin-like growth factor receptor signaling pathway(GO:0043569) |
| 0.2 | 6.6 | GO:0033173 | calcineurin-NFAT signaling cascade(GO:0033173) |
| 0.2 | 1.3 | GO:0045007 | depurination(GO:0045007) |
| 0.2 | 2.0 | GO:0060394 | negative regulation of pathway-restricted SMAD protein phosphorylation(GO:0060394) |
| 0.2 | 2.5 | GO:0022011 | Schwann cell development(GO:0014044) myelination in peripheral nervous system(GO:0022011) peripheral nervous system axon ensheathment(GO:0032292) |
| 0.2 | 1.6 | GO:0051256 | mitotic spindle midzone assembly(GO:0051256) |
| 0.2 | 1.8 | GO:0051895 | negative regulation of focal adhesion assembly(GO:0051895) negative regulation of adherens junction organization(GO:1903392) |
| 0.2 | 2.1 | GO:0042104 | positive regulation of activated T cell proliferation(GO:0042104) |
| 0.2 | 1.6 | GO:0032728 | positive regulation of interferon-beta production(GO:0032728) |
| 0.2 | 7.1 | GO:0030212 | hyaluronan metabolic process(GO:0030212) |
| 0.2 | 0.3 | GO:1990834 | response to odorant(GO:1990834) |
| 0.2 | 1.4 | GO:1990845 | adaptive thermogenesis(GO:1990845) |
| 0.2 | 2.1 | GO:0001525 | angiogenesis(GO:0001525) |
| 0.2 | 4.7 | GO:0016339 | calcium-dependent cell-cell adhesion via plasma membrane cell adhesion molecules(GO:0016339) |
| 0.2 | 11.3 | GO:0006501 | C-terminal protein lipidation(GO:0006501) |
| 0.2 | 0.5 | GO:0006478 | peptidyl-tyrosine sulfation(GO:0006478) |
| 0.2 | 0.5 | GO:0010641 | positive regulation of platelet-derived growth factor receptor signaling pathway(GO:0010641) |
| 0.2 | 5.6 | GO:0035176 | social behavior(GO:0035176) intraspecies interaction between organisms(GO:0051703) |
| 0.2 | 2.1 | GO:0038083 | peptidyl-tyrosine autophosphorylation(GO:0038083) |
| 0.2 | 0.3 | GO:0040018 | positive regulation of multicellular organism growth(GO:0040018) |
| 0.2 | 1.7 | GO:1903037 | regulation of leukocyte cell-cell adhesion(GO:1903037) |
| 0.2 | 3.8 | GO:0072661 | protein targeting to plasma membrane(GO:0072661) |
| 0.2 | 2.2 | GO:0031643 | positive regulation of myelination(GO:0031643) |
| 0.2 | 2.3 | GO:0010470 | regulation of gastrulation(GO:0010470) |
| 0.2 | 1.9 | GO:0006578 | amino-acid betaine biosynthetic process(GO:0006578) |
| 0.2 | 0.5 | GO:1903772 | regulation of viral budding via host ESCRT complex(GO:1903772) |
| 0.2 | 0.9 | GO:0046325 | negative regulation of glucose import(GO:0046325) |
| 0.2 | 2.0 | GO:0035024 | negative regulation of Rho protein signal transduction(GO:0035024) |
| 0.2 | 1.2 | GO:0045725 | positive regulation of glycogen biosynthetic process(GO:0045725) |
| 0.1 | 0.1 | GO:0030323 | respiratory tube development(GO:0030323) |
| 0.1 | 0.7 | GO:0071361 | cellular response to ethanol(GO:0071361) |
| 0.1 | 0.3 | GO:0090500 | endocardial cushion to mesenchymal transition(GO:0090500) |
| 0.1 | 2.5 | GO:0030220 | platelet formation(GO:0030220) |
| 0.1 | 0.9 | GO:0002430 | complement receptor mediated signaling pathway(GO:0002430) |
| 0.1 | 0.7 | GO:0010499 | proteasomal ubiquitin-independent protein catabolic process(GO:0010499) |
| 0.1 | 2.9 | GO:0001837 | epithelial to mesenchymal transition(GO:0001837) |
| 0.1 | 2.5 | GO:0097120 | receptor localization to synapse(GO:0097120) |
| 0.1 | 2.7 | GO:0032012 | regulation of ARF protein signal transduction(GO:0032012) |
| 0.1 | 1.4 | GO:0010265 | SCF complex assembly(GO:0010265) |
| 0.1 | 1.1 | GO:0060716 | labyrinthine layer blood vessel development(GO:0060716) |
| 0.1 | 1.3 | GO:0014029 | neural crest formation(GO:0014029) |
| 0.1 | 3.8 | GO:0030970 | retrograde protein transport, ER to cytosol(GO:0030970) |
| 0.1 | 2.1 | GO:0006833 | water transport(GO:0006833) |
| 0.1 | 4.8 | GO:0030517 | negative regulation of axon extension(GO:0030517) |
| 0.1 | 1.8 | GO:0034498 | early endosome to Golgi transport(GO:0034498) |
| 0.1 | 2.5 | GO:0010765 | positive regulation of sodium ion transport(GO:0010765) |
| 0.1 | 3.6 | GO:0060765 | regulation of androgen receptor signaling pathway(GO:0060765) |
| 0.1 | 1.1 | GO:0045987 | positive regulation of smooth muscle contraction(GO:0045987) |
| 0.1 | 0.5 | GO:0043587 | tongue morphogenesis(GO:0043587) |
| 0.1 | 3.0 | GO:0048791 | calcium ion-regulated exocytosis of neurotransmitter(GO:0048791) |
| 0.1 | 1.2 | GO:0014887 | muscle hypertrophy in response to stress(GO:0003299) cardiac muscle adaptation(GO:0014887) cardiac muscle hypertrophy in response to stress(GO:0014898) |
| 0.1 | 0.4 | GO:0015888 | thiamine transport(GO:0015888) thiamine transmembrane transport(GO:0071934) |
| 0.1 | 6.9 | GO:0016079 | synaptic vesicle exocytosis(GO:0016079) |
| 0.1 | 1.1 | GO:1905097 | regulation of guanyl-nucleotide exchange factor activity(GO:1905097) |
| 0.1 | 1.6 | GO:0042136 | neurotransmitter biosynthetic process(GO:0042136) |
| 0.1 | 1.2 | GO:0051480 | regulation of cytosolic calcium ion concentration(GO:0051480) |
| 0.1 | 2.8 | GO:0016486 | peptide hormone processing(GO:0016486) |
| 0.1 | 2.8 | GO:0035338 | long-chain fatty-acyl-CoA biosynthetic process(GO:0035338) |
| 0.1 | 0.3 | GO:0014061 | regulation of norepinephrine secretion(GO:0014061) |
| 0.1 | 8.9 | GO:0033275 | muscle filament sliding(GO:0030049) actin-myosin filament sliding(GO:0033275) |
| 0.1 | 0.4 | GO:0001714 | endodermal cell fate specification(GO:0001714) |
| 0.1 | 2.5 | GO:0046597 | negative regulation of viral entry into host cell(GO:0046597) |
| 0.1 | 1.5 | GO:0006937 | regulation of muscle contraction(GO:0006937) |
| 0.1 | 0.7 | GO:0006284 | base-excision repair(GO:0006284) |
| 0.1 | 0.4 | GO:0009183 | purine deoxyribonucleoside diphosphate biosynthetic process(GO:0009183) dGDP metabolic process(GO:0046066) |
| 0.1 | 0.4 | GO:0030327 | prenylated protein catabolic process(GO:0030327) |
| 0.1 | 0.4 | GO:0072553 | terminal button organization(GO:0072553) |
| 0.1 | 1.9 | GO:0046928 | regulation of neurotransmitter secretion(GO:0046928) |
| 0.1 | 0.4 | GO:0051785 | positive regulation of mitotic nuclear division(GO:0045840) positive regulation of nuclear division(GO:0051785) |
| 0.1 | 2.6 | GO:0097659 | nucleic acid-templated transcription(GO:0097659) |
| 0.1 | 0.9 | GO:0071376 | response to corticotropin-releasing hormone(GO:0043435) cellular response to corticotropin-releasing hormone stimulus(GO:0071376) |
| 0.1 | 1.2 | GO:0097186 | amelogenesis(GO:0097186) |
| 0.1 | 0.4 | GO:0055064 | chloride ion homeostasis(GO:0055064) |
| 0.1 | 1.6 | GO:0060271 | cilium morphogenesis(GO:0060271) |
| 0.1 | 3.0 | GO:0045646 | regulation of erythrocyte differentiation(GO:0045646) |
| 0.1 | 1.4 | GO:1903020 | positive regulation of glycoprotein metabolic process(GO:1903020) |
| 0.1 | 0.3 | GO:0048539 | bone marrow development(GO:0048539) |
| 0.1 | 5.6 | GO:0001578 | microtubule bundle formation(GO:0001578) |
| 0.1 | 6.2 | GO:0042147 | retrograde transport, endosome to Golgi(GO:0042147) |
| 0.1 | 1.9 | GO:0070098 | chemokine-mediated signaling pathway(GO:0070098) |
| 0.1 | 8.7 | GO:0000288 | nuclear-transcribed mRNA catabolic process, deadenylation-dependent decay(GO:0000288) |
| 0.1 | 1.0 | GO:0098703 | calcium ion import across plasma membrane(GO:0098703) calcium ion import into cell(GO:1990035) |
| 0.1 | 1.9 | GO:0060325 | face morphogenesis(GO:0060325) |
| 0.1 | 1.6 | GO:0007183 | SMAD protein complex assembly(GO:0007183) |
| 0.1 | 1.1 | GO:0006703 | estrogen biosynthetic process(GO:0006703) |
| 0.1 | 1.2 | GO:2001241 | positive regulation of extrinsic apoptotic signaling pathway in absence of ligand(GO:2001241) |
| 0.1 | 0.3 | GO:0035754 | B cell chemotaxis(GO:0035754) |
| 0.1 | 4.3 | GO:0071805 | cellular potassium ion transport(GO:0071804) potassium ion transmembrane transport(GO:0071805) |
| 0.1 | 0.4 | GO:1903899 | positive regulation of PERK-mediated unfolded protein response(GO:1903899) |
| 0.1 | 0.7 | GO:1900048 | positive regulation of blood coagulation(GO:0030194) positive regulation of coagulation(GO:0050820) positive regulation of hemostasis(GO:1900048) |
| 0.1 | 1.0 | GO:0006662 | glycerol ether metabolic process(GO:0006662) |
| 0.1 | 1.3 | GO:0031670 | cellular response to nutrient(GO:0031670) |
| 0.1 | 0.3 | GO:0006627 | protein processing involved in protein targeting to mitochondrion(GO:0006627) |
| 0.1 | 1.0 | GO:0033198 | response to ATP(GO:0033198) |
| 0.1 | 2.6 | GO:0042596 | behavioral fear response(GO:0001662) behavioral defense response(GO:0002209) fear response(GO:0042596) |
| 0.1 | 0.3 | GO:0001694 | histamine biosynthetic process(GO:0001694) |
| 0.1 | 5.6 | GO:0006749 | glutathione metabolic process(GO:0006749) |
| 0.1 | 0.6 | GO:0032483 | regulation of Rab protein signal transduction(GO:0032483) |
| 0.1 | 5.4 | GO:0030218 | erythrocyte differentiation(GO:0030218) |
| 0.1 | 1.0 | GO:0019800 | peptide cross-linking via chondroitin 4-sulfate glycosaminoglycan(GO:0019800) |
| 0.1 | 0.2 | GO:0046351 | lactose metabolic process(GO:0005988) lactose biosynthetic process(GO:0005989) disaccharide biosynthetic process(GO:0046351) |
| 0.1 | 2.2 | GO:0050852 | T cell receptor signaling pathway(GO:0050852) |
| 0.1 | 3.5 | GO:0006505 | GPI anchor metabolic process(GO:0006505) GPI anchor biosynthetic process(GO:0006506) |
| 0.1 | 2.3 | GO:0030206 | chondroitin sulfate biosynthetic process(GO:0030206) |
| 0.1 | 1.2 | GO:0002076 | osteoblast development(GO:0002076) |
| 0.1 | 0.5 | GO:0035810 | positive regulation of urine volume(GO:0035810) |
| 0.1 | 1.2 | GO:0039702 | viral budding via host ESCRT complex(GO:0039702) |
| 0.1 | 1.9 | GO:0030514 | negative regulation of BMP signaling pathway(GO:0030514) |
| 0.1 | 2.1 | GO:0086010 | membrane depolarization during action potential(GO:0086010) |
| 0.1 | 3.7 | GO:0042073 | intraciliary transport(GO:0042073) |
| 0.1 | 0.9 | GO:0030199 | collagen fibril organization(GO:0030199) |
| 0.1 | 1.2 | GO:0090200 | positive regulation of release of cytochrome c from mitochondria(GO:0090200) |
| 0.1 | 4.5 | GO:0010923 | negative regulation of phosphatase activity(GO:0010923) |
| 0.1 | 0.7 | GO:2000311 | regulation of alpha-amino-3-hydroxy-5-methyl-4-isoxazole propionate selective glutamate receptor activity(GO:2000311) |
| 0.1 | 4.9 | GO:0030574 | collagen catabolic process(GO:0030574) |
| 0.1 | 1.1 | GO:0046676 | negative regulation of insulin secretion(GO:0046676) |
| 0.1 | 0.7 | GO:0060527 | prostate glandular acinus morphogenesis(GO:0060526) prostate epithelial cord arborization involved in prostate glandular acinus morphogenesis(GO:0060527) |
| 0.1 | 3.0 | GO:0015701 | bicarbonate transport(GO:0015701) |
| 0.1 | 2.0 | GO:0042733 | embryonic digit morphogenesis(GO:0042733) |
| 0.1 | 1.3 | GO:0030252 | growth hormone secretion(GO:0030252) |
| 0.1 | 1.8 | GO:0010811 | positive regulation of cell-substrate adhesion(GO:0010811) |
| 0.1 | 0.3 | GO:0030037 | actin filament reorganization involved in cell cycle(GO:0030037) |
| 0.1 | 1.2 | GO:0016576 | histone dephosphorylation(GO:0016576) |
| 0.1 | 1.1 | GO:0048009 | insulin-like growth factor receptor signaling pathway(GO:0048009) |
| 0.1 | 2.0 | GO:0007368 | determination of left/right symmetry(GO:0007368) |
| 0.1 | 1.1 | GO:0050927 | regulation of positive chemotaxis(GO:0050926) positive regulation of positive chemotaxis(GO:0050927) |
| 0.1 | 0.4 | GO:0035095 | behavioral response to nicotine(GO:0035095) |
| 0.1 | 1.0 | GO:0002223 | innate immune response activating cell surface receptor signaling pathway(GO:0002220) stimulatory C-type lectin receptor signaling pathway(GO:0002223) |
| 0.1 | 0.6 | GO:1902916 | positive regulation of protein polyubiquitination(GO:1902916) |
| 0.1 | 1.0 | GO:0045576 | mast cell activation(GO:0045576) |
| 0.1 | 0.8 | GO:0050901 | leukocyte tethering or rolling(GO:0050901) |
| 0.1 | 3.8 | GO:0018105 | peptidyl-serine phosphorylation(GO:0018105) |
| 0.1 | 0.2 | GO:0035811 | negative regulation of urine volume(GO:0035811) |
| 0.1 | 0.4 | GO:0045023 | G0 to G1 transition(GO:0045023) |
| 0.1 | 6.7 | GO:0000187 | activation of MAPK activity(GO:0000187) |
| 0.1 | 0.8 | GO:0043065 | positive regulation of apoptotic process(GO:0043065) |
| 0.1 | 1.6 | GO:0017156 | calcium ion regulated exocytosis(GO:0017156) |
| 0.1 | 0.6 | GO:0034058 | endosomal vesicle fusion(GO:0034058) |
| 0.1 | 2.4 | GO:0071377 | cellular response to glucagon stimulus(GO:0071377) |
| 0.1 | 2.3 | GO:0051965 | positive regulation of synapse assembly(GO:0051965) |
| 0.1 | 0.5 | GO:0006686 | sphingomyelin biosynthetic process(GO:0006686) |
| 0.1 | 1.1 | GO:2000785 | regulation of autophagosome assembly(GO:2000785) |
| 0.1 | 0.2 | GO:0060088 | auditory receptor cell morphogenesis(GO:0002093) auditory receptor cell stereocilium organization(GO:0060088) |
| 0.1 | 1.0 | GO:0090286 | cytoskeletal anchoring at nuclear membrane(GO:0090286) |
| 0.1 | 0.6 | GO:0045639 | positive regulation of myeloid cell differentiation(GO:0045639) |
| 0.1 | 0.6 | GO:0047484 | regulation of response to osmotic stress(GO:0047484) |
| 0.1 | 0.7 | GO:0003094 | glomerular filtration(GO:0003094) renal filtration(GO:0097205) |
| 0.1 | 0.4 | GO:0038042 | dimeric G-protein coupled receptor signaling pathway(GO:0038042) |
| 0.1 | 0.6 | GO:0032060 | bleb assembly(GO:0032060) |
| 0.1 | 1.1 | GO:0000301 | retrograde transport, vesicle recycling within Golgi(GO:0000301) |
| 0.1 | 0.3 | GO:0045839 | negative regulation of mitotic nuclear division(GO:0045839) negative regulation of nuclear division(GO:0051784) |
| 0.1 | 0.8 | GO:0006897 | endocytosis(GO:0006897) |
| 0.1 | 0.6 | GO:0070208 | protein heterotrimerization(GO:0070208) |
| 0.1 | 0.5 | GO:0039536 | negative regulation of RIG-I signaling pathway(GO:0039536) |
| 0.1 | 0.7 | GO:0033622 | integrin activation(GO:0033622) |
| 0.1 | 0.6 | GO:0019388 | galactose catabolic process(GO:0019388) |
| 0.1 | 0.2 | GO:0035511 | oxidative DNA demethylation(GO:0035511) |
| 0.1 | 0.6 | GO:0060326 | cell chemotaxis(GO:0060326) |
| 0.1 | 0.8 | GO:0006491 | N-glycan processing(GO:0006491) |
| 0.1 | 4.2 | GO:1903955 | positive regulation of protein targeting to mitochondrion(GO:1903955) |
| 0.1 | 0.3 | GO:0032703 | negative regulation of interleukin-2 production(GO:0032703) |
| 0.1 | 1.0 | GO:0006068 | ethanol catabolic process(GO:0006068) |
| 0.1 | 0.4 | GO:0050982 | detection of mechanical stimulus(GO:0050982) |
| 0.1 | 2.1 | GO:0008585 | female gonad development(GO:0008585) development of primary female sexual characteristics(GO:0046545) |
| 0.0 | 0.9 | GO:0045824 | negative regulation of innate immune response(GO:0045824) |
| 0.0 | 0.6 | GO:0072337 | modified amino acid transport(GO:0072337) |
| 0.0 | 2.1 | GO:0042100 | B cell proliferation(GO:0042100) |
| 0.0 | 0.7 | GO:0031648 | protein destabilization(GO:0031648) |
| 0.0 | 0.2 | GO:0007603 | phototransduction, visible light(GO:0007603) |
| 0.0 | 1.3 | GO:0018149 | peptide cross-linking(GO:0018149) |
| 0.0 | 0.7 | GO:0048512 | circadian behavior(GO:0048512) |
| 0.0 | 1.9 | GO:0008366 | ensheathment of neurons(GO:0007272) axon ensheathment(GO:0008366) |
| 0.0 | 0.9 | GO:0002687 | positive regulation of leukocyte migration(GO:0002687) |
| 0.0 | 0.8 | GO:0042438 | melanin metabolic process(GO:0006582) melanin biosynthetic process(GO:0042438) |
| 0.0 | 0.4 | GO:0036507 | protein demannosylation(GO:0036507) protein alpha-1,2-demannosylation(GO:0036508) |
| 0.0 | 2.0 | GO:0050911 | detection of chemical stimulus involved in sensory perception of smell(GO:0050911) |
| 0.0 | 0.3 | GO:0009887 | organ morphogenesis(GO:0009887) |
| 0.0 | 0.3 | GO:0016973 | poly(A)+ mRNA export from nucleus(GO:0016973) |
| 0.0 | 2.9 | GO:1990830 | response to leukemia inhibitory factor(GO:1990823) cellular response to leukemia inhibitory factor(GO:1990830) |
| 0.0 | 0.7 | GO:0043984 | histone H4-K16 acetylation(GO:0043984) |
| 0.0 | 0.3 | GO:0032968 | positive regulation of transcription elongation from RNA polymerase II promoter(GO:0032968) |
| 0.0 | 0.6 | GO:0010165 | response to X-ray(GO:0010165) |
| 0.0 | 0.8 | GO:0003382 | epithelial cell morphogenesis(GO:0003382) |
| 0.0 | 0.8 | GO:0045921 | positive regulation of exocytosis(GO:0045921) |
| 0.0 | 0.1 | GO:0048289 | T-helper 1 cell lineage commitment(GO:0002296) isotype switching to IgE isotypes(GO:0048289) regulation of isotype switching to IgE isotypes(GO:0048293) positive regulation of isotype switching to IgE isotypes(GO:0048295) |
| 0.0 | 0.2 | GO:0045730 | respiratory burst(GO:0045730) |
| 0.0 | 0.7 | GO:0048384 | retinoic acid receptor signaling pathway(GO:0048384) |
| 0.0 | 0.1 | GO:0036148 | phosphatidylglycerol acyl-chain remodeling(GO:0036148) |
| 0.0 | 0.6 | GO:0060334 | regulation of interferon-gamma-mediated signaling pathway(GO:0060334) |
| 0.0 | 1.8 | GO:0046854 | phosphatidylinositol phosphorylation(GO:0046854) |
| 0.0 | 0.5 | GO:0034204 | lipid translocation(GO:0034204) phospholipid translocation(GO:0045332) |
| 0.0 | 0.1 | GO:0044210 | 'de novo' CTP biosynthetic process(GO:0044210) |
| 0.0 | 0.4 | GO:0030318 | melanocyte differentiation(GO:0030318) |
| 0.0 | 0.3 | GO:1901841 | regulation of high voltage-gated calcium channel activity(GO:1901841) |
| 0.0 | 1.3 | GO:0019722 | calcium-mediated signaling(GO:0019722) |
| 0.0 | 0.3 | GO:0072431 | DNA damage response, signal transduction by p53 class mediator resulting in cell cycle arrest(GO:0006977) signal transduction involved in mitotic cell cycle checkpoint(GO:0072413) signal transduction involved in mitotic G1 DNA damage checkpoint(GO:0072431) intracellular signal transduction involved in G1 DNA damage checkpoint(GO:1902400) signal transduction involved in mitotic DNA damage checkpoint(GO:1902402) signal transduction involved in mitotic DNA integrity checkpoint(GO:1902403) |
| 0.0 | 0.7 | GO:0006378 | mRNA polyadenylation(GO:0006378) |
| 0.0 | 1.5 | GO:1902476 | chloride transmembrane transport(GO:1902476) |
| 0.0 | 0.1 | GO:2000109 | regulation of macrophage apoptotic process(GO:2000109) |
| 0.0 | 0.1 | GO:0070164 | negative regulation of adiponectin secretion(GO:0070164) |
| 0.0 | 0.7 | GO:0070897 | DNA-templated transcriptional preinitiation complex assembly(GO:0070897) |
| 0.0 | 0.4 | GO:0007020 | microtubule nucleation(GO:0007020) |
| 0.0 | 0.6 | GO:0042472 | inner ear morphogenesis(GO:0042472) |
| 0.0 | 0.3 | GO:0034113 | heterotypic cell-cell adhesion(GO:0034113) |
| 0.0 | 0.5 | GO:0048515 | spermatid development(GO:0007286) spermatid differentiation(GO:0048515) |
| 0.0 | 0.1 | GO:0046146 | tetrahydrobiopterin biosynthetic process(GO:0006729) tetrahydrobiopterin metabolic process(GO:0046146) |
| 0.0 | 0.8 | GO:0015718 | monocarboxylic acid transport(GO:0015718) |
| 0.0 | 0.1 | GO:0040015 | negative regulation of multicellular organism growth(GO:0040015) |
| 0.0 | 0.5 | GO:0006611 | protein export from nucleus(GO:0006611) |
| 0.0 | 0.2 | GO:0072488 | ammonium transmembrane transport(GO:0072488) |
| 0.0 | 0.1 | GO:0008286 | insulin receptor signaling pathway(GO:0008286) |
| 0.0 | 0.0 | GO:0008343 | adult feeding behavior(GO:0008343) |
Gene overrepresentation in cellular_component category:
| Log-likelihood per target | Total log-likelihood | Term | Description |
|---|---|---|---|
| 4.6 | 13.8 | GO:0020003 | symbiont-containing vacuole(GO:0020003) symbiont-containing vacuole membrane(GO:0020005) |
| 3.6 | 14.5 | GO:0031838 | haptoglobin-hemoglobin complex(GO:0031838) |
| 3.2 | 9.6 | GO:0019008 | molybdopterin synthase complex(GO:0019008) |
| 3.0 | 8.9 | GO:0071745 | IgA immunoglobulin complex(GO:0071745) IgA immunoglobulin complex, circulating(GO:0071746) monomeric IgA immunoglobulin complex(GO:0071748) polymeric IgA immunoglobulin complex(GO:0071749) secretory IgA immunoglobulin complex(GO:0071751) |
| 2.4 | 12.0 | GO:0005947 | mitochondrial alpha-ketoglutarate dehydrogenase complex(GO:0005947) |
| 2.0 | 16.4 | GO:0034363 | intermediate-density lipoprotein particle(GO:0034363) |
| 2.0 | 6.1 | GO:0016222 | procollagen-proline 4-dioxygenase complex(GO:0016222) |
| 2.0 | 29.6 | GO:0030478 | actin cap(GO:0030478) |
| 1.9 | 16.7 | GO:0005579 | membrane attack complex(GO:0005579) |
| 1.8 | 5.3 | GO:0097059 | CNTFR-CLCF1 complex(GO:0097059) |
| 1.7 | 3.4 | GO:0005965 | protein farnesyltransferase complex(GO:0005965) |
| 1.6 | 9.5 | GO:0097433 | dense body(GO:0097433) |
| 1.6 | 7.8 | GO:0045298 | tubulin complex(GO:0045298) |
| 1.5 | 6.1 | GO:0071062 | rough endoplasmic reticulum lumen(GO:0048237) alphav-beta3 integrin-vitronectin complex(GO:0071062) |
| 1.5 | 8.8 | GO:0009331 | glycerol-3-phosphate dehydrogenase complex(GO:0009331) |
| 1.3 | 12.7 | GO:0034366 | spherical high-density lipoprotein particle(GO:0034366) |
| 1.2 | 3.7 | GO:0005953 | CAAX-protein geranylgeranyltransferase complex(GO:0005953) |
| 1.2 | 4.9 | GO:0030485 | smooth muscle contractile fiber(GO:0030485) |
| 1.2 | 4.8 | GO:1990745 | EARP complex(GO:1990745) |
| 1.2 | 17.9 | GO:0042627 | chylomicron(GO:0042627) |
| 1.1 | 4.3 | GO:0042567 | insulin-like growth factor ternary complex(GO:0042567) |
| 1.1 | 5.3 | GO:0005899 | insulin receptor complex(GO:0005899) |
| 1.0 | 1.0 | GO:0061689 | tricellular tight junction(GO:0061689) |
| 1.0 | 2.9 | GO:0071065 | alpha9-beta1 integrin-vascular cell adhesion molecule-1 complex(GO:0071065) |
| 0.9 | 110.6 | GO:0031093 | platelet alpha granule lumen(GO:0031093) |
| 0.9 | 3.8 | GO:0038038 | G-protein coupled receptor homodimeric complex(GO:0038038) |
| 0.9 | 2.8 | GO:0072563 | endothelial microparticle(GO:0072563) |
| 0.9 | 4.6 | GO:0071008 | U2-type post-mRNA release spliceosomal complex(GO:0071008) |
| 0.9 | 3.6 | GO:0005967 | mitochondrial pyruvate dehydrogenase complex(GO:0005967) |
| 0.9 | 4.3 | GO:0043527 | tRNA methyltransferase complex(GO:0043527) |
| 0.8 | 14.3 | GO:0031095 | platelet dense tubular network membrane(GO:0031095) |
| 0.8 | 5.7 | GO:0036021 | endolysosome lumen(GO:0036021) |
| 0.8 | 3.2 | GO:0034751 | aryl hydrocarbon receptor complex(GO:0034751) |
| 0.8 | 4.0 | GO:0036398 | TCR signalosome(GO:0036398) |
| 0.8 | 3.2 | GO:0032937 | SREBP-SCAP-Insig complex(GO:0032937) |
| 0.8 | 3.2 | GO:0043293 | apoptosome(GO:0043293) |
| 0.8 | 19.7 | GO:0008074 | guanylate cyclase complex, soluble(GO:0008074) |
| 0.8 | 13.9 | GO:0005922 | connexon complex(GO:0005922) |
| 0.7 | 8.9 | GO:0005642 | annulate lamellae(GO:0005642) |
| 0.7 | 8.9 | GO:0005744 | mitochondrial inner membrane presequence translocase complex(GO:0005744) |
| 0.7 | 2.8 | GO:1990031 | pinceau fiber(GO:1990031) |
| 0.7 | 5.6 | GO:0097504 | Gemini of coiled bodies(GO:0097504) |
| 0.7 | 3.5 | GO:0089701 | U2AF(GO:0089701) |
| 0.7 | 13.7 | GO:0005890 | sodium:potassium-exchanging ATPase complex(GO:0005890) |
| 0.7 | 11.6 | GO:0030014 | CCR4-NOT complex(GO:0030014) |
| 0.7 | 32.0 | GO:0042571 | immunoglobulin complex, circulating(GO:0042571) |
| 0.7 | 8.1 | GO:0099634 | postsynaptic specialization membrane(GO:0099634) |
| 0.7 | 3.3 | GO:0005594 | collagen type IX trimer(GO:0005594) |
| 0.7 | 1.3 | GO:0097058 | CRLF-CLCF1 complex(GO:0097058) |
| 0.6 | 3.2 | GO:0071546 | pi-body(GO:0071546) |
| 0.6 | 4.4 | GO:0019815 | B cell receptor complex(GO:0019815) |
| 0.6 | 3.7 | GO:0005927 | muscle tendon junction(GO:0005927) |
| 0.6 | 9.8 | GO:0097512 | cardiac myofibril(GO:0097512) |
| 0.6 | 7.2 | GO:0031906 | late endosome lumen(GO:0031906) |
| 0.6 | 9.6 | GO:0031089 | platelet dense granule lumen(GO:0031089) |
| 0.6 | 7.1 | GO:0043190 | ATP-binding cassette (ABC) transporter complex(GO:0043190) |
| 0.6 | 1.8 | GO:0097440 | apical dendrite(GO:0097440) |
| 0.6 | 4.1 | GO:0097209 | epidermal lamellar body(GO:0097209) |
| 0.6 | 2.3 | GO:0033596 | TSC1-TSC2 complex(GO:0033596) |
| 0.6 | 1.7 | GO:0060187 | cell pole(GO:0060187) |
| 0.6 | 2.8 | GO:0031232 | extrinsic component of external side of plasma membrane(GO:0031232) |
| 0.6 | 2.2 | GO:0046696 | lipopolysaccharide receptor complex(GO:0046696) |
| 0.5 | 3.3 | GO:0097129 | cyclin D2-CDK4 complex(GO:0097129) |
| 0.5 | 2.2 | GO:0070044 | synaptobrevin 2-SNAP-25-syntaxin-1a-complexin I complex(GO:0070032) synaptobrevin 2-SNAP-25-syntaxin-1a complex(GO:0070044) |
| 0.5 | 5.8 | GO:0033018 | sarcoplasmic reticulum lumen(GO:0033018) |
| 0.5 | 3.7 | GO:0000813 | ESCRT I complex(GO:0000813) |
| 0.5 | 2.1 | GO:0048787 | presynaptic active zone membrane(GO:0048787) |
| 0.5 | 7.9 | GO:0031362 | anchored component of external side of plasma membrane(GO:0031362) |
| 0.5 | 17.0 | GO:0005901 | caveola(GO:0005901) |
| 0.5 | 5.6 | GO:0032045 | guanyl-nucleotide exchange factor complex(GO:0032045) |
| 0.5 | 11.6 | GO:0044298 | neuronal cell body membrane(GO:0032809) cell body membrane(GO:0044298) |
| 0.4 | 6.6 | GO:0046930 | pore complex(GO:0046930) |
| 0.4 | 2.6 | GO:1990769 | proximal neuron projection(GO:1990769) |
| 0.4 | 7.4 | GO:0031904 | endosome lumen(GO:0031904) |
| 0.4 | 7.3 | GO:0001518 | voltage-gated sodium channel complex(GO:0001518) |
| 0.4 | 6.4 | GO:0000124 | SAGA complex(GO:0000124) |
| 0.4 | 5.1 | GO:0031045 | dense core granule(GO:0031045) |
| 0.4 | 3.4 | GO:0071664 | catenin-TCF7L2 complex(GO:0071664) |
| 0.4 | 3.8 | GO:0044327 | dendritic spine head(GO:0044327) |
| 0.4 | 4.5 | GO:0042788 | polysomal ribosome(GO:0042788) |
| 0.4 | 2.5 | GO:0030991 | intraciliary transport particle A(GO:0030991) |
| 0.4 | 8.1 | GO:0005861 | troponin complex(GO:0005861) |
| 0.4 | 28.4 | GO:0034707 | chloride channel complex(GO:0034707) |
| 0.4 | 3.2 | GO:0033391 | chromatoid body(GO:0033391) |
| 0.4 | 4.8 | GO:1990712 | HFE-transferrin receptor complex(GO:1990712) |
| 0.4 | 3.0 | GO:0035068 | micro-ribonucleoprotein complex(GO:0035068) |
| 0.4 | 4.8 | GO:0097227 | sperm annulus(GO:0097227) |
| 0.4 | 2.8 | GO:0036057 | filtration diaphragm(GO:0036056) slit diaphragm(GO:0036057) |
| 0.3 | 2.1 | GO:1990682 | CSF1-CSF1R complex(GO:1990682) |
| 0.3 | 2.8 | GO:0045179 | apical cortex(GO:0045179) |
| 0.3 | 3.4 | GO:0008024 | cyclin/CDK positive transcription elongation factor complex(GO:0008024) |
| 0.3 | 2.0 | GO:0032010 | phagolysosome(GO:0032010) |
| 0.3 | 2.3 | GO:0097418 | neurofibrillary tangle(GO:0097418) |
| 0.3 | 1.6 | GO:0032021 | NELF complex(GO:0032021) |
| 0.3 | 11.7 | GO:0035580 | specific granule lumen(GO:0035580) |
| 0.3 | 4.3 | GO:0005751 | mitochondrial respiratory chain complex IV(GO:0005751) |
| 0.3 | 4.3 | GO:0036038 | MKS complex(GO:0036038) |
| 0.3 | 2.4 | GO:0098845 | postsynaptic endosome(GO:0098845) |
| 0.3 | 4.7 | GO:0031616 | spindle pole centrosome(GO:0031616) |
| 0.3 | 2.3 | GO:0005587 | collagen type IV trimer(GO:0005587) |
| 0.3 | 2.3 | GO:0002080 | acrosomal membrane(GO:0002080) |
| 0.3 | 7.1 | GO:0097381 | photoreceptor disc membrane(GO:0097381) |
| 0.3 | 3.1 | GO:0016602 | CCAAT-binding factor complex(GO:0016602) |
| 0.3 | 1.1 | GO:0032777 | Piccolo NuA4 histone acetyltransferase complex(GO:0032777) |
| 0.3 | 1.6 | GO:0005958 | DNA-dependent protein kinase-DNA ligase 4 complex(GO:0005958) DNA ligase IV complex(GO:0032807) |
| 0.3 | 3.1 | GO:0032591 | dendritic spine membrane(GO:0032591) |
| 0.3 | 4.3 | GO:0034663 | endoplasmic reticulum chaperone complex(GO:0034663) |
| 0.3 | 2.0 | GO:1990023 | mitotic spindle midzone(GO:1990023) |
| 0.2 | 1.0 | GO:0032279 | asymmetric synapse(GO:0032279) |
| 0.2 | 1.2 | GO:0000836 | Hrd1p ubiquitin ligase complex(GO:0000836) |
| 0.2 | 0.7 | GO:0005674 | transcription factor TFIIF complex(GO:0005674) |
| 0.2 | 2.7 | GO:0043083 | synaptic cleft(GO:0043083) |
| 0.2 | 4.4 | GO:0097225 | sperm midpiece(GO:0097225) |
| 0.2 | 0.5 | GO:0044614 | nuclear pore cytoplasmic filaments(GO:0044614) |
| 0.2 | 2.6 | GO:0005614 | interstitial matrix(GO:0005614) |
| 0.2 | 2.3 | GO:0043205 | microfibril(GO:0001527) fibril(GO:0043205) |
| 0.2 | 26.8 | GO:0005796 | Golgi lumen(GO:0005796) |
| 0.2 | 0.7 | GO:0005593 | FACIT collagen trimer(GO:0005593) |
| 0.2 | 2.4 | GO:0030285 | integral component of synaptic vesicle membrane(GO:0030285) intrinsic component of synaptic vesicle membrane(GO:0098563) |
| 0.2 | 4.5 | GO:0034045 | pre-autophagosomal structure membrane(GO:0034045) |
| 0.2 | 4.3 | GO:0016281 | eukaryotic translation initiation factor 4F complex(GO:0016281) |
| 0.2 | 1.1 | GO:0070971 | endoplasmic reticulum exit site(GO:0070971) |
| 0.2 | 9.7 | GO:0008305 | integrin complex(GO:0008305) |
| 0.2 | 3.5 | GO:0044224 | juxtaparanode region of axon(GO:0044224) |
| 0.2 | 11.2 | GO:0005891 | voltage-gated calcium channel complex(GO:0005891) |
| 0.2 | 4.5 | GO:0071141 | SMAD protein complex(GO:0071141) |
| 0.2 | 1.2 | GO:0000138 | Golgi trans cisterna(GO:0000138) |
| 0.2 | 5.4 | GO:0016328 | lateral plasma membrane(GO:0016328) |
| 0.2 | 1.0 | GO:0032541 | cortical endoplasmic reticulum(GO:0032541) |
| 0.2 | 4.5 | GO:0005581 | collagen trimer(GO:0005581) |
| 0.2 | 1.4 | GO:0043203 | axon hillock(GO:0043203) |
| 0.2 | 4.9 | GO:0071565 | nBAF complex(GO:0071565) |
| 0.2 | 0.2 | GO:0002139 | stereocilia coupling link(GO:0002139) |
| 0.2 | 1.4 | GO:0035253 | ciliary rootlet(GO:0035253) |
| 0.2 | 2.5 | GO:0043194 | axon initial segment(GO:0043194) |
| 0.2 | 6.2 | GO:0000795 | synaptonemal complex(GO:0000795) |
| 0.2 | 9.5 | GO:0016235 | aggresome(GO:0016235) |
| 0.2 | 1.8 | GO:0097431 | mitotic spindle pole(GO:0097431) |
| 0.2 | 3.4 | GO:0005942 | phosphatidylinositol 3-kinase complex(GO:0005942) |
| 0.2 | 1.9 | GO:0044666 | MLL3/4 complex(GO:0044666) |
| 0.2 | 1.2 | GO:1990635 | proximal dendrite(GO:1990635) |
| 0.2 | 11.5 | GO:1904724 | tertiary granule lumen(GO:1904724) |
| 0.2 | 1.9 | GO:0016461 | unconventional myosin complex(GO:0016461) |
| 0.2 | 1.2 | GO:0097524 | sperm plasma membrane(GO:0097524) |
| 0.2 | 9.4 | GO:0031907 | peroxisomal matrix(GO:0005782) microbody lumen(GO:0031907) |
| 0.2 | 0.8 | GO:0044214 | spanning component of plasma membrane(GO:0044214) spanning component of membrane(GO:0089717) |
| 0.2 | 5.8 | GO:0030173 | integral component of Golgi membrane(GO:0030173) |
| 0.2 | 14.6 | GO:0005776 | autophagosome(GO:0005776) |
| 0.2 | 3.3 | GO:0070461 | SAGA-type complex(GO:0070461) |
| 0.2 | 10.2 | GO:0101003 | ficolin-1-rich granule membrane(GO:0101003) |
| 0.2 | 4.6 | GO:0035327 | transcriptionally active chromatin(GO:0035327) |
| 0.2 | 1.8 | GO:0044615 | nuclear pore nuclear basket(GO:0044615) |
| 0.2 | 19.6 | GO:0031225 | anchored component of membrane(GO:0031225) |
| 0.2 | 1.6 | GO:0045009 | melanosome membrane(GO:0033162) chitosome(GO:0045009) |
| 0.2 | 2.3 | GO:0031254 | uropod(GO:0001931) cell trailing edge(GO:0031254) |
| 0.2 | 0.3 | GO:0005826 | actomyosin contractile ring(GO:0005826) |
| 0.2 | 18.8 | GO:0005578 | proteinaceous extracellular matrix(GO:0005578) |
| 0.2 | 1.1 | GO:0061700 | GATOR2 complex(GO:0061700) |
| 0.1 | 1.0 | GO:0042584 | chromaffin granule membrane(GO:0042584) |
| 0.1 | 5.8 | GO:0097546 | ciliary base(GO:0097546) |
| 0.1 | 3.6 | GO:0009925 | basal plasma membrane(GO:0009925) |
| 0.1 | 19.5 | GO:0008021 | synaptic vesicle(GO:0008021) |
| 0.1 | 5.8 | GO:0001533 | cornified envelope(GO:0001533) |
| 0.1 | 6.6 | GO:0005801 | cis-Golgi network(GO:0005801) |
| 0.1 | 4.2 | GO:0042629 | mast cell granule(GO:0042629) |
| 0.1 | 6.3 | GO:0043195 | terminal bouton(GO:0043195) |
| 0.1 | 1.7 | GO:0032590 | dendrite membrane(GO:0032590) |
| 0.1 | 1.6 | GO:0031092 | platelet alpha granule membrane(GO:0031092) |
| 0.1 | 17.5 | GO:0098793 | presynapse(GO:0098793) |
| 0.1 | 2.5 | GO:0005862 | muscle thin filament tropomyosin(GO:0005862) |
| 0.1 | 181.7 | GO:0005615 | extracellular space(GO:0005615) |
| 0.1 | 6.5 | GO:0005811 | lipid particle(GO:0005811) |
| 0.1 | 3.6 | GO:0043679 | axon terminus(GO:0043679) |
| 0.1 | 6.1 | GO:0001750 | photoreceptor outer segment(GO:0001750) |
| 0.1 | 6.2 | GO:0009897 | external side of plasma membrane(GO:0009897) |
| 0.1 | 0.7 | GO:0002177 | manchette(GO:0002177) |
| 0.1 | 1.3 | GO:0032589 | neuron projection membrane(GO:0032589) |
| 0.1 | 0.6 | GO:0033263 | CORVET complex(GO:0033263) |
| 0.1 | 0.5 | GO:0000408 | EKC/KEOPS complex(GO:0000408) |
| 0.1 | 0.7 | GO:0072487 | MSL complex(GO:0072487) |
| 0.1 | 2.4 | GO:0005689 | U12-type spliceosomal complex(GO:0005689) |
| 0.1 | 0.9 | GO:0097197 | tetraspanin-enriched microdomain(GO:0097197) |
| 0.1 | 10.9 | GO:0055037 | recycling endosome(GO:0055037) |
| 0.1 | 1.9 | GO:0031201 | SNARE complex(GO:0031201) |
| 0.1 | 0.9 | GO:0031464 | Cul4A-RING E3 ubiquitin ligase complex(GO:0031464) |
| 0.1 | 1.6 | GO:0043235 | receptor complex(GO:0043235) |
| 0.1 | 2.2 | GO:0031231 | integral component of peroxisomal membrane(GO:0005779) intrinsic component of peroxisomal membrane(GO:0031231) |
| 0.1 | 3.6 | GO:0002102 | podosome(GO:0002102) |
| 0.1 | 14.8 | GO:0001726 | ruffle(GO:0001726) |
| 0.1 | 6.5 | GO:0008076 | voltage-gated potassium channel complex(GO:0008076) potassium channel complex(GO:0034705) |
| 0.1 | 1.0 | GO:0034992 | microtubule organizing center attachment site(GO:0034992) LINC complex(GO:0034993) |
| 0.1 | 1.2 | GO:0030665 | clathrin-coated vesicle membrane(GO:0030665) |
| 0.1 | 9.9 | GO:0016605 | PML body(GO:0016605) |
| 0.1 | 3.1 | GO:0000791 | euchromatin(GO:0000791) |
| 0.1 | 13.6 | GO:0005741 | mitochondrial outer membrane(GO:0005741) |
| 0.1 | 3.3 | GO:0030666 | endocytic vesicle membrane(GO:0030666) |
| 0.1 | 4.1 | GO:0043204 | perikaryon(GO:0043204) |
| 0.1 | 1.4 | GO:0033116 | endoplasmic reticulum-Golgi intermediate compartment membrane(GO:0033116) |
| 0.1 | 2.3 | GO:0005913 | cell-cell adherens junction(GO:0005913) |
| 0.1 | 0.9 | GO:0035102 | PRC1 complex(GO:0035102) |
| 0.1 | 1.2 | GO:0005885 | Arp2/3 protein complex(GO:0005885) |
| 0.1 | 0.2 | GO:0033565 | ESCRT-0 complex(GO:0033565) |
| 0.1 | 0.4 | GO:1903440 | calcitonin family receptor complex(GO:1903439) amylin receptor complex(GO:1903440) |
| 0.1 | 0.9 | GO:0017119 | Golgi transport complex(GO:0017119) |
| 0.1 | 90.4 | GO:0031226 | intrinsic component of plasma membrane(GO:0031226) |
| 0.1 | 0.4 | GO:0036513 | Derlin-1 retrotranslocation complex(GO:0036513) |
| 0.1 | 4.3 | GO:0016324 | apical plasma membrane(GO:0016324) |
| 0.1 | 5.2 | GO:0005788 | endoplasmic reticulum lumen(GO:0005788) |
| 0.1 | 1.1 | GO:0080008 | Cul4-RING E3 ubiquitin ligase complex(GO:0080008) |
| 0.0 | 1.8 | GO:0030133 | transport vesicle(GO:0030133) |
| 0.0 | 0.7 | GO:0043218 | compact myelin(GO:0043218) |
| 0.0 | 0.2 | GO:1990037 | Lewy body core(GO:1990037) |
| 0.0 | 1.3 | GO:0090545 | NuRD complex(GO:0016581) CHD-type complex(GO:0090545) |
| 0.0 | 1.0 | GO:0005778 | peroxisomal membrane(GO:0005778) microbody membrane(GO:0031903) |
| 0.0 | 0.4 | GO:0061574 | ASAP complex(GO:0061574) |
| 0.0 | 5.0 | GO:0000922 | spindle pole(GO:0000922) |
| 0.0 | 0.7 | GO:0005682 | U5 snRNP(GO:0005682) |
| 0.0 | 5.0 | GO:0019898 | extrinsic component of membrane(GO:0019898) |
| 0.0 | 1.6 | GO:0000123 | histone acetyltransferase complex(GO:0000123) |
| 0.0 | 0.5 | GO:0005902 | microvillus(GO:0005902) |
| 0.0 | 2.3 | GO:0005769 | early endosome(GO:0005769) |
| 0.0 | 1.5 | GO:0005770 | late endosome(GO:0005770) |
| 0.0 | 0.2 | GO:0000242 | pericentriolar material(GO:0000242) |
| 0.0 | 0.1 | GO:0035985 | senescence-associated heterochromatin focus(GO:0035985) |
| 0.0 | 7.8 | GO:0000139 | Golgi membrane(GO:0000139) |
| 0.0 | 1.2 | GO:0000932 | cytoplasmic mRNA processing body(GO:0000932) |
Gene overrepresentation in molecular_function category:
| Log-likelihood per target | Total log-likelihood | Term | Description |
|---|---|---|---|
| 4.8 | 14.4 | GO:0008330 | protein tyrosine/threonine phosphatase activity(GO:0008330) |
| 4.6 | 13.8 | GO:0035379 | carbon dioxide transmembrane transporter activity(GO:0035379) |
| 3.7 | 11.0 | GO:0001596 | angiotensin type I receptor activity(GO:0001596) |
| 3.6 | 10.9 | GO:0035662 | Toll-like receptor 4 binding(GO:0035662) |
| 3.1 | 12.3 | GO:0008431 | vitamin E binding(GO:0008431) |
| 2.9 | 11.8 | GO:0008940 | nitrate reductase activity(GO:0008940) |
| 2.9 | 5.7 | GO:0015111 | iodide transmembrane transporter activity(GO:0015111) |
| 2.8 | 8.4 | GO:0003826 | alpha-ketoacid dehydrogenase activity(GO:0003826) 3-methyl-2-oxobutanoate dehydrogenase (2-methylpropanoyl-transferring) activity(GO:0003863) |
| 2.6 | 7.9 | GO:0086062 | voltage-gated sodium channel activity involved in Purkinje myocyte action potential(GO:0086062) |
| 2.5 | 15.3 | GO:0003917 | DNA topoisomerase type I activity(GO:0003917) |
| 2.5 | 10.1 | GO:0070653 | high-density lipoprotein particle receptor binding(GO:0070653) |
| 2.5 | 10.0 | GO:0004667 | prostaglandin-D synthase activity(GO:0004667) |
| 2.5 | 29.6 | GO:0045159 | myosin II binding(GO:0045159) |
| 2.4 | 14.5 | GO:0030492 | hemoglobin binding(GO:0030492) |
| 2.4 | 7.1 | GO:0015439 | heme-transporting ATPase activity(GO:0015439) |
| 2.4 | 19.0 | GO:0008131 | primary amine oxidase activity(GO:0008131) |
| 2.3 | 13.9 | GO:0004792 | thiosulfate sulfurtransferase activity(GO:0004792) |
| 2.2 | 13.4 | GO:0060228 | phosphatidylcholine-sterol O-acyltransferase activator activity(GO:0060228) |
| 2.2 | 11.1 | GO:0060230 | lipoprotein lipase activator activity(GO:0060230) |
| 2.1 | 10.5 | GO:0047374 | methylumbelliferyl-acetate deacetylase activity(GO:0047374) |
| 2.1 | 10.4 | GO:0004668 | protein-arginine deiminase activity(GO:0004668) |
| 2.1 | 10.4 | GO:0046912 | transferase activity, transferring acyl groups, acyl groups converted into alkyl on transfer(GO:0046912) |
| 2.0 | 6.1 | GO:0050501 | hyaluronan synthase activity(GO:0050501) |
| 2.0 | 6.1 | GO:0015189 | L-lysine transmembrane transporter activity(GO:0015189) |
| 2.0 | 10.0 | GO:0008113 | peptide-methionine (S)-S-oxide reductase activity(GO:0008113) |
| 2.0 | 7.9 | GO:0061714 | folic acid receptor activity(GO:0061714) |
| 2.0 | 5.9 | GO:0008386 | cholesterol monooxygenase (side-chain-cleaving) activity(GO:0008386) |
| 2.0 | 13.7 | GO:0048403 | brain-derived neurotrophic factor binding(GO:0048403) |
| 2.0 | 5.9 | GO:0004938 | alpha2-adrenergic receptor activity(GO:0004938) |
| 2.0 | 7.8 | GO:0099609 | microtubule lateral binding(GO:0099609) |
| 1.9 | 7.7 | GO:0004740 | pyruvate dehydrogenase (acetyl-transferring) kinase activity(GO:0004740) |
| 1.9 | 7.5 | GO:0030899 | calcium-dependent ATPase activity(GO:0030899) |
| 1.7 | 26.1 | GO:0005229 | intracellular calcium activated chloride channel activity(GO:0005229) |
| 1.7 | 8.7 | GO:0004995 | tachykinin receptor activity(GO:0004995) |
| 1.7 | 3.4 | GO:0004660 | protein farnesyltransferase activity(GO:0004660) |
| 1.7 | 13.7 | GO:0016713 | oxidoreductase activity, acting on paired donors, with incorporation or reduction of molecular oxygen, reduced iron-sulfur protein as one donor, and incorporation of one atom of oxygen(GO:0016713) |
| 1.7 | 5.1 | GO:1904288 | BAT3 complex binding(GO:1904288) |
| 1.7 | 5.0 | GO:0004961 | thromboxane receptor activity(GO:0004960) thromboxane A2 receptor activity(GO:0004961) |
| 1.6 | 6.5 | GO:0004657 | proline dehydrogenase activity(GO:0004657) |
| 1.6 | 8.1 | GO:0015204 | urea transmembrane transporter activity(GO:0015204) |
| 1.5 | 4.6 | GO:0016603 | glutaminyl-peptide cyclotransferase activity(GO:0016603) |
| 1.5 | 4.6 | GO:0004832 | valine-tRNA ligase activity(GO:0004832) |
| 1.5 | 4.6 | GO:0004103 | choline kinase activity(GO:0004103) |
| 1.5 | 6.1 | GO:0051120 | hepoxilin A3 synthase activity(GO:0051120) |
| 1.5 | 3.0 | GO:0050473 | arachidonate 15-lipoxygenase activity(GO:0050473) |
| 1.5 | 7.4 | GO:0004359 | glutaminase activity(GO:0004359) |
| 1.5 | 5.9 | GO:0004782 | sulfinoalanine decarboxylase activity(GO:0004782) |
| 1.5 | 8.8 | GO:0015185 | gamma-aminobutyric acid:sodium symporter activity(GO:0005332) gamma-aminobutyric acid transmembrane transporter activity(GO:0015185) |
| 1.5 | 5.8 | GO:0052798 | beta-galactoside alpha-2,3-sialyltransferase activity(GO:0052798) |
| 1.4 | 7.0 | GO:0004489 | methylenetetrahydrofolate reductase (NAD(P)H) activity(GO:0004489) |
| 1.4 | 4.1 | GO:0004828 | serine-tRNA ligase activity(GO:0004828) |
| 1.4 | 4.1 | GO:0015168 | glycerol transmembrane transporter activity(GO:0015168) |
| 1.3 | 4.0 | GO:0015361 | low-affinity sodium:dicarboxylate symporter activity(GO:0015361) |
| 1.3 | 4.0 | GO:0047275 | glucosaminylgalactosylglucosylceramide beta-galactosyltransferase activity(GO:0047275) |
| 1.3 | 3.8 | GO:0031811 | G-protein coupled nucleotide receptor binding(GO:0031811) P2Y1 nucleotide receptor binding(GO:0031812) |
| 1.2 | 3.7 | GO:0004662 | CAAX-protein geranylgeranyltransferase activity(GO:0004662) |
| 1.2 | 4.8 | GO:0004998 | transferrin receptor activity(GO:0004998) |
| 1.2 | 4.8 | GO:0008422 | beta-glucosidase activity(GO:0008422) |
| 1.2 | 5.9 | GO:0047184 | 1-acylglycerophosphocholine O-acyltransferase activity(GO:0047184) |
| 1.2 | 4.7 | GO:0005166 | neurotrophin p75 receptor binding(GO:0005166) |
| 1.1 | 4.4 | GO:0071253 | connexin binding(GO:0071253) |
| 1.1 | 3.3 | GO:0070538 | oleic acid binding(GO:0070538) |
| 1.1 | 17.3 | GO:0001871 | pattern binding(GO:0001871) polysaccharide binding(GO:0030247) |
| 1.1 | 3.2 | GO:0051538 | 3 iron, 4 sulfur cluster binding(GO:0051538) |
| 1.0 | 5.2 | GO:0000179 | rRNA (adenine-N6,N6-)-dimethyltransferase activity(GO:0000179) |
| 1.0 | 5.2 | GO:0004991 | parathyroid hormone receptor activity(GO:0004991) |
| 1.0 | 5.1 | GO:0004468 | lysine N-acetyltransferase activity, acting on acetyl phosphate as donor(GO:0004468) |
| 1.0 | 4.0 | GO:0043812 | phosphatidylinositol-4-phosphate phosphatase activity(GO:0043812) |
| 1.0 | 3.0 | GO:0032093 | SAM domain binding(GO:0032093) |
| 1.0 | 2.9 | GO:0070643 | vitamin D3 25-hydroxylase activity(GO:0030343) vitamin D 25-hydroxylase activity(GO:0070643) |
| 0.9 | 6.6 | GO:0031726 | CCR1 chemokine receptor binding(GO:0031726) |
| 0.9 | 2.8 | GO:0005150 | interleukin-1, Type I receptor binding(GO:0005150) |
| 0.9 | 2.8 | GO:0061663 | NEDD8 ligase activity(GO:0061663) |
| 0.9 | 3.6 | GO:0016841 | ammonia-lyase activity(GO:0016841) |
| 0.9 | 5.3 | GO:0004897 | ciliary neurotrophic factor receptor activity(GO:0004897) |
| 0.9 | 13.9 | GO:0019841 | retinol binding(GO:0019841) |
| 0.9 | 2.6 | GO:0042799 | histone methyltransferase activity (H4-K20 specific)(GO:0042799) |
| 0.9 | 4.3 | GO:0004656 | procollagen-proline 4-dioxygenase activity(GO:0004656) procollagen-proline dioxygenase activity(GO:0019798) |
| 0.8 | 5.1 | GO:0008597 | calcium-dependent protein serine/threonine phosphatase regulator activity(GO:0008597) |
| 0.8 | 4.2 | GO:0016901 | glycerol-3-phosphate dehydrogenase activity(GO:0004368) oxidoreductase activity, acting on the CH-OH group of donors, quinone or similar compound as acceptor(GO:0016901) |
| 0.8 | 8.4 | GO:1901702 | urate transmembrane transporter activity(GO:0015143) salt transmembrane transporter activity(GO:1901702) |
| 0.8 | 15.1 | GO:0019864 | IgG binding(GO:0019864) |
| 0.8 | 89.5 | GO:0004867 | serine-type endopeptidase inhibitor activity(GO:0004867) |
| 0.8 | 1.6 | GO:0050780 | dopamine receptor binding(GO:0050780) |
| 0.8 | 39.6 | GO:0030546 | receptor activator activity(GO:0030546) |
| 0.8 | 19.7 | GO:0004383 | guanylate cyclase activity(GO:0004383) |
| 0.8 | 11.8 | GO:0005243 | gap junction channel activity(GO:0005243) |
| 0.8 | 2.4 | GO:0047696 | beta-adrenergic receptor kinase activity(GO:0047696) |
| 0.8 | 7.8 | GO:0022841 | leak channel activity(GO:0022840) potassium ion leak channel activity(GO:0022841) narrow pore channel activity(GO:0022842) |
| 0.8 | 3.1 | GO:0004874 | aryl hydrocarbon receptor activity(GO:0004874) |
| 0.8 | 17.4 | GO:0008191 | metalloendopeptidase inhibitor activity(GO:0008191) |
| 0.8 | 2.3 | GO:0008321 | Ral guanyl-nucleotide exchange factor activity(GO:0008321) |
| 0.8 | 7.5 | GO:0070324 | thyroid hormone binding(GO:0070324) |
| 0.7 | 3.7 | GO:0005078 | MAP-kinase scaffold activity(GO:0005078) |
| 0.7 | 9.3 | GO:0047372 | acylglycerol lipase activity(GO:0047372) |
| 0.7 | 4.3 | GO:0003873 | 6-phosphofructo-2-kinase activity(GO:0003873) fructose-2,6-bisphosphate 2-phosphatase activity(GO:0004331) |
| 0.7 | 2.1 | GO:0051379 | beta-adrenergic receptor activity(GO:0004939) epinephrine binding(GO:0051379) norepinephrine binding(GO:0051380) |
| 0.7 | 4.3 | GO:0004522 | ribonuclease A activity(GO:0004522) |
| 0.7 | 9.9 | GO:0036374 | glutathione hydrolase activity(GO:0036374) |
| 0.7 | 9.2 | GO:0070700 | BMP receptor binding(GO:0070700) |
| 0.7 | 11.9 | GO:0038191 | neuropilin binding(GO:0038191) |
| 0.7 | 0.7 | GO:0034186 | apolipoprotein A-I binding(GO:0034186) |
| 0.7 | 3.5 | GO:0030628 | pre-mRNA 3'-splice site binding(GO:0030628) |
| 0.7 | 0.7 | GO:0017169 | CDP-alcohol phosphatidyltransferase activity(GO:0017169) |
| 0.7 | 3.4 | GO:0070740 | tubulin-glutamic acid ligase activity(GO:0070740) |
| 0.7 | 13.7 | GO:0051787 | misfolded protein binding(GO:0051787) |
| 0.7 | 4.1 | GO:0051425 | PTB domain binding(GO:0051425) |
| 0.7 | 2.7 | GO:0030172 | troponin C binding(GO:0030172) |
| 0.7 | 2.0 | GO:0004962 | endothelin receptor activity(GO:0004962) |
| 0.7 | 2.7 | GO:0061628 | H3K27me3 modified histone binding(GO:0061628) |
| 0.7 | 3.3 | GO:0004994 | somatostatin receptor activity(GO:0004994) |
| 0.7 | 36.1 | GO:0034987 | immunoglobulin receptor binding(GO:0034987) |
| 0.7 | 2.6 | GO:0070742 | C2H2 zinc finger domain binding(GO:0070742) |
| 0.7 | 6.5 | GO:0015250 | water transmembrane transporter activity(GO:0005372) water channel activity(GO:0015250) |
| 0.6 | 3.9 | GO:0042610 | CD8 receptor binding(GO:0042610) |
| 0.6 | 7.1 | GO:0008430 | selenium binding(GO:0008430) |
| 0.6 | 9.0 | GO:0030618 | transforming growth factor beta receptor, pathway-specific cytoplasmic mediator activity(GO:0030618) |
| 0.6 | 1.9 | GO:1902122 | chenodeoxycholic acid binding(GO:1902122) |
| 0.6 | 6.4 | GO:0017162 | aryl hydrocarbon receptor binding(GO:0017162) |
| 0.6 | 3.2 | GO:0046974 | histone methyltransferase activity (H3-K9 specific)(GO:0046974) |
| 0.6 | 4.5 | GO:0070891 | lipoteichoic acid binding(GO:0070891) |
| 0.6 | 5.1 | GO:0005329 | dopamine transmembrane transporter activity(GO:0005329) quaternary ammonium group transmembrane transporter activity(GO:0015651) |
| 0.6 | 2.4 | GO:0004466 | long-chain-acyl-CoA dehydrogenase activity(GO:0004466) |
| 0.6 | 6.6 | GO:0051434 | BH3 domain binding(GO:0051434) |
| 0.6 | 2.3 | GO:0051916 | granulocyte colony-stimulating factor binding(GO:0051916) |
| 0.6 | 2.9 | GO:0002046 | opsin binding(GO:0002046) |
| 0.6 | 4.6 | GO:0099583 | neurotransmitter receptor activity involved in regulation of postsynaptic cytosolic calcium ion concentration(GO:0099583) |
| 0.6 | 2.9 | GO:0008048 | calcium sensitive guanylate cyclase activator activity(GO:0008048) |
| 0.6 | 8.6 | GO:0005326 | neurotransmitter transporter activity(GO:0005326) |
| 0.6 | 5.2 | GO:0043426 | MRF binding(GO:0043426) |
| 0.6 | 2.8 | GO:0052845 | endopolyphosphatase activity(GO:0000298) diphosphoinositol-polyphosphate diphosphatase activity(GO:0008486) bis(5'-adenosyl)-hexaphosphatase activity(GO:0034431) bis(5'-adenosyl)-pentaphosphatase activity(GO:0034432) inositol diphosphate tetrakisphosphate diphosphatase activity(GO:0052840) inositol bisdiphosphate tetrakisphosphate diphosphatase activity(GO:0052841) inositol diphosphate pentakisphosphate diphosphatase activity(GO:0052842) inositol-1-diphosphate-2,3,4,5,6-pentakisphosphate diphosphatase activity(GO:0052843) inositol-3-diphosphate-1,2,4,5,6-pentakisphosphate diphosphatase activity(GO:0052844) inositol-5-diphosphate-1,2,3,4,6-pentakisphosphate diphosphatase activity(GO:0052845) inositol-1,5-bisdiphosphate-2,3,4,6-tetrakisphosphate 1-diphosphatase activity(GO:0052846) inositol-1,5-bisdiphosphate-2,3,4,6-tetrakisphosphate 5-diphosphatase activity(GO:0052847) inositol-3,5-bisdiphosphate-2,3,4,6-tetrakisphosphate 5-diphosphatase activity(GO:0052848) |
| 0.6 | 2.2 | GO:0045499 | chemorepellent activity(GO:0045499) |
| 0.6 | 2.2 | GO:0004102 | choline O-acetyltransferase activity(GO:0004102) |
| 0.6 | 4.4 | GO:0005534 | galactose binding(GO:0005534) |
| 0.6 | 2.2 | GO:0097603 | temperature-gated ion channel activity(GO:0097603) |
| 0.5 | 2.7 | GO:0019531 | oxalate transmembrane transporter activity(GO:0019531) |
| 0.5 | 6.0 | GO:0003996 | acyl-CoA ligase activity(GO:0003996) |
| 0.5 | 1.6 | GO:0004833 | tryptophan 2,3-dioxygenase activity(GO:0004833) |
| 0.5 | 1.6 | GO:0004603 | phenylethanolamine N-methyltransferase activity(GO:0004603) |
| 0.5 | 2.2 | GO:1901474 | azole transmembrane transporter activity(GO:1901474) |
| 0.5 | 4.3 | GO:0071933 | Arp2/3 complex binding(GO:0071933) |
| 0.5 | 2.1 | GO:0031435 | mitogen-activated protein kinase kinase kinase binding(GO:0031435) |
| 0.5 | 2.6 | GO:0017159 | pantetheine hydrolase activity(GO:0017159) |
| 0.5 | 1.6 | GO:0004947 | bradykinin receptor activity(GO:0004947) |
| 0.5 | 4.2 | GO:0097157 | pre-mRNA intronic binding(GO:0097157) |
| 0.5 | 2.1 | GO:0016404 | 15-hydroxyprostaglandin dehydrogenase (NAD+) activity(GO:0016404) |
| 0.5 | 2.1 | GO:0004634 | phosphopyruvate hydratase activity(GO:0004634) |
| 0.5 | 8.3 | GO:0005391 | sodium:potassium-exchanging ATPase activity(GO:0005391) |
| 0.5 | 1.5 | GO:0046573 | lactonohydrolase activity(GO:0046573) acyl-L-homoserine-lactone lactonohydrolase activity(GO:0102007) |
| 0.5 | 6.6 | GO:0097371 | MDM2/MDM4 family protein binding(GO:0097371) |
| 0.5 | 1.5 | GO:0052810 | 1-phosphatidylinositol-5-kinase activity(GO:0052810) |
| 0.5 | 6.6 | GO:0046870 | cadmium ion binding(GO:0046870) |
| 0.5 | 6.0 | GO:0000774 | adenyl-nucleotide exchange factor activity(GO:0000774) |
| 0.5 | 2.0 | GO:0003827 | alpha-1,3-mannosylglycoprotein 2-beta-N-acetylglucosaminyltransferase activity(GO:0003827) |
| 0.5 | 5.5 | GO:0004332 | fructose-bisphosphate aldolase activity(GO:0004332) |
| 0.5 | 3.5 | GO:0071553 | uridine nucleotide receptor activity(GO:0015065) G-protein coupled pyrimidinergic nucleotide receptor activity(GO:0071553) |
| 0.5 | 3.0 | GO:0051032 | nucleic acid transmembrane transporter activity(GO:0051032) RNA transmembrane transporter activity(GO:0051033) |
| 0.5 | 8.9 | GO:0017070 | U6 snRNA binding(GO:0017070) |
| 0.5 | 2.0 | GO:0001632 | leukotriene B4 receptor activity(GO:0001632) |
| 0.5 | 131.9 | GO:0004252 | serine-type endopeptidase activity(GO:0004252) |
| 0.5 | 2.4 | GO:0015035 | protein disulfide oxidoreductase activity(GO:0015035) |
| 0.5 | 1.4 | GO:0005017 | platelet-derived growth factor-activated receptor activity(GO:0005017) |
| 0.5 | 2.4 | GO:0015307 | drug:proton antiporter activity(GO:0015307) |
| 0.5 | 3.3 | GO:0030020 | extracellular matrix structural constituent conferring tensile strength(GO:0030020) |
| 0.5 | 2.8 | GO:0005324 | long-chain fatty acid transporter activity(GO:0005324) |
| 0.5 | 1.8 | GO:0008508 | bile acid:sodium symporter activity(GO:0008508) |
| 0.5 | 2.7 | GO:0052655 | branched-chain-amino-acid transaminase activity(GO:0004084) L-leucine transaminase activity(GO:0052654) L-valine transaminase activity(GO:0052655) L-isoleucine transaminase activity(GO:0052656) |
| 0.5 | 5.0 | GO:0001758 | retinal dehydrogenase activity(GO:0001758) |
| 0.5 | 9.1 | GO:0008331 | high voltage-gated calcium channel activity(GO:0008331) |
| 0.5 | 5.5 | GO:0043176 | amine binding(GO:0043176) serotonin binding(GO:0051378) |
| 0.5 | 6.8 | GO:0008140 | cAMP response element binding protein binding(GO:0008140) |
| 0.5 | 3.2 | GO:0043531 | ADP binding(GO:0043531) |
| 0.5 | 16.7 | GO:0008009 | chemokine activity(GO:0008009) |
| 0.5 | 1.4 | GO:0004779 | adenylylsulfate kinase activity(GO:0004020) sulfate adenylyltransferase activity(GO:0004779) sulfate adenylyltransferase (ATP) activity(GO:0004781) |
| 0.5 | 3.6 | GO:0004111 | creatine kinase activity(GO:0004111) |
| 0.4 | 2.7 | GO:0004935 | adrenergic receptor activity(GO:0004935) |
| 0.4 | 11.1 | GO:0030169 | low-density lipoprotein particle binding(GO:0030169) |
| 0.4 | 2.7 | GO:0005143 | interleukin-12 receptor binding(GO:0005143) |
| 0.4 | 3.5 | GO:0051864 | histone demethylase activity (H3-K36 specific)(GO:0051864) |
| 0.4 | 1.3 | GO:0005127 | ciliary neurotrophic factor receptor binding(GO:0005127) |
| 0.4 | 0.9 | GO:0033265 | choline binding(GO:0033265) |
| 0.4 | 3.4 | GO:0097322 | 7SK snRNA binding(GO:0097322) |
| 0.4 | 1.7 | GO:0004979 | beta-endorphin receptor activity(GO:0004979) morphine receptor activity(GO:0038047) |
| 0.4 | 2.9 | GO:0042834 | peptidoglycan binding(GO:0042834) |
| 0.4 | 2.9 | GO:0004035 | alkaline phosphatase activity(GO:0004035) nucleotide diphosphatase activity(GO:0004551) |
| 0.4 | 4.1 | GO:0042975 | peroxisome proliferator activated receptor binding(GO:0042975) |
| 0.4 | 1.2 | GO:0033188 | sphingomyelin synthase activity(GO:0033188) ceramide cholinephosphotransferase activity(GO:0047493) |
| 0.4 | 1.2 | GO:0098770 | FBXO family protein binding(GO:0098770) |
| 0.4 | 2.4 | GO:0050682 | AF-2 domain binding(GO:0050682) |
| 0.4 | 0.8 | GO:0019763 | immunoglobulin receptor activity(GO:0019763) |
| 0.4 | 1.6 | GO:0005222 | intracellular cAMP activated cation channel activity(GO:0005222) |
| 0.4 | 2.0 | GO:0008420 | CTD phosphatase activity(GO:0008420) |
| 0.4 | 1.6 | GO:0031711 | bradykinin receptor binding(GO:0031711) |
| 0.4 | 3.9 | GO:0004571 | mannosyl-oligosaccharide 1,2-alpha-mannosidase activity(GO:0004571) |
| 0.4 | 1.9 | GO:0044736 | acid-sensing ion channel activity(GO:0044736) |
| 0.4 | 1.2 | GO:0070051 | fibrinogen binding(GO:0070051) |
| 0.4 | 2.3 | GO:0004741 | [pyruvate dehydrogenase (lipoamide)] phosphatase activity(GO:0004741) |
| 0.4 | 1.5 | GO:0004060 | arylamine N-acetyltransferase activity(GO:0004060) |
| 0.4 | 0.8 | GO:0034617 | tetrahydrobiopterin binding(GO:0034617) |
| 0.4 | 3.4 | GO:0086083 | cell adhesive protein binding involved in bundle of His cell-Purkinje myocyte communication(GO:0086083) |
| 0.4 | 3.0 | GO:0004873 | asialoglycoprotein receptor activity(GO:0004873) |
| 0.4 | 1.5 | GO:0032406 | MutLbeta complex binding(GO:0032406) MutSbeta complex binding(GO:0032408) |
| 0.4 | 1.1 | GO:0004711 | ribosomal protein S6 kinase activity(GO:0004711) |
| 0.4 | 3.7 | GO:0015385 | monovalent cation:proton antiporter activity(GO:0005451) sodium:proton antiporter activity(GO:0015385) potassium:proton antiporter activity(GO:0015386) |
| 0.4 | 19.8 | GO:0019894 | kinesin binding(GO:0019894) |
| 0.4 | 1.1 | GO:0030158 | protein xylosyltransferase activity(GO:0030158) |
| 0.4 | 4.7 | GO:0003995 | acyl-CoA dehydrogenase activity(GO:0003995) |
| 0.4 | 5.0 | GO:0004065 | arylsulfatase activity(GO:0004065) |
| 0.4 | 4.3 | GO:0016423 | tRNA (guanine) methyltransferase activity(GO:0016423) |
| 0.4 | 3.9 | GO:0046935 | 1-phosphatidylinositol-3-kinase regulator activity(GO:0046935) |
| 0.3 | 2.1 | GO:0005157 | macrophage colony-stimulating factor receptor binding(GO:0005157) |
| 0.3 | 5.6 | GO:0008329 | signaling pattern recognition receptor activity(GO:0008329) pattern recognition receptor activity(GO:0038187) |
| 0.3 | 1.4 | GO:0004530 | deoxyribonuclease I activity(GO:0004530) |
| 0.3 | 1.0 | GO:0034875 | oxidoreductase activity, acting on CH or CH2 groups, quinone or similar compound as acceptor(GO:0033695) caffeine oxidase activity(GO:0034875) |
| 0.3 | 2.4 | GO:0042608 | T cell receptor binding(GO:0042608) |
| 0.3 | 5.4 | GO:0033130 | acetylcholine receptor binding(GO:0033130) |
| 0.3 | 4.0 | GO:0008429 | phosphatidylethanolamine binding(GO:0008429) |
| 0.3 | 5.9 | GO:0102391 | decanoate--CoA ligase activity(GO:0102391) |
| 0.3 | 3.9 | GO:0010385 | double-stranded methylated DNA binding(GO:0010385) |
| 0.3 | 4.8 | GO:0008190 | eukaryotic initiation factor 4E binding(GO:0008190) |
| 0.3 | 1.9 | GO:0043532 | angiostatin binding(GO:0043532) |
| 0.3 | 6.7 | GO:0050321 | tau-protein kinase activity(GO:0050321) |
| 0.3 | 0.9 | GO:0008798 | beta-aspartyl-peptidase activity(GO:0008798) |
| 0.3 | 1.3 | GO:0010851 | cyclase regulator activity(GO:0010851) |
| 0.3 | 1.9 | GO:0031705 | bombesin receptor binding(GO:0031705) |
| 0.3 | 1.2 | GO:0008336 | gamma-butyrobetaine dioxygenase activity(GO:0008336) |
| 0.3 | 1.5 | GO:0005436 | sodium:phosphate symporter activity(GO:0005436) |
| 0.3 | 1.5 | GO:0004957 | prostaglandin E receptor activity(GO:0004957) |
| 0.3 | 0.9 | GO:0004045 | aminoacyl-tRNA hydrolase activity(GO:0004045) |
| 0.3 | 2.6 | GO:0003836 | beta-galactoside (CMP) alpha-2,3-sialyltransferase activity(GO:0003836) |
| 0.3 | 1.7 | GO:0002114 | interleukin-33 receptor activity(GO:0002114) |
| 0.3 | 2.0 | GO:0001515 | opioid peptide activity(GO:0001515) |
| 0.3 | 1.1 | GO:0042954 | lipoprotein transporter activity(GO:0042954) |
| 0.3 | 3.6 | GO:0038132 | neuregulin binding(GO:0038132) |
| 0.3 | 3.3 | GO:0043996 | histone acetyltransferase activity (H4-K5 specific)(GO:0043995) histone acetyltransferase activity (H4-K8 specific)(GO:0043996) histone acetyltransferase activity (H4-K16 specific)(GO:0046972) |
| 0.3 | 0.8 | GO:0017057 | 6-phosphogluconolactonase activity(GO:0017057) |
| 0.3 | 0.8 | GO:0003829 | beta-1,3-galactosyl-O-glycosyl-glycoprotein beta-1,6-N-acetylglucosaminyltransferase activity(GO:0003829) |
| 0.3 | 12.7 | GO:0030507 | spectrin binding(GO:0030507) |
| 0.3 | 2.2 | GO:0016929 | SUMO-specific protease activity(GO:0016929) |
| 0.3 | 1.9 | GO:0015501 | glutamate:sodium symporter activity(GO:0015501) |
| 0.3 | 4.8 | GO:0008093 | cytoskeletal adaptor activity(GO:0008093) |
| 0.3 | 2.4 | GO:0032051 | clathrin light chain binding(GO:0032051) |
| 0.3 | 7.6 | GO:0047555 | 3',5'-cyclic-GMP phosphodiesterase activity(GO:0047555) |
| 0.3 | 1.6 | GO:0016647 | oxidoreductase activity, acting on the CH-NH group of donors, oxygen as acceptor(GO:0016647) |
| 0.3 | 2.6 | GO:0015026 | coreceptor activity(GO:0015026) |
| 0.3 | 3.6 | GO:0055056 | D-glucose transmembrane transporter activity(GO:0055056) |
| 0.3 | 12.2 | GO:0005164 | tumor necrosis factor receptor binding(GO:0005164) |
| 0.3 | 4.0 | GO:0004716 | receptor signaling protein tyrosine kinase activity(GO:0004716) |
| 0.3 | 0.8 | GO:0005260 | channel-conductance-controlling ATPase activity(GO:0005260) |
| 0.2 | 0.7 | GO:0005220 | inositol 1,4,5-trisphosphate-sensitive calcium-release channel activity(GO:0005220) |
| 0.2 | 0.7 | GO:0004566 | beta-glucuronidase activity(GO:0004566) |
| 0.2 | 1.0 | GO:0004886 | 9-cis retinoic acid receptor activity(GO:0004886) |
| 0.2 | 4.2 | GO:0070300 | phosphatidic acid binding(GO:0070300) |
| 0.2 | 0.7 | GO:0051373 | FATZ binding(GO:0051373) |
| 0.2 | 21.5 | GO:0005201 | extracellular matrix structural constituent(GO:0005201) |
| 0.2 | 1.7 | GO:0030346 | protein phosphatase 2B binding(GO:0030346) |
| 0.2 | 4.3 | GO:0070001 | aspartic-type endopeptidase activity(GO:0004190) aspartic-type peptidase activity(GO:0070001) |
| 0.2 | 3.3 | GO:0035198 | miRNA binding(GO:0035198) |
| 0.2 | 1.2 | GO:0050656 | 3'-phosphoadenosine 5'-phosphosulfate binding(GO:0050656) |
| 0.2 | 5.5 | GO:0032266 | phosphatidylinositol-3-phosphate binding(GO:0032266) |
| 0.2 | 5.9 | GO:0004435 | phosphatidylinositol phospholipase C activity(GO:0004435) |
| 0.2 | 4.0 | GO:0004089 | carbonate dehydratase activity(GO:0004089) |
| 0.2 | 1.6 | GO:0016803 | ether hydrolase activity(GO:0016803) |
| 0.2 | 7.2 | GO:0043027 | cysteine-type endopeptidase inhibitor activity involved in apoptotic process(GO:0043027) |
| 0.2 | 3.4 | GO:0004861 | cyclin-dependent protein serine/threonine kinase inhibitor activity(GO:0004861) |
| 0.2 | 4.3 | GO:0043325 | phosphatidylinositol-3,4-bisphosphate binding(GO:0043325) |
| 0.2 | 1.6 | GO:0005087 | Ran guanyl-nucleotide exchange factor activity(GO:0005087) |
| 0.2 | 1.8 | GO:0003810 | protein-glutamine gamma-glutamyltransferase activity(GO:0003810) |
| 0.2 | 2.7 | GO:0017017 | MAP kinase tyrosine/serine/threonine phosphatase activity(GO:0017017) |
| 0.2 | 6.5 | GO:0005388 | calcium-transporting ATPase activity(GO:0005388) |
| 0.2 | 0.7 | GO:0015333 | peptide:proton symporter activity(GO:0015333) proton-dependent peptide secondary active transmembrane transporter activity(GO:0022897) |
| 0.2 | 5.3 | GO:0005104 | fibroblast growth factor receptor binding(GO:0005104) |
| 0.2 | 2.8 | GO:0015279 | store-operated calcium channel activity(GO:0015279) |
| 0.2 | 3.7 | GO:0003688 | DNA replication origin binding(GO:0003688) |
| 0.2 | 1.9 | GO:0030976 | thiamine pyrophosphate binding(GO:0030976) |
| 0.2 | 1.1 | GO:0004647 | phosphoserine phosphatase activity(GO:0004647) |
| 0.2 | 1.1 | GO:0070728 | leucine binding(GO:0070728) |
| 0.2 | 0.6 | GO:0070984 | SET domain binding(GO:0070984) |
| 0.2 | 8.0 | GO:0017080 | sodium channel regulator activity(GO:0017080) |
| 0.2 | 1.4 | GO:0019211 | phosphatase activator activity(GO:0019211) |
| 0.2 | 9.2 | GO:0051539 | 4 iron, 4 sulfur cluster binding(GO:0051539) |
| 0.2 | 1.2 | GO:0070064 | proline-rich region binding(GO:0070064) |
| 0.2 | 7.7 | GO:0015020 | glucuronosyltransferase activity(GO:0015020) |
| 0.2 | 0.8 | GO:0005351 | sugar:proton symporter activity(GO:0005351) cation:sugar symporter activity(GO:0005402) |
| 0.2 | 3.2 | GO:0005545 | 1-phosphatidylinositol binding(GO:0005545) |
| 0.2 | 7.9 | GO:0005544 | calcium-dependent phospholipid binding(GO:0005544) |
| 0.2 | 9.0 | GO:0001205 | transcriptional activator activity, RNA polymerase II distal enhancer sequence-specific binding(GO:0001205) |
| 0.2 | 1.0 | GO:0047844 | deoxycytidine deaminase activity(GO:0047844) |
| 0.2 | 5.1 | GO:0015269 | calcium-activated potassium channel activity(GO:0015269) |
| 0.2 | 1.4 | GO:0017077 | oxidative phosphorylation uncoupler activity(GO:0017077) |
| 0.2 | 1.6 | GO:0034711 | inhibin binding(GO:0034711) |
| 0.2 | 2.1 | GO:0001530 | lipopolysaccharide binding(GO:0001530) |
| 0.2 | 1.7 | GO:0015643 | toxic substance binding(GO:0015643) |
| 0.2 | 1.3 | GO:0003828 | alpha-N-acetylneuraminate alpha-2,8-sialyltransferase activity(GO:0003828) |
| 0.2 | 0.9 | GO:0015056 | corticotrophin-releasing factor receptor activity(GO:0015056) |
| 0.2 | 8.7 | GO:0005484 | SNAP receptor activity(GO:0005484) |
| 0.2 | 4.5 | GO:0008395 | steroid hydroxylase activity(GO:0008395) |
| 0.2 | 0.7 | GO:0004844 | uracil DNA N-glycosylase activity(GO:0004844) deaminated base DNA N-glycosylase activity(GO:0097506) |
| 0.2 | 6.5 | GO:0046875 | ephrin receptor binding(GO:0046875) |
| 0.2 | 0.9 | GO:0004906 | interferon-gamma receptor activity(GO:0004906) |
| 0.2 | 5.4 | GO:0005031 | tumor necrosis factor-activated receptor activity(GO:0005031) death receptor activity(GO:0005035) |
| 0.2 | 0.9 | GO:0004982 | N-formyl peptide receptor activity(GO:0004982) |
| 0.2 | 2.7 | GO:0055102 | lipase inhibitor activity(GO:0055102) |
| 0.2 | 1.8 | GO:0005007 | fibroblast growth factor-activated receptor activity(GO:0005007) |
| 0.2 | 1.2 | GO:0005381 | iron ion transmembrane transporter activity(GO:0005381) |
| 0.2 | 3.3 | GO:0005385 | zinc ion transmembrane transporter activity(GO:0005385) |
| 0.2 | 7.3 | GO:0042169 | SH2 domain binding(GO:0042169) |
| 0.2 | 1.9 | GO:0048020 | CCR chemokine receptor binding(GO:0048020) |
| 0.2 | 2.6 | GO:0005161 | platelet-derived growth factor receptor binding(GO:0005161) |
| 0.2 | 1.2 | GO:0022839 | ion gated channel activity(GO:0022839) |
| 0.2 | 3.6 | GO:0005112 | Notch binding(GO:0005112) |
| 0.2 | 1.2 | GO:0047498 | calcium-dependent phospholipase A2 activity(GO:0047498) |
| 0.2 | 4.7 | GO:0008138 | protein tyrosine/serine/threonine phosphatase activity(GO:0008138) |
| 0.2 | 13.8 | GO:0004222 | metalloendopeptidase activity(GO:0004222) |
| 0.2 | 0.5 | GO:0008476 | protein-tyrosine sulfotransferase activity(GO:0008476) |
| 0.2 | 2.5 | GO:0008239 | dipeptidyl-peptidase activity(GO:0008239) |
| 0.2 | 1.5 | GO:0003708 | retinoic acid receptor activity(GO:0003708) |
| 0.2 | 1.6 | GO:0003910 | DNA ligase (ATP) activity(GO:0003910) |
| 0.2 | 14.2 | GO:0003705 | transcription factor activity, RNA polymerase II distal enhancer sequence-specific binding(GO:0003705) |
| 0.2 | 1.0 | GO:0004000 | adenosine deaminase activity(GO:0004000) |
| 0.2 | 0.5 | GO:0000822 | inositol hexakisphosphate binding(GO:0000822) |
| 0.2 | 2.5 | GO:0043522 | leucine zipper domain binding(GO:0043522) |
| 0.2 | 2.7 | GO:0050786 | RAGE receptor binding(GO:0050786) |
| 0.2 | 15.5 | GO:0005070 | SH3/SH2 adaptor activity(GO:0005070) |
| 0.2 | 0.9 | GO:0035368 | selenocysteine insertion sequence binding(GO:0035368) |
| 0.2 | 2.1 | GO:0015095 | magnesium ion transmembrane transporter activity(GO:0015095) |
| 0.2 | 4.1 | GO:0071889 | 14-3-3 protein binding(GO:0071889) |
| 0.2 | 1.2 | GO:0001012 | RNA polymerase II regulatory region sequence-specific DNA binding(GO:0000977) RNA polymerase II regulatory region DNA binding(GO:0001012) |
| 0.2 | 0.2 | GO:0050508 | glucuronosyl-N-acetylglucosaminyl-proteoglycan 4-alpha-N-acetylglucosaminyltransferase activity(GO:0050508) |
| 0.1 | 4.3 | GO:0016676 | cytochrome-c oxidase activity(GO:0004129) heme-copper terminal oxidase activity(GO:0015002) oxidoreductase activity, acting on a heme group of donors, oxygen as acceptor(GO:0016676) |
| 0.1 | 2.4 | GO:0019992 | diacylglycerol binding(GO:0019992) |
| 0.1 | 2.4 | GO:0004185 | serine-type carboxypeptidase activity(GO:0004185) |
| 0.1 | 0.6 | GO:0004307 | diacylglycerol cholinephosphotransferase activity(GO:0004142) ethanolaminephosphotransferase activity(GO:0004307) |
| 0.1 | 0.9 | GO:0052650 | NADP-retinol dehydrogenase activity(GO:0052650) |
| 0.1 | 2.5 | GO:0043295 | glutathione binding(GO:0043295) |
| 0.1 | 4.4 | GO:0004177 | aminopeptidase activity(GO:0004177) |
| 0.1 | 0.3 | GO:0032422 | purine-rich negative regulatory element binding(GO:0032422) |
| 0.1 | 4.0 | GO:0003785 | actin monomer binding(GO:0003785) |
| 0.1 | 1.9 | GO:0015377 | cation:chloride symporter activity(GO:0015377) |
| 0.1 | 2.3 | GO:0043495 | protein anchor(GO:0043495) |
| 0.1 | 0.5 | GO:0016520 | growth hormone-releasing hormone receptor activity(GO:0016520) |
| 0.1 | 1.2 | GO:0004985 | opioid receptor activity(GO:0004985) |
| 0.1 | 4.5 | GO:0008066 | glutamate receptor activity(GO:0008066) |
| 0.1 | 2.9 | GO:0004385 | guanylate kinase activity(GO:0004385) |
| 0.1 | 0.7 | GO:0001016 | transcription factor activity, RNA polymerase III transcription factor binding(GO:0001007) RNA polymerase III regulatory region DNA binding(GO:0001016) |
| 0.1 | 3.2 | GO:0004708 | MAP kinase kinase activity(GO:0004708) |
| 0.1 | 1.2 | GO:0048495 | Roundabout binding(GO:0048495) |
| 0.1 | 2.1 | GO:0001784 | phosphotyrosine binding(GO:0001784) |
| 0.1 | 1.7 | GO:0035259 | glucocorticoid receptor binding(GO:0035259) |
| 0.1 | 2.4 | GO:0031418 | L-ascorbic acid binding(GO:0031418) |
| 0.1 | 2.8 | GO:0098641 | cadherin binding involved in cell-cell adhesion(GO:0098641) |
| 0.1 | 1.2 | GO:0004075 | biotin carboxylase activity(GO:0004075) biotin binding(GO:0009374) |
| 0.1 | 0.5 | GO:0001591 | dopamine neurotransmitter receptor activity, coupled via Gi/Go(GO:0001591) |
| 0.1 | 0.8 | GO:0042043 | neurexin family protein binding(GO:0042043) |
| 0.1 | 0.7 | GO:0051525 | NFAT protein binding(GO:0051525) |
| 0.1 | 0.8 | GO:0004993 | G-protein coupled serotonin receptor activity(GO:0004993) |
| 0.1 | 1.3 | GO:0070569 | uridylyltransferase activity(GO:0070569) |
| 0.1 | 0.5 | GO:0016015 | morphogen activity(GO:0016015) |
| 0.1 | 4.3 | GO:0004364 | glutathione transferase activity(GO:0004364) |
| 0.1 | 0.9 | GO:0089720 | caspase binding(GO:0089720) |
| 0.1 | 2.1 | GO:0016922 | ligand-dependent nuclear receptor binding(GO:0016922) |
| 0.1 | 2.4 | GO:0042813 | Wnt-activated receptor activity(GO:0042813) |
| 0.1 | 1.0 | GO:0004028 | 3-chloroallyl aldehyde dehydrogenase activity(GO:0004028) |
| 0.1 | 10.8 | GO:0005179 | hormone activity(GO:0005179) |
| 0.1 | 0.7 | GO:0015440 | peptide-transporting ATPase activity(GO:0015440) |
| 0.1 | 0.6 | GO:0016812 | hydrolase activity, acting on carbon-nitrogen (but not peptide) bonds, in cyclic amides(GO:0016812) |
| 0.1 | 1.4 | GO:0046965 | retinoid X receptor binding(GO:0046965) |
| 0.1 | 1.9 | GO:0004033 | aldo-keto reductase (NADP) activity(GO:0004033) |
| 0.1 | 3.1 | GO:0030331 | estrogen receptor binding(GO:0030331) |
| 0.1 | 1.5 | GO:0005149 | interleukin-1 receptor binding(GO:0005149) |
| 0.1 | 3.7 | GO:0051879 | Hsp90 protein binding(GO:0051879) |
| 0.1 | 1.2 | GO:0017034 | Rap guanyl-nucleotide exchange factor activity(GO:0017034) |
| 0.1 | 2.0 | GO:0046934 | phosphatidylinositol-4,5-bisphosphate 3-kinase activity(GO:0046934) |
| 0.1 | 0.3 | GO:0004450 | isocitrate dehydrogenase (NADP+) activity(GO:0004450) |
| 0.1 | 3.3 | GO:0004536 | deoxyribonuclease activity(GO:0004536) |
| 0.1 | 1.7 | GO:0005247 | voltage-gated chloride channel activity(GO:0005247) |
| 0.1 | 0.4 | GO:0004948 | calcitonin receptor activity(GO:0004948) |
| 0.1 | 4.3 | GO:0004693 | cyclin-dependent protein serine/threonine kinase activity(GO:0004693) |
| 0.1 | 0.3 | GO:0001588 | dopamine neurotransmitter receptor activity, coupled via Gs(GO:0001588) |
| 0.1 | 22.8 | GO:0005085 | guanyl-nucleotide exchange factor activity(GO:0005085) |
| 0.1 | 1.2 | GO:0034483 | heparan sulfate sulfotransferase activity(GO:0034483) |
| 0.1 | 14.7 | GO:0005261 | cation channel activity(GO:0005261) |
| 0.1 | 1.3 | GO:0005522 | profilin binding(GO:0005522) |
| 0.1 | 1.1 | GO:0000900 | translation repressor activity, nucleic acid binding(GO:0000900) |
| 0.1 | 2.4 | GO:0070412 | R-SMAD binding(GO:0070412) |
| 0.1 | 0.4 | GO:0043533 | inositol 1,3,4,5 tetrakisphosphate binding(GO:0043533) |
| 0.1 | 2.3 | GO:0008028 | monocarboxylic acid transmembrane transporter activity(GO:0008028) |
| 0.1 | 0.7 | GO:0017049 | GTP-Rho binding(GO:0017049) |
| 0.1 | 0.6 | GO:0004969 | histamine receptor activity(GO:0004969) |
| 0.1 | 1.1 | GO:0016881 | acid-amino acid ligase activity(GO:0016881) |
| 0.1 | 2.4 | GO:0005160 | transforming growth factor beta receptor binding(GO:0005160) |
| 0.1 | 0.7 | GO:0004029 | aldehyde dehydrogenase (NAD) activity(GO:0004029) |
| 0.1 | 1.3 | GO:0022848 | acetylcholine-gated cation channel activity(GO:0022848) |
| 0.1 | 0.8 | GO:0032027 | myosin light chain binding(GO:0032027) |
| 0.1 | 1.4 | GO:0004115 | 3',5'-cyclic-AMP phosphodiesterase activity(GO:0004115) |
| 0.1 | 0.7 | GO:0030544 | Hsp70 protein binding(GO:0030544) |
| 0.1 | 1.7 | GO:0015347 | sodium-independent organic anion transmembrane transporter activity(GO:0015347) |
| 0.1 | 0.5 | GO:0051371 | muscle alpha-actinin binding(GO:0051371) |
| 0.1 | 0.5 | GO:0008158 | hedgehog receptor activity(GO:0008158) |
| 0.1 | 2.3 | GO:0005507 | copper ion binding(GO:0005507) |
| 0.1 | 1.4 | GO:0030374 | ligand-dependent nuclear receptor transcription coactivator activity(GO:0030374) |
| 0.1 | 0.2 | GO:0030377 | urokinase plasminogen activator receptor activity(GO:0030377) |
| 0.1 | 0.8 | GO:0016863 | intramolecular oxidoreductase activity, transposing C=C bonds(GO:0016863) |
| 0.1 | 0.4 | GO:0016670 | oxidoreductase activity, acting on a sulfur group of donors, oxygen as acceptor(GO:0016670) |
| 0.1 | 2.7 | GO:0000980 | RNA polymerase II distal enhancer sequence-specific DNA binding(GO:0000980) |
| 0.0 | 1.1 | GO:0005520 | insulin-like growth factor binding(GO:0005520) |
| 0.0 | 0.2 | GO:0004461 | lactose synthase activity(GO:0004461) |
| 0.0 | 1.5 | GO:0005487 | nucleocytoplasmic transporter activity(GO:0005487) |
| 0.0 | 0.3 | GO:0031702 | angiotensin receptor binding(GO:0031701) type 1 angiotensin receptor binding(GO:0031702) |
| 0.0 | 1.1 | GO:0004012 | phospholipid-translocating ATPase activity(GO:0004012) |
| 0.0 | 0.3 | GO:0030160 | GKAP/Homer scaffold activity(GO:0030160) |
| 0.0 | 0.8 | GO:0035064 | methylated histone binding(GO:0035064) |
| 0.0 | 0.6 | GO:0005154 | epidermal growth factor receptor binding(GO:0005154) |
| 0.0 | 0.4 | GO:0061578 | Lys63-specific deubiquitinase activity(GO:0061578) |
| 0.0 | 0.9 | GO:0030742 | GTP-dependent protein binding(GO:0030742) |
| 0.0 | 0.2 | GO:0005497 | androgen binding(GO:0005497) |
| 0.0 | 2.9 | GO:0008013 | beta-catenin binding(GO:0008013) |
| 0.0 | 0.9 | GO:0004709 | MAP kinase kinase kinase activity(GO:0004709) |
| 0.0 | 0.4 | GO:0002162 | dystroglycan binding(GO:0002162) |
| 0.0 | 0.5 | GO:0005158 | insulin receptor binding(GO:0005158) |
| 0.0 | 1.2 | GO:0004984 | olfactory receptor activity(GO:0004984) |
| 0.0 | 1.1 | GO:0008146 | sulfotransferase activity(GO:0008146) |
| 0.0 | 0.6 | GO:0000146 | microfilament motor activity(GO:0000146) |
| 0.0 | 0.2 | GO:0000990 | transcription factor activity, core RNA polymerase binding(GO:0000990) |
| 0.0 | 0.2 | GO:0042056 | chemoattractant activity(GO:0042056) |
| 0.0 | 0.9 | GO:0098531 | RNA polymerase II transcription factor activity, ligand-activated sequence-specific DNA binding(GO:0004879) transcription factor activity, direct ligand regulated sequence-specific DNA binding(GO:0098531) |
| 0.0 | 1.8 | GO:0008307 | structural constituent of muscle(GO:0008307) |
| 0.0 | 0.5 | GO:0001540 | beta-amyloid binding(GO:0001540) |
| 0.0 | 0.2 | GO:0008020 | G-protein coupled photoreceptor activity(GO:0008020) |
| 0.0 | 0.2 | GO:0017160 | Ral GTPase binding(GO:0017160) |
| 0.0 | 0.1 | GO:0051575 | 5'-deoxyribose-5-phosphate lyase activity(GO:0051575) |
| 0.0 | 0.1 | GO:0003883 | CTP synthase activity(GO:0003883) |
| 0.0 | 0.2 | GO:0004303 | estradiol 17-beta-dehydrogenase activity(GO:0004303) |
| 0.0 | 0.5 | GO:0031624 | ubiquitin conjugating enzyme binding(GO:0031624) |
| 0.0 | 0.1 | GO:1990841 | promoter-specific chromatin binding(GO:1990841) |
| 0.0 | 0.9 | GO:0043565 | sequence-specific DNA binding(GO:0043565) |
Gene overrepresentation in C2:CP category:
| Log-likelihood per target | Total log-likelihood | Term | Description |
|---|---|---|---|
| 1.7 | 3.3 | PID S1P S1P2 PATHWAY | S1P2 pathway |
| 0.8 | 20.3 | SA PROGRAMMED CELL DEATH | Programmed cell death, or apoptosis, eliminates damaged or unneeded cells. |
| 0.8 | 68.0 | PID HNF3A PATHWAY | FOXA1 transcription factor network |
| 0.8 | 15.7 | PID ALK2 PATHWAY | ALK2 signaling events |
| 0.7 | 21.5 | PID TOLL ENDOGENOUS PATHWAY | Endogenous TLR signaling |
| 0.6 | 31.5 | PID NCADHERIN PATHWAY | N-cadherin signaling events |
| 0.6 | 38.8 | PID AJDISS 2PATHWAY | Posttranslational regulation of adherens junction stability and dissassembly |
| 0.6 | 2.2 | PID THROMBIN PAR1 PATHWAY | PAR1-mediated thrombin signaling events |
| 0.5 | 9.8 | PID P38 GAMMA DELTA PATHWAY | Signaling mediated by p38-gamma and p38-delta |
| 0.5 | 32.1 | PID FRA PATHWAY | Validated transcriptional targets of AP1 family members Fra1 and Fra2 |
| 0.4 | 6.1 | ST INTEGRIN SIGNALING PATHWAY | Integrin Signaling Pathway |
| 0.4 | 11.1 | SA CASPASE CASCADE | Apoptosis is mediated by caspases, cysteine proteases arranged in a proteolytic cascade. |
| 0.4 | 2.3 | PID CXCR4 PATHWAY | CXCR4-mediated signaling events |
| 0.4 | 16.4 | PID EPHRINB REV PATHWAY | Ephrin B reverse signaling |
| 0.4 | 25.6 | PID HNF3B PATHWAY | FOXA2 and FOXA3 transcription factor networks |
| 0.4 | 4.1 | PID ECADHERIN KERATINOCYTE PATHWAY | E-cadherin signaling in keratinocytes |
| 0.4 | 2.9 | PID ANTHRAX PATHWAY | Cellular roles of Anthrax toxin |
| 0.3 | 2.3 | PID HIF1A PATHWAY | Hypoxic and oxygen homeostasis regulation of HIF-1-alpha |
| 0.3 | 14.4 | SIG CD40PATHWAYMAP | Genes related to CD40 signaling |
| 0.3 | 9.7 | PID EPO PATHWAY | EPO signaling pathway |
| 0.3 | 7.4 | PID HEDGEHOG 2PATHWAY | Signaling events mediated by the Hedgehog family |
| 0.3 | 3.9 | PID CD8 TCR PATHWAY | TCR signaling in naïve CD8+ T cells |
| 0.3 | 6.4 | SA TRKA RECEPTOR | The TrkA receptor binds nerve growth factor to activate MAP kinase pathways and promote cell growth. |
| 0.3 | 13.2 | PID ALPHA SYNUCLEIN PATHWAY | Alpha-synuclein signaling |
| 0.3 | 14.8 | PID TCPTP PATHWAY | Signaling events mediated by TCPTP |
| 0.3 | 3.7 | PID INTEGRIN1 PATHWAY | Beta1 integrin cell surface interactions |
| 0.3 | 75.0 | NABA ECM REGULATORS | Genes encoding enzymes and their regulators involved in the remodeling of the extracellular matrix |
| 0.3 | 10.5 | ST GA13 PATHWAY | G alpha 13 Pathway |
| 0.3 | 4.1 | PID IFNG PATHWAY | IFN-gamma pathway |
| 0.3 | 2.3 | ST INTERLEUKIN 4 PATHWAY | Interleukin 4 (IL-4) Pathway |
| 0.3 | 4.0 | PID IL6 7 PATHWAY | IL6-mediated signaling events |
| 0.3 | 13.9 | PID ANGIOPOIETIN RECEPTOR PATHWAY | Angiopoietin receptor Tie2-mediated signaling |
| 0.3 | 3.9 | PID P38 MK2 PATHWAY | p38 signaling mediated by MAPKAP kinases |
| 0.3 | 9.7 | PID RHODOPSIN PATHWAY | Visual signal transduction: Rods |
| 0.3 | 12.7 | PID ATM PATHWAY | ATM pathway |
| 0.3 | 13.3 | PID IL4 2PATHWAY | IL4-mediated signaling events |
| 0.2 | 6.0 | PID NETRIN PATHWAY | Netrin-mediated signaling events |
| 0.2 | 83.9 | NABA SECRETED FACTORS | Genes encoding secreted soluble factors |
| 0.2 | 16.8 | PID RHOA REG PATHWAY | Regulation of RhoA activity |
| 0.2 | 39.2 | NABA ECM AFFILIATED | Genes encoding proteins affiliated structurally or functionally to extracellular matrix proteins |
| 0.2 | 8.2 | PID RXR VDR PATHWAY | RXR and RAR heterodimerization with other nuclear receptor |
| 0.2 | 9.1 | NABA COLLAGENS | Genes encoding collagen proteins |
| 0.2 | 4.9 | SA MMP CYTOKINE CONNECTION | Cytokines can induce activation of matrix metalloproteinases, which degrade extracellular matrix. |
| 0.2 | 6.3 | PID TCR CALCIUM PATHWAY | Calcium signaling in the CD4+ TCR pathway |
| 0.2 | 5.0 | PID PDGFRB PATHWAY | PDGFR-beta signaling pathway |
| 0.2 | 7.4 | PID ECADHERIN STABILIZATION PATHWAY | Stabilization and expansion of the E-cadherin adherens junction |
| 0.2 | 3.1 | PID GLYPICAN 1PATHWAY | Glypican 1 network |
| 0.2 | 4.0 | PID AMB2 NEUTROPHILS PATHWAY | amb2 Integrin signaling |
| 0.2 | 1.2 | PID NFAT 3PATHWAY | Role of Calcineurin-dependent NFAT signaling in lymphocytes |
| 0.1 | 2.7 | PID DNA PK PATHWAY | DNA-PK pathway in nonhomologous end joining |
| 0.1 | 4.2 | PID BARD1 PATHWAY | BARD1 signaling events |
| 0.1 | 3.7 | PID ATF2 PATHWAY | ATF-2 transcription factor network |
| 0.1 | 3.0 | PID IL1 PATHWAY | IL1-mediated signaling events |
| 0.1 | 2.7 | ST JNK MAPK PATHWAY | JNK MAPK Pathway |
| 0.1 | 4.9 | NABA PROTEOGLYCANS | Genes encoding proteoglycans |
| 0.1 | 1.5 | ST G ALPHA I PATHWAY | G alpha i Pathway |
| 0.1 | 1.1 | PID IL12 STAT4 PATHWAY | IL12 signaling mediated by STAT4 |
| 0.1 | 1.3 | PID NFKAPPAB CANONICAL PATHWAY | Canonical NF-kappaB pathway |
| 0.1 | 3.3 | PID BCR 5PATHWAY | BCR signaling pathway |
| 0.1 | 2.1 | ST WNT BETA CATENIN PATHWAY | Wnt/beta-catenin Pathway |
| 0.1 | 3.7 | PID CDC42 REG PATHWAY | Regulation of CDC42 activity |
| 0.1 | 1.5 | PID TXA2PATHWAY | Thromboxane A2 receptor signaling |
| 0.1 | 17.3 | NABA MATRISOME | Ensemble of genes encoding extracellular matrix and extracellular matrix-associated proteins |
| 0.1 | 3.3 | PID HEDGEHOG GLI PATHWAY | Hedgehog signaling events mediated by Gli proteins |
| 0.1 | 1.7 | PID INTEGRIN2 PATHWAY | Beta2 integrin cell surface interactions |
| 0.1 | 2.0 | PID RHOA PATHWAY | RhoA signaling pathway |
| 0.1 | 1.1 | PID TGFBR PATHWAY | TGF-beta receptor signaling |
| 0.1 | 2.2 | PID KIT PATHWAY | Signaling events mediated by Stem cell factor receptor (c-Kit) |
| 0.1 | 2.2 | PID RAC1 PATHWAY | RAC1 signaling pathway |
| 0.1 | 6.7 | PID MYC REPRESS PATHWAY | Validated targets of C-MYC transcriptional repression |
| 0.1 | 0.9 | PID P38 MKK3 6PATHWAY | p38 MAPK signaling pathway |
| 0.1 | 0.9 | PID ERBB2 ERBB3 PATHWAY | ErbB2/ErbB3 signaling events |
| 0.1 | 1.6 | PID SMAD2 3NUCLEAR PATHWAY | Regulation of nuclear SMAD2/3 signaling |
| 0.1 | 1.4 | ST MYOCYTE AD PATHWAY | Myocyte Adrenergic Pathway is a specific case of the generalized Adrenergic Pathway. |
| 0.1 | 1.4 | PID MAPK TRK PATHWAY | Trk receptor signaling mediated by the MAPK pathway |
| 0.1 | 2.0 | PID IL12 2PATHWAY | IL12-mediated signaling events |
| 0.1 | 0.7 | PID HES HEY PATHWAY | Notch-mediated HES/HEY network |
| 0.1 | 2.6 | PID AP1 PATHWAY | AP-1 transcription factor network |
| 0.1 | 0.9 | PID EPHB FWD PATHWAY | EPHB forward signaling |
| 0.0 | 1.4 | PID LYSOPHOSPHOLIPID PATHWAY | LPA receptor mediated events |
| 0.0 | 0.4 | SA FAS SIGNALING | The TNF-type receptor Fas induces apoptosis on ligand binding. |
| 0.0 | 0.2 | PID AR NONGENOMIC PATHWAY | Nongenotropic Androgen signaling |
| 0.0 | 1.3 | PID ARF6 PATHWAY | Arf6 signaling events |
| 0.0 | 0.8 | PID MET PATHWAY | Signaling events mediated by Hepatocyte Growth Factor Receptor (c-Met) |
| 0.0 | 0.6 | PID SMAD2 3PATHWAY | Regulation of cytoplasmic and nuclear SMAD2/3 signaling |
| 0.0 | 0.8 | PID AR TF PATHWAY | Regulation of Androgen receptor activity |
| 0.0 | 0.3 | PID IL2 1PATHWAY | IL2-mediated signaling events |
| 0.0 | 0.2 | PID NECTIN PATHWAY | Nectin adhesion pathway |
| 0.0 | 0.1 | PID ARF6 DOWNSTREAM PATHWAY | Arf6 downstream pathway |
| 0.0 | 0.3 | PID TCR PATHWAY | TCR signaling in naïve CD4+ T cells |
| 0.0 | 0.2 | PID ENDOTHELIN PATHWAY | Endothelins |
| 0.0 | 0.3 | PID FGF PATHWAY | FGF signaling pathway |
Gene overrepresentation in C2:CP:REACTOME category:
| Log-likelihood per target | Total log-likelihood | Term | Description |
|---|---|---|---|
| 1.7 | 24.4 | REACTOME PASSIVE TRANSPORT BY AQUAPORINS | Genes involved in Passive Transport by Aquaporins |
| 1.6 | 16.2 | REACTOME IRAK2 MEDIATED ACTIVATION OF TAK1 COMPLEX UPON TLR7 8 OR 9 STIMULATION | Genes involved in IRAK2 mediated activation of TAK1 complex upon TLR7/8 or 9 stimulation |
| 1.3 | 32.7 | REACTOME REGULATION OF INSULIN LIKE GROWTH FACTOR IGF ACTIVITY BY INSULIN LIKE GROWTH FACTOR BINDING PROTEINS IGFBPS | Genes involved in Regulation of Insulin-like Growth Factor (IGF) Activity by Insulin-like Growth Factor Binding Proteins (IGFBPs) |
| 1.2 | 24.7 | REACTOME INITIAL TRIGGERING OF COMPLEMENT | Genes involved in Initial triggering of complement |
| 1.1 | 25.2 | REACTOME CHYLOMICRON MEDIATED LIPID TRANSPORT | Genes involved in Chylomicron-mediated lipid transport |
| 1.1 | 7.8 | REACTOME TANDEM PORE DOMAIN POTASSIUM CHANNELS | Genes involved in Tandem pore domain potassium channels |
| 0.9 | 30.2 | REACTOME CASPASE MEDIATED CLEAVAGE OF CYTOSKELETAL PROTEINS | Genes involved in Caspase-mediated cleavage of cytoskeletal proteins |
| 0.8 | 24.9 | REACTOME ACTIVATED NOTCH1 TRANSMITS SIGNAL TO THE NUCLEUS | Genes involved in Activated NOTCH1 Transmits Signal to the Nucleus |
| 0.8 | 13.9 | REACTOME GAP JUNCTION ASSEMBLY | Genes involved in Gap junction assembly |
| 0.8 | 15.9 | REACTOME ORGANIC CATION ANION ZWITTERION TRANSPORT | Genes involved in Organic cation/anion/zwitterion transport |
| 0.6 | 19.2 | REACTOME AMINE COMPOUND SLC TRANSPORTERS | Genes involved in Amine compound SLC transporters |
| 0.6 | 7.4 | REACTOME GLUTAMATE NEUROTRANSMITTER RELEASE CYCLE | Genes involved in Glutamate Neurotransmitter Release Cycle |
| 0.6 | 1.2 | REACTOME ACYL CHAIN REMODELLING OF PG | Genes involved in Acyl chain remodelling of PG |
| 0.6 | 6.5 | REACTOME PROSTANOID LIGAND RECEPTORS | Genes involved in Prostanoid ligand receptors |
| 0.6 | 16.2 | REACTOME CIRCADIAN REPRESSION OF EXPRESSION BY REV ERBA | Genes involved in Circadian Repression of Expression by REV-ERBA |
| 0.6 | 16.7 | REACTOME COMPLEMENT CASCADE | Genes involved in Complement cascade |
| 0.6 | 31.6 | REACTOME NITRIC OXIDE STIMULATES GUANYLATE CYCLASE | Genes involved in Nitric oxide stimulates guanylate cyclase |
| 0.6 | 10.0 | REACTOME CLASS C 3 METABOTROPIC GLUTAMATE PHEROMONE RECEPTORS | Genes involved in Class C/3 (Metabotropic glutamate/pheromone receptors) |
| 0.5 | 3.2 | REACTOME MEMBRANE BINDING AND TARGETTING OF GAG PROTEINS | Genes involved in Membrane binding and targetting of GAG proteins |
| 0.5 | 3.1 | REACTOME NRIF SIGNALS CELL DEATH FROM THE NUCLEUS | Genes involved in NRIF signals cell death from the nucleus |
| 0.5 | 12.2 | REACTOME AMINE DERIVED HORMONES | Genes involved in Amine-derived hormones |
| 0.5 | 8.0 | REACTOME NOREPINEPHRINE NEUROTRANSMITTER RELEASE CYCLE | Genes involved in Norepinephrine Neurotransmitter Release Cycle |
| 0.5 | 7.0 | REACTOME FGFR4 LIGAND BINDING AND ACTIVATION | Genes involved in FGFR4 ligand binding and activation |
| 0.5 | 7.3 | REACTOME ANTIGEN ACTIVATES B CELL RECEPTOR LEADING TO GENERATION OF SECOND MESSENGERS | Genes involved in Antigen Activates B Cell Receptor Leading to Generation of Second Messengers |
| 0.5 | 8.9 | REACTOME HYALURONAN UPTAKE AND DEGRADATION | Genes involved in Hyaluronan uptake and degradation |
| 0.5 | 6.5 | REACTOME COMMON PATHWAY | Genes involved in Common Pathway |
| 0.5 | 14.6 | REACTOME ADHERENS JUNCTIONS INTERACTIONS | Genes involved in Adherens junctions interactions |
| 0.4 | 2.2 | REACTOME ACETYLCHOLINE NEUROTRANSMITTER RELEASE CYCLE | Genes involved in Acetylcholine Neurotransmitter Release Cycle |
| 0.4 | 9.8 | REACTOME ENDOGENOUS STEROLS | Genes involved in Endogenous sterols |
| 0.4 | 5.5 | REACTOME SEROTONIN RECEPTORS | Genes involved in Serotonin receptors |
| 0.4 | 6.3 | REACTOME SIGNAL ATTENUATION | Genes involved in Signal attenuation |
| 0.4 | 9.6 | REACTOME TRAFFICKING OF GLUR2 CONTAINING AMPA RECEPTORS | Genes involved in Trafficking of GluR2-containing AMPA receptors |
| 0.4 | 4.0 | REACTOME SYNTHESIS OF PIPS AT THE LATE ENDOSOME MEMBRANE | Genes involved in Synthesis of PIPs at the late endosome membrane |
| 0.4 | 4.7 | REACTOME RETROGRADE NEUROTROPHIN SIGNALLING | Genes involved in Retrograde neurotrophin signalling |
| 0.4 | 2.7 | REACTOME TRAF6 MEDIATED INDUCTION OF TAK1 COMPLEX | Genes involved in TRAF6 mediated induction of TAK1 complex |
| 0.4 | 19.1 | REACTOME VOLTAGE GATED POTASSIUM CHANNELS | Genes involved in Voltage gated Potassium channels |
| 0.4 | 1.5 | REACTOME SIGNALING BY SCF KIT | Genes involved in Signaling by SCF-KIT |
| 0.4 | 10.4 | REACTOME PLATELET CALCIUM HOMEOSTASIS | Genes involved in Platelet calcium homeostasis |
| 0.4 | 55.2 | REACTOME RESPONSE TO ELEVATED PLATELET CYTOSOLIC CA2 | Genes involved in Response to elevated platelet cytosolic Ca2+ |
| 0.4 | 12.2 | REACTOME DEGRADATION OF THE EXTRACELLULAR MATRIX | Genes involved in Degradation of the extracellular matrix |
| 0.4 | 5.3 | REACTOME KERATAN SULFATE DEGRADATION | Genes involved in Keratan sulfate degradation |
| 0.4 | 8.6 | REACTOME REGULATION OF SIGNALING BY CBL | Genes involved in Regulation of signaling by CBL |
| 0.4 | 2.6 | REACTOME NEGATIVE REGULATION OF THE PI3K AKT NETWORK | Genes involved in Negative regulation of the PI3K/AKT network |
| 0.4 | 1.8 | REACTOME SIGNALING BY EGFR IN CANCER | Genes involved in Signaling by EGFR in Cancer |
| 0.4 | 5.8 | REACTOME PRE NOTCH PROCESSING IN GOLGI | Genes involved in Pre-NOTCH Processing in Golgi |
| 0.4 | 12.2 | REACTOME EFFECTS OF PIP2 HYDROLYSIS | Genes involved in Effects of PIP2 hydrolysis |
| 0.4 | 10.3 | REACTOME REGULATION OF KIT SIGNALING | Genes involved in Regulation of KIT signaling |
| 0.3 | 4.0 | REACTOME THE ACTIVATION OF ARYLSULFATASES | Genes involved in The activation of arylsulfatases |
| 0.3 | 12.5 | REACTOME CELL CELL JUNCTION ORGANIZATION | Genes involved in Cell-cell junction organization |
| 0.3 | 11.2 | REACTOME SULFUR AMINO ACID METABOLISM | Genes involved in Sulfur amino acid metabolism |
| 0.3 | 10.9 | REACTOME GLUTATHIONE CONJUGATION | Genes involved in Glutathione conjugation |
| 0.3 | 7.3 | REACTOME ACTIVATION OF BH3 ONLY PROTEINS | Genes involved in Activation of BH3-only proteins |
| 0.3 | 5.2 | REACTOME REGULATION OF PYRUVATE DEHYDROGENASE PDH COMPLEX | Genes involved in Regulation of pyruvate dehydrogenase (PDH) complex |
| 0.3 | 0.9 | REACTOME PHOSPHORYLATION OF CD3 AND TCR ZETA CHAINS | Genes involved in Phosphorylation of CD3 and TCR zeta chains |
| 0.3 | 2.0 | REACTOME PLATELET AGGREGATION PLUG FORMATION | Genes involved in Platelet Aggregation (Plug Formation) |
| 0.3 | 17.5 | REACTOME CHEMOKINE RECEPTORS BIND CHEMOKINES | Genes involved in Chemokine receptors bind chemokines |
| 0.3 | 2.0 | REACTOME EICOSANOID LIGAND BINDING RECEPTORS | Genes involved in Eicosanoid ligand-binding receptors |
| 0.3 | 34.7 | REACTOME PEPTIDE LIGAND BINDING RECEPTORS | Genes involved in Peptide ligand-binding receptors |
| 0.3 | 4.0 | REACTOME BILE SALT AND ORGANIC ANION SLC TRANSPORTERS | Genes involved in Bile salt and organic anion SLC transporters |
| 0.3 | 8.0 | REACTOME AMINE LIGAND BINDING RECEPTORS | Genes involved in Amine ligand-binding receptors |
| 0.3 | 4.0 | REACTOME REVERSIBLE HYDRATION OF CARBON DIOXIDE | Genes involved in Reversible Hydration of Carbon Dioxide |
| 0.3 | 9.1 | REACTOME DEADENYLATION OF MRNA | Genes involved in Deadenylation of mRNA |
| 0.3 | 4.6 | REACTOME PROCESSING OF INTRONLESS PRE MRNAS | Genes involved in Processing of Intronless Pre-mRNAs |
| 0.3 | 4.9 | REACTOME TERMINATION OF O GLYCAN BIOSYNTHESIS | Genes involved in Termination of O-glycan biosynthesis |
| 0.3 | 3.1 | REACTOME ACYL CHAIN REMODELLING OF PC | Genes involved in Acyl chain remodelling of PC |
| 0.2 | 4.7 | REACTOME PTM GAMMA CARBOXYLATION HYPUSINE FORMATION AND ARYLSULFATASE ACTIVATION | Genes involved in PTM: gamma carboxylation, hypusine formation and arylsulfatase activation |
| 0.2 | 1.0 | REACTOME FGFR2C LIGAND BINDING AND ACTIVATION | Genes involved in FGFR2c ligand binding and activation |
| 0.2 | 15.1 | REACTOME PHASE1 FUNCTIONALIZATION OF COMPOUNDS | Genes involved in Phase 1 - Functionalization of compounds |
| 0.2 | 3.1 | REACTOME ACTIVATION OF CHAPERONE GENES BY ATF6 ALPHA | Genes involved in Activation of Chaperone Genes by ATF6-alpha |
| 0.2 | 9.8 | REACTOME ION TRANSPORT BY P TYPE ATPASES | Genes involved in Ion transport by P-type ATPases |
| 0.2 | 4.5 | REACTOME TRAFFICKING OF AMPA RECEPTORS | Genes involved in Trafficking of AMPA receptors |
| 0.2 | 6.3 | REACTOME SYNTHESIS OF PA | Genes involved in Synthesis of PA |
| 0.2 | 3.3 | REACTOME ZINC TRANSPORTERS | Genes involved in Zinc transporters |
| 0.2 | 13.1 | REACTOME COLLAGEN FORMATION | Genes involved in Collagen formation |
| 0.2 | 3.5 | REACTOME P2Y RECEPTORS | Genes involved in P2Y receptors |
| 0.2 | 2.2 | REACTOME TRAFFICKING AND PROCESSING OF ENDOSOMAL TLR | Genes involved in Trafficking and processing of endosomal TLR |
| 0.2 | 17.1 | REACTOME INTERFERON GAMMA SIGNALING | Genes involved in Interferon gamma signaling |
| 0.2 | 16.7 | REACTOME NUCLEAR RECEPTOR TRANSCRIPTION PATHWAY | Genes involved in Nuclear Receptor transcription pathway |
| 0.2 | 4.1 | REACTOME ACTIVATED TAK1 MEDIATES P38 MAPK ACTIVATION | Genes involved in activated TAK1 mediates p38 MAPK activation |
| 0.2 | 4.3 | REACTOME PROTEOLYTIC CLEAVAGE OF SNARE COMPLEX PROTEINS | Genes involved in Proteolytic cleavage of SNARE complex proteins |
| 0.2 | 3.7 | REACTOME N GLYCAN TRIMMING IN THE ER AND CALNEXIN CALRETICULIN CYCLE | Genes involved in N-glycan trimming in the ER and Calnexin/Calreticulin cycle |
| 0.2 | 3.7 | REACTOME SYNTHESIS OF PE | Genes involved in Synthesis of PE |
| 0.2 | 3.5 | REACTOME EGFR DOWNREGULATION | Genes involved in EGFR downregulation |
| 0.2 | 4.6 | REACTOME OTHER SEMAPHORIN INTERACTIONS | Genes involved in Other semaphorin interactions |
| 0.2 | 4.8 | REACTOME GLUCURONIDATION | Genes involved in Glucuronidation |
| 0.2 | 4.5 | REACTOME SIGNAL REGULATORY PROTEIN SIRP FAMILY INTERACTIONS | Genes involved in Signal regulatory protein (SIRP) family interactions |
| 0.2 | 7.3 | REACTOME NCAM1 INTERACTIONS | Genes involved in NCAM1 interactions |
| 0.2 | 3.8 | REACTOME SYNTHESIS OF VERY LONG CHAIN FATTY ACYL COAS | Genes involved in Synthesis of very long-chain fatty acyl-CoAs |
| 0.2 | 1.4 | REACTOME ANDROGEN BIOSYNTHESIS | Genes involved in Androgen biosynthesis |
| 0.2 | 5.3 | REACTOME ENERGY DEPENDENT REGULATION OF MTOR BY LKB1 AMPK | Genes involved in Energy dependent regulation of mTOR by LKB1-AMPK |
| 0.2 | 6.2 | REACTOME ABC FAMILY PROTEINS MEDIATED TRANSPORT | Genes involved in ABC-family proteins mediated transport |
| 0.2 | 3.6 | REACTOME FACILITATIVE NA INDEPENDENT GLUCOSE TRANSPORTERS | Genes involved in Facilitative Na+-independent glucose transporters |
| 0.2 | 5.7 | REACTOME NOTCH1 INTRACELLULAR DOMAIN REGULATES TRANSCRIPTION | Genes involved in NOTCH1 Intracellular Domain Regulates Transcription |
| 0.2 | 11.3 | REACTOME METABOLISM OF VITAMINS AND COFACTORS | Genes involved in Metabolism of vitamins and cofactors |
| 0.2 | 15.2 | REACTOME MEIOTIC RECOMBINATION | Genes involved in Meiotic Recombination |
| 0.2 | 2.8 | REACTOME TIE2 SIGNALING | Genes involved in Tie2 Signaling |
| 0.2 | 3.4 | REACTOME REGULATION OF GENE EXPRESSION IN BETA CELLS | Genes involved in Regulation of gene expression in beta cells |
| 0.2 | 2.4 | REACTOME BMAL1 CLOCK NPAS2 ACTIVATES CIRCADIAN EXPRESSION | Genes involved in BMAL1:CLOCK/NPAS2 Activates Circadian Expression |
| 0.1 | 4.0 | REACTOME THROMBIN SIGNALLING THROUGH PROTEINASE ACTIVATED RECEPTORS PARS | Genes involved in Thrombin signalling through proteinase activated receptors (PARs) |
| 0.1 | 3.5 | REACTOME AMYLOIDS | Genes involved in Amyloids |
| 0.1 | 10.2 | REACTOME INTEGRIN CELL SURFACE INTERACTIONS | Genes involved in Integrin cell surface interactions |
| 0.1 | 7.7 | REACTOME IMMUNOREGULATORY INTERACTIONS BETWEEN A LYMPHOID AND A NON LYMPHOID CELL | Genes involved in Immunoregulatory interactions between a Lymphoid and a non-Lymphoid cell |
| 0.1 | 0.7 | REACTOME G ALPHA1213 SIGNALLING EVENTS | Genes involved in G alpha (12/13) signalling events |
| 0.1 | 2.2 | REACTOME DOWNREGULATION OF ERBB2 ERBB3 SIGNALING | Genes involved in Downregulation of ERBB2:ERBB3 signaling |
| 0.1 | 1.1 | REACTOME RECYCLING PATHWAY OF L1 | Genes involved in Recycling pathway of L1 |
| 0.1 | 5.8 | REACTOME SMOOTH MUSCLE CONTRACTION | Genes involved in Smooth Muscle Contraction |
| 0.1 | 2.0 | REACTOME TRANSPORT OF ORGANIC ANIONS | Genes involved in Transport of organic anions |
| 0.1 | 3.6 | REACTOME DOWNREGULATION OF TGF BETA RECEPTOR SIGNALING | Genes involved in Downregulation of TGF-beta receptor signaling |
| 0.1 | 0.8 | REACTOME REGULATION OF BETA CELL DEVELOPMENT | Genes involved in Regulation of beta-cell development |
| 0.1 | 1.2 | REACTOME ROLE OF DCC IN REGULATING APOPTOSIS | Genes involved in Role of DCC in regulating apoptosis |
| 0.1 | 4.3 | REACTOME MUSCLE CONTRACTION | Genes involved in Muscle contraction |
| 0.1 | 1.8 | REACTOME REGULATION OF MRNA STABILITY BY PROTEINS THAT BIND AU RICH ELEMENTS | Genes involved in Regulation of mRNA Stability by Proteins that Bind AU-rich Elements |
| 0.1 | 1.1 | REACTOME CD28 DEPENDENT VAV1 PATHWAY | Genes involved in CD28 dependent Vav1 pathway |
| 0.1 | 0.7 | REACTOME HDL MEDIATED LIPID TRANSPORT | Genes involved in HDL-mediated lipid transport |
| 0.1 | 7.6 | REACTOME CLASS B 2 SECRETIN FAMILY RECEPTORS | Genes involved in Class B/2 (Secretin family receptors) |
| 0.1 | 1.8 | REACTOME PI3K CASCADE | Genes involved in PI3K Cascade |
| 0.1 | 3.5 | REACTOME NRAGE SIGNALS DEATH THROUGH JNK | Genes involved in NRAGE signals death through JNK |
| 0.1 | 0.4 | REACTOME ABACAVIR TRANSPORT AND METABOLISM | Genes involved in Abacavir transport and metabolism |
| 0.1 | 0.5 | REACTOME THE ROLE OF NEF IN HIV1 REPLICATION AND DISEASE PATHOGENESIS | Genes involved in The role of Nef in HIV-1 replication and disease pathogenesis |
| 0.1 | 8.0 | REACTOME FACTORS INVOLVED IN MEGAKARYOCYTE DEVELOPMENT AND PLATELET PRODUCTION | Genes involved in Factors involved in megakaryocyte development and platelet production |
| 0.1 | 0.9 | REACTOME PRESYNAPTIC NICOTINIC ACETYLCHOLINE RECEPTORS | Genes involved in Presynaptic nicotinic acetylcholine receptors |
| 0.1 | 0.9 | REACTOME SIGNALING BY PDGF | Genes involved in Signaling by PDGF |
| 0.0 | 1.4 | REACTOME CYTOSOLIC SULFONATION OF SMALL MOLECULES | Genes involved in Cytosolic sulfonation of small molecules |
| 0.0 | 0.2 | REACTOME ACTIVATION OF GENES BY ATF4 | Genes involved in Activation of Genes by ATF4 |
| 0.0 | 1.2 | REACTOME CHONDROITIN SULFATE BIOSYNTHESIS | Genes involved in Chondroitin sulfate biosynthesis |
| 0.0 | 1.0 | REACTOME ANTIGEN PROCESSING CROSS PRESENTATION | Genes involved in Antigen processing-Cross presentation |
| 0.0 | 1.1 | REACTOME SIGNALING BY HIPPO | Genes involved in Signaling by Hippo |
| 0.0 | 0.1 | REACTOME PD1 SIGNALING | Genes involved in PD-1 signaling |
| 0.0 | 1.2 | REACTOME INTERACTION BETWEEN L1 AND ANKYRINS | Genes involved in Interaction between L1 and Ankyrins |
| 0.0 | 1.2 | REACTOME CIRCADIAN CLOCK | Genes involved in Circadian Clock |
| 0.0 | 1.2 | REACTOME GLYCEROPHOSPHOLIPID BIOSYNTHESIS | Genes involved in Glycerophospholipid biosynthesis |
| 0.0 | 1.2 | REACTOME HS GAG BIOSYNTHESIS | Genes involved in HS-GAG biosynthesis |
| 0.0 | 1.0 | REACTOME POTASSIUM CHANNELS | Genes involved in Potassium Channels |
| 0.0 | 1.5 | REACTOME NGF SIGNALLING VIA TRKA FROM THE PLASMA MEMBRANE | Genes involved in NGF signalling via TRKA from the plasma membrane |
| 0.0 | 0.3 | REACTOME STEROID HORMONES | Genes involved in Steroid hormones |
| 0.0 | 1.0 | REACTOME IL1 SIGNALING | Genes involved in Interleukin-1 signaling |
| 0.0 | 0.5 | REACTOME SYNTHESIS OF SUBSTRATES IN N GLYCAN BIOSYTHESIS | Genes involved in Synthesis of substrates in N-glycan biosythesis |
| 0.0 | 0.8 | REACTOME BRANCHED CHAIN AMINO ACID CATABOLISM | Genes involved in Branched-chain amino acid catabolism |
| 0.0 | 0.6 | REACTOME MITOCHONDRIAL FATTY ACID BETA OXIDATION | Genes involved in Mitochondrial Fatty Acid Beta-Oxidation |
| 0.0 | 0.2 | REACTOME GLUCAGON SIGNALING IN METABOLIC REGULATION | Genes involved in Glucagon signaling in metabolic regulation |
| 0.0 | 2.1 | REACTOME PPARA ACTIVATES GENE EXPRESSION | Genes involved in PPARA Activates Gene Expression |
| 0.0 | 1.2 | REACTOME OLFACTORY SIGNALING PATHWAY | Genes involved in Olfactory Signaling Pathway |
| 0.0 | 1.4 | REACTOME METABOLISM OF NON CODING RNA | Genes involved in Metabolism of non-coding RNA |
| 0.0 | 0.6 | REACTOME CONVERSION FROM APC C CDC20 TO APC C CDH1 IN LATE ANAPHASE | Genes involved in Conversion from APC/C:Cdc20 to APC/C:Cdh1 in late anaphase |
| 0.0 | 0.4 | REACTOME NOD1 2 SIGNALING PATHWAY | Genes involved in NOD1/2 Signaling Pathway |
| 0.0 | 0.1 | REACTOME TETRAHYDROBIOPTERIN BH4 SYNTHESIS RECYCLING SALVAGE AND REGULATION | Genes involved in Tetrahydrobiopterin (BH4) synthesis, recycling, salvage and regulation |
| 0.0 | 0.6 | REACTOME INTERFERON SIGNALING | Genes involved in Interferon Signaling |
| 0.0 | 1.4 | REACTOME TOLL RECEPTOR CASCADES | Genes involved in Toll Receptor Cascades |
| 0.0 | 0.3 | REACTOME DARPP 32 EVENTS | Genes involved in DARPP-32 events |