Project
GNF SymAtlas + NCI-60 cancer cell lines, comparison of cancers vs non-cancers, human (Su, 2004; Ross, 2000)
Navigation
Downloads
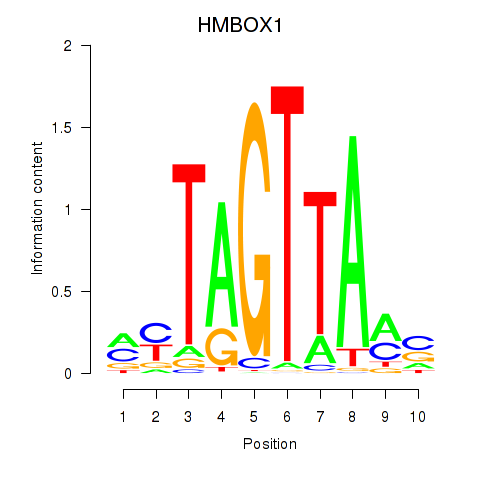
Results for HMBOX1
Z-value: 0.61
Motif logo
Transcription factors associated with HMBOX1
| Gene Symbol | Gene ID | Gene Info |
|---|---|---|
|
HMBOX1
|
ENSG00000147421.13 | homeobox containing 1 |
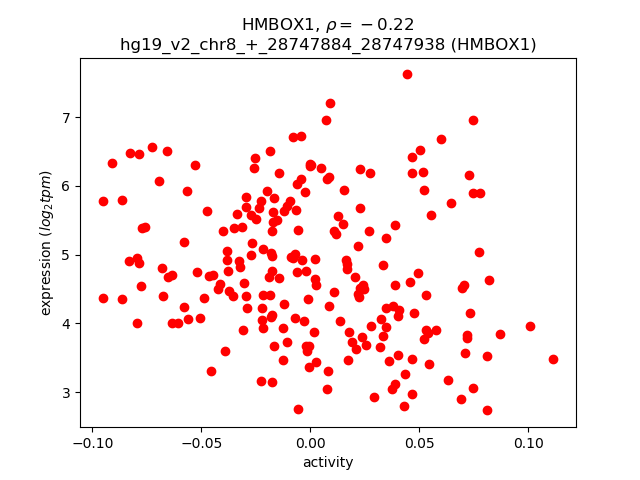
Activity-expression correlation:
| Gene | Promoter | Pearson corr. coef. | P-value | Plot |
|---|---|---|---|---|
| HMBOX1 | hg19_v2_chr8_+_28747884_28747938 | -0.22 | 1.3e-03 | Click! |
Activity profile of HMBOX1 motif
Sorted Z-values of HMBOX1 motif
| Promoter | Log-likelihood | Transcript | Gene | Gene Info |
|---|---|---|---|---|
| chr3_-_149095652 | 22.75 |
ENST00000305366.3
|
TM4SF1
|
transmembrane 4 L six family member 1 |
| chr6_+_27114861 | 20.54 |
ENST00000377459.1
|
HIST1H2AH
|
histone cluster 1, H2ah |
| chr3_+_33155525 | 16.37 |
ENST00000449224.1
|
CRTAP
|
cartilage associated protein |
| chr8_-_63951730 | 15.51 |
ENST00000260118.6
|
GGH
|
gamma-glutamyl hydrolase (conjugase, folylpolygammaglutamyl hydrolase) |
| chr1_-_152009460 | 14.64 |
ENST00000271638.2
|
S100A11
|
S100 calcium binding protein A11 |
| chr9_+_75766652 | 13.03 |
ENST00000257497.6
|
ANXA1
|
annexin A1 |
| chrX_-_10851762 | 12.82 |
ENST00000380785.1
ENST00000380787.1 |
MID1
|
midline 1 (Opitz/BBB syndrome) |
| chr6_-_27114577 | 12.39 |
ENST00000356950.1
ENST00000396891.4 |
HIST1H2BK
|
histone cluster 1, H2bk |
| chr19_+_16178317 | 10.99 |
ENST00000344824.6
ENST00000538887.1 |
TPM4
|
tropomyosin 4 |
| chrX_-_10588459 | 10.43 |
ENST00000380782.2
|
MID1
|
midline 1 (Opitz/BBB syndrome) |
| chr8_-_67977178 | 9.88 |
ENST00000517736.1
|
COPS5
|
COP9 signalosome subunit 5 |
| chr14_+_56078695 | 9.69 |
ENST00000416613.1
|
KTN1
|
kinectin 1 (kinesin receptor) |
| chrX_-_10588595 | 8.92 |
ENST00000423614.1
ENST00000317552.4 |
MID1
|
midline 1 (Opitz/BBB syndrome) |
| chrX_-_20236970 | 8.79 |
ENST00000379548.4
|
RPS6KA3
|
ribosomal protein S6 kinase, 90kDa, polypeptide 3 |
| chr8_+_30244580 | 8.07 |
ENST00000523115.1
ENST00000519647.1 |
RBPMS
|
RNA binding protein with multiple splicing |
| chr2_-_99952769 | 7.89 |
ENST00000409434.1
ENST00000434323.1 ENST00000264255.3 |
TXNDC9
|
thioredoxin domain containing 9 |
| chr1_+_45212051 | 7.76 |
ENST00000372222.3
|
KIF2C
|
kinesin family member 2C |
| chr7_-_102985288 | 7.33 |
ENST00000379263.3
|
DNAJC2
|
DnaJ (Hsp40) homolog, subfamily C, member 2 |
| chr13_+_48611665 | 7.27 |
ENST00000258662.2
|
NUDT15
|
nudix (nucleoside diphosphate linked moiety X)-type motif 15 |
| chr8_-_67525473 | 7.16 |
ENST00000522677.3
|
MYBL1
|
v-myb avian myeloblastosis viral oncogene homolog-like 1 |
| chr6_-_8102714 | 7.04 |
ENST00000502429.1
ENST00000429723.2 ENST00000507463.1 ENST00000379715.5 |
EEF1E1
|
eukaryotic translation elongation factor 1 epsilon 1 |
| chr7_+_135242652 | 6.66 |
ENST00000285968.6
ENST00000440390.2 |
NUP205
|
nucleoporin 205kDa |
| chr7_+_134576317 | 6.57 |
ENST00000424922.1
ENST00000495522.1 |
CALD1
|
caldesmon 1 |
| chr11_+_19798964 | 6.34 |
ENST00000527559.2
|
NAV2
|
neuron navigator 2 |
| chr1_-_150669500 | 6.22 |
ENST00000271732.3
|
GOLPH3L
|
golgi phosphoprotein 3-like |
| chr7_+_128379449 | 6.21 |
ENST00000479257.1
|
CALU
|
calumenin |
| chr17_-_3571934 | 6.13 |
ENST00000225525.3
|
TAX1BP3
|
Tax1 (human T-cell leukemia virus type I) binding protein 3 |
| chr3_-_141747439 | 6.06 |
ENST00000467667.1
|
TFDP2
|
transcription factor Dp-2 (E2F dimerization partner 2) |
| chr8_+_11666649 | 6.05 |
ENST00000528643.1
ENST00000525777.1 |
FDFT1
|
farnesyl-diphosphate farnesyltransferase 1 |
| chrX_+_70503037 | 5.97 |
ENST00000535149.1
|
NONO
|
non-POU domain containing, octamer-binding |
| chr7_+_134576151 | 5.92 |
ENST00000393118.2
|
CALD1
|
caldesmon 1 |
| chr8_-_101734170 | 5.91 |
ENST00000522387.1
ENST00000518196.1 |
PABPC1
|
poly(A) binding protein, cytoplasmic 1 |
| chr9_+_101984577 | 5.77 |
ENST00000223641.4
|
SEC61B
|
Sec61 beta subunit |
| chr4_-_47465666 | 5.70 |
ENST00000381571.4
|
COMMD8
|
COMM domain containing 8 |
| chr10_+_35484793 | 5.25 |
ENST00000488741.1
ENST00000474931.1 ENST00000468236.1 ENST00000344351.5 ENST00000490511.1 |
CREM
|
cAMP responsive element modulator |
| chr11_-_57194948 | 5.15 |
ENST00000533235.1
ENST00000526621.1 ENST00000352187.1 |
SLC43A3
|
solute carrier family 43, member 3 |
| chr3_+_69928256 | 5.11 |
ENST00000394355.2
|
MITF
|
microphthalmia-associated transcription factor |
| chr5_-_77844974 | 5.07 |
ENST00000515007.2
|
LHFPL2
|
lipoma HMGIC fusion partner-like 2 |
| chr17_-_40134339 | 4.84 |
ENST00000587727.1
|
DNAJC7
|
DnaJ (Hsp40) homolog, subfamily C, member 7 |
| chr1_+_207943667 | 4.78 |
ENST00000462968.2
|
CD46
|
CD46 molecule, complement regulatory protein |
| chr22_+_19419425 | 4.75 |
ENST00000333130.3
|
MRPL40
|
mitochondrial ribosomal protein L40 |
| chr1_+_117602925 | 4.72 |
ENST00000369466.4
|
TTF2
|
transcription termination factor, RNA polymerase II |
| chr7_-_99699538 | 4.70 |
ENST00000343023.6
ENST00000303887.5 |
MCM7
|
minichromosome maintenance complex component 7 |
| chr12_-_77272765 | 4.58 |
ENST00000547435.1
ENST00000552330.1 ENST00000546966.1 ENST00000311083.5 |
CSRP2
|
cysteine and glycine-rich protein 2 |
| chr1_-_32384693 | 4.42 |
ENST00000602683.1
ENST00000470404.1 |
PTP4A2
|
protein tyrosine phosphatase type IVA, member 2 |
| chr3_+_37035289 | 4.38 |
ENST00000455445.2
ENST00000441265.1 ENST00000435176.1 ENST00000429117.1 ENST00000536378.1 |
MLH1
|
mutL homolog 1 |
| chr10_-_112678904 | 4.37 |
ENST00000423273.1
ENST00000436562.1 ENST00000447005.1 ENST00000454061.1 |
BBIP1
|
BBSome interacting protein 1 |
| chr7_+_107220899 | 4.33 |
ENST00000379117.2
ENST00000473124.1 |
BCAP29
|
B-cell receptor-associated protein 29 |
| chrX_+_109246285 | 4.32 |
ENST00000372073.1
ENST00000372068.2 ENST00000288381.4 |
TMEM164
|
transmembrane protein 164 |
| chr10_-_94257512 | 4.17 |
ENST00000371581.5
|
IDE
|
insulin-degrading enzyme |
| chr6_+_138725343 | 4.10 |
ENST00000607197.1
ENST00000367697.3 |
HEBP2
|
heme binding protein 2 |
| chr20_-_48770244 | 4.06 |
ENST00000371650.5
ENST00000371652.4 ENST00000557021.1 |
TMEM189
|
transmembrane protein 189 |
| chr7_+_128095945 | 3.92 |
ENST00000257696.4
|
HILPDA
|
hypoxia inducible lipid droplet-associated |
| chr17_+_3572087 | 3.91 |
ENST00000248378.5
ENST00000397133.2 |
EMC6
|
ER membrane protein complex subunit 6 |
| chr7_+_99006550 | 3.82 |
ENST00000222969.5
|
BUD31
|
BUD31 homolog (S. cerevisiae) |
| chr3_+_33155444 | 3.80 |
ENST00000320954.6
|
CRTAP
|
cartilage associated protein |
| chr10_+_89419370 | 3.74 |
ENST00000361175.4
ENST00000456849.1 |
PAPSS2
|
3'-phosphoadenosine 5'-phosphosulfate synthase 2 |
| chr11_+_65769550 | 3.73 |
ENST00000312175.2
ENST00000445560.2 ENST00000530204.1 |
BANF1
|
barrier to autointegration factor 1 |
| chr19_-_19051103 | 3.71 |
ENST00000542541.2
ENST00000433218.2 |
HOMER3
|
homer homolog 3 (Drosophila) |
| chr12_+_75874580 | 3.70 |
ENST00000456650.3
|
GLIPR1
|
GLI pathogenesis-related 1 |
| chr12_-_57113333 | 3.52 |
ENST00000550920.1
|
NACA
|
nascent polypeptide-associated complex alpha subunit |
| chrX_+_70503433 | 3.49 |
ENST00000276079.8
ENST00000373856.3 ENST00000373841.1 ENST00000420903.1 |
NONO
|
non-POU domain containing, octamer-binding |
| chr2_+_27994567 | 3.33 |
ENST00000379666.3
ENST00000296102.3 |
MRPL33
|
mitochondrial ribosomal protein L33 |
| chr16_-_67281413 | 3.17 |
ENST00000258201.4
|
FHOD1
|
formin homology 2 domain containing 1 |
| chr4_-_10117949 | 3.16 |
ENST00000508079.1
|
WDR1
|
WD repeat domain 1 |
| chr1_-_27216729 | 3.09 |
ENST00000431781.2
ENST00000374135.4 |
GPN2
|
GPN-loop GTPase 2 |
| chr12_+_4758264 | 3.06 |
ENST00000266544.5
|
NDUFA9
|
NADH dehydrogenase (ubiquinone) 1 alpha subcomplex, 9, 39kDa |
| chr11_-_58345569 | 2.96 |
ENST00000528954.1
ENST00000528489.1 |
LPXN
|
leupaxin |
| chr6_+_30585486 | 2.94 |
ENST00000259873.4
ENST00000506373.2 |
MRPS18B
|
mitochondrial ribosomal protein S18B |
| chr2_+_68384976 | 2.93 |
ENST00000263657.2
|
PNO1
|
partner of NOB1 homolog (S. cerevisiae) |
| chr10_+_124913793 | 2.93 |
ENST00000368865.4
ENST00000538238.1 ENST00000368859.2 |
BUB3
|
BUB3 mitotic checkpoint protein |
| chr14_-_50999307 | 2.89 |
ENST00000013125.4
|
MAP4K5
|
mitogen-activated protein kinase kinase kinase kinase 5 |
| chr10_+_75936444 | 2.88 |
ENST00000372734.3
ENST00000541550.1 |
ADK
|
adenosine kinase |
| chr14_+_90422239 | 2.86 |
ENST00000393452.3
ENST00000554180.1 ENST00000393454.2 ENST00000553617.1 ENST00000335725.4 ENST00000357382.3 ENST00000556867.1 ENST00000553527.1 |
TDP1
|
tyrosyl-DNA phosphodiesterase 1 |
| chr5_-_137667459 | 2.82 |
ENST00000415130.2
ENST00000356505.3 ENST00000357274.3 ENST00000348983.3 ENST00000323760.6 |
CDC25C
|
cell division cycle 25C |
| chr1_+_174844645 | 2.81 |
ENST00000486220.1
|
RABGAP1L
|
RAB GTPase activating protein 1-like |
| chrX_-_74376108 | 2.80 |
ENST00000339447.4
ENST00000373394.3 ENST00000529949.1 ENST00000534524.1 ENST00000253577.3 |
ABCB7
|
ATP-binding cassette, sub-family B (MDR/TAP), member 7 |
| chr12_+_117013656 | 2.74 |
ENST00000556529.1
|
MAP1LC3B2
|
microtubule-associated protein 1 light chain 3 beta 2 |
| chr20_-_43133491 | 2.72 |
ENST00000411544.1
|
SERINC3
|
serine incorporator 3 |
| chr3_-_49142504 | 2.71 |
ENST00000306125.6
ENST00000420147.2 |
QARS
|
glutaminyl-tRNA synthetase |
| chr7_-_47579188 | 2.65 |
ENST00000398879.1
ENST00000355730.3 ENST00000442536.2 ENST00000458317.2 |
TNS3
|
tensin 3 |
| chr1_-_110283138 | 2.62 |
ENST00000256594.3
|
GSTM3
|
glutathione S-transferase mu 3 (brain) |
| chr4_-_114900831 | 2.51 |
ENST00000315366.7
|
ARSJ
|
arylsulfatase family, member J |
| chr3_-_141747459 | 2.50 |
ENST00000477292.1
ENST00000478006.1 ENST00000495310.1 ENST00000486111.1 |
TFDP2
|
transcription factor Dp-2 (E2F dimerization partner 2) |
| chr15_+_79166065 | 2.41 |
ENST00000559690.1
ENST00000559158.1 |
MORF4L1
|
mortality factor 4 like 1 |
| chr3_+_52444651 | 2.40 |
ENST00000327906.3
|
PHF7
|
PHD finger protein 7 |
| chr11_-_47447970 | 2.26 |
ENST00000298852.3
ENST00000530912.1 |
PSMC3
|
proteasome (prosome, macropain) 26S subunit, ATPase, 3 |
| chr2_+_204193129 | 2.18 |
ENST00000417864.1
|
ABI2
|
abl-interactor 2 |
| chr2_-_27632390 | 2.07 |
ENST00000350803.4
ENST00000344034.4 |
PPM1G
|
protein phosphatase, Mg2+/Mn2+ dependent, 1G |
| chr2_+_204193149 | 2.04 |
ENST00000422511.2
|
ABI2
|
abl-interactor 2 |
| chr3_+_101504200 | 2.03 |
ENST00000422132.1
|
NXPE3
|
neurexophilin and PC-esterase domain family, member 3 |
| chr2_+_204193101 | 2.02 |
ENST00000430418.1
ENST00000424558.1 ENST00000261016.6 |
ABI2
|
abl-interactor 2 |
| chr1_+_198126093 | 1.98 |
ENST00000367385.4
ENST00000442588.1 ENST00000538004.1 |
NEK7
|
NIMA-related kinase 7 |
| chr17_-_10452929 | 1.94 |
ENST00000532183.2
ENST00000397183.2 ENST00000420805.1 |
MYH2
|
myosin, heavy chain 2, skeletal muscle, adult |
| chr2_+_162087577 | 1.91 |
ENST00000439442.1
|
TANK
|
TRAF family member-associated NFKB activator |
| chr2_+_127782787 | 1.86 |
ENST00000564121.1
|
RP11-521O16.2
|
RP11-521O16.2 |
| chr1_+_206643806 | 1.79 |
ENST00000537984.1
|
IKBKE
|
inhibitor of kappa light polypeptide gene enhancer in B-cells, kinase epsilon |
| chr4_+_74347400 | 1.75 |
ENST00000226355.3
|
AFM
|
afamin |
| chr7_+_101460882 | 1.71 |
ENST00000292535.7
ENST00000549414.2 ENST00000550008.2 ENST00000546411.2 ENST00000556210.1 |
CUX1
|
cut-like homeobox 1 |
| chr11_+_10772534 | 1.68 |
ENST00000361367.2
|
CTR9
|
CTR9, Paf1/RNA polymerase II complex component |
| chr16_-_71842941 | 1.68 |
ENST00000423132.2
ENST00000433195.2 ENST00000569748.1 ENST00000570017.1 |
AP1G1
|
adaptor-related protein complex 1, gamma 1 subunit |
| chrX_-_77225135 | 1.65 |
ENST00000458128.1
|
PGAM4
|
phosphoglycerate mutase family member 4 |
| chr1_+_89246647 | 1.60 |
ENST00000544045.1
|
PKN2
|
protein kinase N2 |
| chr10_-_54531406 | 1.60 |
ENST00000373968.3
|
MBL2
|
mannose-binding lectin (protein C) 2, soluble |
| chrX_+_66764375 | 1.58 |
ENST00000374690.3
|
AR
|
androgen receptor |
| chr16_+_89696692 | 1.44 |
ENST00000261615.4
|
DPEP1
|
dipeptidase 1 (renal) |
| chr11_+_65343494 | 1.44 |
ENST00000309295.4
ENST00000533237.1 |
EHBP1L1
|
EH domain binding protein 1-like 1 |
| chr8_-_95449155 | 1.41 |
ENST00000481490.2
|
FSBP
|
fibrinogen silencer binding protein |
| chr1_+_100436065 | 1.41 |
ENST00000370153.1
|
SLC35A3
|
solute carrier family 35 (UDP-N-acetylglucosamine (UDP-GlcNAc) transporter), member A3 |
| chr14_+_21458127 | 1.40 |
ENST00000382985.4
ENST00000556670.2 ENST00000553564.1 ENST00000554751.1 ENST00000554283.1 ENST00000555670.1 |
METTL17
|
methyltransferase like 17 |
| chr22_-_37172111 | 1.40 |
ENST00000417951.2
ENST00000430701.1 ENST00000433985.2 |
IFT27
|
intraflagellar transport 27 homolog (Chlamydomonas) |
| chr17_-_56494713 | 1.39 |
ENST00000407977.2
|
RNF43
|
ring finger protein 43 |
| chr2_+_127413481 | 1.32 |
ENST00000259254.4
|
GYPC
|
glycophorin C (Gerbich blood group) |
| chr12_-_25348007 | 1.30 |
ENST00000354189.5
ENST00000545133.1 ENST00000554347.1 ENST00000395987.3 ENST00000320267.9 ENST00000395990.2 ENST00000537577.1 |
CASC1
|
cancer susceptibility candidate 1 |
| chr1_-_93257951 | 1.28 |
ENST00000543509.1
ENST00000370331.1 ENST00000540033.1 |
EVI5
|
ecotropic viral integration site 5 |
| chr19_-_41903161 | 1.27 |
ENST00000602129.1
ENST00000593771.1 ENST00000596905.1 ENST00000221233.4 |
EXOSC5
|
exosome component 5 |
| chr14_+_32030582 | 1.24 |
ENST00000550649.1
ENST00000281081.7 |
NUBPL
|
nucleotide binding protein-like |
| chr17_-_1395954 | 1.24 |
ENST00000359786.5
|
MYO1C
|
myosin IC |
| chr4_-_110723134 | 1.24 |
ENST00000510800.1
ENST00000512148.1 |
CFI
|
complement factor I |
| chr10_+_112679301 | 1.23 |
ENST00000265277.5
ENST00000369452.4 |
SHOC2
|
soc-2 suppressor of clear homolog (C. elegans) |
| chr6_+_26199737 | 1.19 |
ENST00000359985.1
|
HIST1H2BF
|
histone cluster 1, H2bf |
| chr3_-_126327398 | 1.17 |
ENST00000383572.2
|
TXNRD3NB
|
thioredoxin reductase 3 neighbor |
| chr14_-_21566731 | 1.10 |
ENST00000360947.3
|
ZNF219
|
zinc finger protein 219 |
| chr16_-_18908196 | 1.09 |
ENST00000565324.1
ENST00000561947.1 |
SMG1
|
SMG1 phosphatidylinositol 3-kinase-related kinase |
| chr4_-_110723194 | 1.07 |
ENST00000394635.3
|
CFI
|
complement factor I |
| chr6_-_52668605 | 1.07 |
ENST00000334575.5
|
GSTA1
|
glutathione S-transferase alpha 1 |
| chr22_-_37172191 | 1.07 |
ENST00000340630.5
|
IFT27
|
intraflagellar transport 27 homolog (Chlamydomonas) |
| chr7_-_120498357 | 1.02 |
ENST00000415871.1
ENST00000222747.3 ENST00000430985.1 |
TSPAN12
|
tetraspanin 12 |
| chr2_-_183387064 | 1.02 |
ENST00000536095.1
ENST00000331935.6 ENST00000358139.2 ENST00000456212.1 |
PDE1A
|
phosphodiesterase 1A, calmodulin-dependent |
| chr16_-_71843047 | 0.95 |
ENST00000299980.4
ENST00000393512.3 |
AP1G1
|
adaptor-related protein complex 1, gamma 1 subunit |
| chr2_+_109335929 | 0.88 |
ENST00000283195.6
|
RANBP2
|
RAN binding protein 2 |
| chr14_-_23623577 | 0.88 |
ENST00000422941.2
ENST00000453702.1 |
SLC7A8
|
solute carrier family 7 (amino acid transporter light chain, L system), member 8 |
| chr1_-_217250231 | 0.87 |
ENST00000493748.1
ENST00000463665.1 |
ESRRG
|
estrogen-related receptor gamma |
| chr17_-_56494908 | 0.87 |
ENST00000577716.1
|
RNF43
|
ring finger protein 43 |
| chr17_-_56494882 | 0.87 |
ENST00000584437.1
|
RNF43
|
ring finger protein 43 |
| chr6_-_165989936 | 0.79 |
ENST00000354448.4
|
PDE10A
|
phosphodiesterase 10A |
| chr4_-_159080806 | 0.74 |
ENST00000590648.1
|
FAM198B
|
family with sequence similarity 198, member B |
| chr7_-_122840015 | 0.73 |
ENST00000194130.2
|
SLC13A1
|
solute carrier family 13 (sodium/sulfate symporter), member 1 |
| chr20_-_2644832 | 0.73 |
ENST00000380851.5
ENST00000380843.4 |
IDH3B
|
isocitrate dehydrogenase 3 (NAD+) beta |
| chr1_+_206643787 | 0.72 |
ENST00000367120.3
|
IKBKE
|
inhibitor of kappa light polypeptide gene enhancer in B-cells, kinase epsilon |
| chr11_-_59950519 | 0.71 |
ENST00000528851.1
|
MS4A6A
|
membrane-spanning 4-domains, subfamily A, member 6A |
| chr11_-_59950486 | 0.71 |
ENST00000426738.2
ENST00000533023.1 ENST00000420732.2 |
MS4A6A
|
membrane-spanning 4-domains, subfamily A, member 6A |
| chr1_-_169396666 | 0.71 |
ENST00000456107.1
ENST00000367805.3 |
CCDC181
|
coiled-coil domain containing 181 |
| chr1_+_24286287 | 0.70 |
ENST00000334351.7
ENST00000374468.1 |
PNRC2
|
proline-rich nuclear receptor coactivator 2 |
| chr5_+_176561129 | 0.68 |
ENST00000511258.1
ENST00000347982.4 |
NSD1
|
nuclear receptor binding SET domain protein 1 |
| chr12_-_68619586 | 0.67 |
ENST00000229134.4
|
IL26
|
interleukin 26 |
| chr1_+_175036966 | 0.66 |
ENST00000239462.4
|
TNN
|
tenascin N |
| chr17_-_10372875 | 0.64 |
ENST00000255381.2
|
MYH4
|
myosin, heavy chain 4, skeletal muscle |
| chr4_+_187187098 | 0.61 |
ENST00000403665.2
ENST00000264692.4 |
F11
|
coagulation factor XI |
| chr12_+_28343353 | 0.59 |
ENST00000539107.1
|
CCDC91
|
coiled-coil domain containing 91 |
| chr20_+_43211149 | 0.56 |
ENST00000372886.1
|
PKIG
|
protein kinase (cAMP-dependent, catalytic) inhibitor gamma |
| chrX_-_21776281 | 0.54 |
ENST00000379494.3
|
SMPX
|
small muscle protein, X-linked |
| chr9_-_114246635 | 0.53 |
ENST00000338205.5
|
KIAA0368
|
KIAA0368 |
| chr4_+_9172135 | 0.51 |
ENST00000512047.1
|
FAM90A26
|
family with sequence similarity 90, member A26 |
| chr3_-_45837959 | 0.51 |
ENST00000353278.4
ENST00000456124.2 |
SLC6A20
|
solute carrier family 6 (proline IMINO transporter), member 20 |
| chr5_+_138629417 | 0.47 |
ENST00000510056.1
ENST00000511249.1 ENST00000503811.1 ENST00000511378.1 |
MATR3
|
matrin 3 |
| chr4_+_74301880 | 0.47 |
ENST00000395792.2
ENST00000226359.2 |
AFP
|
alpha-fetoprotein |
| chr14_+_75536280 | 0.46 |
ENST00000238686.8
|
ZC2HC1C
|
zinc finger, C2HC-type containing 1C |
| chr5_-_157079372 | 0.45 |
ENST00000311371.5
|
SOX30
|
SRY (sex determining region Y)-box 30 |
| chr5_+_176560742 | 0.45 |
ENST00000439151.2
|
NSD1
|
nuclear receptor binding SET domain protein 1 |
| chr18_-_19283649 | 0.44 |
ENST00000584464.1
ENST00000578270.1 |
ABHD3
|
abhydrolase domain containing 3 |
| chr14_+_75536335 | 0.40 |
ENST00000554763.1
ENST00000439583.2 ENST00000526130.1 ENST00000525046.1 |
ZC2HC1C
|
zinc finger, C2HC-type containing 1C |
| chrX_+_70752917 | 0.38 |
ENST00000373719.3
|
OGT
|
O-linked N-acetylglucosamine (GlcNAc) transferase |
| chr9_-_123555655 | 0.36 |
ENST00000340778.5
ENST00000453291.1 ENST00000608872.1 |
FBXW2
|
F-box and WD repeat domain containing 2 |
| chr14_+_22748980 | 0.35 |
ENST00000390465.2
|
TRAV38-2DV8
|
T cell receptor alpha variable 38-2/delta variable 8 |
| chr10_+_115312766 | 0.30 |
ENST00000351270.3
|
HABP2
|
hyaluronan binding protein 2 |
| chr12_+_51633061 | 0.27 |
ENST00000551313.1
|
DAZAP2
|
DAZ associated protein 2 |
| chr8_+_67976593 | 0.25 |
ENST00000262210.5
ENST00000412460.1 |
CSPP1
|
centrosome and spindle pole associated protein 1 |
| chrX_+_16964985 | 0.24 |
ENST00000303843.7
|
REPS2
|
RALBP1 associated Eps domain containing 2 |
| chr18_-_31803435 | 0.24 |
ENST00000589544.1
ENST00000269185.4 ENST00000261592.5 |
NOL4
|
nucleolar protein 4 |
| chr5_+_110559784 | 0.24 |
ENST00000282356.4
|
CAMK4
|
calcium/calmodulin-dependent protein kinase IV |
| chr5_+_178977546 | 0.23 |
ENST00000319449.4
ENST00000377001.2 |
RUFY1
|
RUN and FYVE domain containing 1 |
| chr10_+_124320195 | 0.22 |
ENST00000359586.6
|
DMBT1
|
deleted in malignant brain tumors 1 |
| chr9_-_21202204 | 0.21 |
ENST00000239347.3
|
IFNA7
|
interferon, alpha 7 |
| chr1_-_173176452 | 0.20 |
ENST00000281834.3
|
TNFSF4
|
tumor necrosis factor (ligand) superfamily, member 4 |
| chr21_+_45725050 | 0.19 |
ENST00000403390.1
|
PFKL
|
phosphofructokinase, liver |
| chr5_+_131705438 | 0.18 |
ENST00000245407.3
|
SLC22A5
|
solute carrier family 22 (organic cation/carnitine transporter), member 5 |
| chr12_-_10962767 | 0.18 |
ENST00000240691.2
|
TAS2R9
|
taste receptor, type 2, member 9 |
| chr8_+_27491572 | 0.18 |
ENST00000301904.3
|
SCARA3
|
scavenger receptor class A, member 3 |
| chr1_-_169396646 | 0.17 |
ENST00000367806.3
|
CCDC181
|
coiled-coil domain containing 181 |
| chr10_-_5046042 | 0.16 |
ENST00000421196.3
ENST00000455190.1 |
AKR1C2
|
aldo-keto reductase family 1, member C2 |
| chr3_-_45838011 | 0.15 |
ENST00000358525.4
ENST00000413781.1 |
SLC6A20
|
solute carrier family 6 (proline IMINO transporter), member 20 |
| chr19_+_38826415 | 0.13 |
ENST00000410018.1
ENST00000409235.3 |
CATSPERG
|
catsper channel auxiliary subunit gamma |
| chr2_+_106468204 | 0.12 |
ENST00000425756.1
ENST00000393349.2 |
NCK2
|
NCK adaptor protein 2 |
| chr14_+_64854958 | 0.10 |
ENST00000555709.2
ENST00000554739.1 ENST00000554768.1 ENST00000216605.8 |
MTHFD1
|
methylenetetrahydrofolate dehydrogenase (NADP+ dependent) 1, methenyltetrahydrofolate cyclohydrolase, formyltetrahydrofolate synthetase |
| chr12_+_81101277 | 0.10 |
ENST00000228641.3
|
MYF6
|
myogenic factor 6 (herculin) |
| chr5_+_110559603 | 0.05 |
ENST00000512453.1
|
CAMK4
|
calcium/calmodulin-dependent protein kinase IV |
| chr1_-_21113105 | 0.03 |
ENST00000375000.1
ENST00000419490.1 ENST00000414993.1 ENST00000443615.1 ENST00000312239.5 |
HP1BP3
|
heterochromatin protein 1, binding protein 3 |
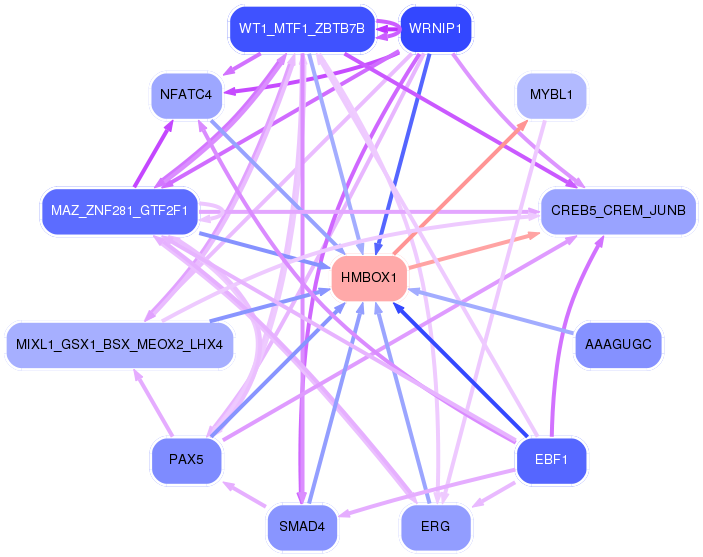
Network of associatons between targets according to the STRING database.

First level regulatory network of HMBOX1
Gene Ontology Analysis
Gene overrepresentation in biological_process category:
| Log-likelihood per target | Total log-likelihood | Term | Description |
|---|---|---|---|
| 6.7 | 20.2 | GO:1901873 | regulation of post-translational protein modification(GO:1901873) |
| 5.2 | 15.5 | GO:0046900 | tetrahydrofolylpolyglutamate metabolic process(GO:0046900) |
| 4.3 | 13.0 | GO:1900138 | negative regulation of phospholipase A2 activity(GO:1900138) |
| 2.5 | 32.2 | GO:0035372 | protein localization to microtubule(GO:0035372) |
| 2.4 | 7.3 | GO:0051083 | 'de novo' cotranslational protein folding(GO:0051083) |
| 2.0 | 7.9 | GO:0008616 | queuosine biosynthetic process(GO:0008616) queuosine metabolic process(GO:0046116) |
| 1.8 | 7.3 | GO:0006203 | dGTP catabolic process(GO:0006203) |
| 1.6 | 6.3 | GO:0021564 | vagus nerve development(GO:0021564) |
| 1.6 | 9.5 | GO:1903377 | negative regulation of oxidative stress-induced neuron intrinsic apoptotic signaling pathway(GO:1903377) |
| 1.5 | 4.4 | GO:0051311 | meiotic metaphase I plate congression(GO:0043060) meiotic spindle midzone assembly(GO:0051257) meiotic metaphase plate congression(GO:0051311) |
| 1.4 | 4.2 | GO:1901143 | insulin catabolic process(GO:1901143) |
| 1.2 | 6.0 | GO:0006696 | ergosterol biosynthetic process(GO:0006696) ergosterol metabolic process(GO:0008204) |
| 1.2 | 5.8 | GO:0006620 | posttranslational protein targeting to membrane(GO:0006620) |
| 1.0 | 3.1 | GO:1990022 | RNA polymerase II complex import to nucleus(GO:0044376) RNA polymerase III complex localization to nucleus(GO:1990022) |
| 1.0 | 2.9 | GO:0044209 | AMP salvage(GO:0044209) |
| 0.9 | 3.7 | GO:0000103 | sulfate assimilation(GO:0000103) |
| 0.9 | 2.7 | GO:0006425 | glutaminyl-tRNA aminoacylation(GO:0006425) |
| 0.8 | 3.2 | GO:0016334 | morphogenesis of follicular epithelium(GO:0016333) establishment or maintenance of polarity of follicular epithelium(GO:0016334) establishment of planar polarity of follicular epithelium(GO:0042247) |
| 0.8 | 3.1 | GO:0038018 | Wnt receptor catabolic process(GO:0038018) |
| 0.8 | 7.8 | GO:0030951 | establishment or maintenance of microtubule cytoskeleton polarity(GO:0030951) |
| 0.7 | 5.9 | GO:2000623 | regulation of nuclear-transcribed mRNA catabolic process, nonsense-mediated decay(GO:2000622) negative regulation of nuclear-transcribed mRNA catabolic process, nonsense-mediated decay(GO:2000623) |
| 0.7 | 2.6 | GO:0043323 | regulation of natural killer cell degranulation(GO:0043321) positive regulation of natural killer cell degranulation(GO:0043323) |
| 0.7 | 12.4 | GO:0002227 | innate immune response in mucosa(GO:0002227) |
| 0.6 | 6.2 | GO:2000601 | positive regulation of Arp2/3 complex-mediated actin nucleation(GO:2000601) |
| 0.6 | 9.9 | GO:0000338 | protein deneddylation(GO:0000338) |
| 0.6 | 4.1 | GO:0010940 | positive regulation of necrotic cell death(GO:0010940) |
| 0.6 | 1.7 | GO:2000653 | regulation of genetic imprinting(GO:2000653) regulation of histone H3-K79 methylation(GO:2001160) positive regulation of histone H3-K79 methylation(GO:2001162) |
| 0.5 | 1.6 | GO:0060599 | lateral sprouting involved in mammary gland duct morphogenesis(GO:0060599) |
| 0.5 | 2.6 | GO:0008065 | establishment of blood-nerve barrier(GO:0008065) |
| 0.5 | 1.4 | GO:0016999 | antibiotic metabolic process(GO:0016999) cellular amide catabolic process(GO:0043605) |
| 0.5 | 4.7 | GO:0006268 | DNA unwinding involved in DNA replication(GO:0006268) |
| 0.5 | 7.0 | GO:0043517 | positive regulation of DNA damage response, signal transduction by p53 class mediator(GO:0043517) |
| 0.4 | 4.3 | GO:0070973 | protein localization to endoplasmic reticulum exit site(GO:0070973) |
| 0.4 | 1.3 | GO:0071051 | polyadenylation-dependent snoRNA 3'-end processing(GO:0071051) |
| 0.4 | 1.7 | GO:0043456 | regulation of pentose-phosphate shunt(GO:0043456) |
| 0.4 | 8.1 | GO:0060391 | positive regulation of SMAD protein import into nucleus(GO:0060391) |
| 0.4 | 2.7 | GO:0009597 | detection of virus(GO:0009597) |
| 0.4 | 3.0 | GO:0050859 | negative regulation of B cell receptor signaling pathway(GO:0050859) |
| 0.4 | 4.8 | GO:0045591 | positive regulation of regulatory T cell differentiation(GO:0045591) |
| 0.4 | 6.1 | GO:2000009 | negative regulation of protein localization to cell surface(GO:2000009) |
| 0.4 | 1.1 | GO:0090526 | regulation of gluconeogenesis involved in cellular glucose homeostasis(GO:0090526) |
| 0.4 | 6.7 | GO:0051292 | nuclear pore complex assembly(GO:0051292) |
| 0.3 | 4.8 | GO:0070389 | chaperone cofactor-dependent protein refolding(GO:0070389) |
| 0.3 | 1.9 | GO:2000158 | positive regulation of ubiquitin-specific protease activity(GO:2000158) |
| 0.3 | 3.2 | GO:0051660 | establishment of centrosome localization(GO:0051660) |
| 0.3 | 3.7 | GO:0015074 | DNA integration(GO:0015074) |
| 0.3 | 3.0 | GO:0097500 | receptor localization to nonmotile primary cilium(GO:0097500) |
| 0.3 | 8.9 | GO:0043555 | regulation of translation in response to stress(GO:0043555) |
| 0.3 | 2.8 | GO:0015886 | heme transport(GO:0015886) |
| 0.2 | 3.9 | GO:0034975 | protein folding in endoplasmic reticulum(GO:0034975) |
| 0.2 | 2.5 | GO:0048194 | Golgi vesicle budding(GO:0048194) |
| 0.2 | 1.6 | GO:0000012 | single strand break repair(GO:0000012) |
| 0.2 | 21.4 | GO:0006342 | chromatin silencing(GO:0006342) |
| 0.2 | 0.7 | GO:0044339 | canonical Wnt signaling pathway involved in osteoblast differentiation(GO:0044339) |
| 0.2 | 1.2 | GO:1900748 | positive regulation of vascular endothelial growth factor signaling pathway(GO:1900748) |
| 0.2 | 1.4 | GO:0090481 | pyrimidine nucleotide-sugar transmembrane transport(GO:0090481) |
| 0.2 | 8.6 | GO:0000083 | regulation of transcription involved in G1/S transition of mitotic cell cycle(GO:0000083) |
| 0.2 | 1.9 | GO:0001778 | plasma membrane repair(GO:0001778) |
| 0.2 | 2.7 | GO:0006995 | cellular response to nitrogen starvation(GO:0006995) cellular response to nitrogen levels(GO:0043562) |
| 0.2 | 3.1 | GO:0006744 | ubiquinone biosynthetic process(GO:0006744) quinone biosynthetic process(GO:1901663) |
| 0.2 | 1.1 | GO:0000414 | regulation of histone H3-K36 methylation(GO:0000414) |
| 0.2 | 10.7 | GO:0008156 | negative regulation of DNA replication(GO:0008156) |
| 0.2 | 0.6 | GO:0051919 | positive regulation of fibrinolysis(GO:0051919) |
| 0.1 | 11.0 | GO:0070125 | mitochondrial translational elongation(GO:0070125) mitochondrial translational termination(GO:0070126) |
| 0.1 | 3.7 | GO:0007216 | G-protein coupled glutamate receptor signaling pathway(GO:0007216) |
| 0.1 | 1.6 | GO:0051852 | disruption by host of symbiont cells(GO:0051852) killing by host of symbiont cells(GO:0051873) |
| 0.1 | 2.5 | GO:0007252 | I-kappaB phosphorylation(GO:0007252) |
| 0.1 | 2.9 | GO:0000185 | activation of MAPKKK activity(GO:0000185) |
| 0.1 | 10.2 | GO:0030049 | muscle filament sliding(GO:0030049) actin-myosin filament sliding(GO:0033275) |
| 0.1 | 2.5 | GO:0060122 | inner ear receptor stereocilium organization(GO:0060122) |
| 0.1 | 2.0 | GO:1904355 | positive regulation of telomere capping(GO:1904355) |
| 0.1 | 1.8 | GO:0046069 | cGMP catabolic process(GO:0046069) |
| 0.1 | 0.7 | GO:0006102 | isocitrate metabolic process(GO:0006102) |
| 0.1 | 0.2 | GO:0035712 | T-helper 2 cell activation(GO:0035712) regulation of T-helper 2 cell activation(GO:2000569) positive regulation of T-helper 2 cell activation(GO:2000570) |
| 0.1 | 5.1 | GO:0030318 | melanocyte differentiation(GO:0030318) |
| 0.1 | 2.9 | GO:0008608 | attachment of spindle microtubules to kinetochore(GO:0008608) |
| 0.1 | 0.7 | GO:0015824 | proline transport(GO:0015824) |
| 0.1 | 2.3 | GO:0045899 | positive regulation of RNA polymerase II transcriptional preinitiation complex assembly(GO:0045899) |
| 0.1 | 0.7 | GO:0031087 | deadenylation-independent decapping of nuclear-transcribed mRNA(GO:0031087) |
| 0.1 | 0.7 | GO:1902358 | sulfate transmembrane transport(GO:1902358) |
| 0.1 | 7.8 | GO:0006687 | glycosphingolipid metabolic process(GO:0006687) |
| 0.1 | 2.6 | GO:0048286 | lung alveolus development(GO:0048286) |
| 0.1 | 0.2 | GO:0060729 | intestinal epithelial structure maintenance(GO:0060729) |
| 0.1 | 1.1 | GO:0043651 | linoleic acid metabolic process(GO:0043651) |
| 0.1 | 1.6 | GO:1902751 | positive regulation of cell cycle G2/M phase transition(GO:1902751) |
| 0.1 | 4.7 | GO:0006369 | termination of RNA polymerase II transcription(GO:0006369) |
| 0.0 | 4.1 | GO:0031338 | regulation of vesicle fusion(GO:0031338) |
| 0.0 | 1.7 | GO:0000301 | retrograde transport, vesicle recycling within Golgi(GO:0000301) |
| 0.0 | 0.3 | GO:0002371 | dendritic cell cytokine production(GO:0002371) |
| 0.0 | 1.9 | GO:0032467 | positive regulation of cytokinesis(GO:0032467) |
| 0.0 | 9.7 | GO:0007018 | microtubule-based movement(GO:0007018) |
| 0.0 | 1.0 | GO:0010842 | retina layer formation(GO:0010842) |
| 0.0 | 4.4 | GO:0035335 | peptidyl-tyrosine dephosphorylation(GO:0035335) |
| 0.0 | 0.6 | GO:2000480 | negative regulation of cAMP-dependent protein kinase activity(GO:2000480) |
| 0.0 | 0.9 | GO:0015804 | neutral amino acid transport(GO:0015804) |
| 0.0 | 12.6 | GO:0006936 | muscle contraction(GO:0006936) |
| 0.0 | 0.7 | GO:0070584 | mitochondrion morphogenesis(GO:0070584) |
| 0.0 | 0.6 | GO:0042448 | progesterone metabolic process(GO:0042448) |
| 0.0 | 0.2 | GO:0043152 | induction of bacterial agglutination(GO:0043152) |
| 0.0 | 1.3 | GO:0007157 | heterophilic cell-cell adhesion via plasma membrane cell adhesion molecules(GO:0007157) |
| 0.0 | 1.2 | GO:0046579 | positive regulation of Ras protein signal transduction(GO:0046579) |
| 0.0 | 1.1 | GO:0032204 | regulation of telomere maintenance(GO:0032204) |
| 0.0 | 0.1 | GO:0009256 | 10-formyltetrahydrofolate metabolic process(GO:0009256) |
| 0.0 | 1.1 | GO:0001505 | regulation of neurotransmitter levels(GO:0001505) |
| 0.0 | 0.1 | GO:0035425 | autocrine signaling(GO:0035425) |
| 0.0 | 0.1 | GO:0048743 | positive regulation of skeletal muscle fiber development(GO:0048743) |
| 0.0 | 0.2 | GO:0007173 | epidermal growth factor receptor signaling pathway(GO:0007173) |
| 0.0 | 0.2 | GO:0006002 | fructose 6-phosphate metabolic process(GO:0006002) |
| 0.0 | 0.2 | GO:0009650 | UV protection(GO:0009650) |
| 0.0 | 2.1 | GO:0002576 | platelet degranulation(GO:0002576) |
| 0.0 | 3.8 | GO:0000398 | RNA splicing, via transesterification reactions with bulged adenosine as nucleophile(GO:0000377) mRNA splicing, via spliceosome(GO:0000398) |
| 0.0 | 2.9 | GO:0006364 | rRNA processing(GO:0006364) |
Gene overrepresentation in cellular_component category:
| Log-likelihood per target | Total log-likelihood | Term | Description |
|---|---|---|---|
| 2.2 | 13.0 | GO:0031232 | extrinsic component of external side of plasma membrane(GO:0031232) extrinsic component of endosome membrane(GO:0031313) |
| 1.7 | 6.7 | GO:0044611 | nuclear pore inner ring(GO:0044611) |
| 1.6 | 4.8 | GO:0002079 | inner acrosomal membrane(GO:0002079) |
| 1.5 | 4.4 | GO:0005715 | late recombination nodule(GO:0005715) |
| 1.3 | 3.9 | GO:1903349 | omegasome membrane(GO:1903349) |
| 1.2 | 9.5 | GO:0042382 | paraspeckles(GO:0042382) |
| 1.1 | 5.6 | GO:0031205 | endoplasmic reticulum Sec complex(GO:0031205) |
| 1.0 | 2.9 | GO:0033597 | mitotic checkpoint complex(GO:0033597) bub1-bub3 complex(GO:1990298) |
| 0.8 | 12.5 | GO:0030478 | actin cap(GO:0030478) |
| 0.6 | 1.9 | GO:0005826 | actomyosin contractile ring(GO:0005826) |
| 0.6 | 3.2 | GO:0042643 | actomyosin, actin portion(GO:0042643) |
| 0.6 | 39.9 | GO:0005881 | cytoplasmic microtubule(GO:0005881) |
| 0.6 | 11.0 | GO:0005862 | muscle thin filament tropomyosin(GO:0005862) |
| 0.6 | 6.3 | GO:0005614 | interstitial matrix(GO:0005614) |
| 0.6 | 6.2 | GO:0033018 | sarcoplasmic reticulum lumen(GO:0033018) |
| 0.6 | 31.4 | GO:0000786 | nucleosome(GO:0000786) |
| 0.5 | 3.5 | GO:0005854 | nascent polypeptide-associated complex(GO:0005854) |
| 0.5 | 9.8 | GO:0017101 | aminoacyl-tRNA synthetase multienzyme complex(GO:0017101) |
| 0.4 | 6.2 | GO:0031209 | SCAR complex(GO:0031209) |
| 0.4 | 9.9 | GO:0005852 | eukaryotic translation initiation factor 3 complex(GO:0005852) |
| 0.4 | 4.7 | GO:0042555 | MCM complex(GO:0042555) |
| 0.4 | 3.2 | GO:0032059 | bleb(GO:0032059) |
| 0.3 | 6.4 | GO:0031597 | cytosolic proteasome complex(GO:0031597) |
| 0.3 | 3.0 | GO:0034464 | BBSome(GO:0034464) |
| 0.3 | 1.2 | GO:0045160 | myosin I complex(GO:0045160) |
| 0.3 | 5.4 | GO:1990124 | messenger ribonucleoprotein complex(GO:1990124) |
| 0.3 | 8.1 | GO:0005685 | U1 snRNP(GO:0005685) |
| 0.2 | 2.6 | GO:0035686 | sperm fibrous sheath(GO:0035686) |
| 0.2 | 8.1 | GO:0000315 | organellar large ribosomal subunit(GO:0000315) mitochondrial large ribosomal subunit(GO:0005762) |
| 0.2 | 4.0 | GO:0097228 | sperm principal piece(GO:0097228) |
| 0.2 | 18.5 | GO:0035578 | azurophil granule lumen(GO:0035578) |
| 0.2 | 1.7 | GO:0016593 | Cdc73/Paf1 complex(GO:0016593) |
| 0.1 | 0.9 | GO:0044614 | nuclear pore cytoplasmic filaments(GO:0044614) |
| 0.1 | 0.9 | GO:0002177 | manchette(GO:0002177) |
| 0.1 | 2.1 | GO:0031092 | platelet alpha granule membrane(GO:0031092) |
| 0.1 | 16.0 | GO:0005913 | cell-cell adherens junction(GO:0005913) |
| 0.1 | 2.9 | GO:0000314 | organellar small ribosomal subunit(GO:0000314) mitochondrial small ribosomal subunit(GO:0005763) |
| 0.1 | 1.3 | GO:0000176 | nuclear exosome (RNase complex)(GO:0000176) |
| 0.1 | 0.5 | GO:0005927 | muscle tendon junction(GO:0005927) |
| 0.1 | 4.7 | GO:0008023 | transcription elongation factor complex(GO:0008023) |
| 0.1 | 2.4 | GO:0016580 | Sin3 complex(GO:0016580) |
| 0.1 | 0.2 | GO:0005945 | 6-phosphofructokinase complex(GO:0005945) |
| 0.1 | 31.1 | GO:0005788 | endoplasmic reticulum lumen(GO:0005788) |
| 0.1 | 1.2 | GO:0000164 | protein phosphatase type 1 complex(GO:0000164) |
| 0.1 | 2.7 | GO:0000421 | autophagosome membrane(GO:0000421) |
| 0.1 | 3.0 | GO:0002102 | podosome(GO:0002102) |
| 0.1 | 3.7 | GO:0045178 | basal part of cell(GO:0045178) |
| 0.1 | 1.4 | GO:0031528 | microvillus membrane(GO:0031528) |
| 0.1 | 2.6 | GO:0030131 | clathrin adaptor complex(GO:0030131) |
| 0.1 | 3.1 | GO:0045271 | mitochondrial respiratory chain complex I(GO:0005747) NADH dehydrogenase complex(GO:0030964) respiratory chain complex I(GO:0045271) |
| 0.1 | 3.7 | GO:0035577 | azurophil granule membrane(GO:0035577) |
| 0.1 | 9.5 | GO:0030496 | midbody(GO:0030496) |
| 0.0 | 1.8 | GO:0005581 | collagen trimer(GO:0005581) |
| 0.0 | 2.5 | GO:0032588 | trans-Golgi network membrane(GO:0032588) |
| 0.0 | 4.3 | GO:0001650 | fibrillar center(GO:0001650) |
| 0.0 | 0.6 | GO:0032982 | myosin filament(GO:0032982) |
| 0.0 | 2.2 | GO:0000922 | spindle pole(GO:0000922) |
| 0.0 | 5.0 | GO:0005769 | early endosome(GO:0005769) |
| 0.0 | 2.5 | GO:0000793 | condensed chromosome(GO:0000793) |
| 0.0 | 0.2 | GO:0042589 | zymogen granule membrane(GO:0042589) |
| 0.0 | 1.3 | GO:0005819 | spindle(GO:0005819) |
| 0.0 | 1.4 | GO:0005840 | ribosome(GO:0005840) |
| 0.0 | 9.9 | GO:0005789 | endoplasmic reticulum membrane(GO:0005789) |
| 0.0 | 2.5 | GO:0010008 | endosome membrane(GO:0010008) |
Gene overrepresentation in molecular_function category:
| Log-likelihood per target | Total log-likelihood | Term | Description |
|---|---|---|---|
| 2.4 | 7.3 | GO:0035539 | 8-oxo-7,8-dihydroguanosine triphosphate pyrophosphatase activity(GO:0008413) NADH pyrophosphatase activity(GO:0035529) 8-oxo-7,8-dihydrodeoxyguanosine triphosphate pyrophosphatase activity(GO:0035539) |
| 2.2 | 13.0 | GO:0019834 | phospholipase A2 inhibitor activity(GO:0019834) |
| 1.6 | 7.9 | GO:0008479 | queuine tRNA-ribosyltransferase activity(GO:0008479) |
| 1.5 | 6.0 | GO:0051996 | farnesyl-diphosphate farnesyltransferase activity(GO:0004310) squalene synthase activity(GO:0051996) |
| 1.2 | 3.7 | GO:0004781 | adenylylsulfate kinase activity(GO:0004020) sulfate adenylyltransferase activity(GO:0004779) sulfate adenylyltransferase (ATP) activity(GO:0004781) |
| 1.2 | 7.3 | GO:0061649 | ubiquitinated histone binding(GO:0061649) |
| 1.2 | 8.1 | GO:0035614 | snRNA stem-loop binding(GO:0035614) |
| 1.1 | 4.4 | GO:0004727 | prenylated protein tyrosine phosphatase activity(GO:0004727) |
| 1.0 | 9.9 | GO:0019784 | NEDD8-specific protease activity(GO:0019784) |
| 0.9 | 2.7 | GO:0004819 | glutamine-tRNA ligase activity(GO:0004819) |
| 0.8 | 2.5 | GO:0036435 | K48-linked polyubiquitin binding(GO:0036435) |
| 0.8 | 5.8 | GO:0048408 | epidermal growth factor binding(GO:0048408) |
| 0.8 | 7.8 | GO:0019237 | centromeric DNA binding(GO:0019237) |
| 0.8 | 14.6 | GO:0044548 | S100 protein binding(GO:0044548) |
| 0.7 | 4.4 | GO:0032137 | guanine/thymine mispair binding(GO:0032137) |
| 0.7 | 2.9 | GO:0070259 | tyrosyl-DNA phosphodiesterase activity(GO:0070259) |
| 0.7 | 15.5 | GO:0008242 | omega peptidase activity(GO:0008242) |
| 0.7 | 7.2 | GO:0001135 | transcription factor activity, RNA polymerase II transcription factor recruiting(GO:0001135) |
| 0.5 | 4.2 | GO:0043559 | insulin binding(GO:0043559) |
| 0.4 | 1.7 | GO:0008431 | vitamin E binding(GO:0008431) |
| 0.4 | 1.7 | GO:0004082 | bisphosphoglycerate mutase activity(GO:0004082) phosphoglycerate mutase activity(GO:0004619) 2,3-bisphosphoglycerate-dependent phosphoglycerate mutase activity(GO:0046538) |
| 0.4 | 11.1 | GO:0005523 | tropomyosin binding(GO:0005523) |
| 0.4 | 1.1 | GO:0042799 | histone methyltransferase activity (H4-K20 specific)(GO:0042799) |
| 0.4 | 5.3 | GO:0008140 | cAMP response element binding protein binding(GO:0008140) |
| 0.3 | 5.9 | GO:0008494 | translation activator activity(GO:0008494) |
| 0.3 | 1.9 | GO:0035800 | deubiquitinase activator activity(GO:0035800) |
| 0.3 | 2.8 | GO:0015232 | heme transporter activity(GO:0015232) |
| 0.3 | 10.2 | GO:0043027 | cysteine-type endopeptidase inhibitor activity involved in apoptotic process(GO:0043027) |
| 0.3 | 1.6 | GO:0004882 | androgen receptor activity(GO:0004882) |
| 0.2 | 3.7 | GO:0035256 | G-protein coupled glutamate receptor binding(GO:0035256) |
| 0.2 | 12.3 | GO:0019894 | kinesin binding(GO:0019894) |
| 0.2 | 6.7 | GO:0017056 | structural constituent of nuclear pore(GO:0017056) |
| 0.2 | 2.7 | GO:0015194 | L-serine transmembrane transporter activity(GO:0015194) serine transmembrane transporter activity(GO:0022889) |
| 0.2 | 6.2 | GO:0030296 | protein tyrosine kinase activator activity(GO:0030296) |
| 0.2 | 27.3 | GO:0051219 | phosphoprotein binding(GO:0051219) |
| 0.2 | 2.3 | GO:0036402 | proteasome-activating ATPase activity(GO:0036402) |
| 0.2 | 0.7 | GO:0004449 | isocitrate dehydrogenase (NAD+) activity(GO:0004449) |
| 0.2 | 2.5 | GO:0004065 | arylsulfatase activity(GO:0004065) |
| 0.2 | 1.4 | GO:0015165 | pyrimidine nucleotide-sugar transmembrane transporter activity(GO:0015165) |
| 0.2 | 2.9 | GO:0019206 | nucleoside kinase activity(GO:0019206) |
| 0.2 | 2.9 | GO:0008349 | MAP kinase kinase kinase kinase activity(GO:0008349) |
| 0.2 | 2.6 | GO:0043295 | glutathione binding(GO:0043295) |
| 0.1 | 4.8 | GO:0001671 | ATPase activator activity(GO:0001671) |
| 0.1 | 1.0 | GO:0048101 | calcium- and calmodulin-regulated 3',5'-cyclic-GMP phosphodiesterase activity(GO:0048101) |
| 0.1 | 0.8 | GO:0004118 | cGMP-stimulated cyclic-nucleotide phosphodiesterase activity(GO:0004118) |
| 0.1 | 2.5 | GO:0070273 | phosphatidylinositol-4-phosphate binding(GO:0070273) |
| 0.1 | 1.1 | GO:0004969 | histamine receptor activity(GO:0004969) |
| 0.1 | 4.7 | GO:0004003 | ATP-dependent DNA helicase activity(GO:0004003) |
| 0.1 | 3.8 | GO:0000146 | microfilament motor activity(GO:0000146) |
| 0.1 | 3.9 | GO:0004364 | glutathione transferase activity(GO:0004364) |
| 0.1 | 4.7 | GO:0008094 | DNA-dependent ATPase activity(GO:0008094) |
| 0.1 | 0.7 | GO:0008271 | secondary active sulfate transmembrane transporter activity(GO:0008271) |
| 0.1 | 8.5 | GO:0008307 | structural constituent of muscle(GO:0008307) |
| 0.1 | 0.4 | GO:0052740 | 1-acyl-2-lysophosphatidylserine acylhydrolase activity(GO:0052740) |
| 0.1 | 9.5 | GO:0000980 | RNA polymerase II distal enhancer sequence-specific DNA binding(GO:0000980) |
| 0.1 | 3.1 | GO:0005109 | frizzled binding(GO:0005109) |
| 0.1 | 1.6 | GO:0005537 | mannose binding(GO:0005537) |
| 0.1 | 0.9 | GO:0019534 | toxin transporter activity(GO:0019534) |
| 0.1 | 1.0 | GO:0042813 | Wnt-activated receptor activity(GO:0042813) |
| 0.1 | 0.2 | GO:0016262 | protein N-acetylglucosaminyltransferase activity(GO:0016262) |
| 0.1 | 1.6 | GO:0004697 | protein kinase C activity(GO:0004697) |
| 0.1 | 0.2 | GO:0015199 | amino-acid betaine transmembrane transporter activity(GO:0015199) carnitine transmembrane transporter activity(GO:0015226) |
| 0.1 | 1.7 | GO:0000993 | RNA polymerase II core binding(GO:0000993) |
| 0.1 | 3.1 | GO:0050136 | NADH dehydrogenase (ubiquinone) activity(GO:0008137) NADH dehydrogenase (quinone) activity(GO:0050136) |
| 0.1 | 2.9 | GO:0030374 | ligand-dependent nuclear receptor transcription coactivator activity(GO:0030374) |
| 0.1 | 3.2 | GO:0043621 | protein self-association(GO:0043621) |
| 0.1 | 4.8 | GO:0001618 | virus receptor activity(GO:0001618) |
| 0.0 | 2.7 | GO:0005044 | scavenger receptor activity(GO:0005044) |
| 0.0 | 1.9 | GO:0050699 | WW domain binding(GO:0050699) |
| 0.0 | 1.2 | GO:0008157 | protein phosphatase 1 binding(GO:0008157) |
| 0.0 | 0.9 | GO:0019789 | SUMO transferase activity(GO:0019789) |
| 0.0 | 5.6 | GO:0047485 | protein N-terminus binding(GO:0047485) |
| 0.0 | 3.7 | GO:0008013 | beta-catenin binding(GO:0008013) |
| 0.0 | 0.2 | GO:0070095 | fructose-6-phosphate binding(GO:0070095) |
| 0.0 | 0.1 | GO:0004477 | methenyltetrahydrofolate cyclohydrolase activity(GO:0004477) methylenetetrahydrofolate dehydrogenase (NAD+) activity(GO:0004487) methylenetetrahydrofolate dehydrogenase (NADP+) activity(GO:0004488) |
| 0.0 | 0.7 | GO:0005328 | neurotransmitter:sodium symporter activity(GO:0005328) |
| 0.0 | 1.2 | GO:0051539 | 4 iron, 4 sulfur cluster binding(GO:0051539) |
| 0.0 | 5.6 | GO:0008201 | heparin binding(GO:0008201) |
| 0.0 | 6.3 | GO:0003735 | structural constituent of ribosome(GO:0003735) |
| 0.0 | 0.6 | GO:0004862 | cAMP-dependent protein kinase inhibitor activity(GO:0004862) |
| 0.0 | 12.3 | GO:0046982 | protein heterodimerization activity(GO:0046982) |
| 0.0 | 0.2 | GO:0047115 | phenanthrene 9,10-monooxygenase activity(GO:0018636) ketosteroid monooxygenase activity(GO:0047086) trans-1,2-dihydrobenzene-1,2-diol dehydrogenase activity(GO:0047115) |
| 0.0 | 2.3 | GO:0043130 | ubiquitin binding(GO:0043130) |
| 0.0 | 0.3 | GO:0009931 | calcium-dependent protein serine/threonine kinase activity(GO:0009931) |
| 0.0 | 9.1 | GO:0003712 | transcription cofactor activity(GO:0003712) |
| 0.0 | 0.2 | GO:0033038 | bitter taste receptor activity(GO:0033038) |
| 0.0 | 2.7 | GO:0061630 | ubiquitin protein ligase activity(GO:0061630) ubiquitin-like protein ligase activity(GO:0061659) |
| 0.0 | 2.4 | GO:0051015 | actin filament binding(GO:0051015) |
| 0.0 | 0.8 | GO:0070888 | E-box binding(GO:0070888) |
| 0.0 | 13.0 | GO:0032403 | protein complex binding(GO:0032403) |
| 0.0 | 4.1 | GO:0005096 | GTPase activator activity(GO:0005096) |
Gene overrepresentation in C2:CP category:
| Log-likelihood per target | Total log-likelihood | Term | Description |
|---|---|---|---|
| 0.4 | 9.5 | PID CIRCADIAN PATHWAY | Circadian rhythm pathway |
| 0.2 | 9.9 | PID HIF1A PATHWAY | Hypoxic and oxygen homeostasis regulation of HIF-1-alpha |
| 0.2 | 8.8 | SA B CELL RECEPTOR COMPLEXES | Antigen binding to B cell receptors activates protein tyrosine kinases, such as the Src family, which ultimate activate MAP kinases. |
| 0.1 | 4.4 | PID PRL SIGNALING EVENTS PATHWAY | Signaling events mediated by PRL |
| 0.1 | 6.3 | PID ATR PATHWAY | ATR signaling pathway |
| 0.1 | 4.9 | PID TCR CALCIUM PATHWAY | Calcium signaling in the CD4+ TCR pathway |
| 0.1 | 5.6 | PID AURORA B PATHWAY | Aurora B signaling |
| 0.1 | 4.6 | PID ATF2 PATHWAY | ATF-2 transcription factor network |
| 0.1 | 14.6 | NABA ECM AFFILIATED | Genes encoding proteins affiliated structurally or functionally to extracellular matrix proteins |
| 0.1 | 6.2 | PID RAC1 PATHWAY | RAC1 signaling pathway |
| 0.1 | 0.9 | PID RANBP2 PATHWAY | Sumoylation by RanBP2 regulates transcriptional repression |
| 0.1 | 8.6 | PID E2F PATHWAY | E2F transcription factor network |
| 0.1 | 5.1 | PID P38 ALPHA BETA DOWNSTREAM PATHWAY | Signaling mediated by p38-alpha and p38-beta |
| 0.1 | 7.2 | PID IL4 2PATHWAY | IL4-mediated signaling events |
| 0.1 | 1.9 | SIG REGULATION OF THE ACTIN CYTOSKELETON BY RHO GTPASES | Genes related to regulation of the actin cytoskeleton |
| 0.1 | 1.6 | PID AR NONGENOMIC PATHWAY | Nongenotropic Androgen signaling |
| 0.0 | 1.6 | PID RHOA PATHWAY | RhoA signaling pathway |
| 0.0 | 2.9 | PID TNF PATHWAY | TNF receptor signaling pathway |
| 0.0 | 15.7 | NABA SECRETED FACTORS | Genes encoding secreted soluble factors |
| 0.0 | 4.9 | PID P53 DOWNSTREAM PATHWAY | Direct p53 effectors |
Gene overrepresentation in C2:CP:REACTOME category:
| Log-likelihood per target | Total log-likelihood | Term | Description |
|---|---|---|---|
| 0.4 | 3.7 | REACTOME APOBEC3G MEDIATED RESISTANCE TO HIV1 INFECTION | Genes involved in APOBEC3G mediated resistance to HIV-1 infection |
| 0.4 | 23.5 | REACTOME SMOOTH MUSCLE CONTRACTION | Genes involved in Smooth Muscle Contraction |
| 0.3 | 20.2 | REACTOME COLLAGEN FORMATION | Genes involved in Collagen formation |
| 0.3 | 7.8 | REACTOME KINESINS | Genes involved in Kinesins |
| 0.3 | 4.7 | REACTOME UNWINDING OF DNA | Genes involved in Unwinding of DNA |
| 0.3 | 9.8 | REACTOME CYTOSOLIC TRNA AMINOACYLATION | Genes involved in Cytosolic tRNA aminoacylation |
| 0.2 | 12.0 | REACTOME PACKAGING OF TELOMERE ENDS | Genes involved in Packaging Of Telomere Ends |
| 0.2 | 8.8 | REACTOME CREB PHOSPHORYLATION THROUGH THE ACTIVATION OF RAS | Genes involved in CREB phosphorylation through the activation of Ras |
| 0.2 | 2.5 | REACTOME THE ACTIVATION OF ARYLSULFATASES | Genes involved in The activation of arylsulfatases |
| 0.2 | 5.7 | REACTOME REGULATION OF COMPLEMENT CASCADE | Genes involved in Regulation of Complement cascade |
| 0.2 | 6.0 | REACTOME CHOLESTEROL BIOSYNTHESIS | Genes involved in Cholesterol biosynthesis |
| 0.2 | 2.6 | REACTOME NEF MEDIATED DOWNREGULATION OF MHC CLASS I COMPLEX CELL SURFACE EXPRESSION | Genes involved in Nef mediated downregulation of MHC class I complex cell surface expression |
| 0.2 | 6.6 | REACTOME NEP NS2 INTERACTS WITH THE CELLULAR EXPORT MACHINERY | Genes involved in NEP/NS2 Interacts with the Cellular Export Machinery |
| 0.2 | 5.9 | REACTOME DEADENYLATION OF MRNA | Genes involved in Deadenylation of mRNA |
| 0.1 | 1.6 | REACTOME CREATION OF C4 AND C2 ACTIVATORS | Genes involved in Creation of C4 and C2 activators |
| 0.1 | 0.3 | REACTOME POST NMDA RECEPTOR ACTIVATION EVENTS | Genes involved in Post NMDA receptor activation events |
| 0.1 | 1.3 | REACTOME MRNA DECAY BY 3 TO 5 EXORIBONUCLEASE | Genes involved in mRNA Decay by 3' to 5' Exoribonuclease |
| 0.1 | 3.7 | REACTOME CYTOSOLIC SULFONATION OF SMALL MOLECULES | Genes involved in Cytosolic sulfonation of small molecules |
| 0.1 | 2.5 | REACTOME TRAF3 DEPENDENT IRF ACTIVATION PATHWAY | Genes involved in TRAF3-dependent IRF activation pathway |
| 0.1 | 2.9 | REACTOME PURINE SALVAGE | Genes involved in Purine salvage |
| 0.1 | 2.9 | REACTOME INHIBITION OF THE PROTEOLYTIC ACTIVITY OF APC C REQUIRED FOR THE ONSET OF ANAPHASE BY MITOTIC SPINDLE CHECKPOINT COMPONENTS | Genes involved in Inhibition of the proteolytic activity of APC/C required for the onset of anaphase by mitotic spindle checkpoint components |
| 0.1 | 2.0 | REACTOME TRAF6 MEDIATED IRF7 ACTIVATION | Genes involved in TRAF6 mediated IRF7 activation |
| 0.1 | 8.0 | REACTOME ER PHAGOSOME PATHWAY | Genes involved in ER-Phagosome pathway |
| 0.1 | 1.6 | REACTOME G2 M DNA DAMAGE CHECKPOINT | Genes involved in G2/M DNA damage checkpoint |
| 0.1 | 1.6 | REACTOME DOUBLE STRAND BREAK REPAIR | Genes involved in Double-Strand Break Repair |
| 0.1 | 3.4 | REACTOME MEIOTIC RECOMBINATION | Genes involved in Meiotic Recombination |
| 0.1 | 12.8 | REACTOME PEPTIDE LIGAND BINDING RECEPTORS | Genes involved in Peptide ligand-binding receptors |
| 0.1 | 9.4 | REACTOME RESPONSE TO ELEVATED PLATELET CYTOSOLIC CA2 | Genes involved in Response to elevated platelet cytosolic Ca2+ |
| 0.0 | 0.6 | REACTOME INTRINSIC PATHWAY | Genes involved in Intrinsic Pathway |
| 0.0 | 1.8 | REACTOME CGMP EFFECTS | Genes involved in cGMP effects |
| 0.0 | 1.7 | REACTOME SIGNALING BY FGFR1 FUSION MUTANTS | Genes involved in Signaling by FGFR1 fusion mutants |
| 0.0 | 1.5 | REACTOME AMINO ACID TRANSPORT ACROSS THE PLASMA MEMBRANE | Genes involved in Amino acid transport across the plasma membrane |
| 0.0 | 0.7 | REACTOME CITRIC ACID CYCLE TCA CYCLE | Genes involved in Citric acid cycle (TCA cycle) |
| 0.0 | 3.1 | REACTOME RESPIRATORY ELECTRON TRANSPORT | Genes involved in Respiratory electron transport |
| 0.0 | 1.4 | REACTOME TRANSPORT OF VITAMINS NUCLEOSIDES AND RELATED MOLECULES | Genes involved in Transport of vitamins, nucleosides, and related molecules |
| 0.0 | 2.8 | REACTOME PPARA ACTIVATES GENE EXPRESSION | Genes involved in PPARA Activates Gene Expression |
| 0.0 | 0.4 | REACTOME ASSOCIATION OF TRIC CCT WITH TARGET PROTEINS DURING BIOSYNTHESIS | Genes involved in Association of TriC/CCT with target proteins during biosynthesis |